5.1. Dataset and Experimental Setup
To evaluate the critical link discovery method proposed in this paper, we tested it on two multi-layer networks: a “typical business network” (labeled Business) and a “typical campus network” (labeled Campus) [
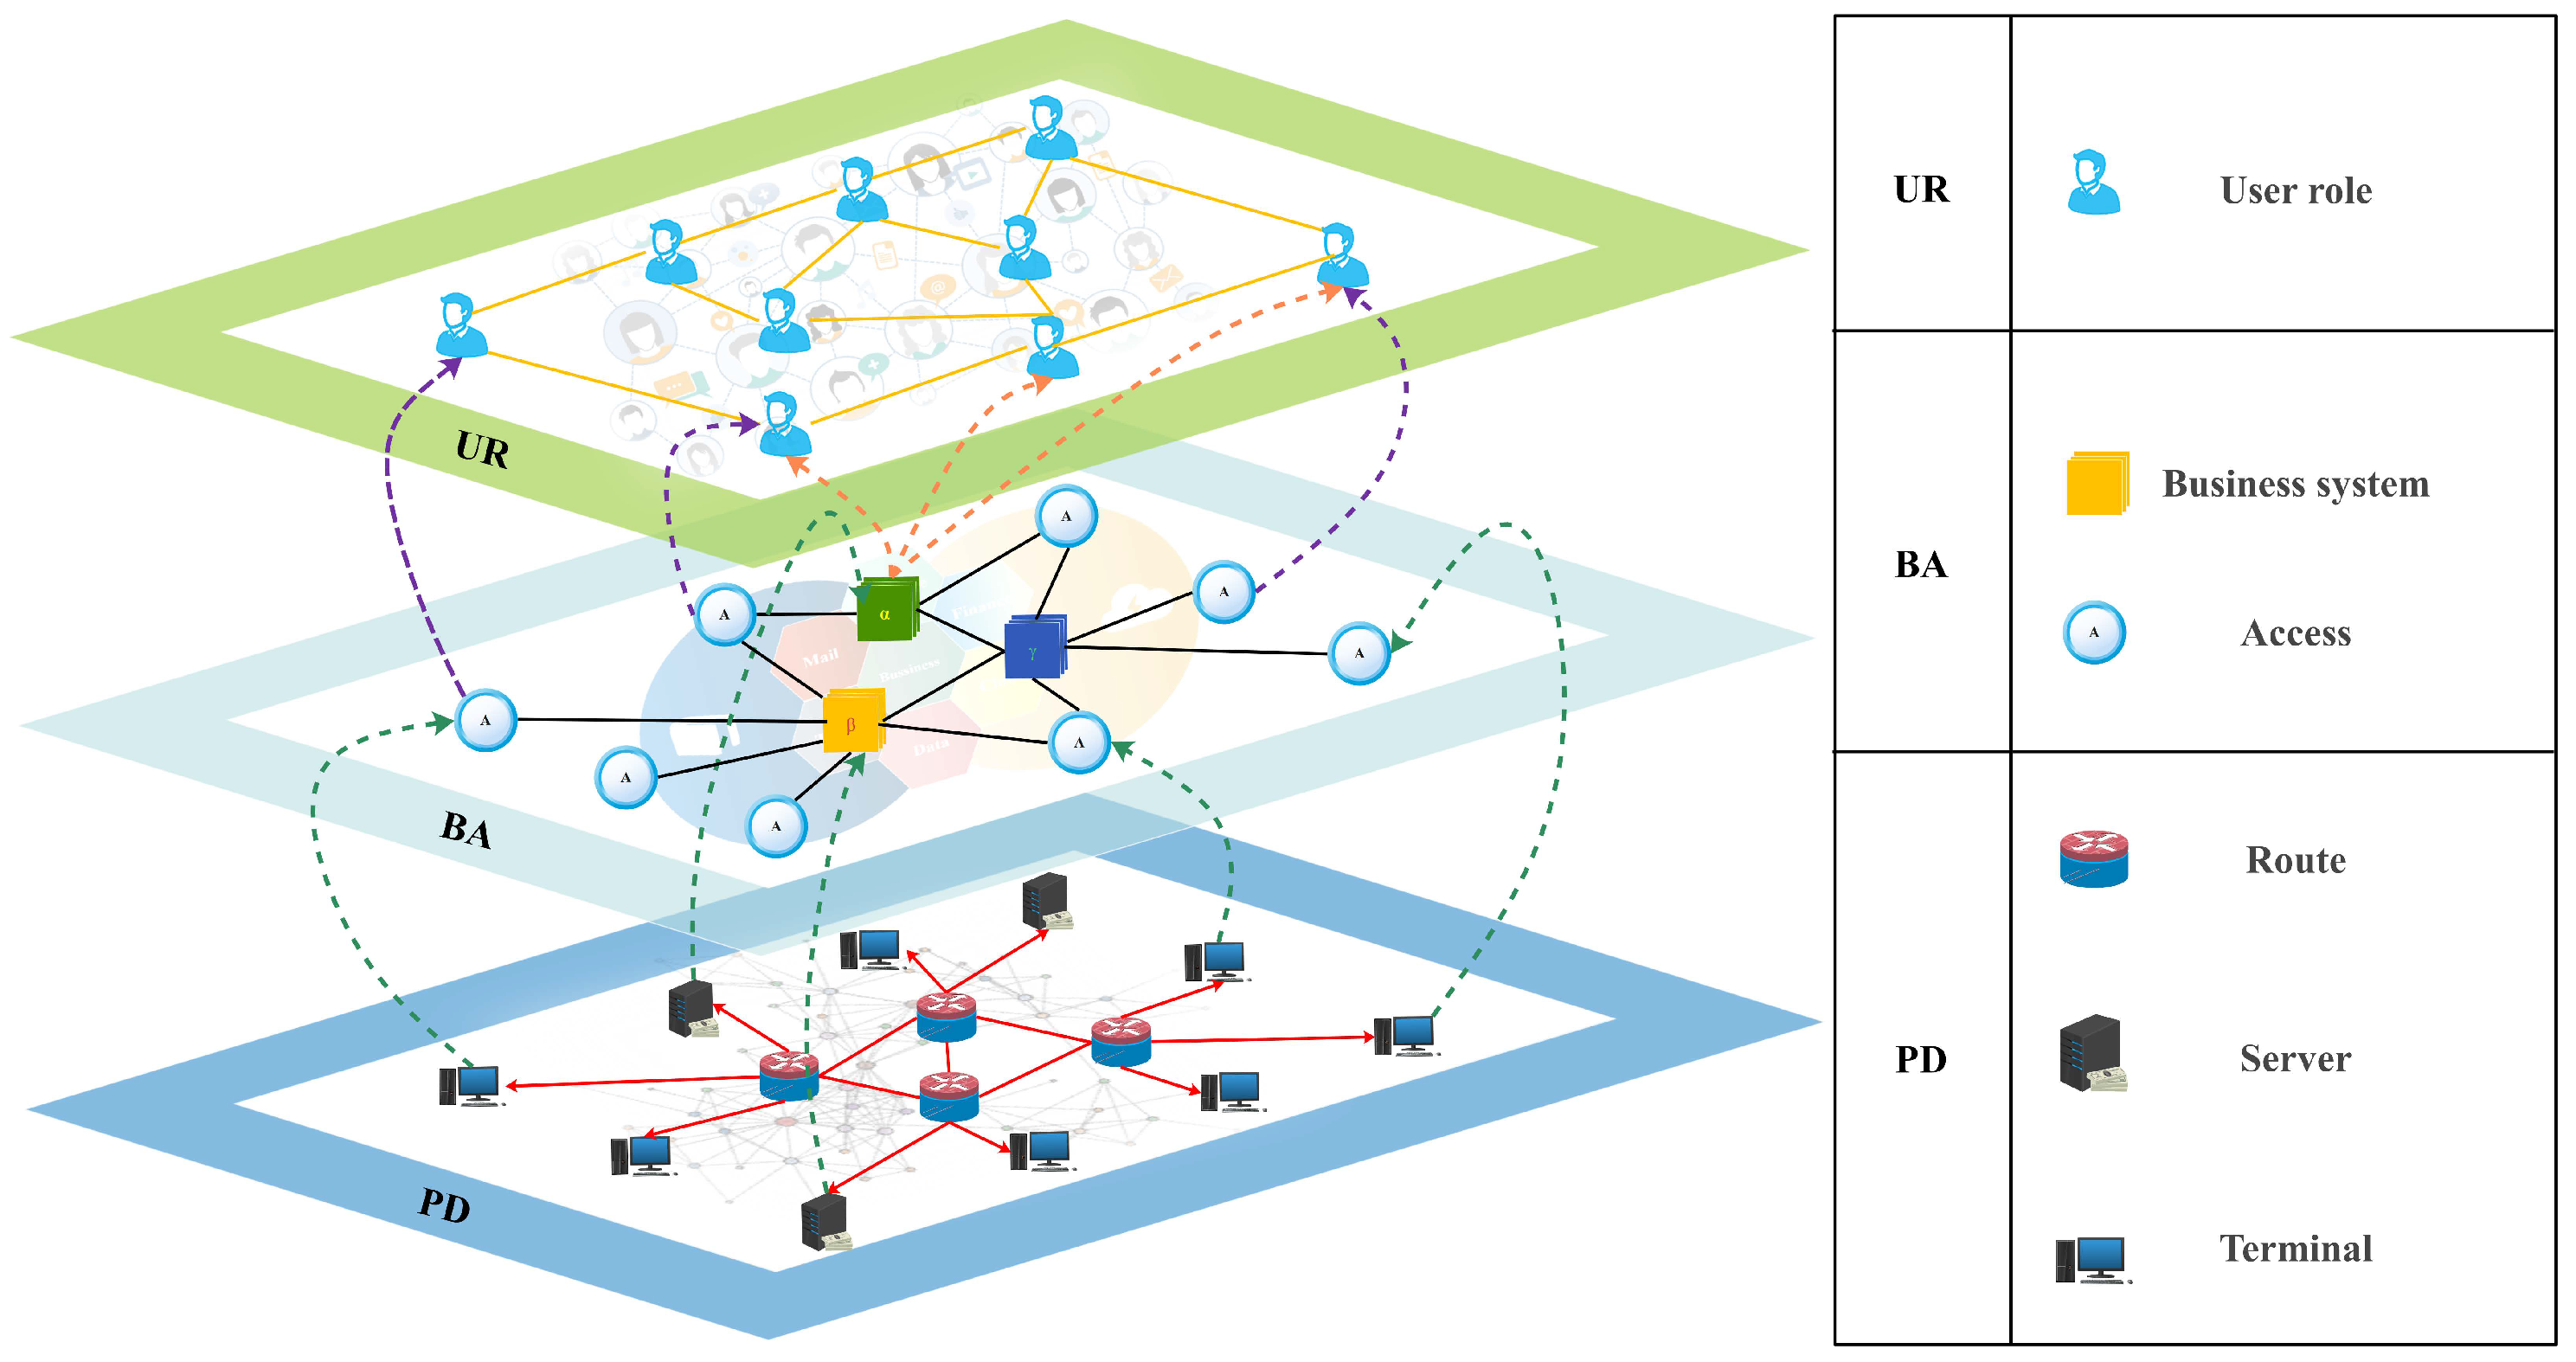
33]. Both networks have three-layer architectures: a physical device layer, a business application layer, and a user role layer. The datasets were created using the heuristic algorithm from the work [
9], which establishes a “one-to-one” dependency between the physical device layer and the business application layer based on the area routing topology data. This means that if a server node fails, its corresponding business system node also fails. If an access node fails, its corresponding user terminal also fails. There are also multi-layer dependencies between the business application layer and the user role layer, and “many-to-many” dependencies between them. This means that after the failure of a business system node or an access node, the corresponding user nodes will immediately fail.
To further validate the effectiveness of the approach, in addition to the critical link discovery metric MDLE, five existing link importance metrics, i.e., the link degree centrality (LDC), link betweenness centrality (LBC), link k-shell index (LKS), Jaccard index (Jaccard), and topology overlap index (TO), will be used as an experimental control group in the experiments in this section.
Similar to the idea of node importance assessments, in the multi-layer network topology model for network security situational awareness, starting from the idea of the MDLE, the importance of the links in the upper two layers of the three-layer network, as well as the importance of inter-layer links, will be summarized in the physical device layer, which will become the basis for judging the importance of various types of links in the physical device layer. These important links in the physical device layer will play a critical role in supporting the structure of the entire network topology. Therefore, when using various types of non-neighborhood-centric metrics (LBC, LKS) to generate link importance ranking sequences, we still set the evaluation scope at the physical device layer to ensure the consistency of the evaluation level.
Next, the experimental part will comprehensively analyze the MDLE from three perspectives: monotonicity rankings, metric correlations, and network destruction effects.
5.2. Link Importance Metric Ranking Monotonicity
Ranked monotonicity [
34] is an important metric for performance evaluations of critical link discovery methods; a higher ranked monotonicity implies a smaller size of the set of medium volume scores for link output sequences, a weaker ambiguity in importance decision making, and a finer granularity of importance evaluations.
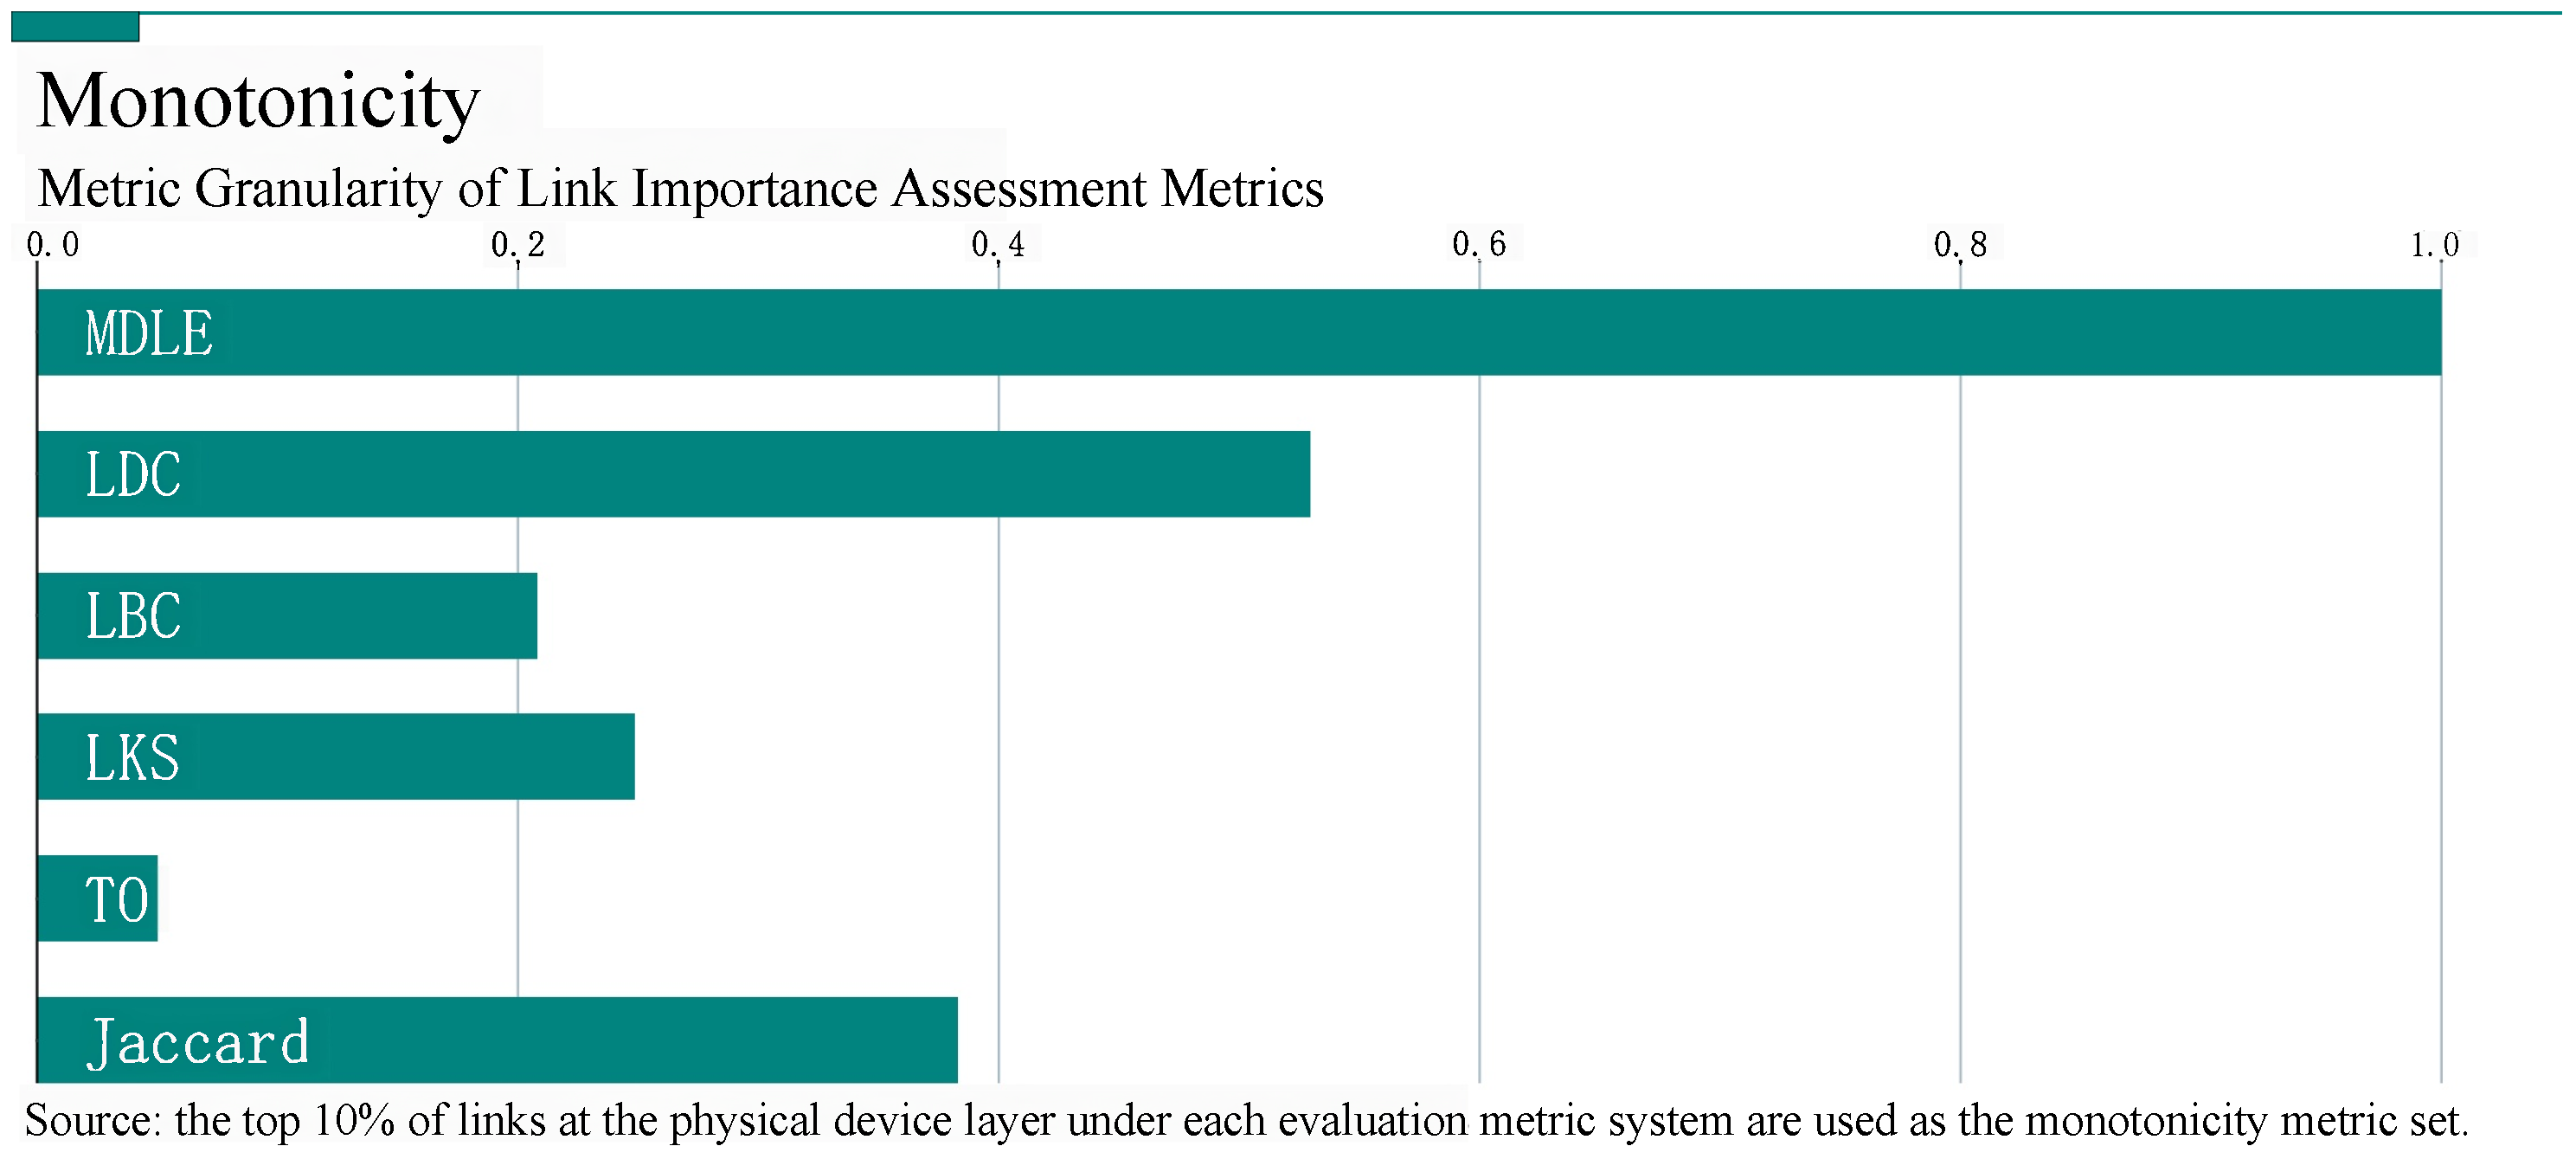
Definition 15 In Equation (13), the set of to-be-evaluated monotonicity links is selected using sampling, and p represents the proportion of the subset of to-be-evaluated links selected from the network links to the total number of links, R is the set that divides the to-be-evaluated links into sets conditioned on the condition that they have the same scores, is the size of the set of to-be-evaluated links, and is the number of links in the to-be-evaluated link sets that have the same scores. The score of the respective groups of links with the same scores is r. In this section, the experiment is based on the network topology of the dataset “Business” network. We choose the top ten percent of the links in the physical layer of the network layer in the rankings of the MDLE and the other five metrics (LDC, LBC, LKS, Jaccard, and TO) as the set of links to be evaluated. The monotonicity of the metrics is shown in
Figure 6.
The experimental results show that compared with the other five metrics, the monotonicity of MDLE can be maintained at 1.0, while the monotonicity of the rest of the metric rankings is less than desirable, which is because the structural homogeneity of links is more obvious than that of nodes considering the scale and the network characteristics. The MDLE not only takes into account the degree of influence of the links in the homogeneous range, but also combines the dependent mechanism with the synthesis of the links in the multi-layer networks. Importance information makes the source of evaluation information more diversified and solves the problem of the low decision-making accuracy in existing link importance metrics.
5.3. Link Importance Metric Correlation Analysis
To further analyze the correlation between the MDLE and the existing link importance metrics in terms of ranking, the Pearson product-moment correlation coefficient (labeled PPMCC) [
35] is used here to calculate the correlation between the metrics used in this section (MDLE, LDC, LBC, LKS, Jaccard, TO). The Pearson correlation coefficient is defined as follows.
Definition 16 (Pearson Product-Moment Correlation Coefficient).
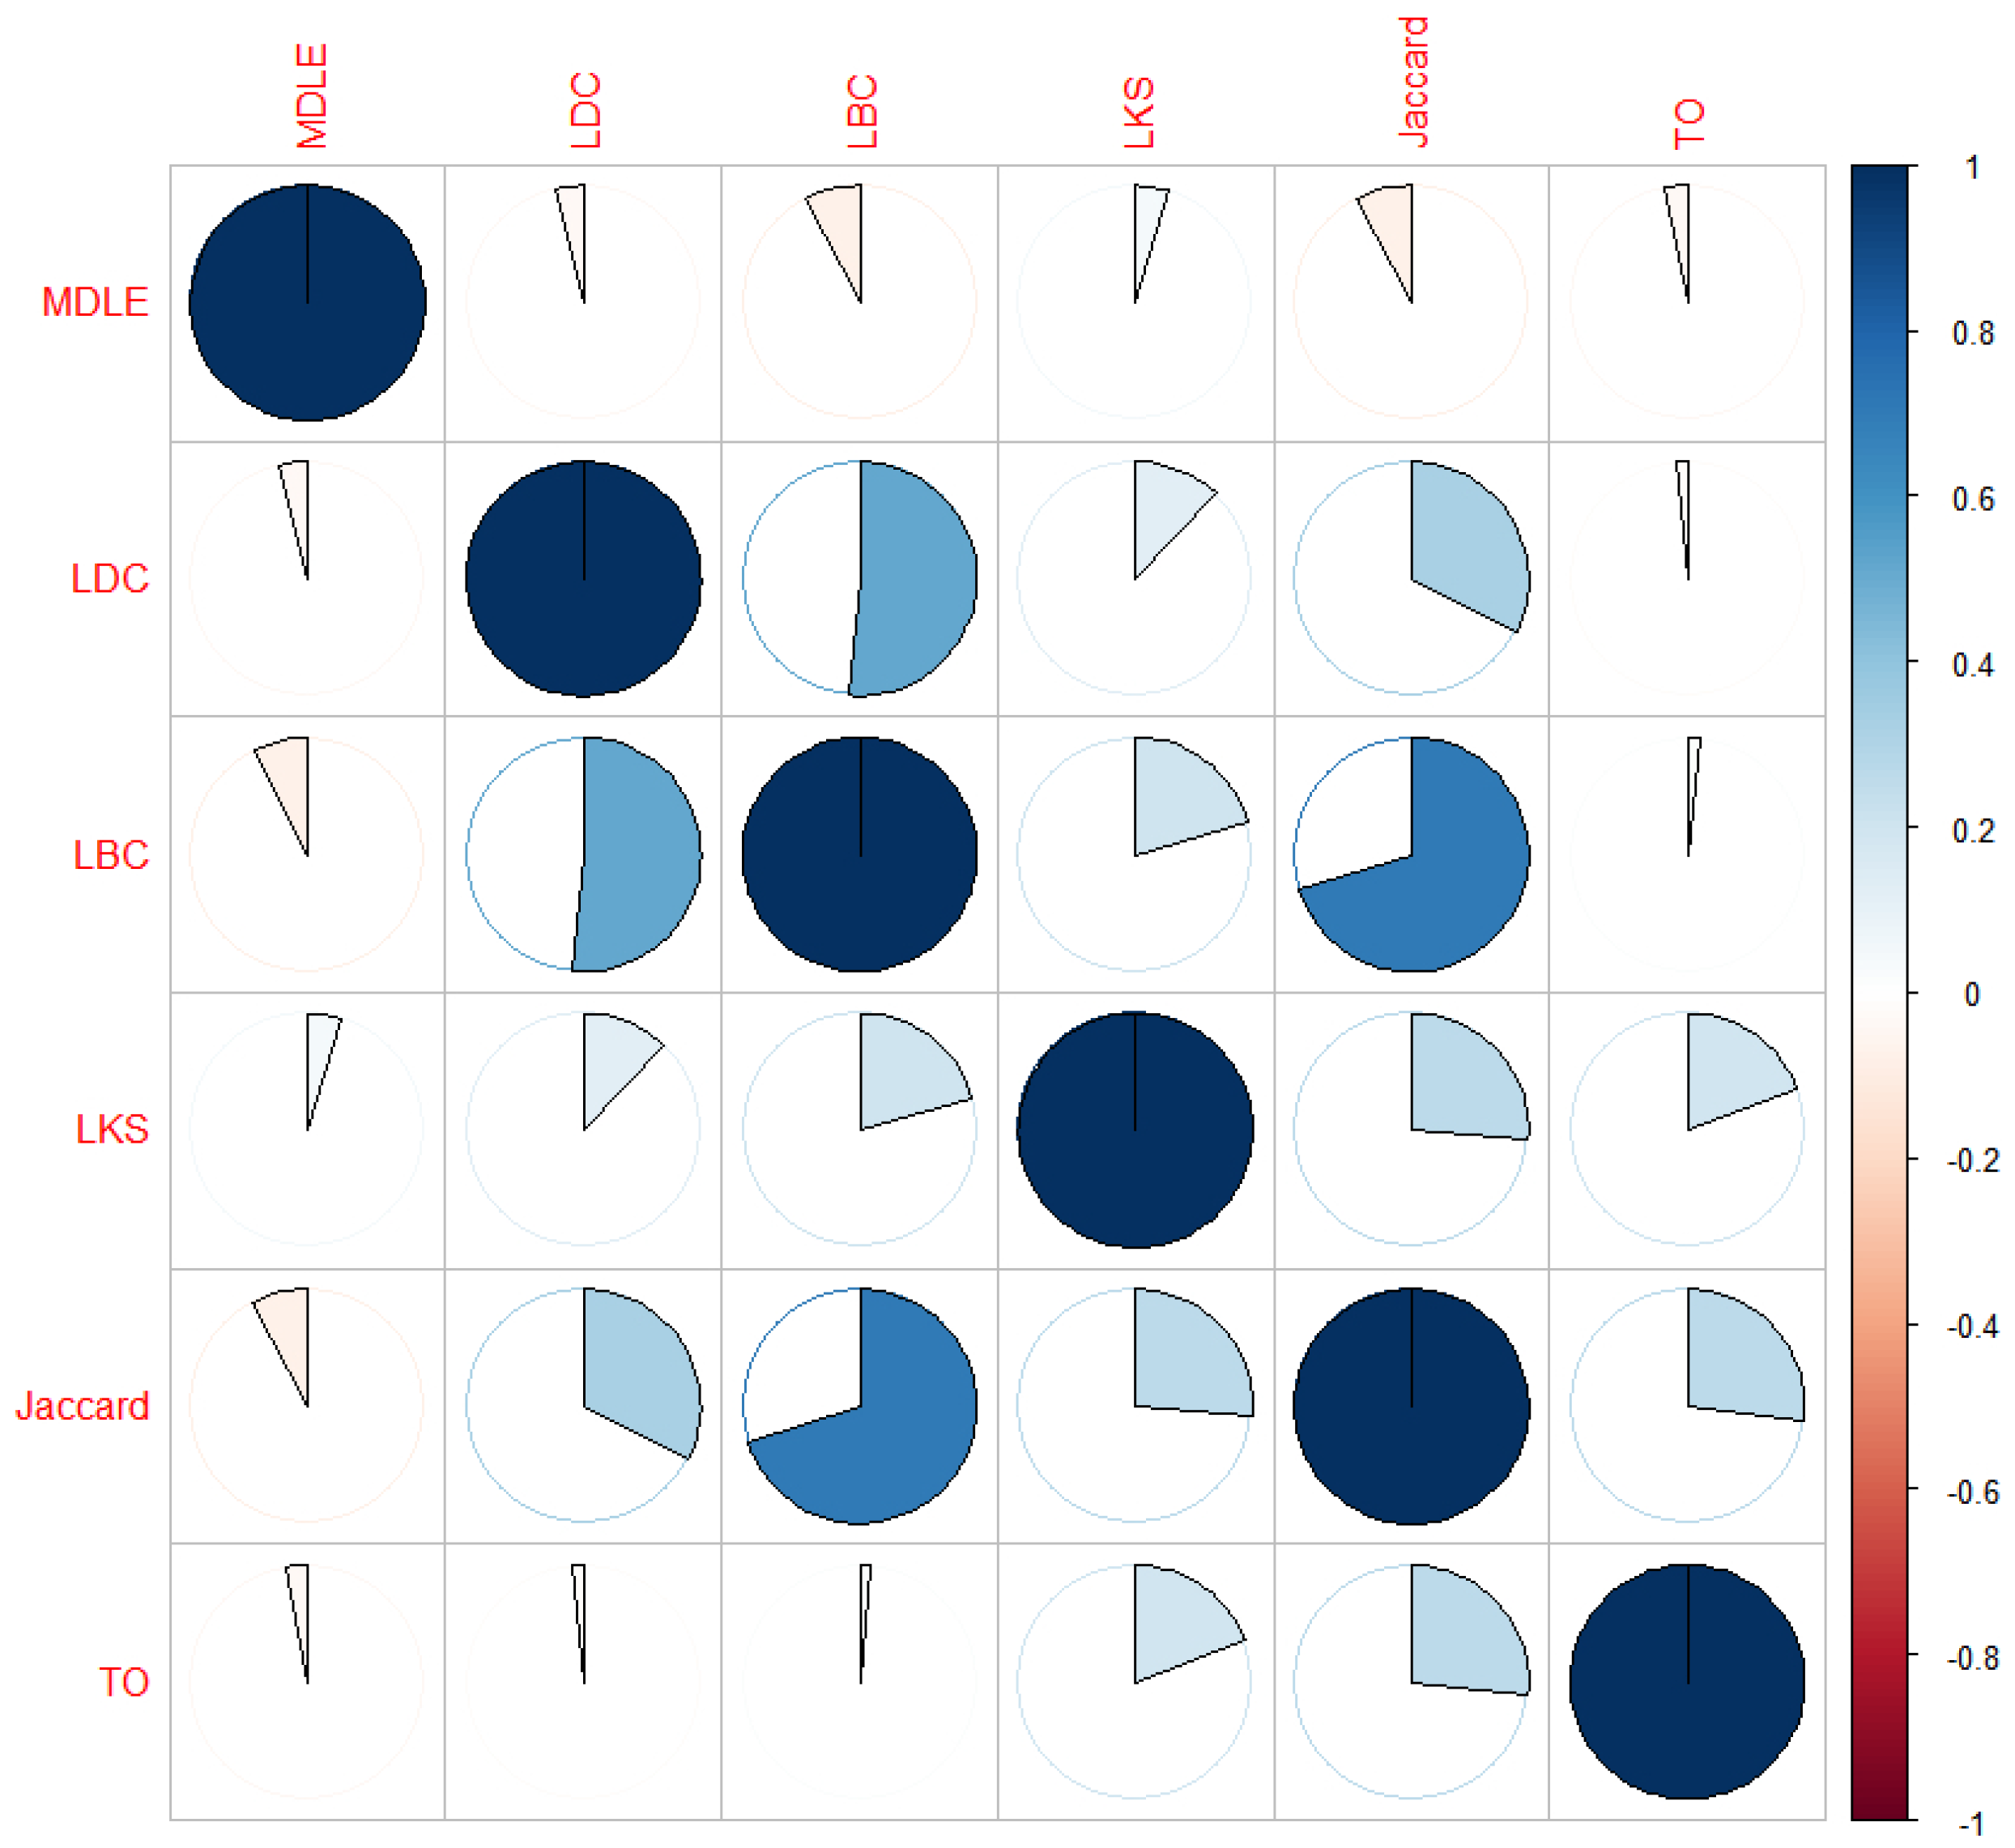
In Equation (14), for the set of samples X and Y of the two link importance metrics for correlation assessment, is the standardized score of the metric sample , is the average of the metric samples , and is the sample standard deviation of the metric samples . Similarly, is the standardized score of the metric sample , is the average of the metric sample , and is the sample standard deviation of the metric sample . The fluctuation range of the PPMCC of the two metrics samples is [−1,1]. indicates that the metric samples and have a good correlation, can be characterized by linear equations, and are positively correlated; indicates that the metric samples and have a good correlation, can be characterized by linear equations, and are negatively correlated; and indicates that the metrics do not have a linear relationship with each other. In this section, we also evaluate the network topology based on the “Business” dataset, calculate the Pearson correlation coefficients between the MDLE and the five link importance metrics, and map the results into a heat map as shown in
Figure 7.
In
Figure 7, the heat map characterizes the strength of the correlation between the two metrics in terms of the percentage of fill of the circular pattern and the positive and negative correlation between the two metrics in terms of the color map** of the legend on the right-hand side, thus providing a graphical presentation of the Pearson coefficients between the metrics. The diagonal line in the figure is the autocorrelation of each indicator, represented by a filled dark blue circular pattern (i.e.,
), and the lower left part of the figure is symmetric with the upper right part.
Based on the analysis of the heat map values and color distribution, it can be seen that, generally, the correlation between different assessment metrics presents the following characteristics: First, for the set of homogeneous metrics (link importance is either positively or negatively correlated with the metric values), the metrics are positively correlated with each other; this is because the critical links in the network often take on important functions in multiple dimensions. However, the correlation strength between them fluctuates due to the different assessment perspectives of the link importance metrics, e.g., the correlations between LDC, LBC, LKS, Jaccard, and TO are positive, but the magnitudes of the values of the Pearson parameter are different. It is worth noting that the assessment perspectives of various link importance metrics differ. However, the experimental network’s topology has an impact on the assessment results to some extent. For instance, while the LBC and Jaccard index assess links based on connectivity and endpoint variability, respectively, there are positive and strong correlations in the assessment results because the physical topology layer of the network presents a structure with solid centrality and leafy distribution at the edges. As a result, the LBC’s assessment results exhibit a strong correlation with the Jaccard index’s assessment results.
Meanwhile, the analysis shows that the correlation between the MDLE and the other five metrics is weakly negative. The reason why the correlation performance is different from the general indicators can be analyzed from the following two aspects.
First, from the perspective of the structural characteristics of the network model, the network security situational awareness-oriented multi-layer network model, the importance of the link not only depends on the topological location, but is also affected by the dependency relationship in the network. As a directional-dependent link fails, the dependent nodes associated with it will undergo secondary failure, which will lead to network damage on a larger scale. The existing link importance indicators only consider the single-layer network information, and cannot consider dependency as an assessment element, so it is difficult to find the set of links that have a significant impact on the three-tiered network topology.
The second is the idea of critical link discovery, where the MDLE aggregates the importance information in the three-layer network topology through the dependencies between network layers, can measure the importance of links from a domain-wide perspective, and can discover the set of links that play an important role in supporting the entire network topology. Some links are replaceable in the network and although they are located near the central area of the network, for instance, router communication links, in the event of a failure, the connectivity function can be replaced by a similar link with less impact on the network. On the contrary, failure of the links between the incoming routers and the important servers will make the servers go offline, which will have a great impact on the upper-layer service flow and a large amount of users’ access behaviors. These important links are often non-important in existing importance metrics. Meanwhile, the MDLE determines the importance of a network by evaluating its impact on all three tiers. As a result, it has a weak negative correlation with the current link importance metrics in terms of relevance.
5.4. Link-Removal-Based Network Destruction Simulation
In the link removal experiments, the node failure ratio (labeled ) and link failure ratio (labeled ) of the three-layer network are utilized to gauge the level of influence that link removal has on the network’s structural integrity. The preferred node failure ratio is defined in the following manner.
Definition 17 In Equation (15), , , and denote the number of failed nodes in the entire network topology in the physical device layer, the business application layer, and the user role layer, respectively. , , and denote the number of failed nodes in the physical device layer, the business application layer, and the user role layer, respectively, in the experimental process. Similarly, the link failure ratio is defined as follows.
Definition 18 In Equation (16), , , and denote the number of failed links in the entire network topology in the physical device layer, the business application layer, and the user role layer, respectively. , , and denote the number of failed links in the physical device layer, the business application layer, and the user role layer, respectively, in the experimental process. Compared with the proportion of network node failure, the proportion of network link failure highlights the retention of links in the current subject network after the perturbation, which demonstrates the connectivity density of the network.
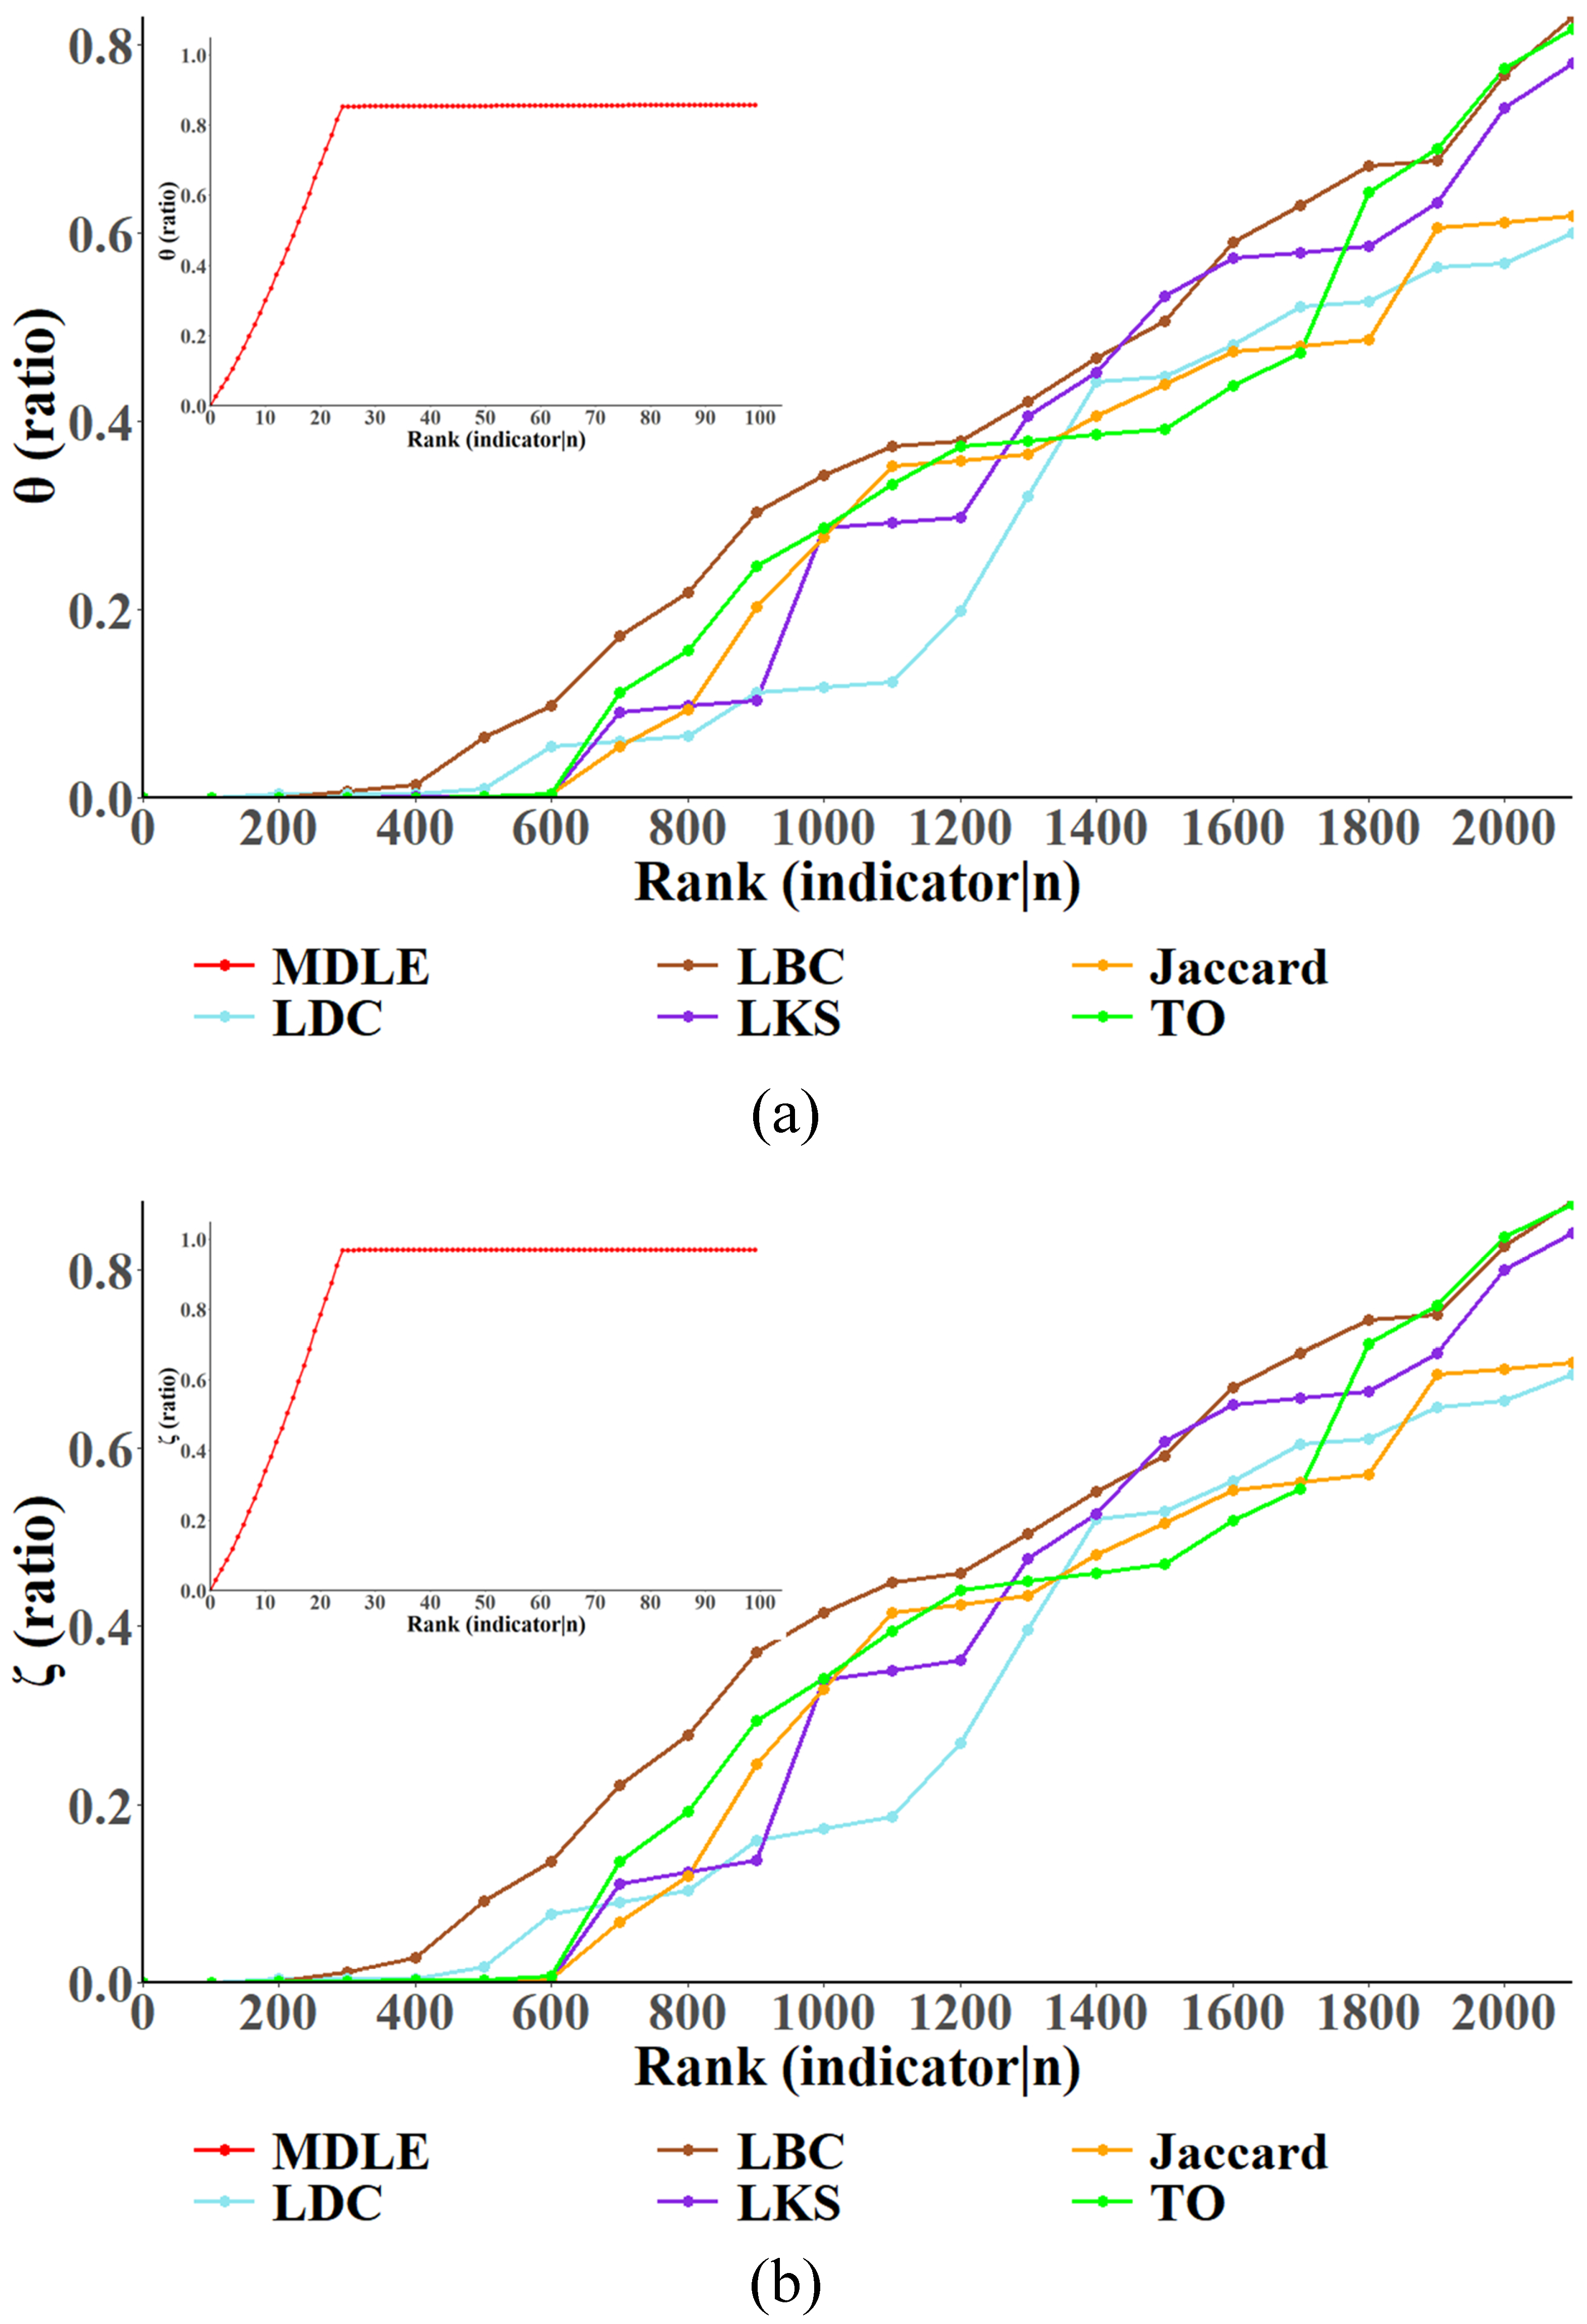
In this section, the continuous link removal strategy is used to conduct experiments, and the network node failure ratio and network link failure ratio of the “Business” and “Campus” networks are determined to observe the impact of link removal on the topology of the three-layer network model according to different link importance evaluation indexes. The results of the experiments are shown in
Figure 8 and
Figure 9.
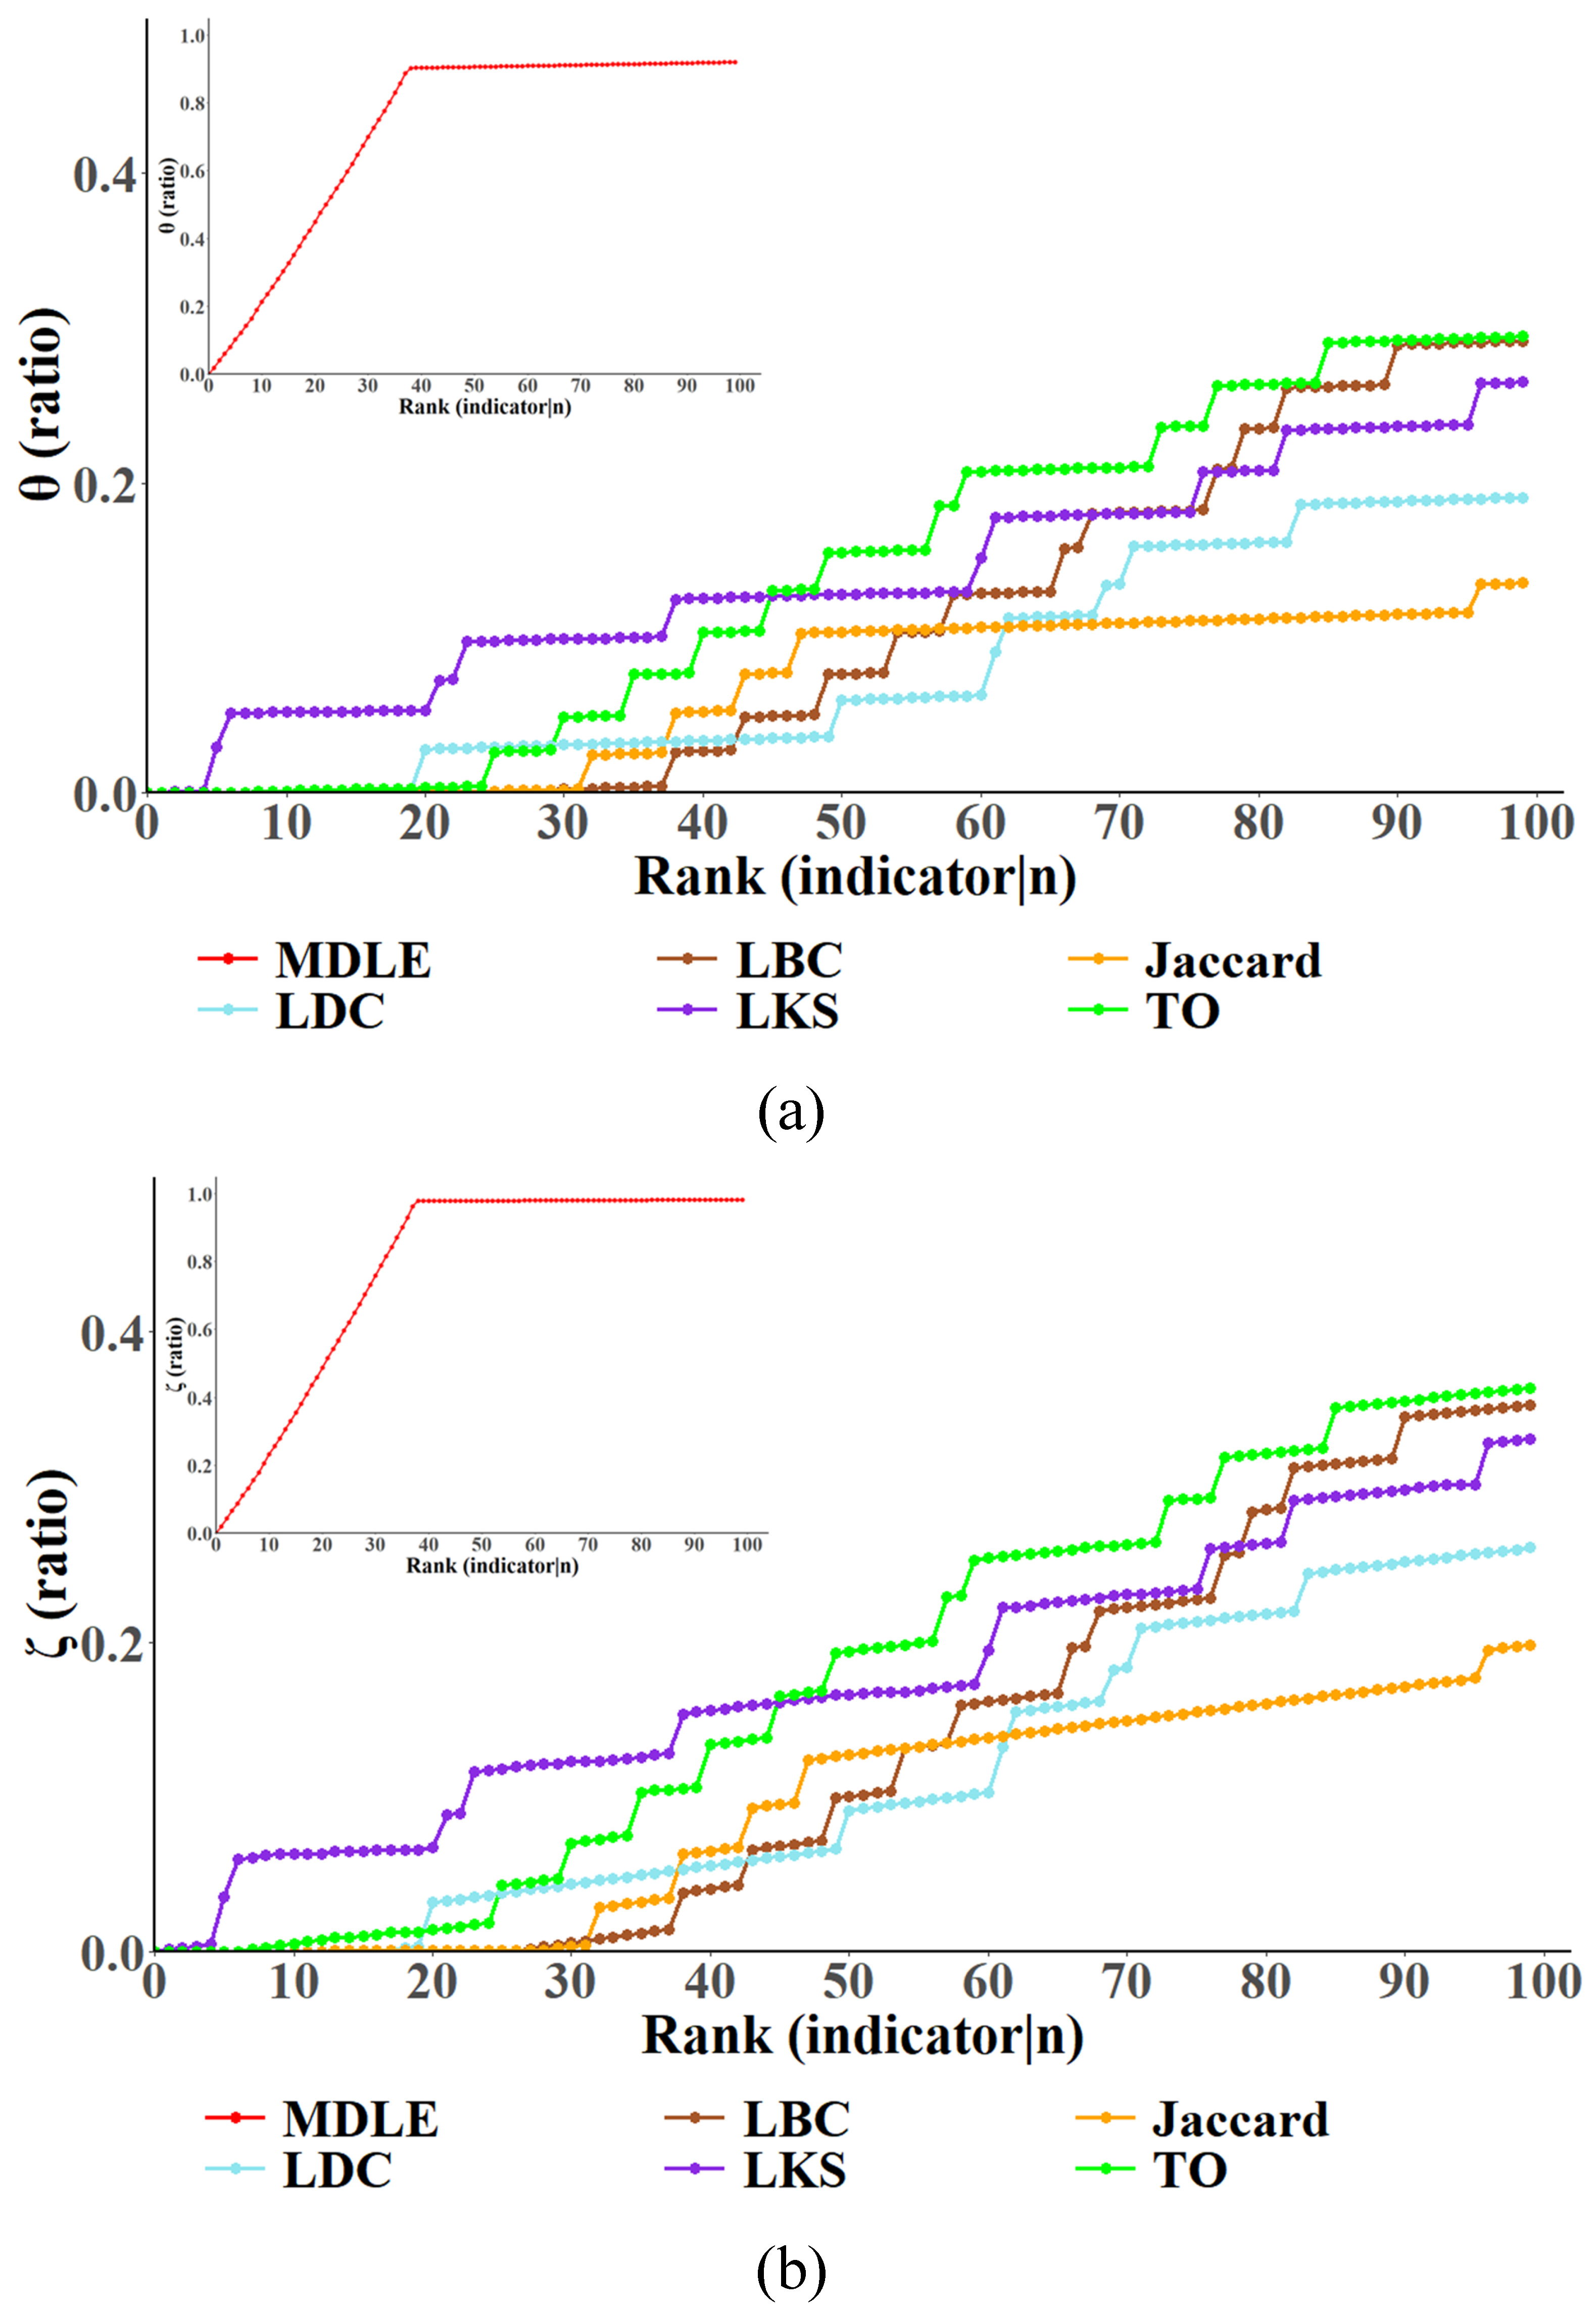
The horizontal coordinate shows both the significance ranking and the size of the link that has been removed through the critical link discovery methodology; a higher ranking indicates that the link has a higher score of importance in the method, and also earlier the link is removed Campus in the experiment. The vertical coordinate characterizes the proportion of network node/link failures, which is identified by a separate subgraph, since the experimental results indicate that the MDLE has a significant advantage in the speed of convergence compared to the other link importance metrics.
To analyze the validity of the MDLE more comprehensively, this section of the experiment employs two comparison strategies for the “Business” and “Campus” networks: (a) In the “Business” network removal experiment, after the MDLE-based destruction strategy makes the network node/link failure ratio reach the convergence, the convergence position of the failure ratio is recorded, and then link removal is carried out based on the existing link importance index until the network failure ratio is close to the convergence position in the MDLE and the scale of link removal in the network at this time is counted. (b) In the “Campus” network removal experiment, a set of links with the same size is selected based on their importance metrics (including the MDLE), specifically the top 100 links per metric. These links are then removed and the experiment observes the percentage of network node/link failures.
In
Figure 8, it is shown that during the link removal experiments, the convergence position of the MDLE in the percentage of network node failures and the percentage of link failures is around 85% and 97%, respectively. The experimental results show that when the two best metrics of network damage in the comparison methods, the link betweenness centrality (LBC) and the topology overlay index (TO), converge, the size of the removed links in the network has already exceeded 2000, while the MDLE discovery method reaches the convergence of the network node/link failure ratio before removing 30 links. This proves that the MDLE, which integrates multi-layer information, has a significant advantage in the discovery of critical links in multi-layer networks.
In
Figure 9, with the increasing scale of link removal in the network, the proportion of node/link failure in the network increases positively, and the experimental results show that compared with the other five metrics (LDC, LBC, LKS, Jaccard, and TO), the MDLE can make the proportion of node failure in the network converge quickly. After removing the top 100 links, the proportion of node failure in the network node removal based on the five existing link importance assessment metrics is around 10–30%, while the effect of removal based on the MDLE reaches more than 90%. Similarly, assessing from the perspective of the network link failure ratio, after removing the top 100 links ranked by each metric, for the link removal strategy based on the existing link importance assessment metrics, the network link failure ratio is about 2–40%, while the effect of removal based on the MDLE is close to 100%, which means that connectivity has been paralyzed in the three-layer network. The experimental results show that in the multi-layer network model oriented to network security situational awareness, compared with the existing link importance metrics, the link importance rankings in the MDLE are more reasonable, and the MDLE can be more effective in discovering the critical link sets in the three-layer network.


