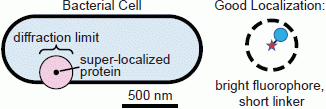
Single-molecule imaging overcomes the challenge posed by the diffraction limit of light by precisely determining the position of each isolated fluorescent emitter. The precision with which each molecule can be localized depends on the square root of the number of emitted photons detected [
11]; the more photons collected, the better the localization precision. Intracellular investigations are not limited to intrinsically fluorescent molecules: most fluorescence imaging studies require that the target of interest be identified by a fluorescent label. To ensure high-resolution images, the choice of fluorophore is thus very important. Furthermore, background signals from cellular autofluorescence, diffuse fluorescence from very fast-moving molecules, excess or unwanted fluorophores incorporated into the cell, and camera noise can all worsen the localization precision.
In vitro single-molecule experiments achieve high signal-to-noise ratios based on imaging bright, stationary fluorophores in controlled environments, but in live-cell experiments, fluorophores may be dim, background fluorescence can be high, and the molecules of interest generally move during observation [
11,
61,
62,
63]. Fluorophore bleaching and blinking can also reduce detectability.
2.1. General Considerations
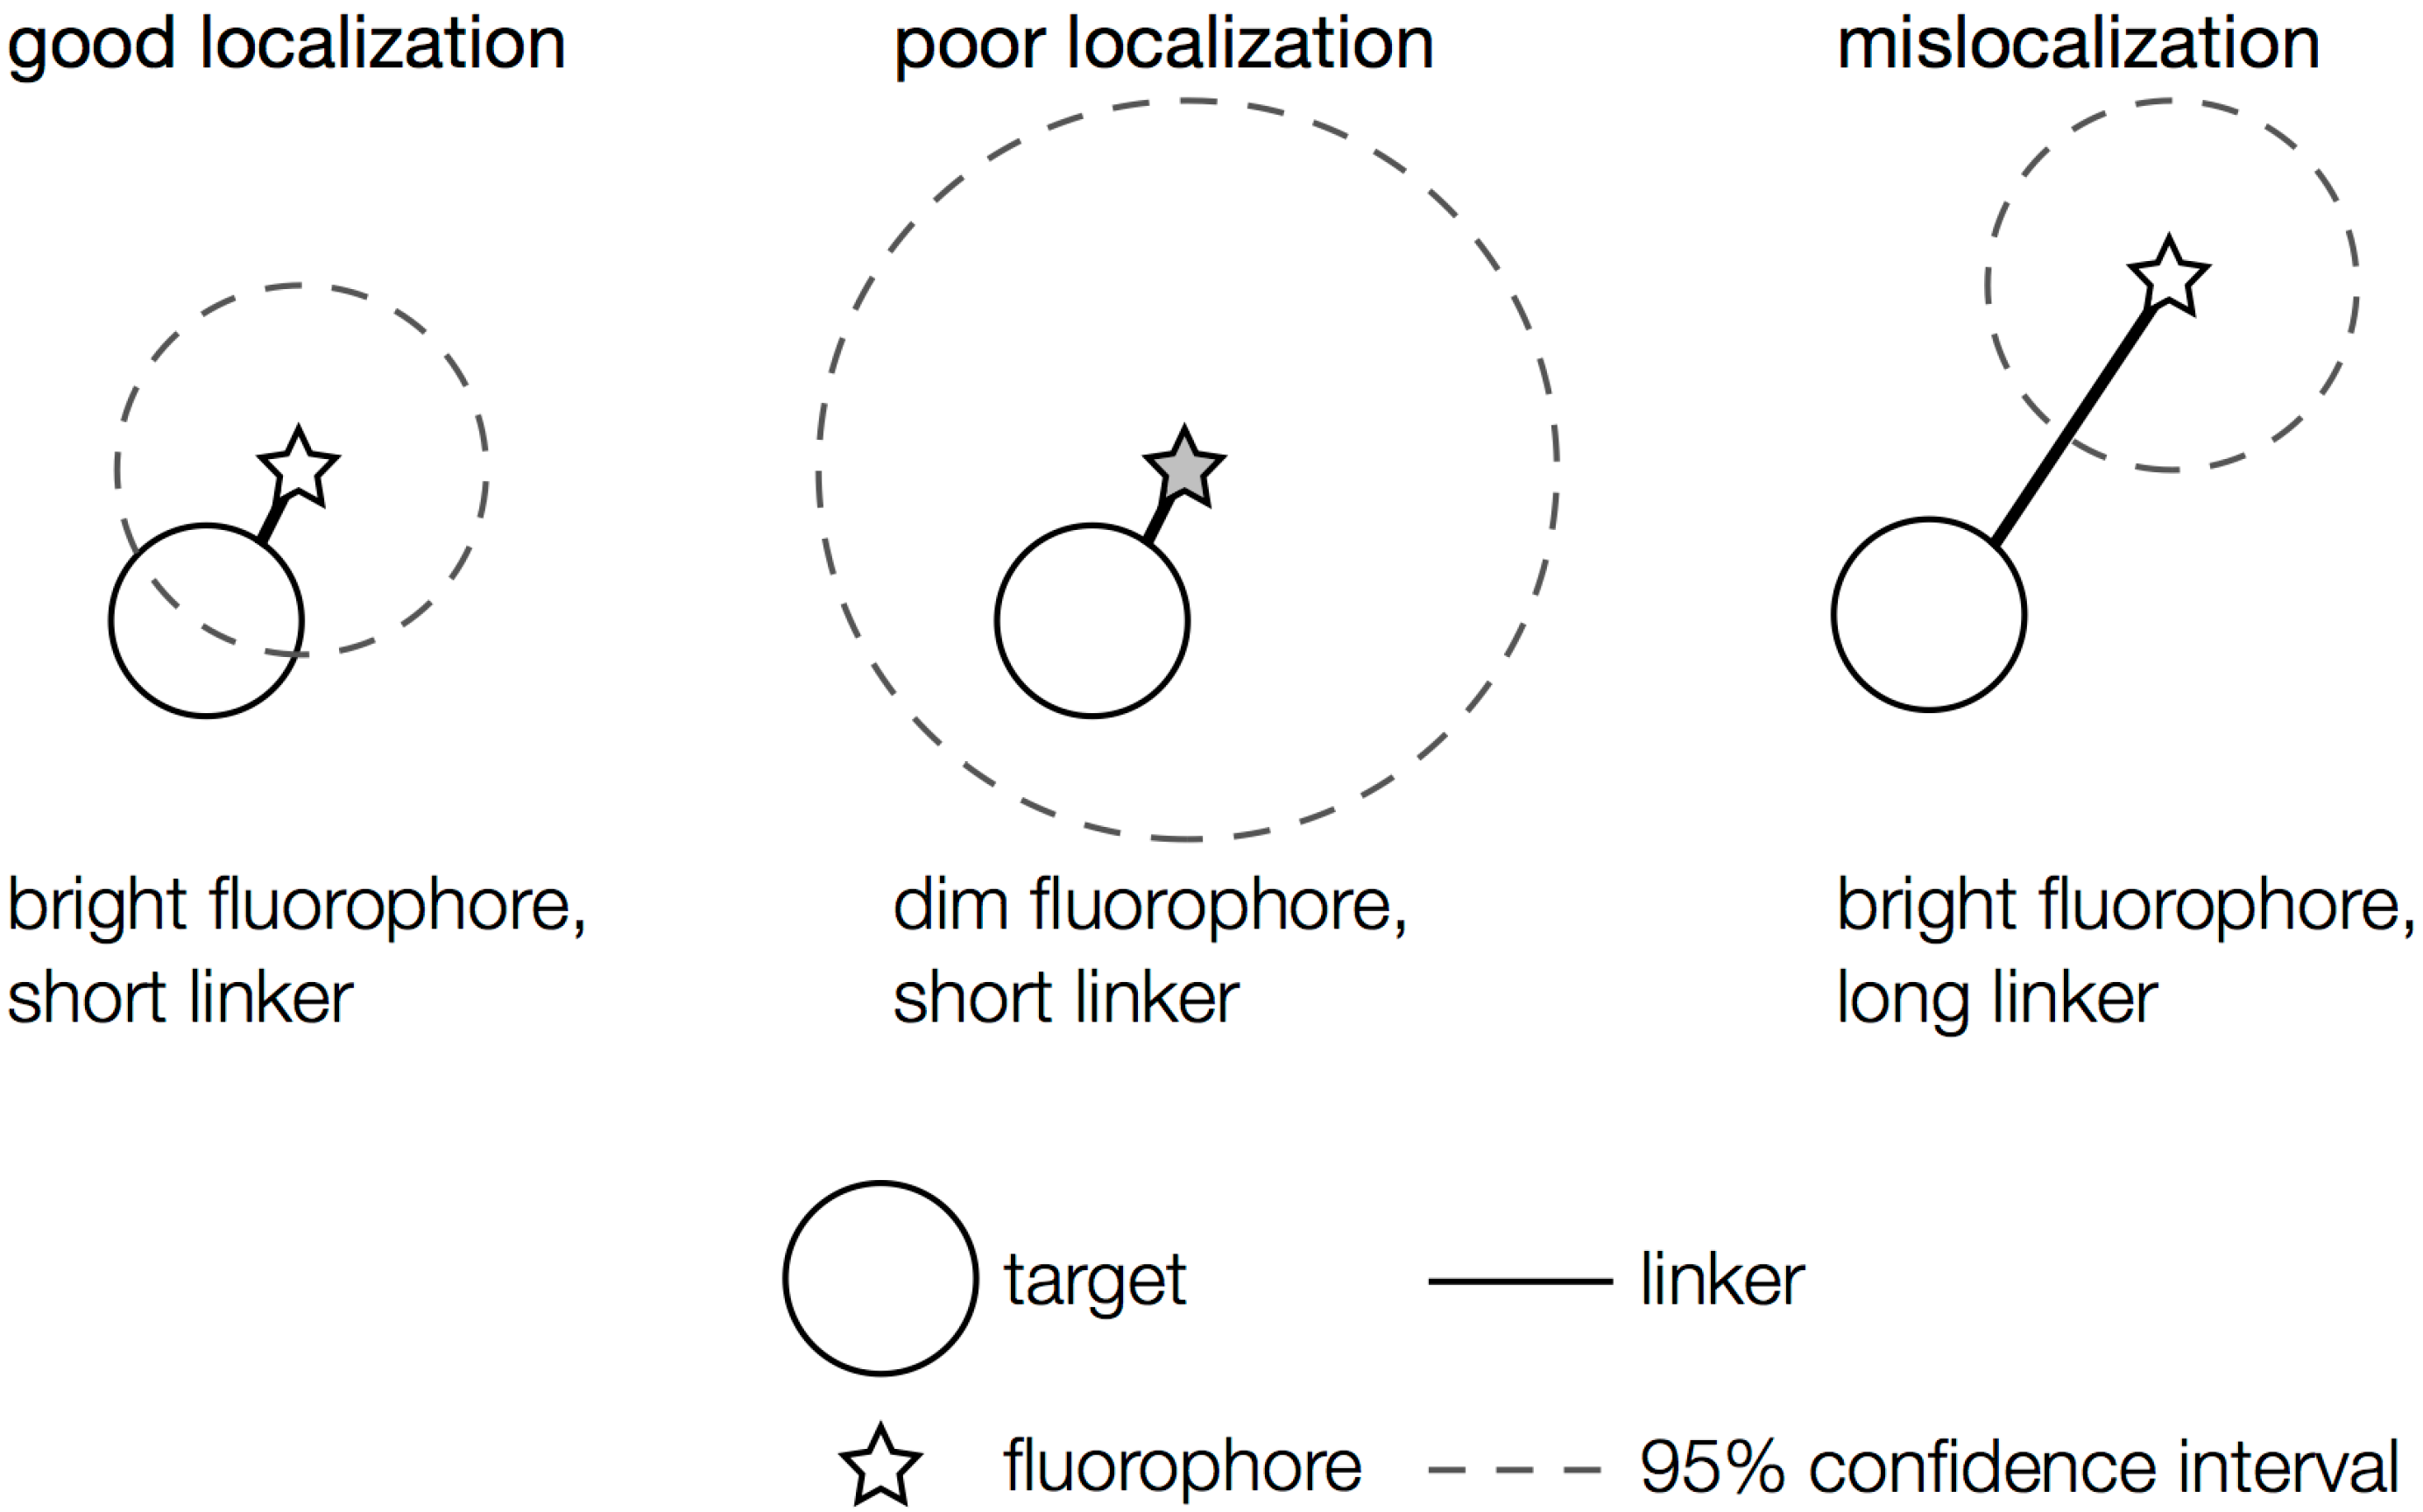
When choosing the appropriate fluorophore and labeling scheme for a particular live-cell imaging experiment, both the fluorescent properties of the tag and the effect of the label on the organism must be considered. Ideally, the fluorophore used should report the position of its target very precisely without perturbing the system in any way. If the linker between the fluorophore and its target is too long, as can be the case, for instance, for antibody labeling, which inserts a 20-nm space between the target and the label [
64], mislocalizations (aberrant localizations) may occur: the fluorophore may be localized with high precision, but because the probe is several nanometers from the point of interest, the uncertainty in the target position is much greater than the fluorophore localization precision suggests (
Figure 3). Additionally, because the diffusion coefficient is inversely related to particle size [
65], large tags may hinder the diffusion of small, mobile molecules in cells.
Figure 3.
Localization problems arising from dim fluorophores or long linkers. A bright fluorophore that is near the target of interest provides the most precise localization (dashed circle: small confidence interval). Dimmer fluorophores are localized less well (dashed circle: large confidence interval). A precisely localized fluorophore that is far from the feature it is intended to label will not report the actual position accurately.
In addition to local effects, it is important to determine that labeling the target molecule does not interfere with the normal functions of the protein, or with larger-scale cellular functions. Whenever possible, labeled cells should grow at rates similar to unlabeled cells and exhibit wild type phenotypes. Measurement of protein activity is crucial. For example, in our studies of
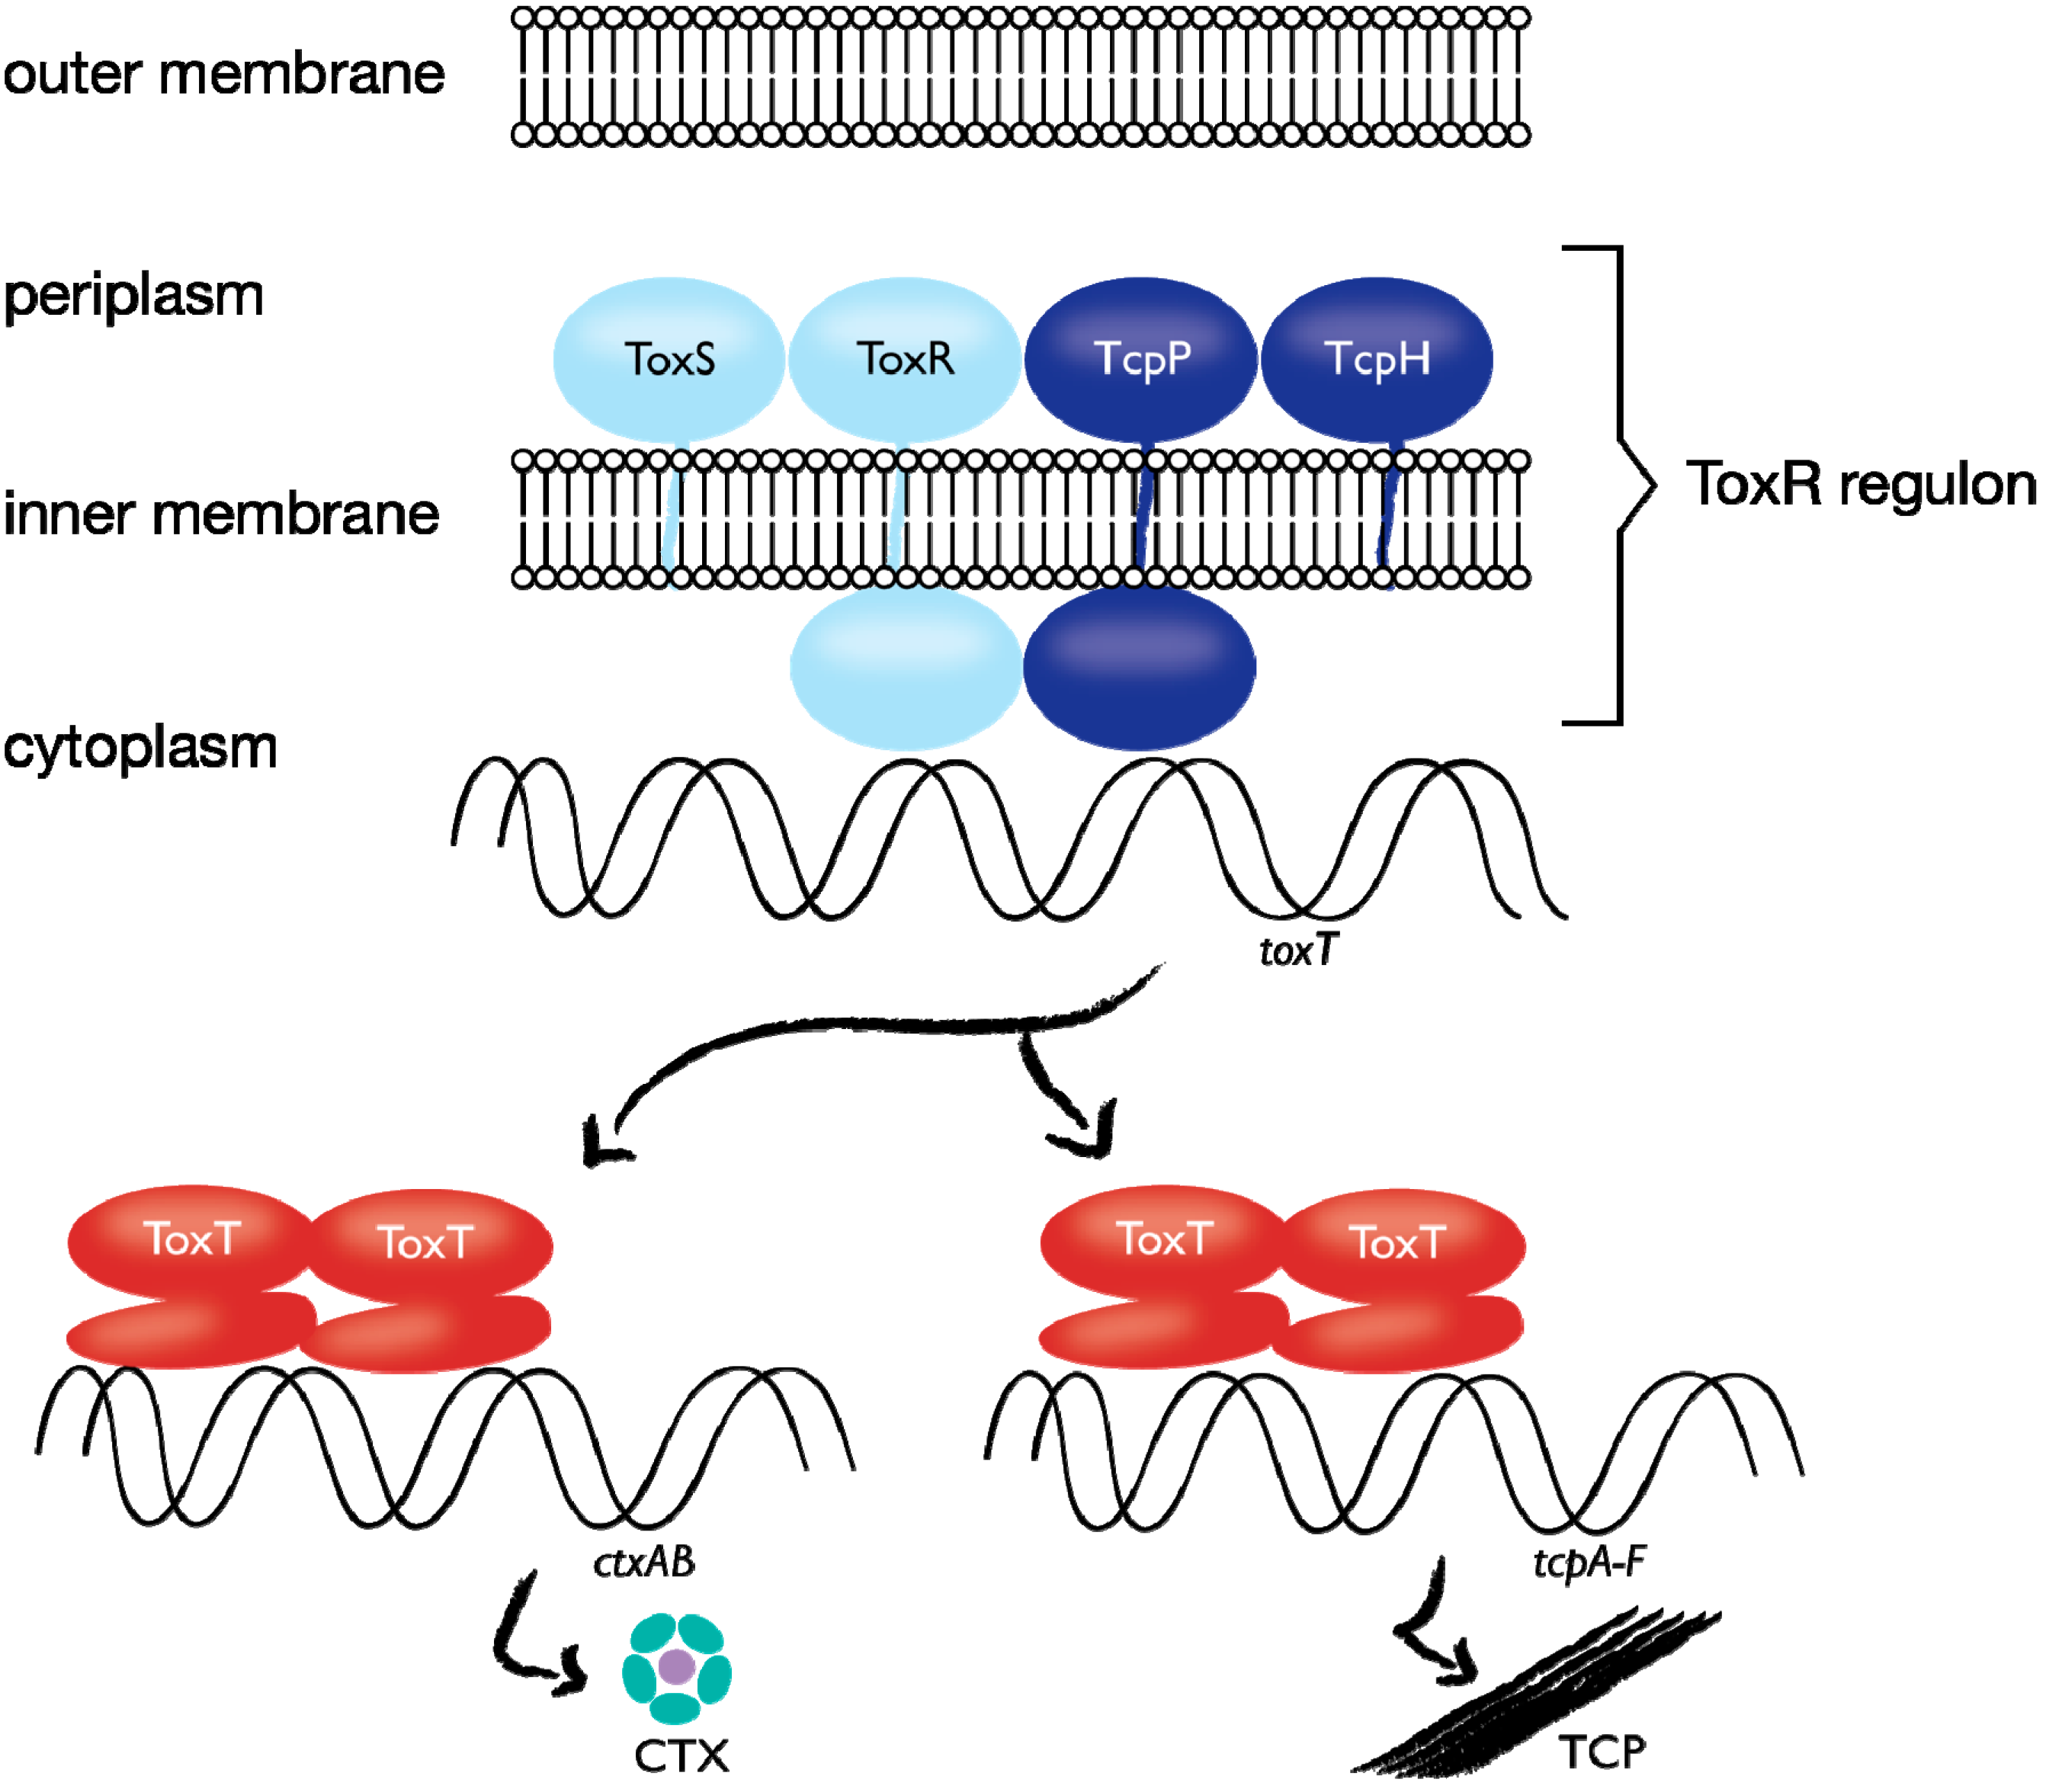
V. cholerae expressing TcpP-PAmCherry as the sole TcpP source, we identified TcpP-PAmCherry induction conditions that led to wild-type expression levels of the toxin coregulated pilus protein TcpA, whose expression is regulated by TcpP (
Figure 2). However, the PAmCherry fusion did behave slightly differently than wild type TcpP in some respects. Notably, while the TcpH protein is required to protect wild-type TcpP from degradation (
Figure 2; [
66]), TcpP-PAmCherry stability is less dependent on TcpH [
46]. Here, the fluorescent protein tag in the periplasm may mimic the stabilizing role of TcpH. Other examples of careful consideration of biological activity after introducing labels were performed by **e
et al., who found that
E. coli T7 RNAP labeled with the yellow fluorescent protein Venus at the N-terminus maintains its polymerase activity; that the protein Tsr maintains the ability to enter to membrane when labeled at its C-terminus [
1,
67]; and that labeling the
E. coli lac repressor does not impede LacI DNA-binding activity, but that the tagged repressor forms LacI dimers, rather than the LacI tetramers present in wild type [
68].
Due to the requirements of small size, labeling specificity and maintaining cellular function, the most commonly used fluorophores in live-cell single-molecule localization microscopy experiments are fluorescent proteins. Small-molecule dyes attached using enzymatic labeling schemes or antibody labeling, and other labels, such as unnatural amino acids and quantum dots, have also been used [
1,
2,
3,
4,
69].
2.2. Fluorescent Proteins
A wide variety of fluorescent proteins (FPs) has been engineered, with adaptations and characteristics to suit diverse applications. FPs can be pH-stable or pH-sensitive, and fast- or slow-maturing [
70,
71]. Some FPs have been engineered in split forms that fluoresce when the two halves are combined, in order to signal interactions between two proteins upon label complementation [
28,
71,
72]. FPs may exist in monomeric, dimeric or tetrameric forms. The canonical green fluorescent protein (GFP), isolated from jellyfish (
Aequorea victoria), is naturally a monomer [
8,
71], but many other FPs have a tendency to oligomerize [
73,
74], notably the red fluorophores derived from DsRed, which was isolated from coral (
Discosoma spp.) [
75]. Particularly at high local concentrations, such oligomerization may cause FP-tagged molecules to cluster artificially, giving rise to mislocalization artifacts [
74,
76]. Fortunately, several red FPs, such as mCherry, have been developed with improved monomeric character [
73]. Additionally, if the FP concentration is very low, even proteins that tend to dimerize will have a low probability of finding a partner with which to pair.
In super-resolution imaging, the photophysical properties of FPs are of primary importance. FPs come in many colors, from blue to far-red. These labels can also be paired for Förster Resonance Energy Transfer (FRET) experiments [
7], though the low FRET efficiency of FP pairs limits their utility for single-molecule FRET [
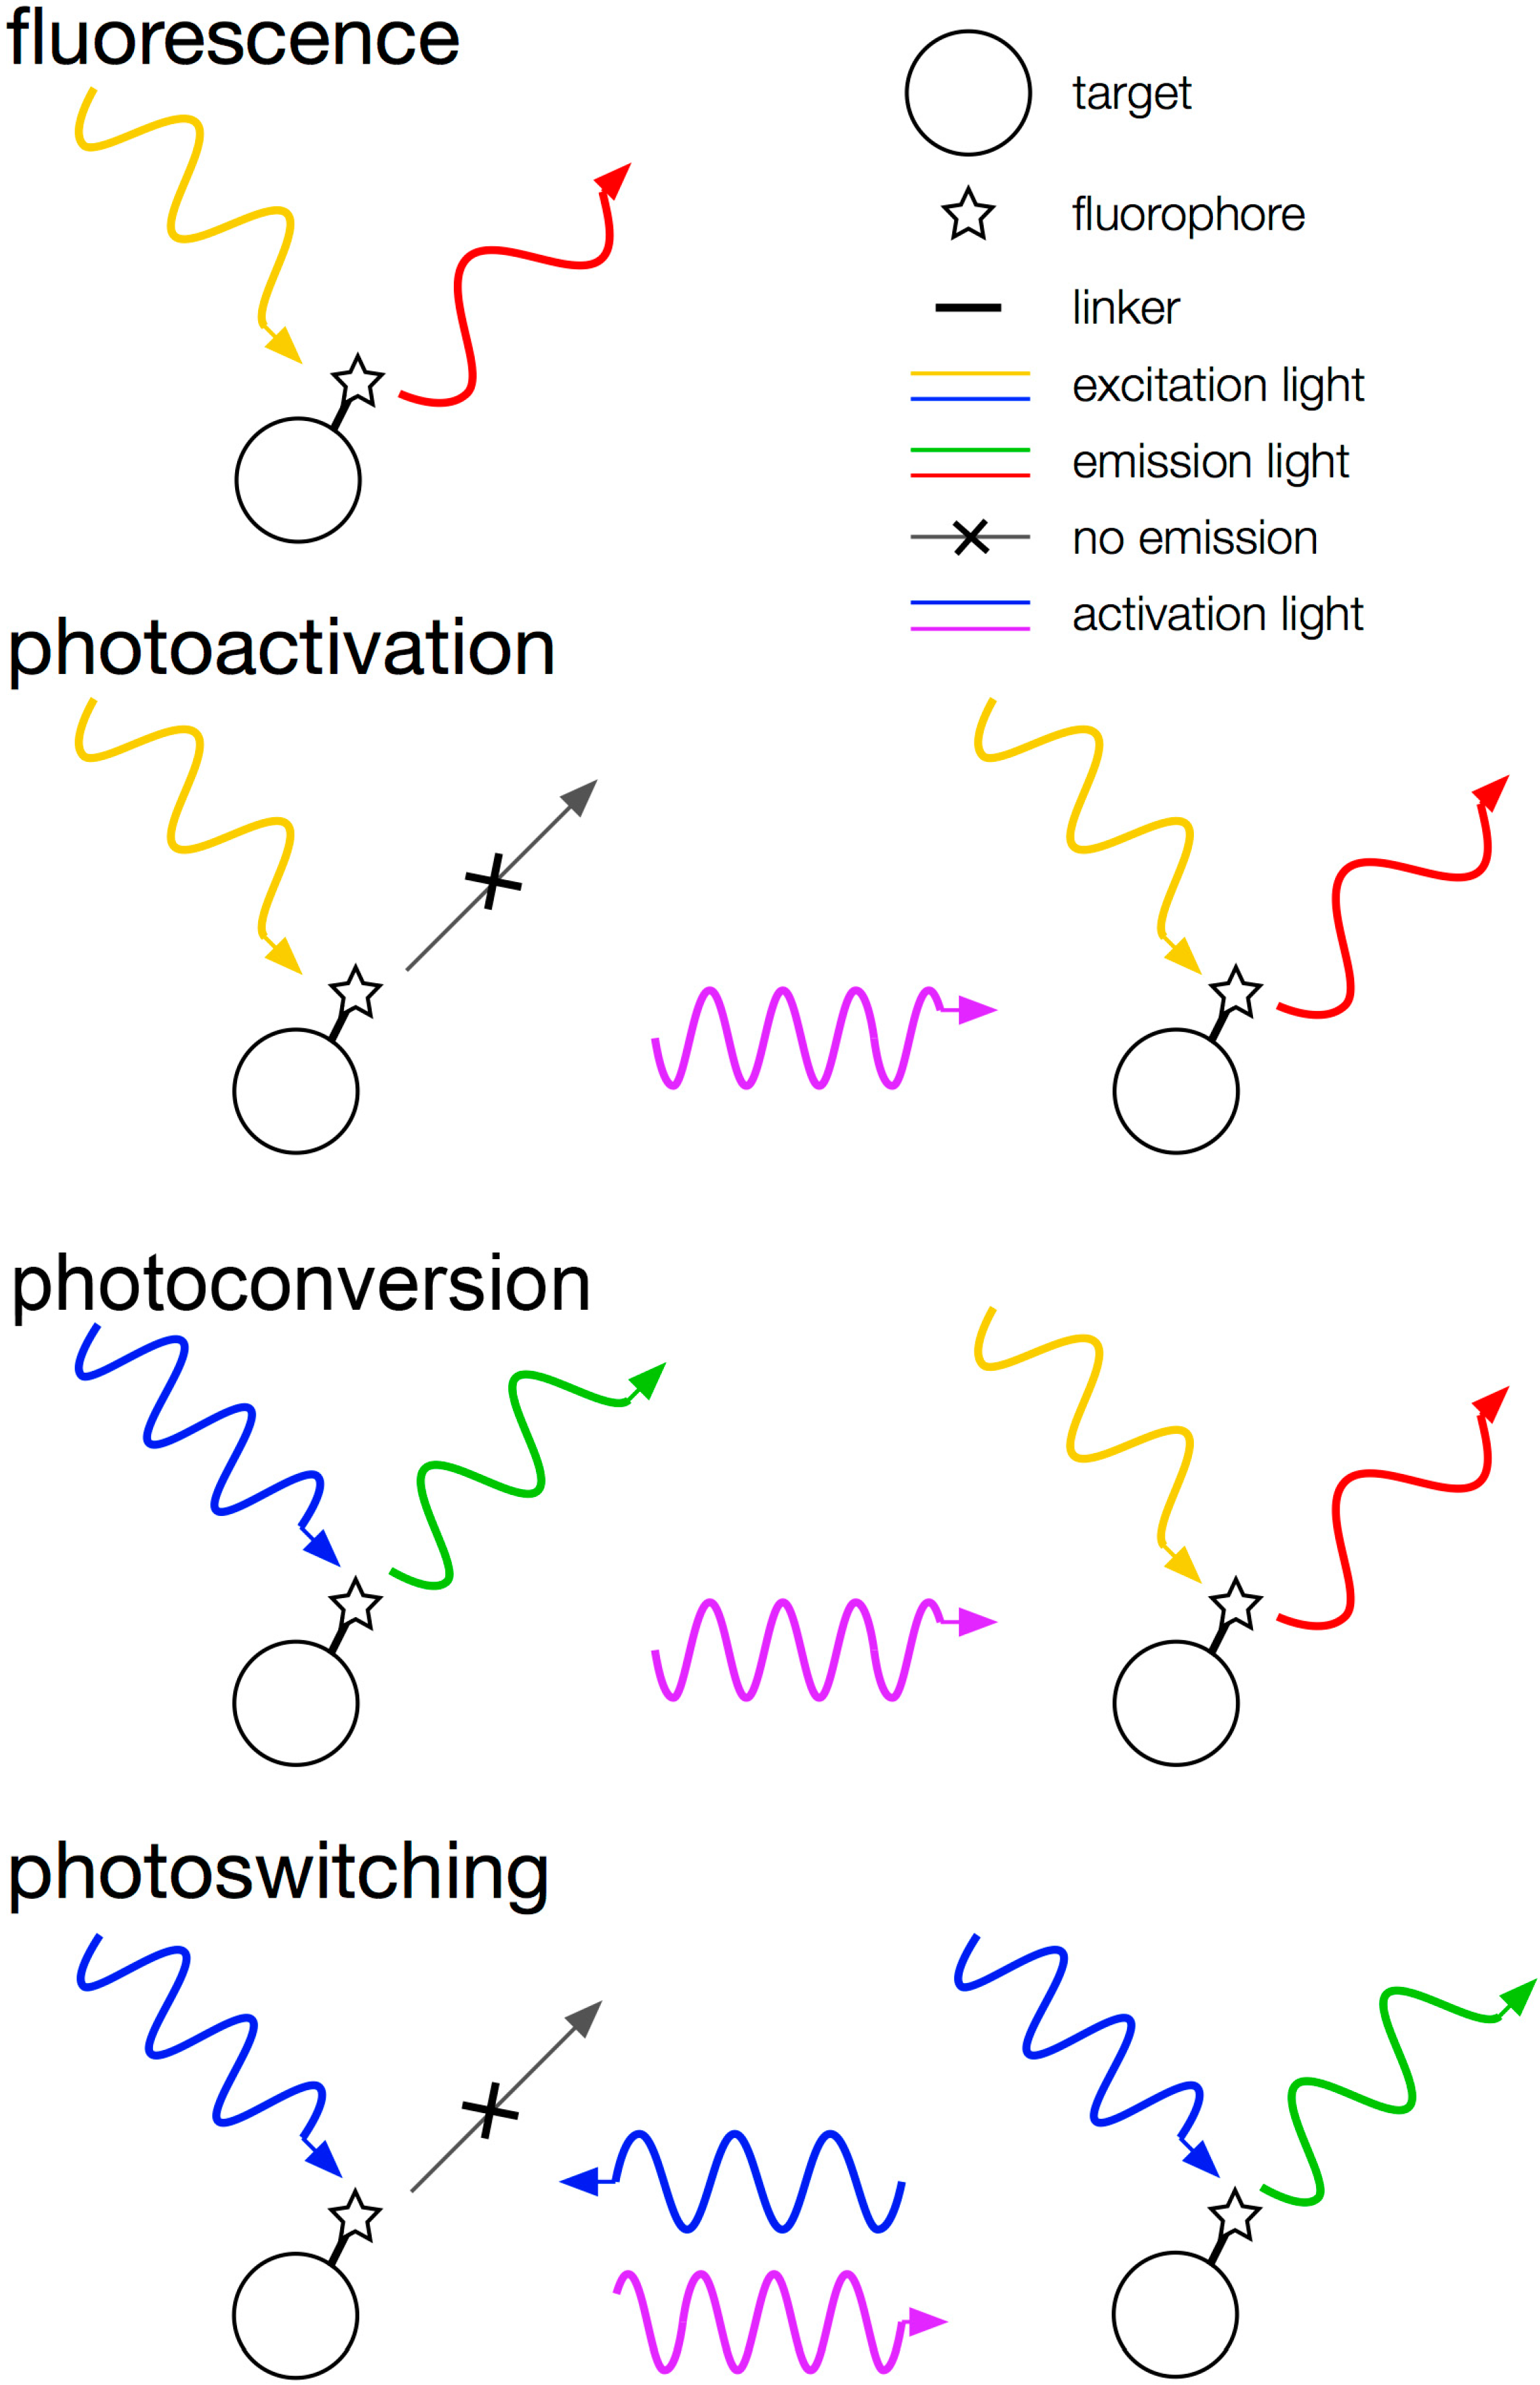
77]. FPs can also be photoactivatable, photoconvertible, or photoswitchable (
Figure 4; [
70]). A
photoactivatable fluorophore begins in a non-fluorescent “dark” state and can be switched to a fluorescent “bright” state using violet light (λ = 350–420 nm). A representative photoactivatable FP is PAmCherry, which is initially non-emissive, but after activation with violet light (405 nm), this FP absorbs yellow-green light (excitation maximum: 564 nm) and emits red light (emission maximum: 595 nm [
78]). A
photoconvertible fluorophore has two fluorescent states and can convert from the shorter-wavelength state to the longer-wavelength state. For example, Dendra2 has a “green” state (excitation maximum: 491 nm, emission maximum: 507 nm) and a “red” state (excitation maximum: 554 nm, emission maximum: 573 nm) and switches from green to red with 405-nm light [
79]. A
photoswitchable fluorophore, such as Dronpa, can
reversibly change between a fluorescent state and a dark state. Dronpa in the bright state emits green light (emission maximum: 518 nm) upon excitation by blue light (excitation maximum: 503 nm), but intense 488-nm light can switch this molecule to a dim state. 405-nm light reactivates the fluorescent state [
80].
Figure 4.
Categories of fluorescent proteins. mCherry is an example of a typical fluorescent emitter. PAmCherry is photoactivatable from off to on. Dendra2 is photoconvertible from green to red. Dronpa is reversibly photoswitchable from off to on.
Figure 4.
Categories of fluorescent proteins. mCherry is an example of a typical fluorescent emitter. PAmCherry is photoactivatable from off to on. Dendra2 is photoconvertible from green to red. Dronpa is reversibly photoswitchable from off to on.
Genetically encoding a FP tag allows highly specific labeling of the target, but this advantage must be weighed against the poor quantum yields (e.g., 0.22 QY for mCherry [
73]), low photon yields (~10
5 photons emitted from GFP before photobleaching [
81]) and large size (~25 kDa [
82]) of these labels as compared to organic dyes, e.g., rhodamine 6G (0
.95 QY, 10
6 photons, ~0.5 kDa [
83]). Moreover, not all protein fusions are stable. For example, in
V. cholerae bacteria expressing a fusion of the membrane-bound transcription activator protein TcpP to the photoconvertible FP Dendra2, we found that the TcpP-Dendra2 fusion had a higher rate of degradation than native TcpP, though this fusion protein was still able to activate
toxT transcription. In this same organism, other FPs, such as mCherry and PAmCherry, formed fusions with TcpP that were much more stable and thus more suitable for live-cell imaging of TcpP dynamics (
Figure 5).
Figure 5.
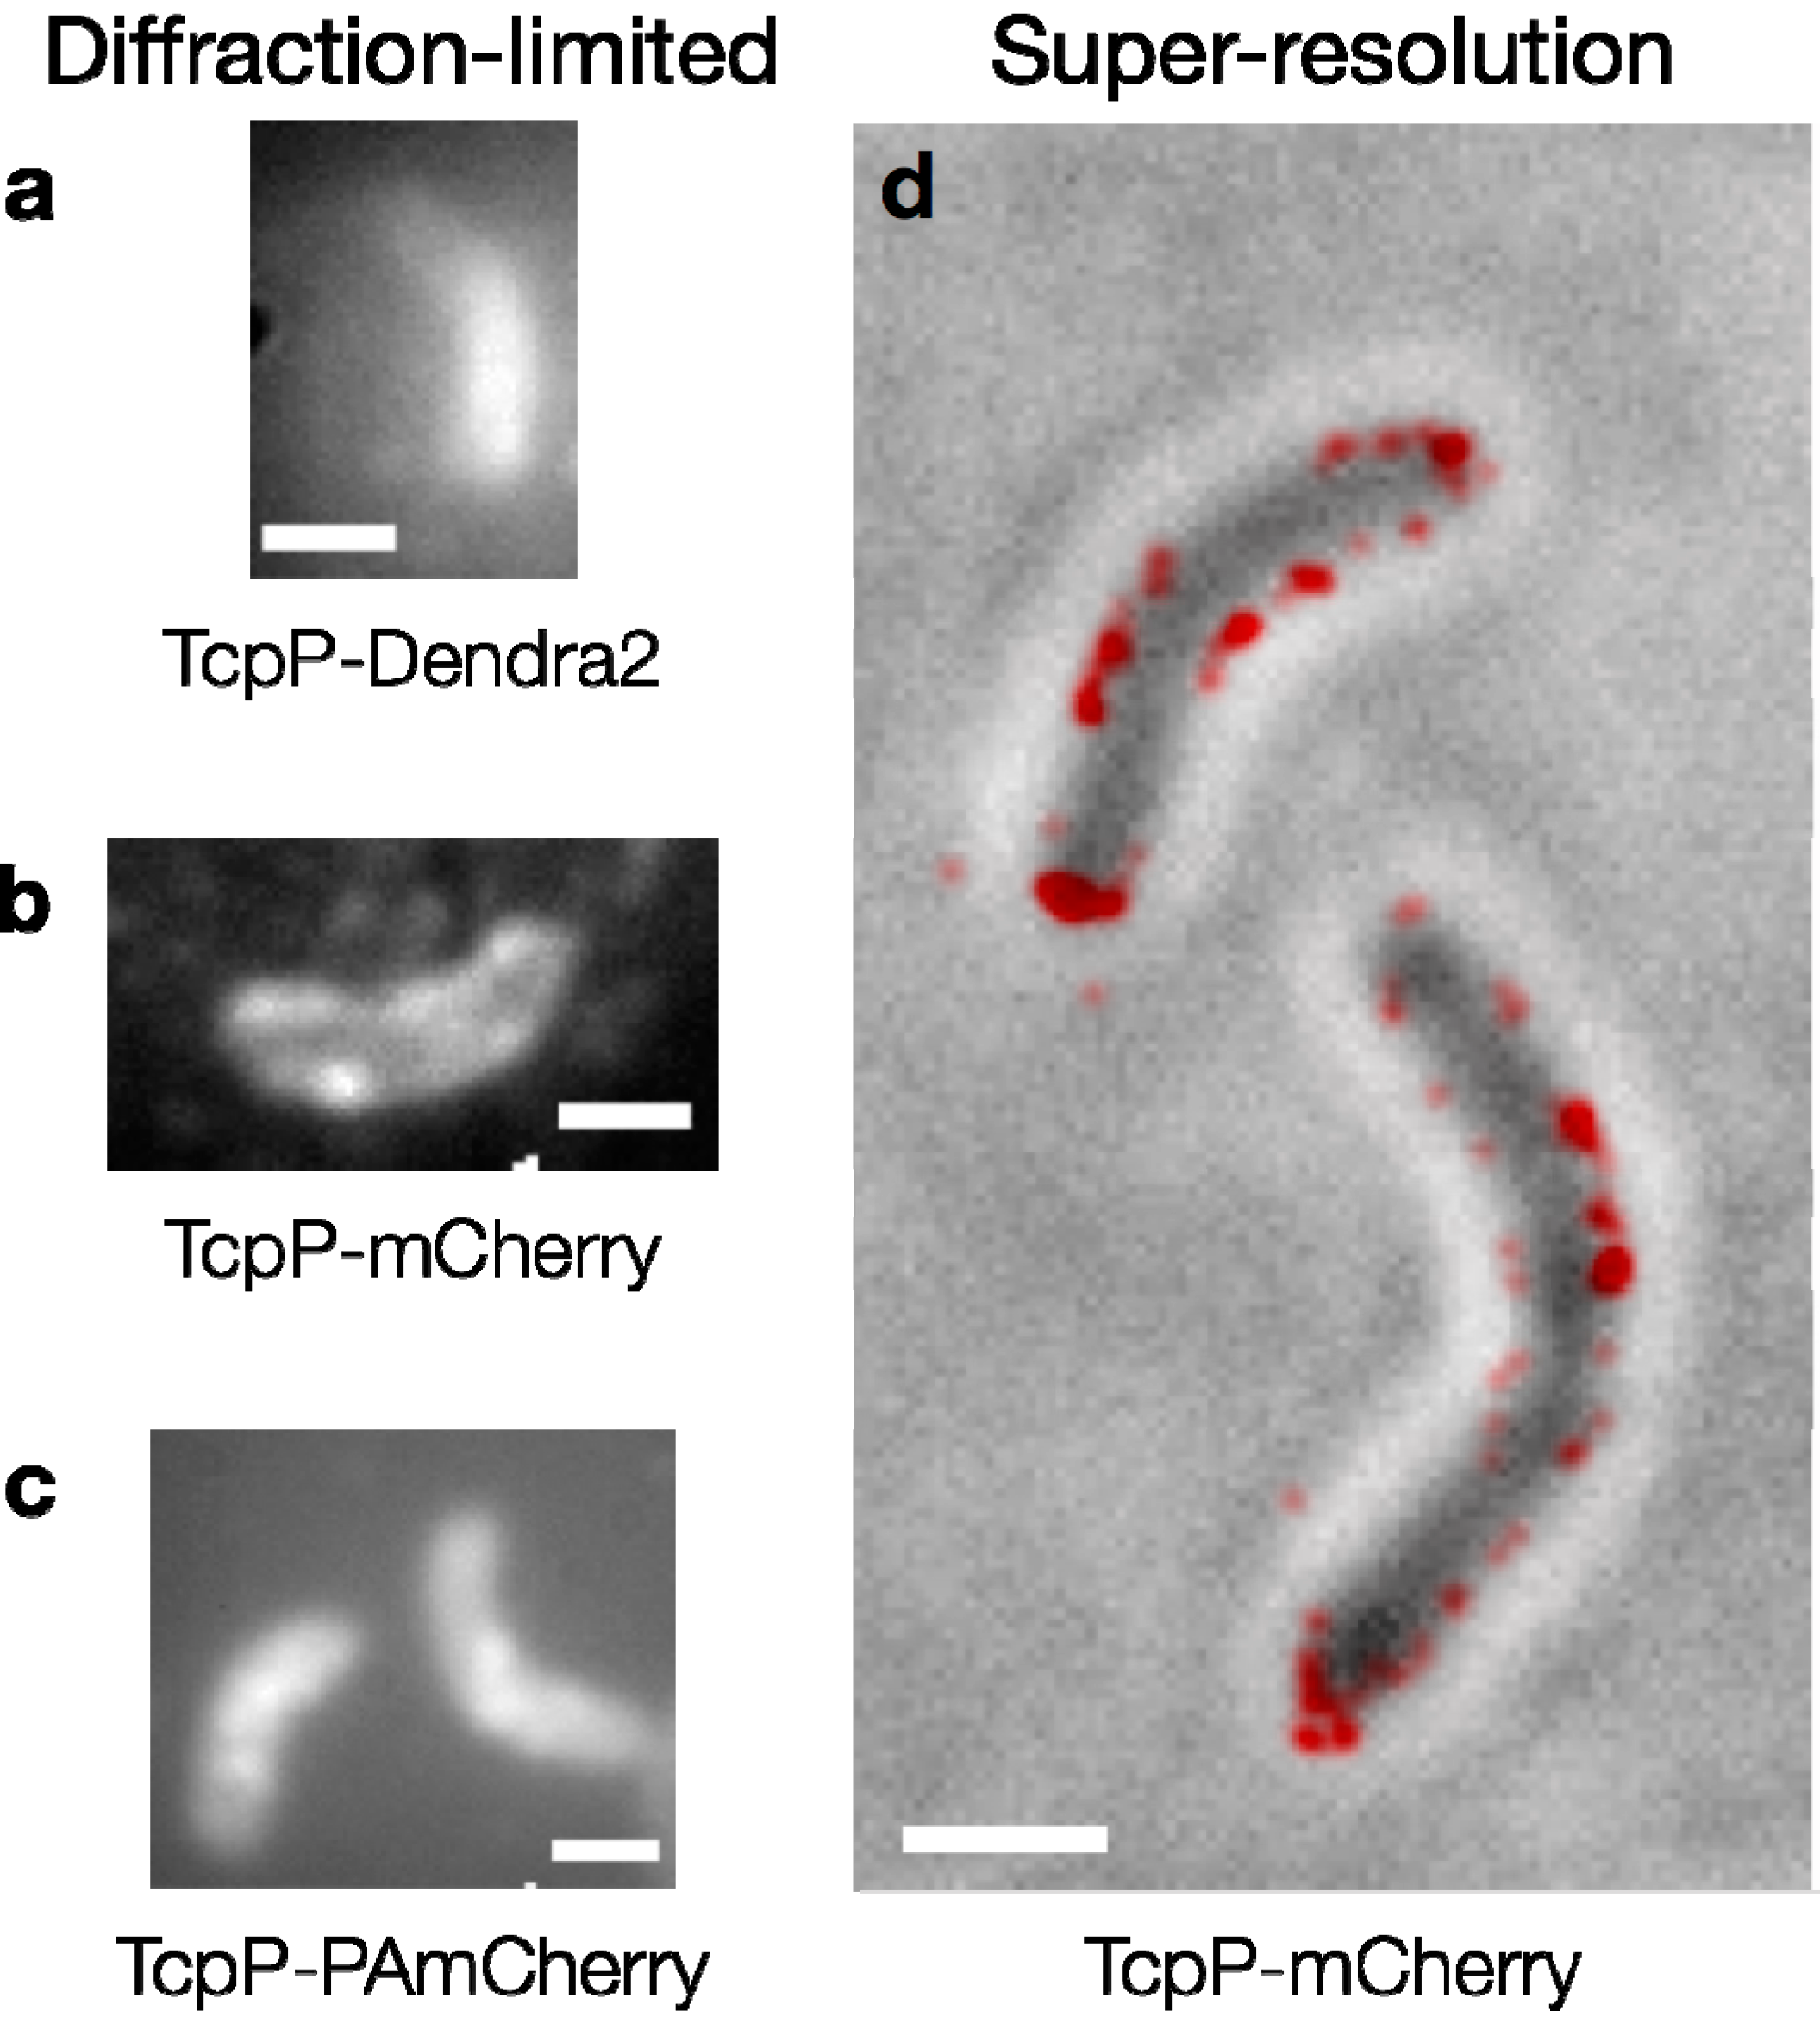
Fluorescent proteins in V. cholerae cells. Diffraction-limited fluorescence images of cells expressing (a) TcpP-Dendra2; (b) TcpP-mCherry and (c) TcpP-PAmCherry. Individual TcpP-Dendra2 molecules are not observed, and the cells in (a) are dimmer than those in (b) and (c). Bright foci are seen in the cells expressing TcpP-mCherry and TcpP-PAmCherry (b, c). Image acquisition times: 2–5 s; (d) TcpP-mCherry localizes to the cell membrane. Red: super-resolution image (based on 98 100-ms imaging frames) reconstructed from sequential localizations blurred to the 95% confidence intervals of each fit. This PALM image is plotted on top of a reverse-contrast bright field image of the cells (grey). Scale bars: 1 µm.
Figure 5.
Fluorescent proteins in V. cholerae cells. Diffraction-limited fluorescence images of cells expressing (a) TcpP-Dendra2; (b) TcpP-mCherry and (c) TcpP-PAmCherry. Individual TcpP-Dendra2 molecules are not observed, and the cells in (a) are dimmer than those in (b) and (c). Bright foci are seen in the cells expressing TcpP-mCherry and TcpP-PAmCherry (b, c). Image acquisition times: 2–5 s; (d) TcpP-mCherry localizes to the cell membrane. Red: super-resolution image (based on 98 100-ms imaging frames) reconstructed from sequential localizations blurred to the 95% confidence intervals of each fit. This PALM image is plotted on top of a reverse-contrast bright field image of the cells (grey). Scale bars: 1 µm.
The desirable properties of a label depend on the goals of the experiment. In our
V. cholerae investigations, the FP mCherry blinked (
i.e., switched from a bright state to a dark state) on the same timescale as our imaging (50 ms/frame), leading us to observe extremely short TcpP-mCherry trajectories, thus precluding quantitative measurements of the TcpP diffusion coefficient. On the other hand, these fluctuations in mCherry fluorescence were advantageous for creating PALM super-resolution images of all TcpP positions. By observing blinking TcpP-mCherry under 561-nm excitation, we achieved single-molecule levels of fluorescence without photoactivation simply based on the intermittent mCherry fluorescence, and we demonstrated that the TcpP-mCherry fusion is localized to the cell membrane (
Figure 5(d)). This blinking behavior may be an example of temporary quenching, sometimes termed “kindling,” which is attributed to a
cis–
trans isomerization of the chromophore [
84]. Such blinking is known to occur in mCherry and a handful of other proteins, even at low excitation powers [
71,
84,
85].
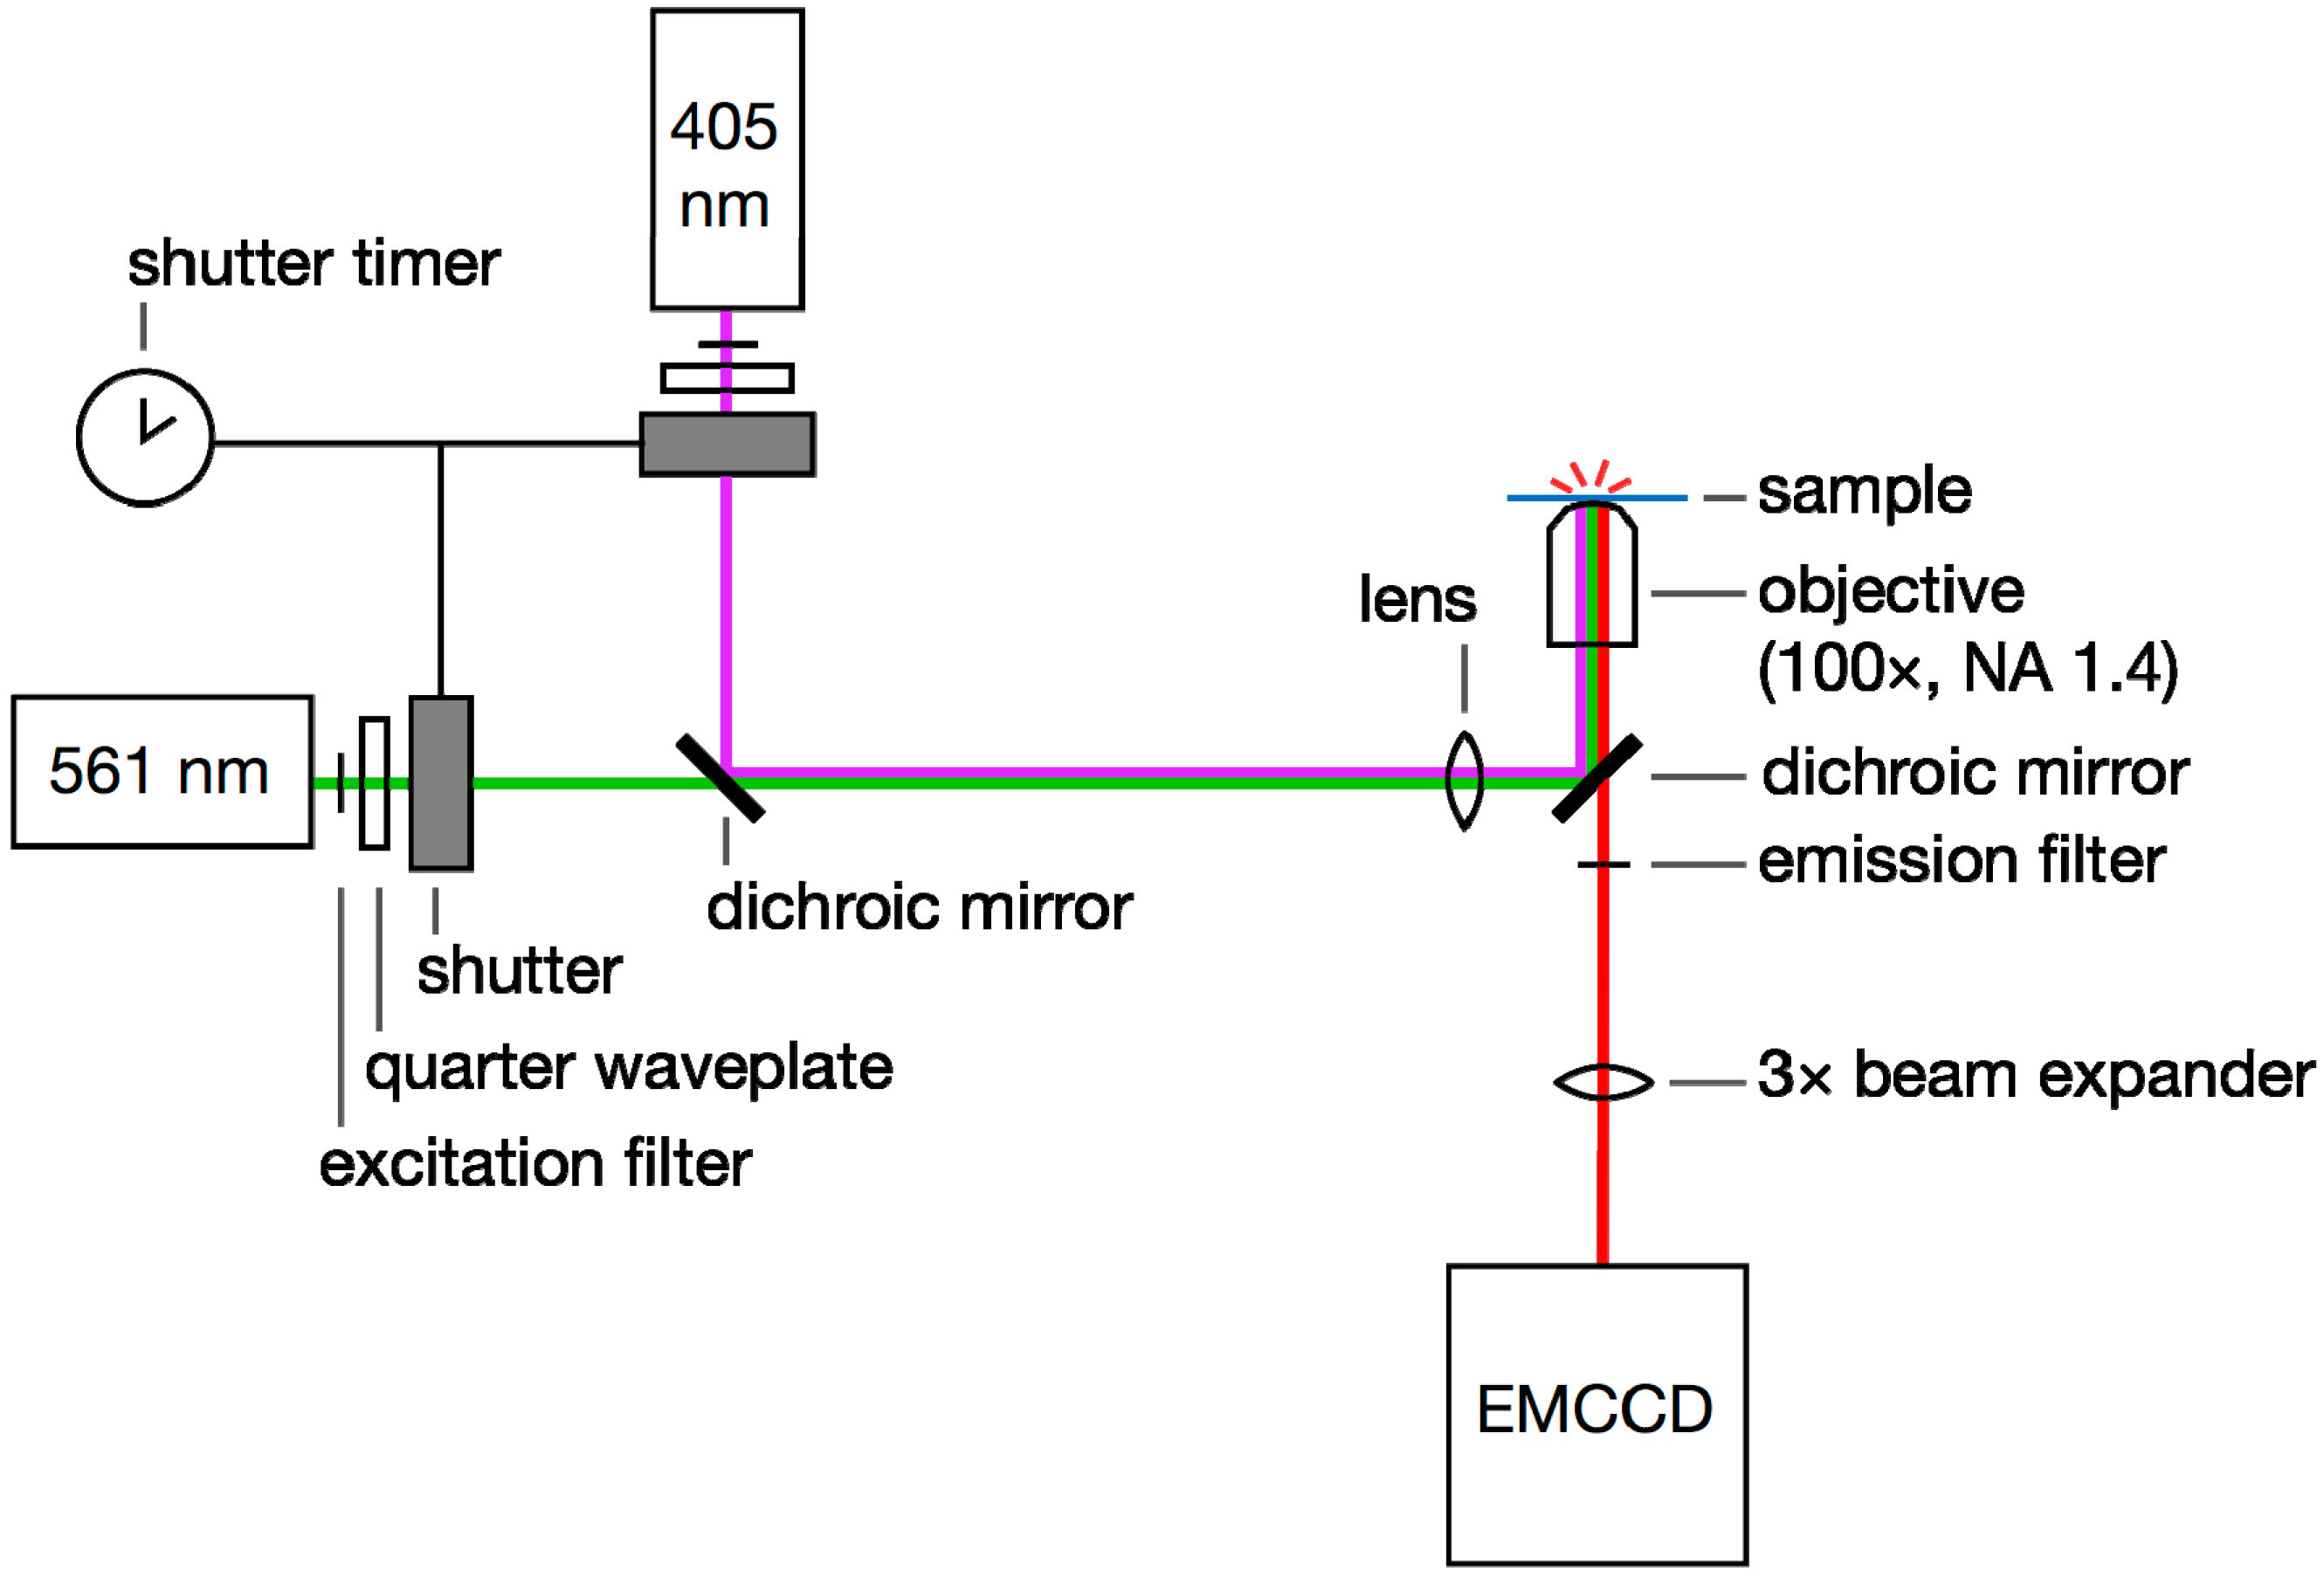
In our experience, the PAmCherry fluorescence was more consistent than mCherry fluorescence, and furthermore, PAmCherry emission could be controlled based on photo-activation with careful doses of 405-nm laser illumination. On the other hand, imaging PAmCherry requires a more complicated and expensive optical setup than mCherry experiments: a second (activation) laser (405 nm) must be coaligned with the imaging laser (561 nm;
Figure 6). It has also been reported recently that only 4%–50% of PAmCherry molecules photoactivate into a fluorescent state [
74,
86]. Though this effect could not be measured in our experiments, we do not believe that inactive TcpP-PAmCherry affected our trajectory analysis, since we observe dozens of molecular trajectories per cell, and there should therefore be a sufficient number of activated molecules to represent the various modes of TcpP motion present. Certainly, however, inactivatable fluorophores could lead to underestimates in experiments designed to count molecules, and present additional challenges for satisfying the Nyquist–Shannon sampling theorem in high-resolution PALM experiments [
87,
88].
Figure 6.
Single-molecule super-resolution imaging setup. 405- and 561-nm laser light is selected with excitation filters, circularly polarized with quarter waveplates, and controlled with a pair of shutters. The beams are coupled with a dichroic mirror. The laser beams are focused onto the back aperture of a high-NA microscope objective and the sample is excited by epi-illumination. Emitted fluorescence is filtered using an emission filter and a second dichroic. This emission is magnified with a beam expander if required and then detected on an EMCCD camera.
Another consideration when using FPs to label cellular components is the FP maturation time. Before a protein will fluoresce, it must fold properly and be oxidized to form the chromophore [
8]. Typical maturation times are around 40 minutes, but depending on pH, temperature, and the specific FP, some may take multiple hours to mature [
71,
73,
82]. Conversely, particularly fast-maturing proteins, such as the yellow FP Venus, take less than 10 minutes to mature [
89]. For live-cell imaging in non-model systems, it is important to note that the chromophore formation step in GFP and DsRed derivatives requires the presence of oxygen, and therefore these traditional FPs are incompatible with obligate anaerobes.
2.3. Small-Molecule Dyes
Organic dye molecules have the advantage of being much brighter and more stable than fluorescent proteins and much smaller than biological molecules of interest [
73,
83]. The addition of a small dye molecule is unlikely to hinder protein diffusion, and with many more photons emitted before photobleaching from a dye than from a fluorescent protein, the position of an organic dye can be determined with better precision than a fluorescent protein [
11]. However, small-molecule dyes are not genetically encodable and therefore must be incorporated into the cell in some other way. Not all dyes can permeate the membrane: rhodamine dyes can pass through many bacterial membranes, but only inefficiently, while sulfonated cyanine dyes are unable to cross into bacteria cells at all [
70]. Endocytosis and microinjection, which are used to introduce dyes to eukaryotic cells, are not available for bacterial cells. Membrane permeabilization must be used instead, though certain permeabilization methods cause artifacts [
90].
To label a specific protein with an organic dye, the protein must be engineered to incorporate a motif to which the dye molecule will bind to covalently, such as the FlAsH, HaloTag and SNAP-tag systems, among others [
70,
91,
92,
93]. In addition, since the free dye can bind nonspecifically elsewhere in the cell, most dye-labeling schemes are limited in their specificity, and all must be accompanied by washing steps to remove excess, unbound dye from the cell [
70]. Very few organic dyes are photoactivatable [
94], which also limits the ability to control the fluorescence. In fixed-cell imaging, reducing buffers can produce photoswitching, but most such buffers are cytotoxic [
95,
96].
For fixed-cell studies, fluorescently-tagged antibody labels [
70] can target specific proteins. Such immunofluorescence imaging can complement live-cell studies; for example, to check the specificity of other labeling schemes [
97]. However, antibodies are very bulky linkers, and, particularly when secondary antibodies are used, the fluorophore may be tens of nanometers away from the point of interest, adding to the uncertainty in the target position (
Figure 3). Antibodies may also bind to multiple molecules, producing artificial clustering of the molecule of interest [
70]. Despite these disadvantages, antibody labeling of bacterial surfaces or fixed cells can be a worthwhile complement to live-cell single-molecule microscopy, validating the localizations observed with other methods.
Enzymatic dye labeling schemes have been used for single-molecule microscopy in eukaryotes [
70], but applications of such schemes to proteins inside live bacteria are limited to date because it is hard to get dye into these cells [
98,
99]. Recent examples include single extracellular membrane proteins in the
Bacteroides thetaiotaomicron gut symbiont using both enzymatic and antibody dye labeling [
97]. We have also used dye molecules to label sugars in biological systems. For example, in investigating the interaction between the
B. thetaiotaomicron outer membrane starch utilization system (Sus) proteins and the carbohydrate amylopectin, which the Sus proteins capture and catabolize, amylopectin was labeled with AlexaFluor 488 and the SusG protein was fused to the Halo enzyme for labeling with a fluorescent HaloTag [
97]. Antibody labels interfere with the starch–Sus protein interaction, so these small-molecule dyes were well-suited to these investigations.
2.4. Other Labeling Schemes
Several alternatives to fluorescent proteins and small-molecule dyes are being developed for single-molecule imaging in live bacteria. One exciting avenue is the incorporation of unnatural amino acids (UAAs [
100]) into target proteins. Like fluorescent protein fusions, UAAs can be highly specific, genetically encodable handles. The desired UAA is encoded by a nonsense (“amber”) stop codon, which is recognized by an orthogonal tRNA–tRNA synthetase pair. Due to their small size, UAAs can be minimally perturbative, though the protein modification site must be selected to avoid truncation at the modification site [
69,
100].
The fluorescent coumarin amino acid (emission λ
max = 464 nm [
101]) has been used to label the chaperonin GroEL in
E. coli FRAP studies [
100]. Other fluorescent amino acids with a variety of fluorescent properties have also been synthesized [
102]. An alternative strategy to using intrinsically fluorescent UAAs is to use UAAs to incorporate functional groups (e.g., ketones, azides or alkynes) into a protein, enabling specific, covalent attachment of organic dyes through bio-orthogonal reactions [
69,
103,
104,
105,
106]. A live cell-compatible demonstration of the use of UAAs and click chemistry for single-molecule microscopy has recently been reported [
107]; this may provide a promising alternative to fluorescent protein labeling. Click chemistry has also been used to achieve high-density labelling of cellular DNA and RNA for super-resolution imaging [
107,
108].
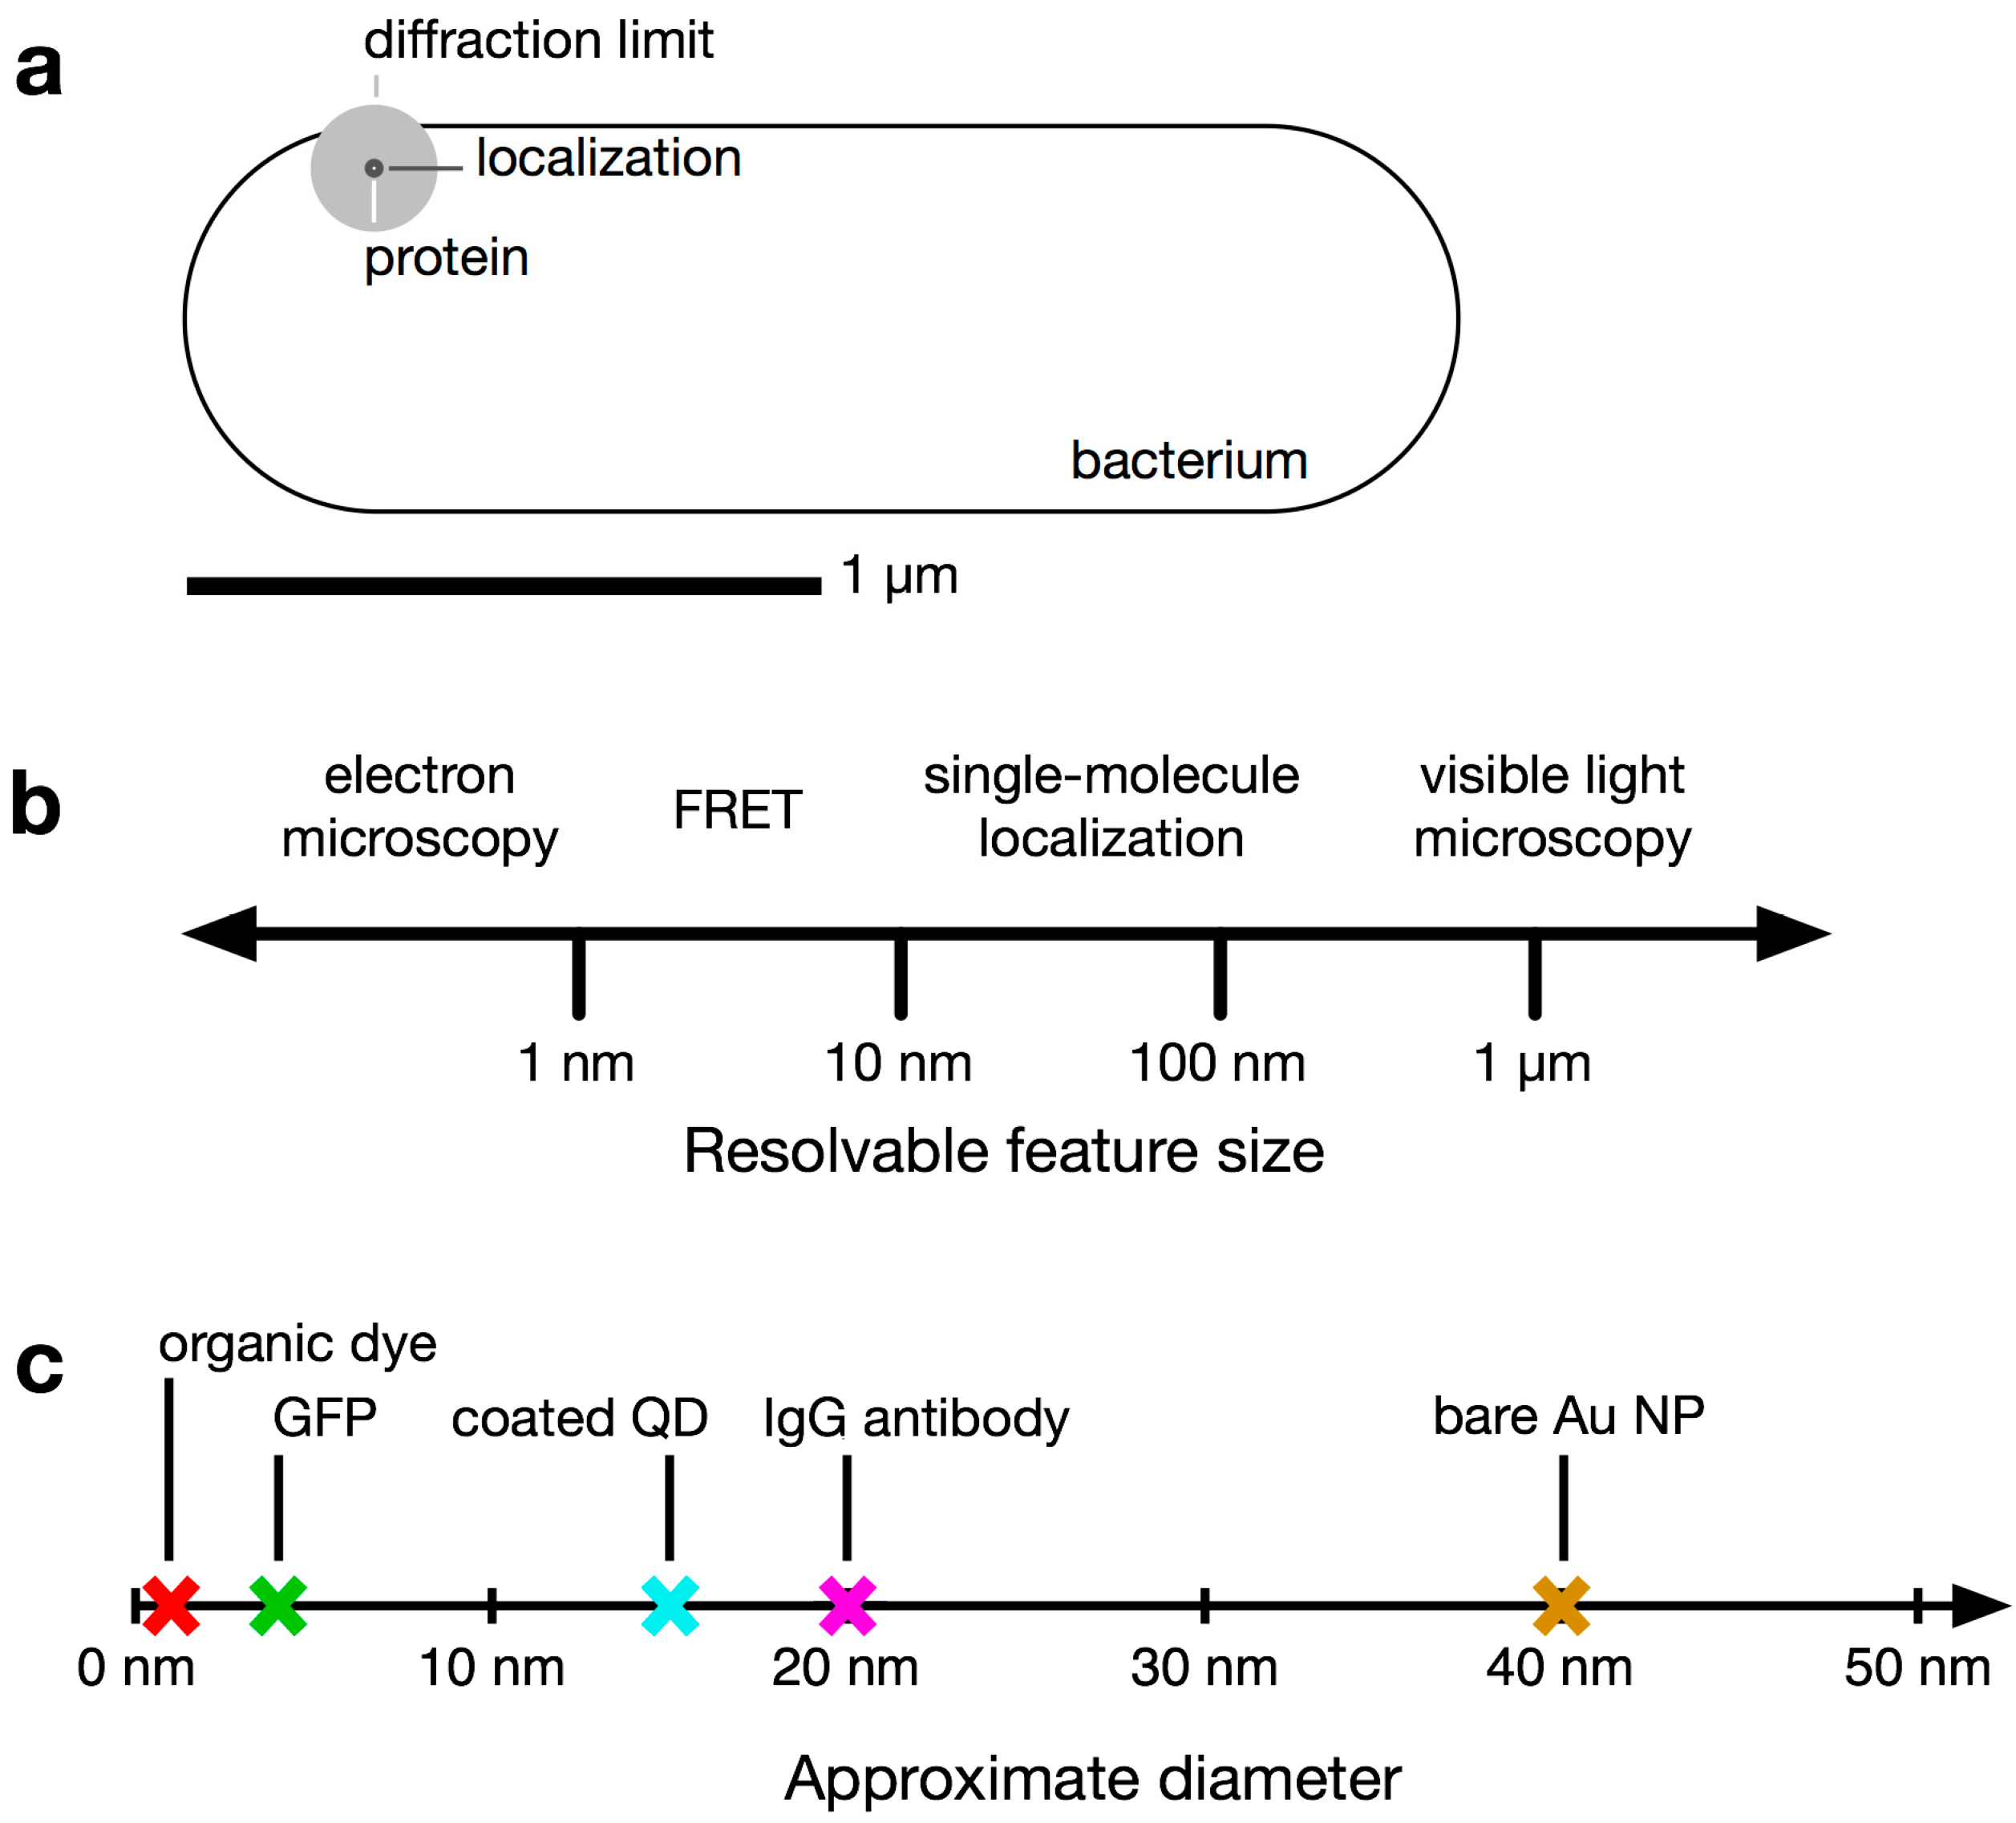
Quantum dots and nanoparticles have also been used for labeling proteins, though rarely in super-resolution studies [
64,
109]. Although only nanometers in size, they are quite large compared to the labels described above (
Figure 1c [
64,
110]). Nanoparticles are also difficult to get into cells without endocytosis, so their use in bacteria is are generally restricted to studies of the outer membrane and cell surface [
64,
109,
111]. Because diffusion is inversely related to particle size, these nanoscale labels may slow the dynamics of the molecules whose motions they report [
64,
65]. Still, the main advantage of quantum dots and nanoparticles is that they have much longer photobleaching lifetimes than fluorescent proteins or small-molecule dyes, allowing longer-term observations, though quantum dots are also known to blink [
9,
112].


 ,
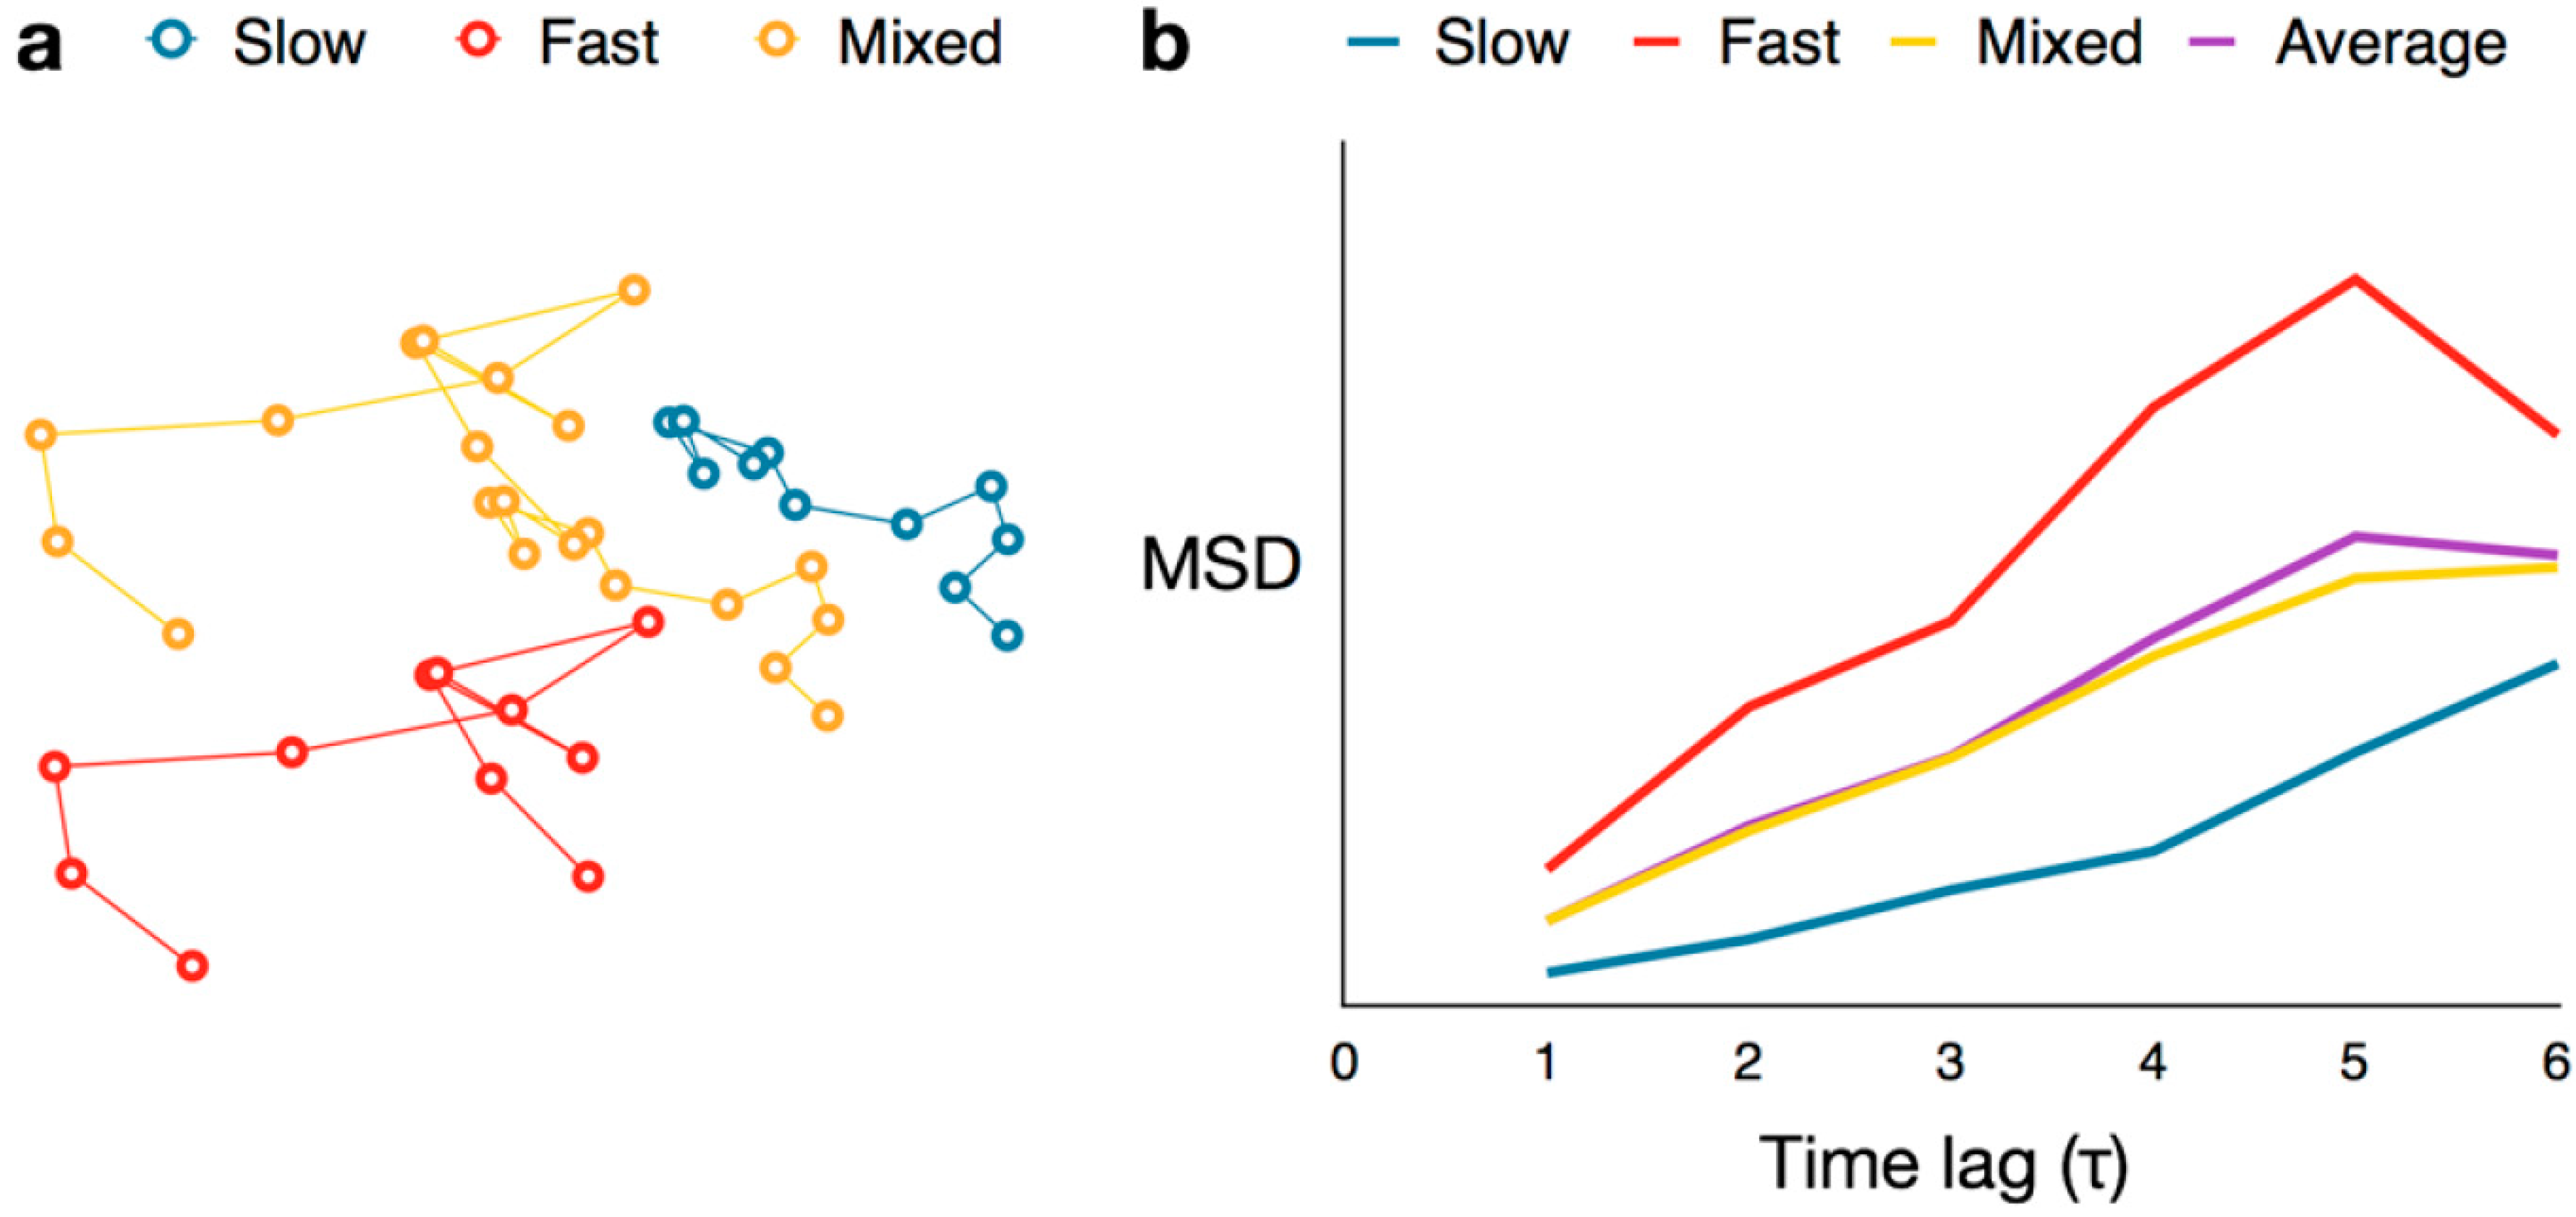
,  , etc.). The MSD values are then plotted as in single-molecule MSD analysis, and the diffusion coefficient for each population is calculated from the slopes of these curves, as described above (Equation (1)). For both single-molecule MSD and CPD analysis of TcpP diffusion in V. cholerae, we included only trajectories with at least 10 frames, removing very noisy datasets from consideration.
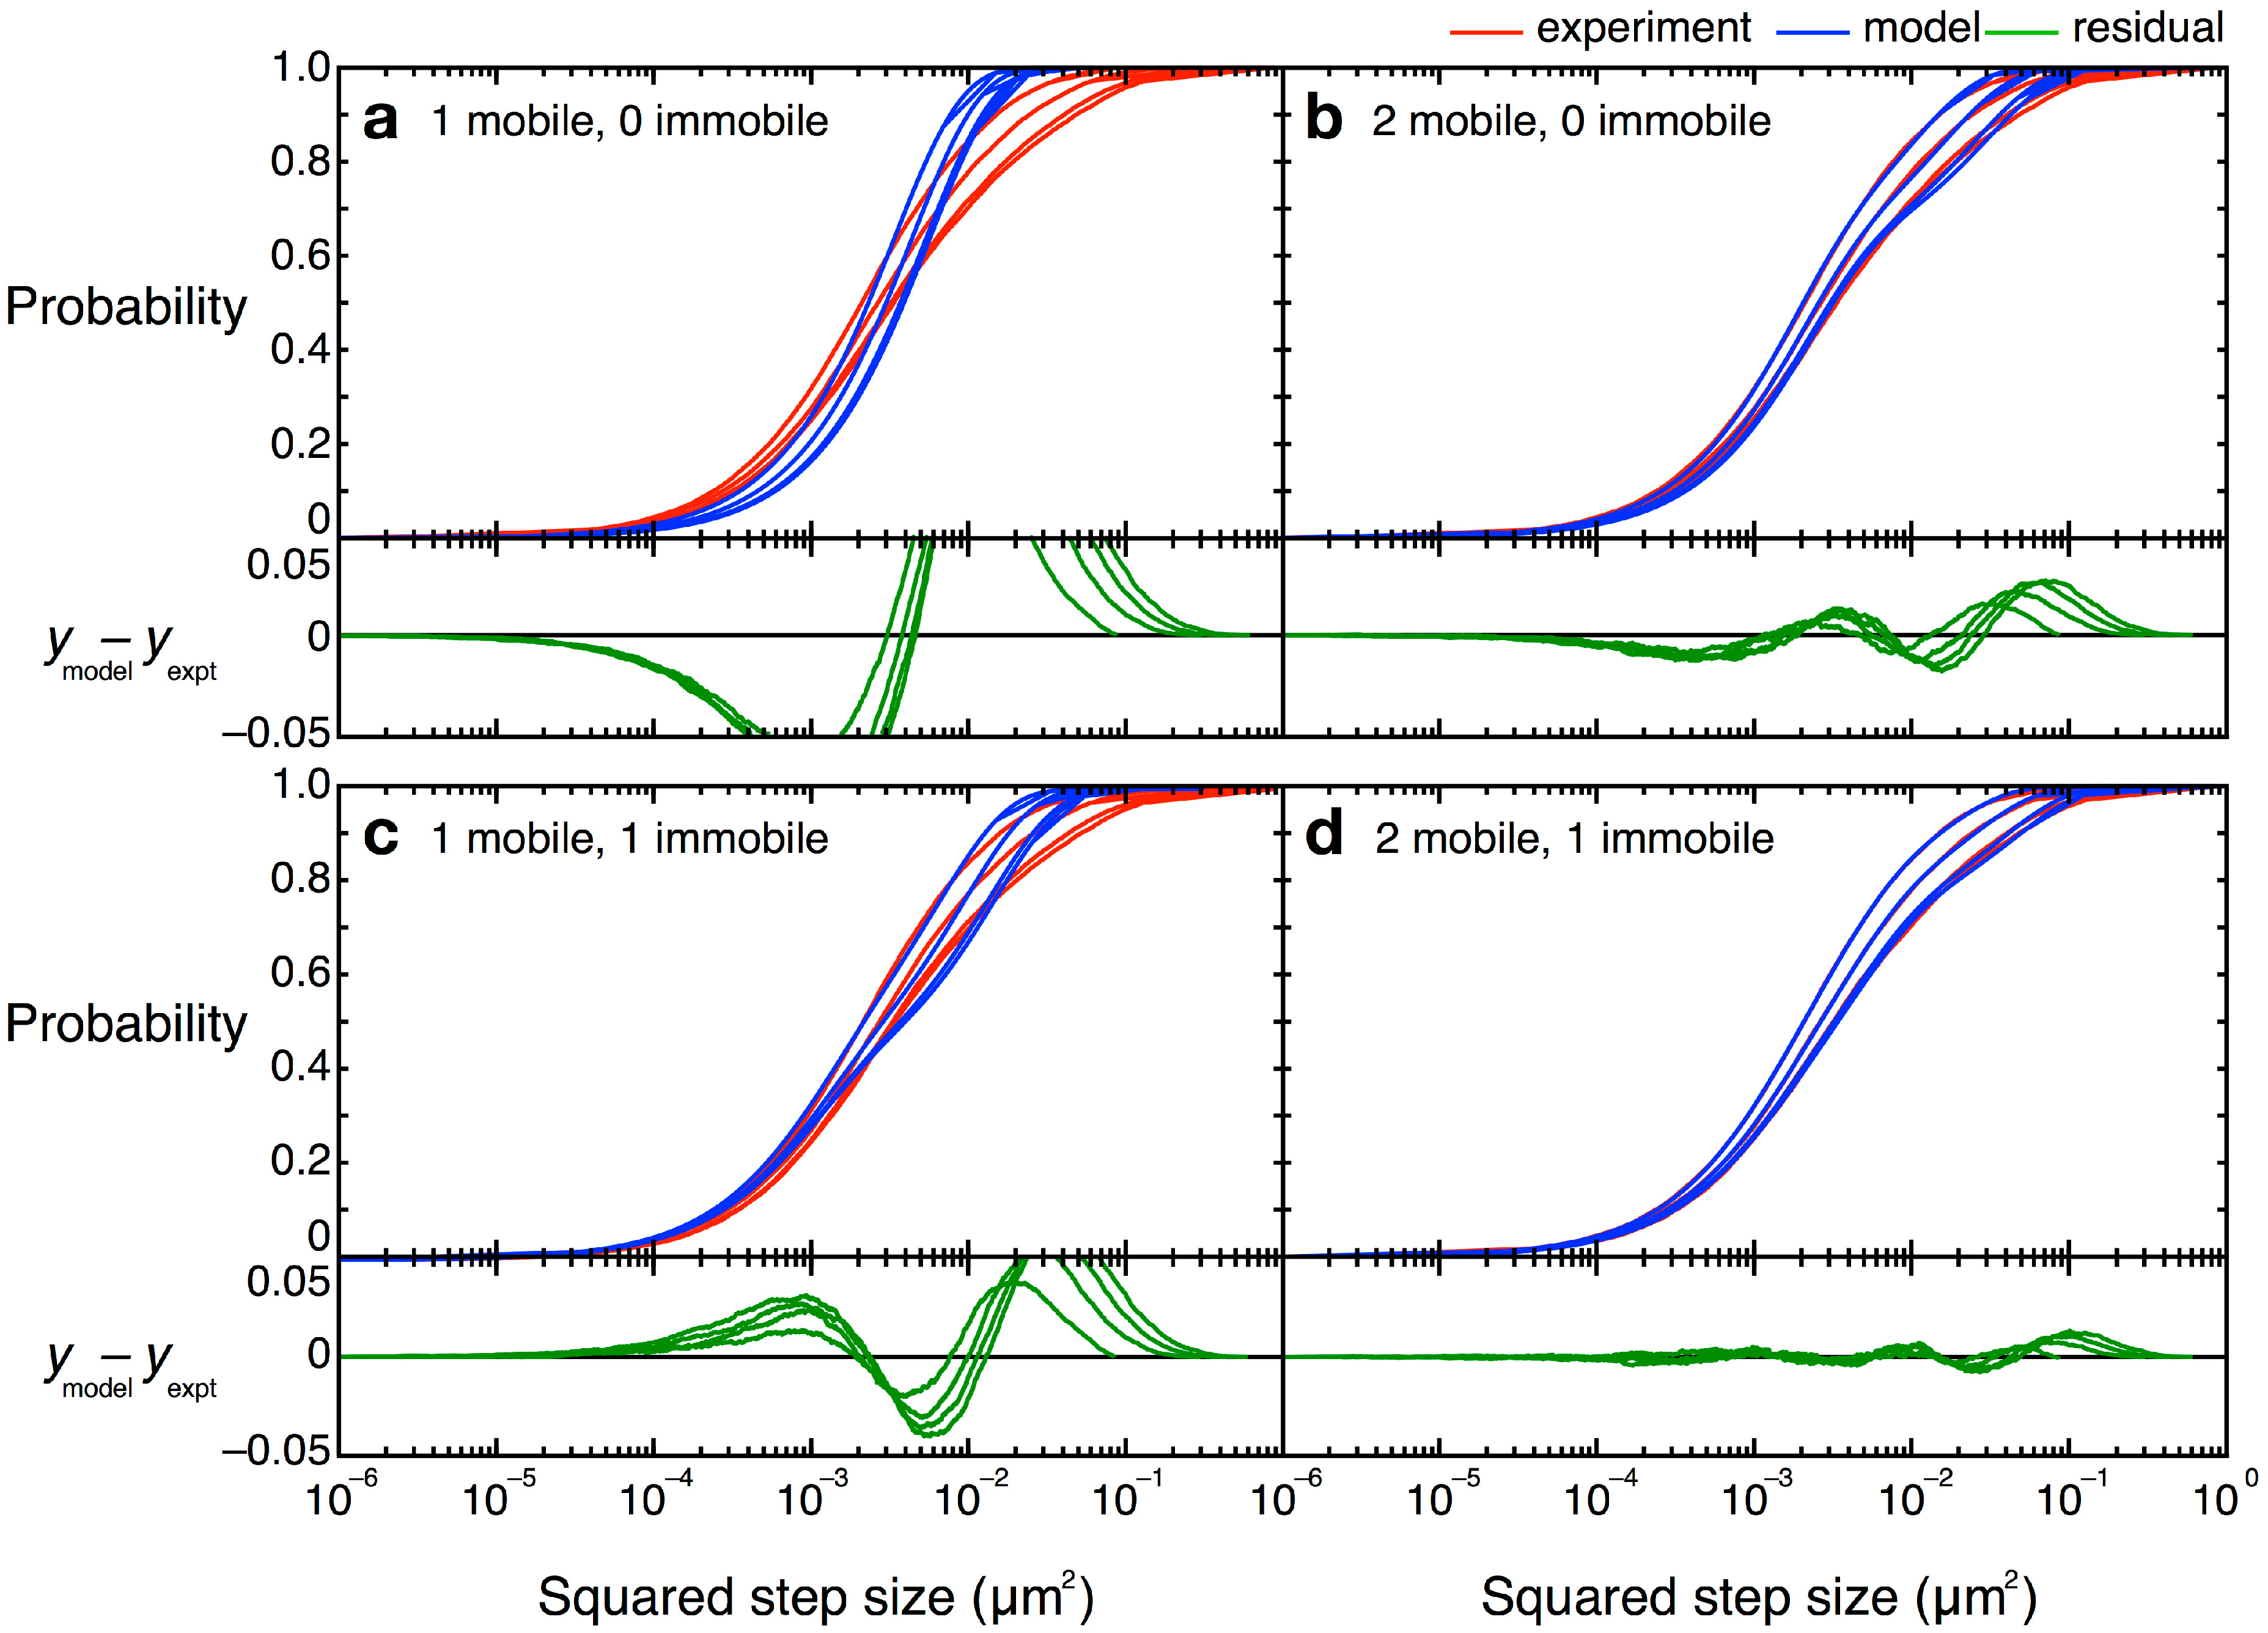
 = 0 µm2∕s) within our resolution (σ = 30 nm). Simpler models, with only one or two terms, did not describe the data well (Figure 12). Unfortunately, though the CPD analysis could reveal the system heterogeneity, this stepwise analysis does not permit individual proteins to be classified into a specific population. The best-fit model allowed us to determine that, at any given time, 22% of TcpP-PAmCherry molecules in a ΔtcpP TcpP-PAmCherry strain are in the immobile population, but the aggregation of all trajectory data prevents us from determining which specific molecules are immobilized, or to which trajectories they belong. On the other hand, single-molecule MSD analysis could not give us such clear information about the population heterogeneity.