1. Introduction
Technical lignin is one of the most abundant bioresources available for industrial application, with a global production of roughly 100 Mt/y [
1]. It is a natural polymer featuring a wide variety of bonds and functional groups, although it is formed mainly from three precursors only, coumaryl, coniferyl and sinapyl alcohol [
2]. Technical lignin, which arises as a by-product of the pulp and paper industry, was until recently used for fuel production mainly, but other applications for, e.g., binders or dispersants [
3,
4] and pharmaceutical and biomedical applications [
5,
6] are upcoming. Especially carbonization of lignin opens new possibilities for the production of, e.g., lignin-based carbon fibers [
7], lignin-based carbon nanotubes [
8] or carbon black [
9,
10], of which carbon black has clearly the largest market. Carbon black is derived on industrial scale from aromatic oils rich in hydrocarbons or from hydrocarbons directly [
11], sometimes from other sources, like, e.g., carbides [
12]. Carbon black has a wide field of applications, ranging from pigments and reinforcing filler materials for stability or enhanced electrical conductivity [
13] to new energy applications like supercapacitors, batteries or even solar devices [
11,
12]. The applicability of carbon materials is highly dependent on material properties like electrical conductivity, porosity and pore size [
12,
14]. To enable applications of carbonized lignin as a substitute for carbon black from other sources, detailed knowledge of its properties is required. Lignin-based carbons are often characterized chemically or by spectroscopical means only [
15], but little has been reported about morphology, including porosity [
16,
17]. The pore size in the nm range was, e.g., measured for activated carbons derived from lignin by N
2 and CO
2 sorption [
18]. Anyhow, in most of the previous studies, small-angle X-ray scattering (SAXS) is often not considered, even though SAXS provides a powerful method for investigation of structure and morphology on the nanoscale. For instance, it was used to study pore volume fractions of micro- and mesopores of porous powders from CaCo
3 [
19]. It was also used in combination with small-angle neutron scattering to investigate pores in disordered porous carbon, where special care was taken of the evaluation procedure related to the porous nature of the graphitic material [
20]. The necessity of SAXS to access buried porosity was shown, e.g., with the characterization of disordered carbons [
21]. With the possibility of pore characterization, the method also features as an easily applicable tool to follow pore development, e.g., changing materials anisotropy and changing structural features in activated carbons from wood [
22], the development of porosity in deposited charcoal [
23], the charcoal properties dependent on pyrolysis temperature [
24] or the change of aggregates in carbon black pastes with aging [
25].
Recently, we reported on the production of micro-sized carbon black particles from different lignin sources, for which the applicability for electrically conductive polymer [
26,
27] or cellulose nanopaper [
28] was investigated. In these publications, the focus was on the carbonization, the chemistry and the electrical properties of resulting polymers. In the present publication, we intend to follow up on the morphology with special respect to porosity of these lignin-based carbon particles. To this purpose, we applied SAXS together with wide-angle X-ray diffraction (WAXD) and complemented these techniques with scanning electron microscopy (SEM) and Fourier-transform infrared spectroscopy (FTIR). Some samples were additionally characterized by mercury porosimetry. The lignin samples were heat-treated at different elevated temperatures in order to carbonize and subsequently partially graphitize the material. The process is expected to change the materials morphology, especially the nanopores, but the question was, how the type of lignin influences the carbon black porosity at elevated temperatures and whether or not temperatures up to 2000 °C are required for highly porous materials.
3. Discussion
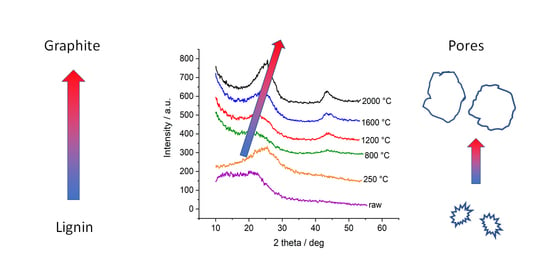
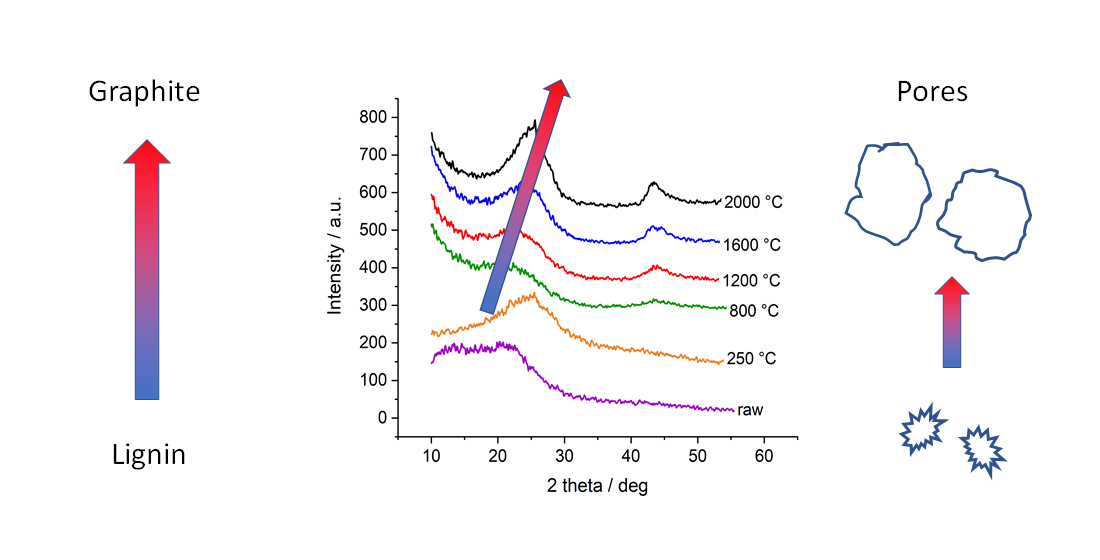
The four different lignins were subjected to thermostabilization and different heat treatment temperatures up to 2000 °C. In WAXD, we observe similar behavior for all four lignins: after thermostabilization, the diffraction curves exhibit a broad peak related to the (002) reflection of graphite. The broad peak indicates a suboptimally ordered structure and possibly comparable small coherently scattering units. With temperatures above 800 °C, the material becomes more and more ordered, peaks shift towards higher scattering angles and narrow down (
Figure 3). As an example, the organosolv peaks shift in position, from 21.3° to 24.9°, which corresponds to a d
002 shifting from 4.17 Å to 3.58 Å, i.e., a decreasing lattice constant. In addition, the FWHM is reduced from 13.9° to 6.3°, which corresponds to an increase in lattice size D
002 in the related direction, i.e., from 0.54 nm to 1.22 nm. By dividing
D002 by
d002, one can estimate the mean number of graphite layers in crystalline ordered stacks, which would thus increase from 1.3 to 3.4 layers. The other lignins exhibit similar changes with slightly different parameters; while
d002 is smaller, the lattice spread is bigger. In general, one observes larger crystalline domains in the (002) direction featuring smaller lattice distance induced by heat treatment (
Figure 4). This effect is documented for many carbon-based materials, from carbon fibers [
41] to graphitic nanosheets [
42] and graphene-like materials [
31]. For lignin-based carbon fibers, a similar decrease in
d002 was observed [
7]:
d002 was reported to be about 3.9 Å after heat treatment at 900 °C and decreased to about 3.5 Å after the 2000 °C treatment. Two effects are likely to account for the changes in the WAXD pattern, an increase in the layer lattice size and a reduction of amorphous and stacking fault contributions. It is suggested by [
43] that an increasing in-plane lattice size in graphite accordingly changes the energetically favorable lattice spacing
d002. Indeed, we observed an emerging (100)/(101)-peak which suggested a spread and organization of the lattice in this direction. While this effect was reported for pure graphite, the less ordered system of thermostabilized lignin (
d002 > 4 Å) will also yield amorphous contributions and less ordered graphite-like arrangements. Thus, the poorly aligned material might dominate the scattering signal at lower temperatures and would thus be mainly responsible for the changes visible.
Figure 3b shows, e.g., that the change in peak shape is mainly due to the fact of reduced intensity towards smaller scattering angles, while the flank of the Gaussian-shaped peak is nearly constant towards high angles at about 25–27°. This indicates that rather larger lattice distances in not well-ordered carbon arrangements are changed towards a better order, while the already ordered structures stay nearly constant. For sure, the emerging (100)/(101)-peak indicates the more graphitic nature of samples treated with temperatures towards 2000 °C. As shown previously [
28], the samples with higher heat treatment temperature show higher electrical conductivity. Thus, the increased electrical conductivity can be related to the more graphitic nature of the material.
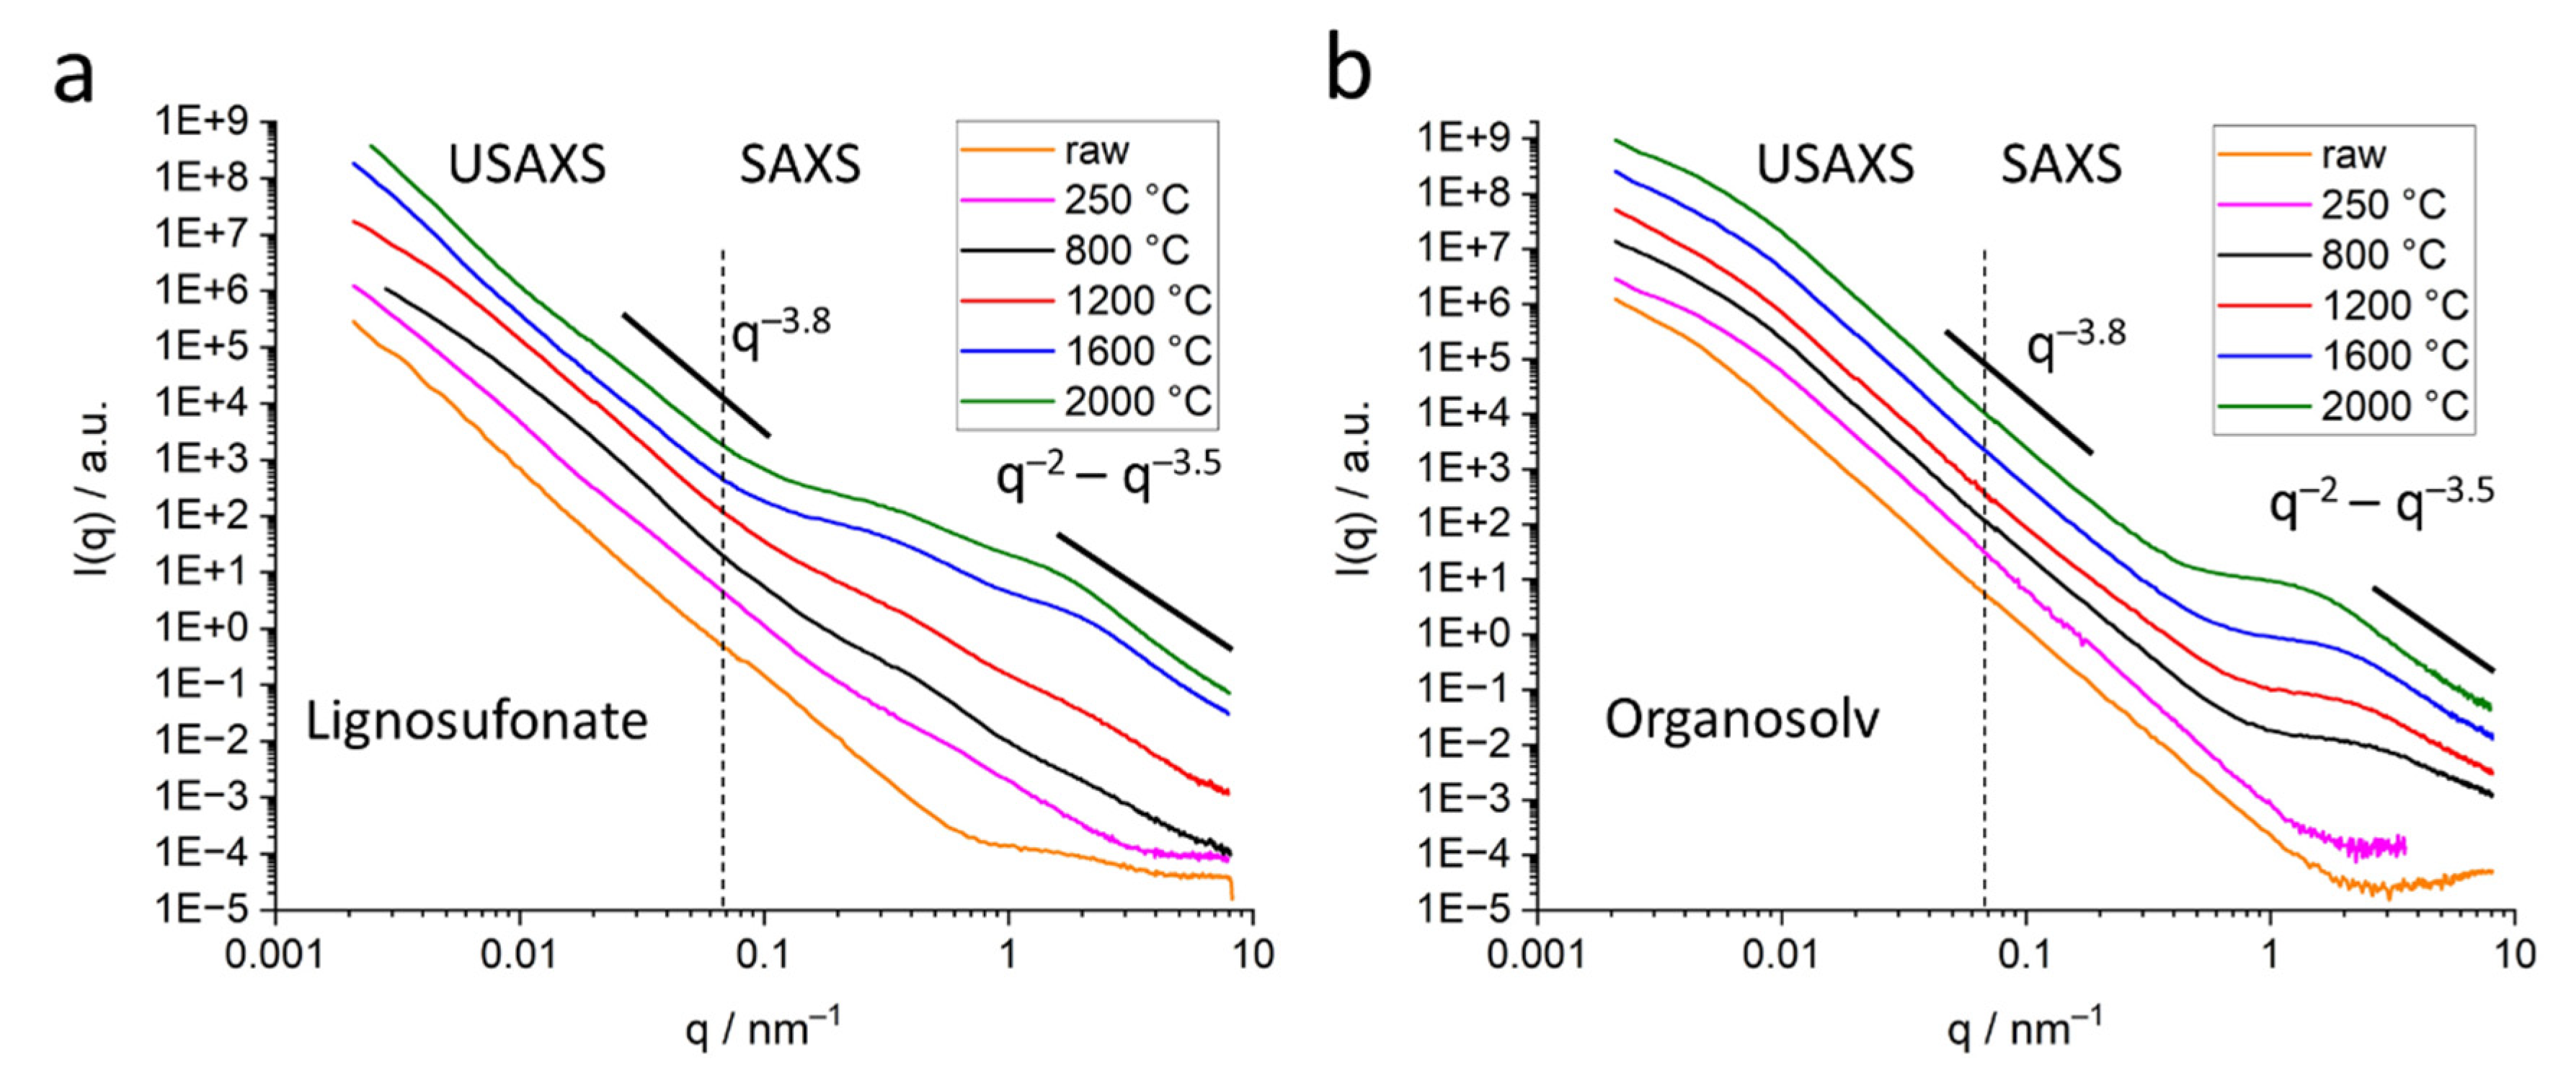
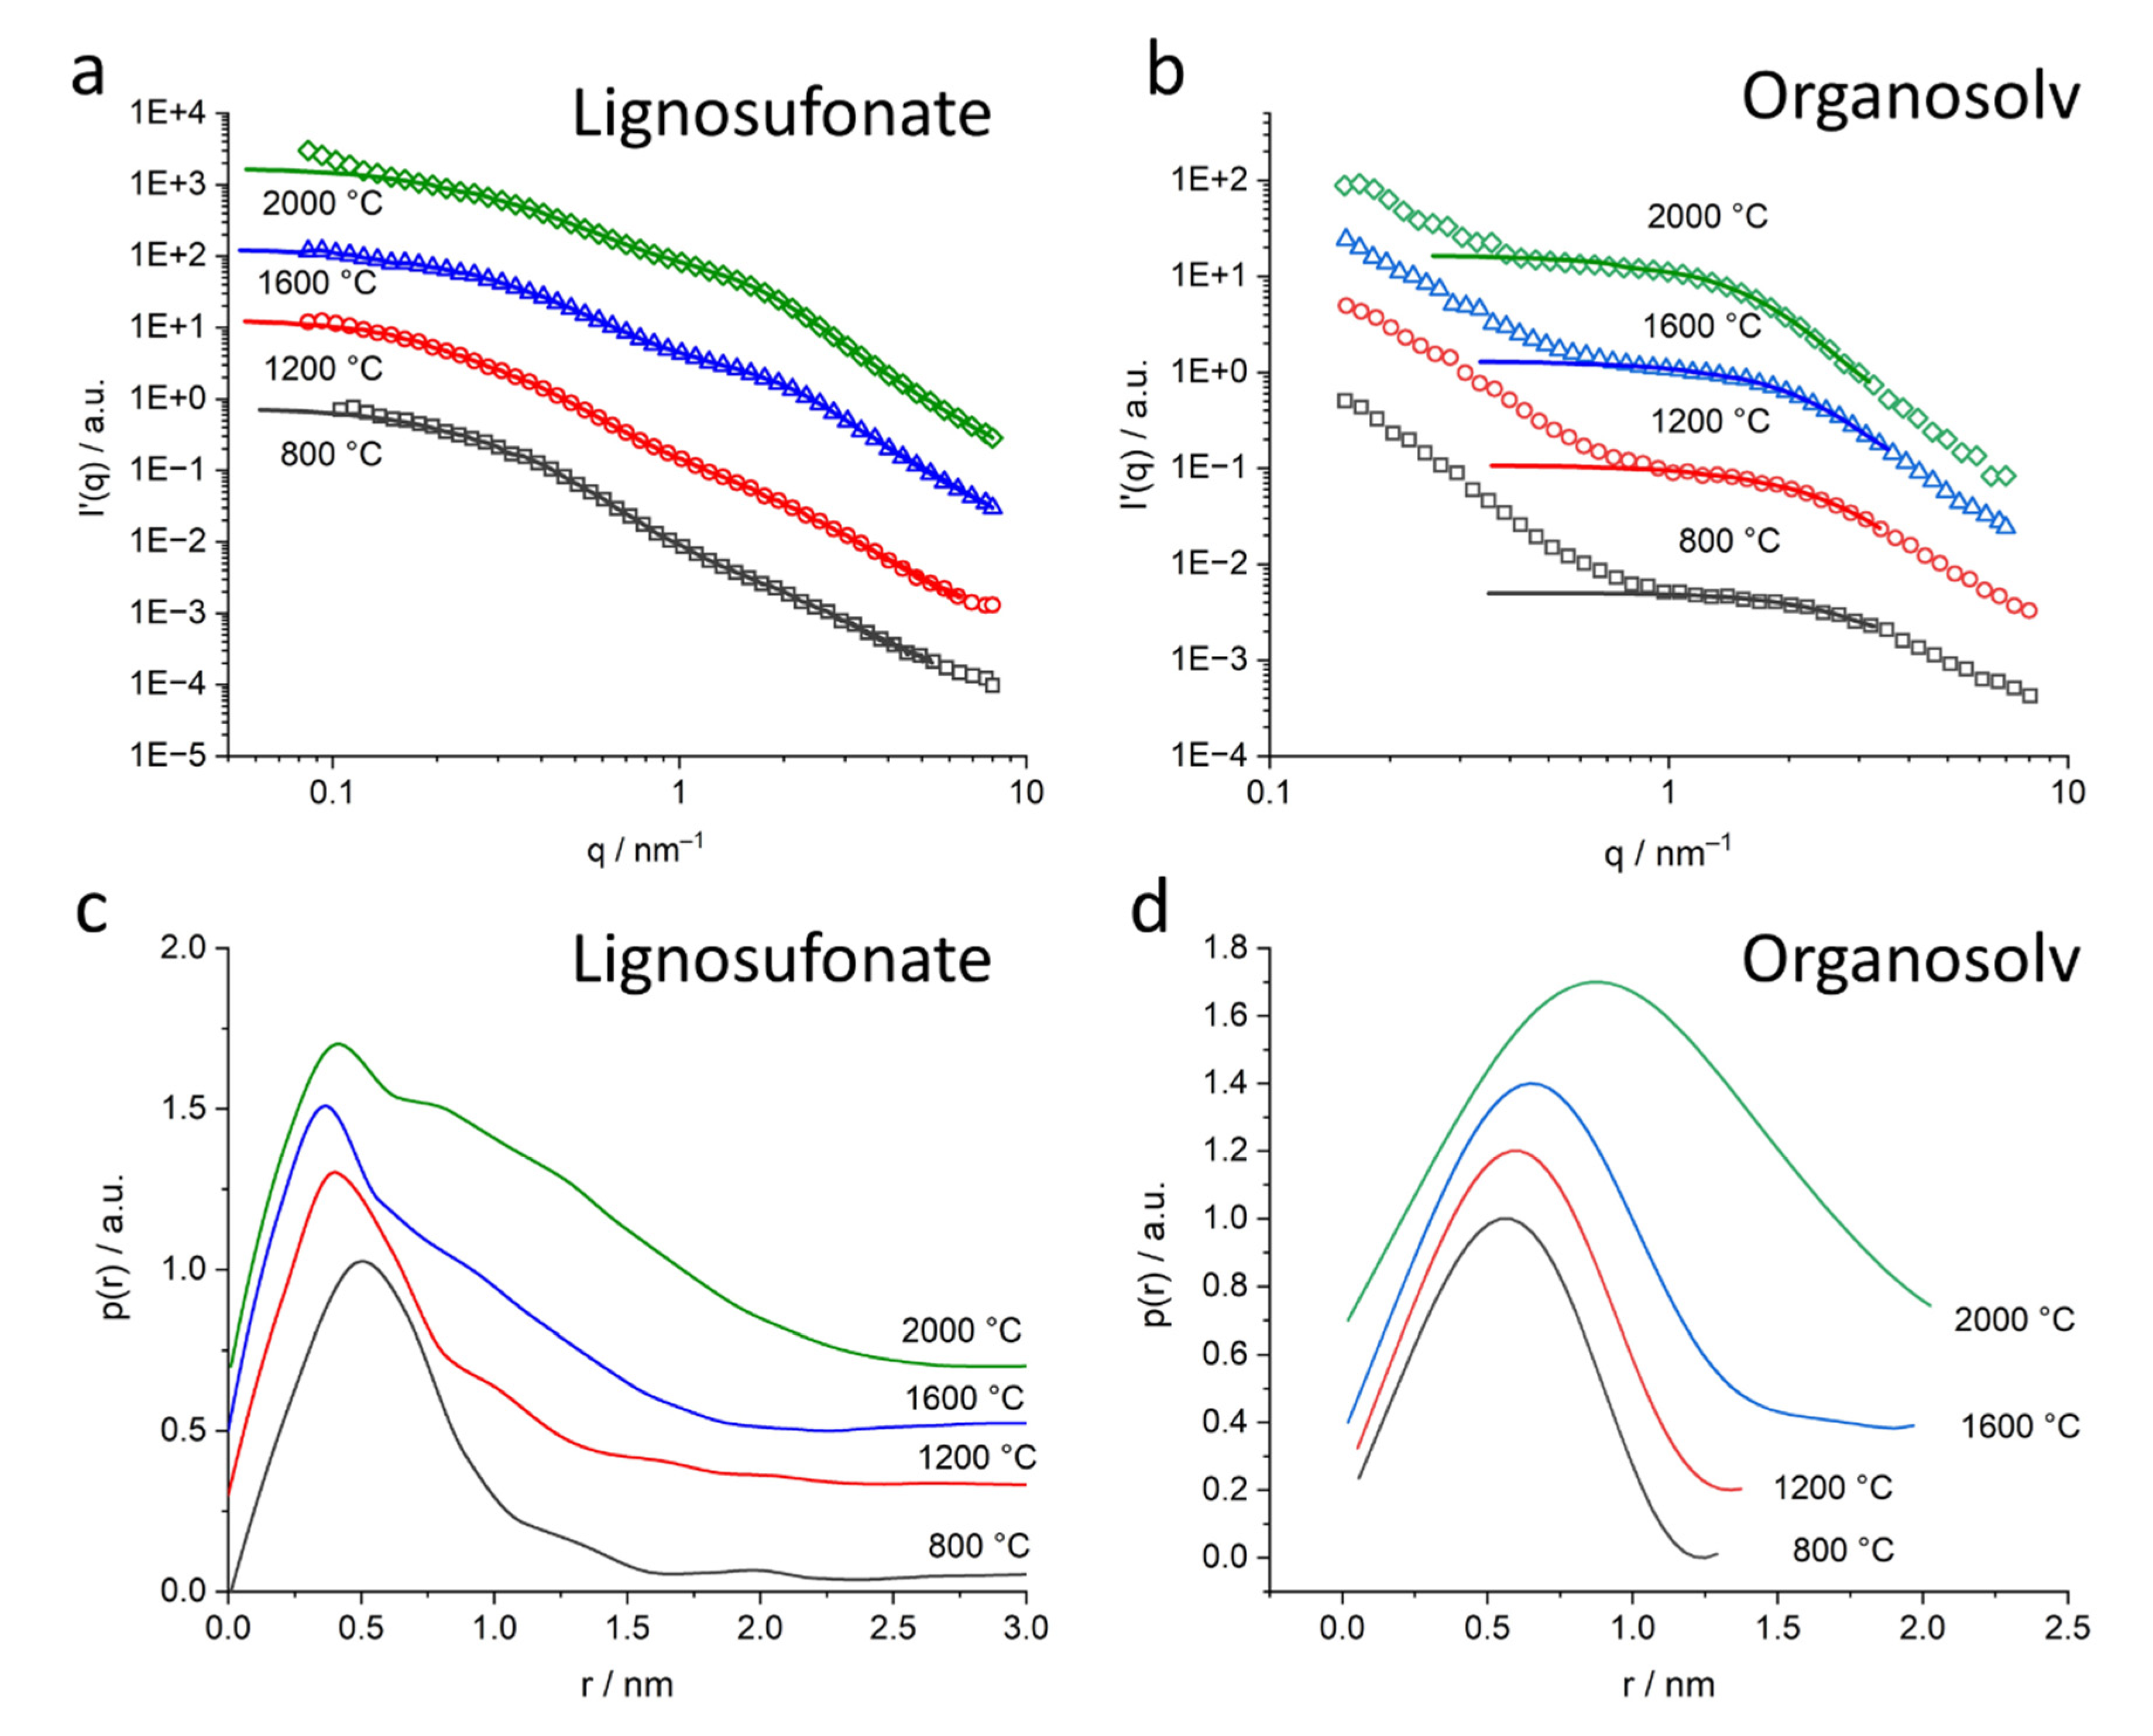
The SAXS signal clearly shows the difference in the nanostructure of the different lignin samples. While organosolv, kraft and soda-based samples exhibit a simple pore size distribution, lignosulfonate-based samples feature various pores on different length scales, the diameter of which changes considerably for higher heat treatment temperature.
Figure 5b shows the scattering curves of the organosolv samples: the pores with about 200–300 nm size can also be observed for raw lignin and the thermostabilized sample, while the nanometre-sized pores are only visible for samples heat-treated at temperatures higher than 800 °C. This is also visible in the low-angle contribution of the WAXD curves (
Figure 3a) that feature no additional background from SAXS contributions for the raw and thermostabilized curves. After subtraction of the low-q small-angle signal, the change in the nm-sized pores could be directly addressed: spherical pores increase in the mean diameter from about 0.7 nm to about 1.5 nm. Pores in the 1–2 nm range have also been reported in activated carbons of co-solutions activated by H
3PO
4 and heat treatment at 400 °C [
18]. An increase of the nm-sized pores from lignin precursor to carbonized material after heat treatment at 800 °C was reported by [
10] for kraft lignin. A wider pore size distribution ranging from 18 to 40 nm and higher was reported for iron oxide particles coated with carbonized lignin. Here, carbonization was carried out at 500 °C, but residual lignin was dissolved afterwards, which might have influenced the surface pore characteristics. An increase in pore size is generally observed with higher temperatures for carbon materials [
12]. The specific inner surface equivalent of the nanopores increases from about 600 m
2 cm
−3 at 1200 °C to 1100 m
2 cm
−3. The dimensionality parameter evaluated in the Porod regime increases as well, which is interpreted as a change in surface roughness, i.e., the surface of the nanopores becomes smoother, from a mass fractal at temperatures below 1600 °C towards a surface fractal for samples treated with 1600 °C or 2000 °C [
29]. This can be understood by the change in the carbon material towards a more graphitic structure. Better arrangement of previously unordered carbon material opens pores and better order of the crystallites results in smoother surfaces of the pores. A change in the stacking is also the basis of the changing contribution of surface fluctuations
q−2, which was chosen as basis for the Porod evaluation [
32]. Between the moderate-temperature treatments (800 °C, 1200 °C) and higher-temperature treatments (1600 °C, 2000 °C), the samples exhibit a considerable change in most of the structural parameters, i.e.,
d002 and
D002 (
Figure 4,
Table 1,
Table S1),
R (
Figure 8a), most prominently visible in
P/
Q (
Figure 8c) and also the nanopore fraction of lignosulfonate (
Figure 8d). This can be attributed rather to a physical change in the samples than a chemical one, since the FTIR data (
Figure 10,
Figures S4 and S5) suggest that the main change in chemistry occurs between 800 °C and 1200 °C. The general FTIR pattern of thermostabilized spectra corresponds well to the pyrolysis degree revealed between 250 and 300 °C [
24]. The formation of calcite in lignosulfonate (two bands at 1428 cm
−1 and 878 cm
−1) at pyrolysis temperature of 800 °C can be explained as CO
2 from the pyrolysis decomposition of organic matter trapped in nanopores reacts with CaO as a residue of CaSO
4 as an intermediate product into CaCO
3 [
24,
44]. Above the 1000 °C pyrolysis temperature, the removal of all elements except carbon is asymptotically achieved [
24].
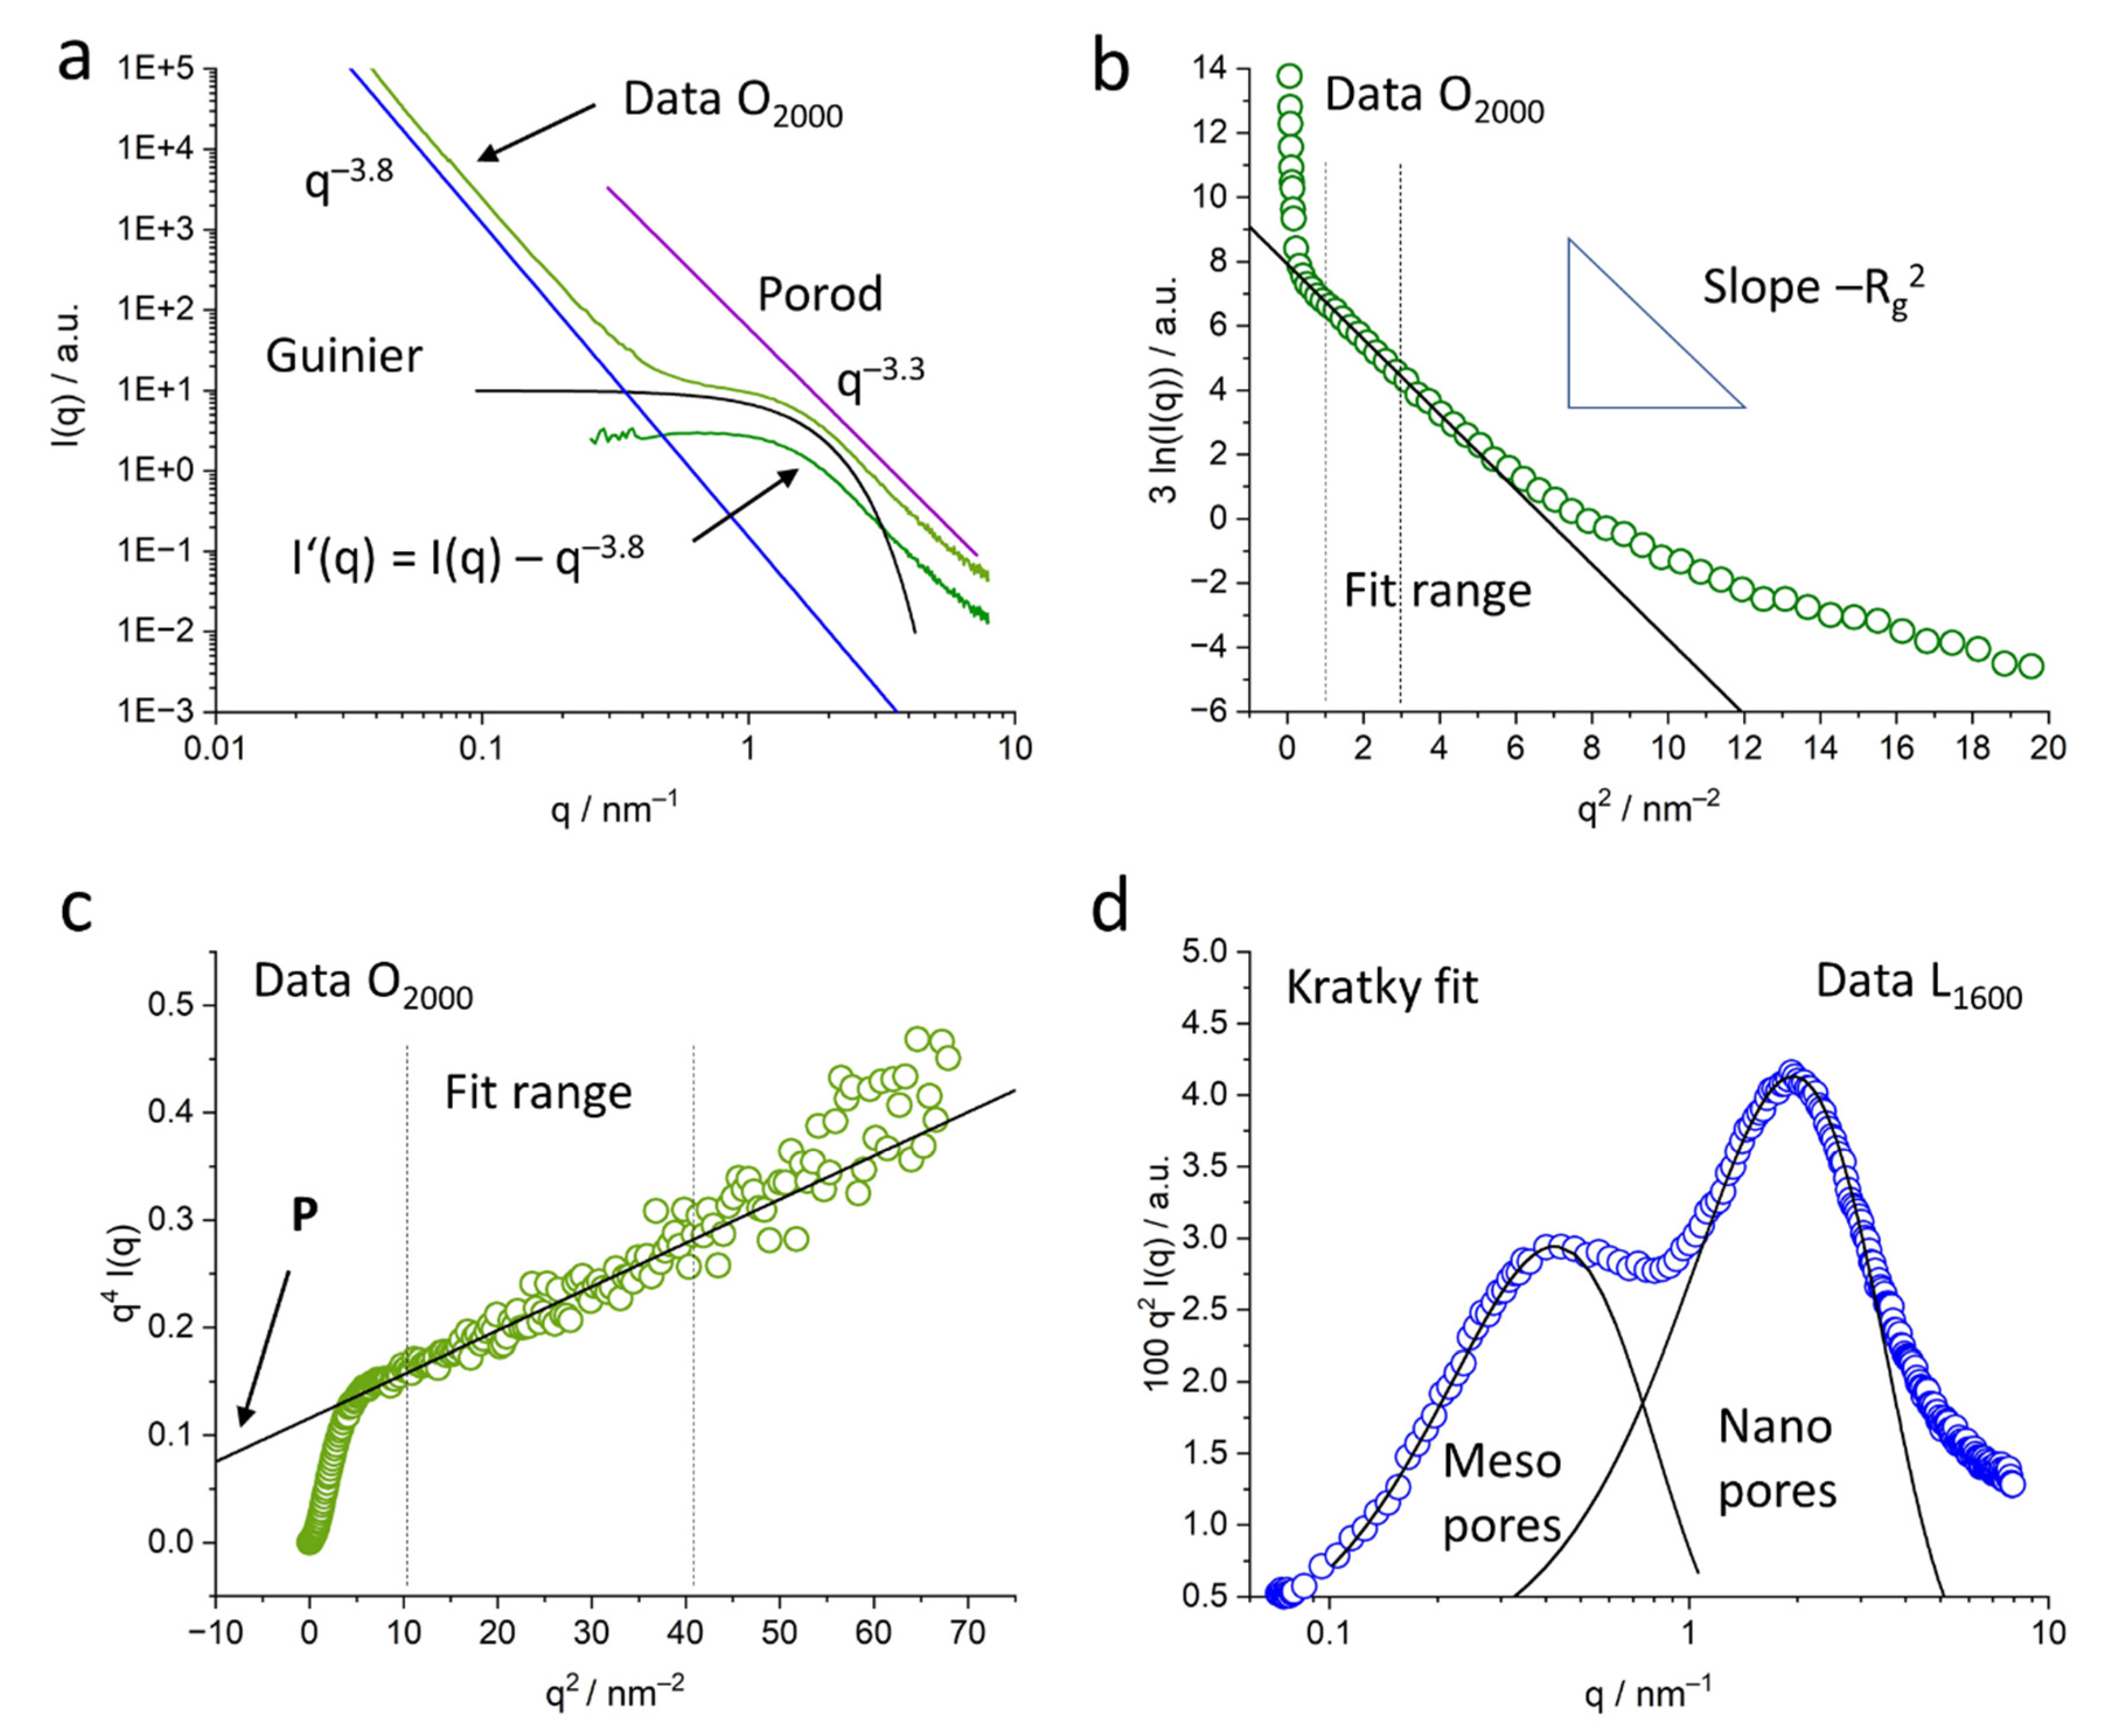
While the shape of the pores is generally not important for a generalized Guinier evaluation, the subtraction of the mid-q contributions allowed a more specific data interpretation. The modified scattering curve
I’(
q) shows a power law close to
q−0, which indicates spherical pores. This is in contrast to porous carbons from, e.g., carbides, that exhibit slit-like pores [
12], which results from the different basic material. The fit to the data of the lignin-based carbons in this work is in good agreement with the assumption of spherical pores (
Figure 6a and
Figure 9). It is interesting to see the influence different lignin materials have on the pore size and pore size distribution even after full carbonization at 1600 °C and 2000 °C. This is visible not only in the USAXS data in the low-q range (
Figure 5), but also in the
p(
r) curves evaluated by the GNOM fit (
Figure 9). Lignosulfonate displays bigger pore structures, evolving in a non-linear way with heat treatment, with a wider pore size distribution in the nm range. The main pore size of nm-sized pores stays nearly constant around 0.5 nm, while more and bigger pores towards 8 nm evolve. This wide and complex pore distribution also did not allow a valid Guinier evaluation for all lignosulfonate samples, thus the evaluation with GNOM was applied. In contrast, the organosolv-based samples show a nearly constant size of the submicron pores of about 220 nm and a clear trend in the development of the nm-sized pores towards bigger pores. Only the 2000 °C sample exhibits a considerable increase in the width of the
p(
r) distribution. Kraft and soda samples also exhibit a similar trend in the scattering curves, suggesting a pore development comparable to organosolv samples.
The observations from mercury porosimetry (
Figure S6) complement the measurements from SAXS (
Figure 5 and
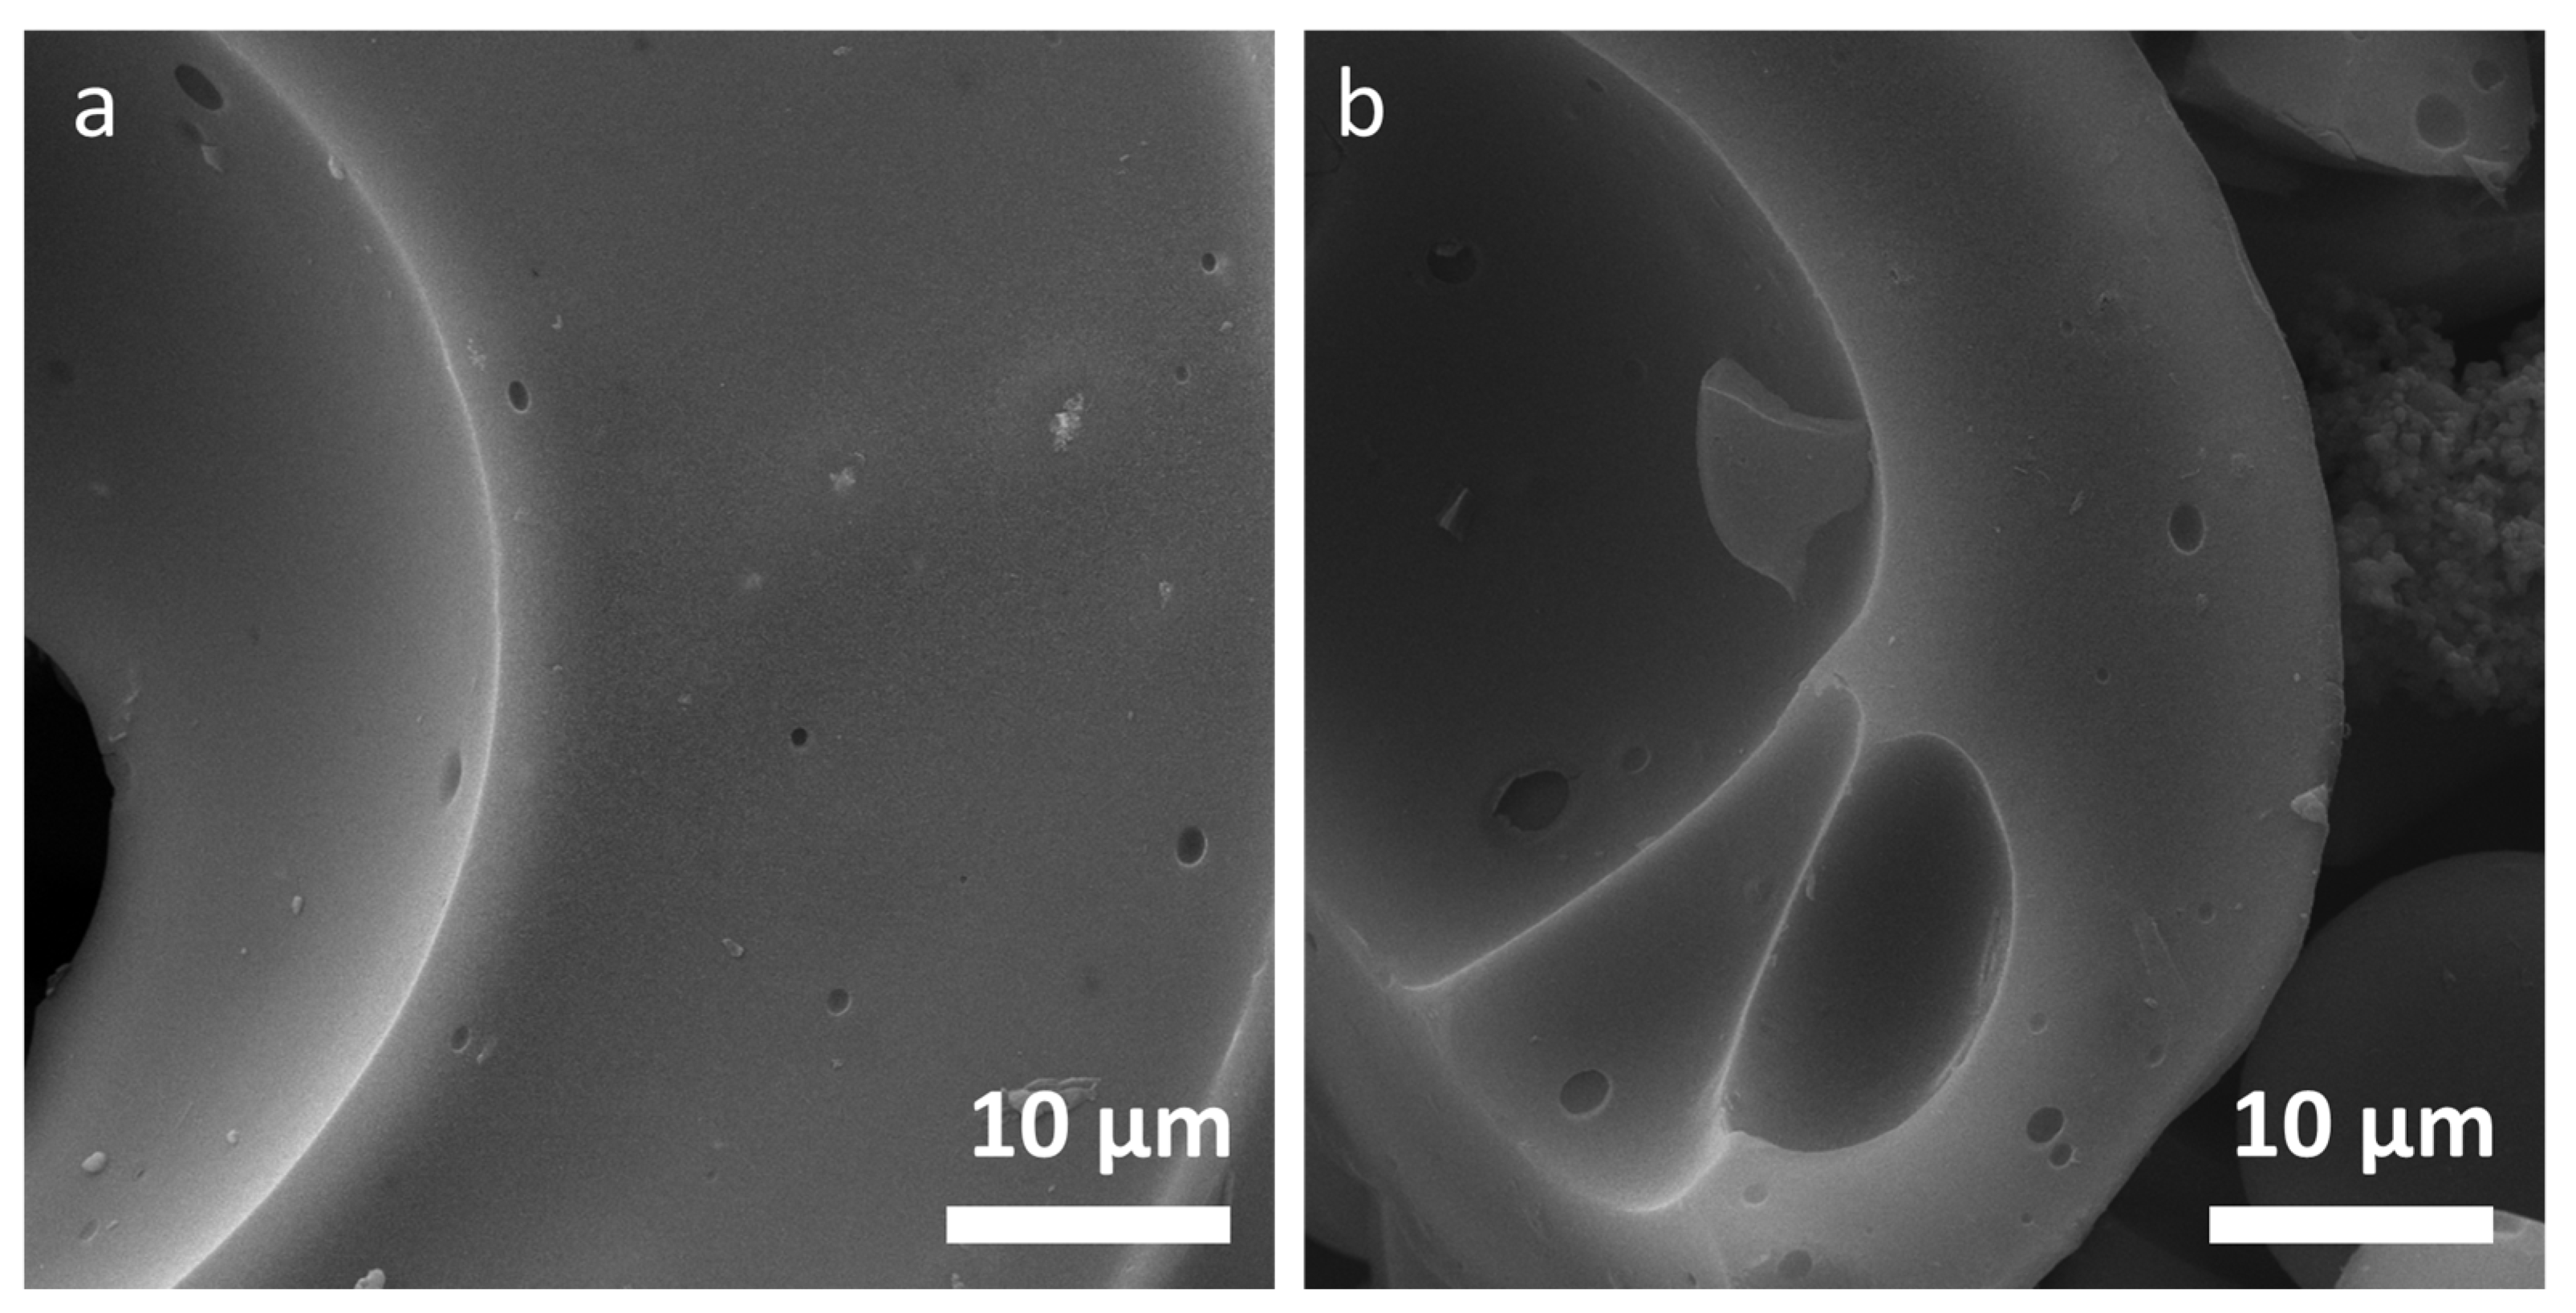
Figure S3): nm-sized pores that increase in amount and diameter and a complex pore structure towards length scales in the micrometer regime are shown by SAXS. The mercury porosity results show the main pore size in the μm range. Mercury porosimetry displays a negligible number of pores in the 10–100-nm range and the measurement signal close to the resolution of the equipment. Thus, the two methods give full insight into the pore structure only when used together. The results also show good agreement with the SEM images, where the 10–20 μm pores are visible as the hollow spheres, typically for the lignosulfonate samples. The smaller pores found by mercury porosimetry are the holes in these structures.
In our previous work, it was shown that the electrical conductivity of the samples increases with heat treatment temperature [
28]. While kraft, soda and organosolv lignins exhibit an increase by a factor of about 10 (50–500 Ω
−1 mm
−1) in electrical conductivity, among the samples heat-treated at 800 °C and 2000 °C, the lignosulfonate lignin does exhibit a comparatively smaller maximum value of about 50 Ω
−1 mm
−1 at 2000 °C. This might not only be due to the different microscopic arrangement (lignosulfonate and kraft samples exhibit larger spherical particles), but could also be influenced by the much higher porosity and bigger pores in the material. It was also observed that electrical conductivity increases most between 800 °C and 1600 °C, while no considerable increase was observed between 1600 °C and 2000 °C. This behavior corresponded to the development of crystal structure and pores. Such observations could be crucial for tailoring the lignin-based carbon black properties with the lowest amount of processing energy necessary.
4. Materials and Methods
4.1. Materials
Four different technical lignins were used as raw material: kraft lignin (Indulin AT) from MeadWestvaco®, soda lignin (Protobind 2400®) purchased from GreenValue®, softwood lignosulfonate bought from Borregaard® and organosolv lignin provided by Fraunhofer®.
4.2. Lignin Carbonisation
Lignin was thermostabilized at 250 °C in a Memmert oven with a heating rate of 0.01 °C min−1 and ambient atmosphere. Thermostabilization causes oxidative changes in the lignin structure and results in thermoset lignin. Carbonization was performed in a GERO HTK8 oven equipped with a 61 graphite retort at an argon gas flow rate of 150 L/h. Four different target temperatures were accomplished for all lignins: 800 °C, 1200 °C, 1600 °C and 2000 °C. The heating rate was 1 °C min−1 up to 500 °C with a 1-h holding step at 500 °C. Afterwards, the heating rate was increased to 5 °C min−1 with 1-h holding steps at 900 °C and the final temperature. For better understanding, we refer to the samples with a letter and the temperature subscribed throughout the text. Thus, organosolv raw, thermostabilized, and heat-treated afterwards with either 800 °C, 1200 °C, 1600 °C or 2000 °C samples are denoted as Oraw, O250, O800, O1200, O1600 and O2000, respectively. Lignosulfonate samples are denoted as Lraw, L250, L800, L1200, L1600 and L2000, soda—as Sraw, S250, S800, S1200, S1600 and S2000 and kraft—as Kraw, Kt250, K800, K1200, K1600 and K2000, accordingly.
4.3. Characterization of Samples
Scanning electron microscopy (SEM) was conducted using a QuantaTM 250 field-emission environmental scanning electron microscope equipped with a Schottky field emission gun which operated at 10 kV in high vacuum of 1 × 10⁻⁶ mbar. The samples were sputter-coated with gold and images were taken at different magnifications with the secondary electron detector (ETD).
Wide-angle X-ray diffraction (WAXD) was carried out with a 5-circle X-ray diffractometer equipped with Cu-Kα source with a parabolic multilayer mirror in the primary beam and a secondary graphite monochromator and a wavelength of λ = 0.15418 nm. Intensity data were documented in a step of 0.02° between 2θ = 5° and 50° with 4 s dwell time.
Small-angle X-ray scattering (SAXS) was performed with a Rigaku S-Max3000 3-pinhole SAXS camera with an MM002+ source (Cu-Kα,
λ = 1.54 Å) and a Triton 200 multiwire detector. Scattering images were recorded in the q range 0.08–8 nm
−1, with q being the magnitude of the scattering vector related to the scattering angle 2θ and the wavelength
λ by the Bragg equation:
q = 4π/
λ sin
θ. All 2D data were azimuthally integrated to obtain 1D scattering profiles, i.e., scattering intensity vs.
q,
I(
q) and later background subtracted for further analysis [
26]. For select samples, additional ultra-small-angle X-ray scattering (USAXS) measurements were performed on ID02 beamline at the ESRF, Grenoble, France. Scattering images were taken for a 10-m and a 31-m sample-to-detector distance with a maximum exposure time of 0.01 s using a Rayonix MX 170 HS detector. The settings result in a
q range from 0.002 to 0.765 nm
−1. The background-subtracted synchrotron data could be combined with the SAXS data from the laboratory allowing for a full
q range of 0.002–8 nm
−1.
Attenuated total reflection Fourier-transform infrared spectroscopy (ATR-FTIR) was performed with 4 cm−1 resolution on a Helios spectrometer (Ultrafast Systems BV, Amsterdam, the Netherlands) equipped with a diamond crystal. The spectra were baseline-corrected before further evaluation.
Mercury porosimetry was used on a set of lignosulfonate-based samples. To cover a large pore radius range, two devices, namely, Pascal 140 and Pascal 440 (both Porotec), were used. The former generates pressures up to 400 kPa and covers pores down to 5 µm, the second—down to 5 nm due to the high pressure of up to 400 MPa. Measurements were performed with the pressure increase speed of 6–19 MPa/min at 21 °C


 ,
, 


