
Non-Invasive Evaluation of Acute Effects of Tubulin Binding Agents: A Review of Imaging Vascular Disruption in Tumors †

 , and
, and 
Abstract
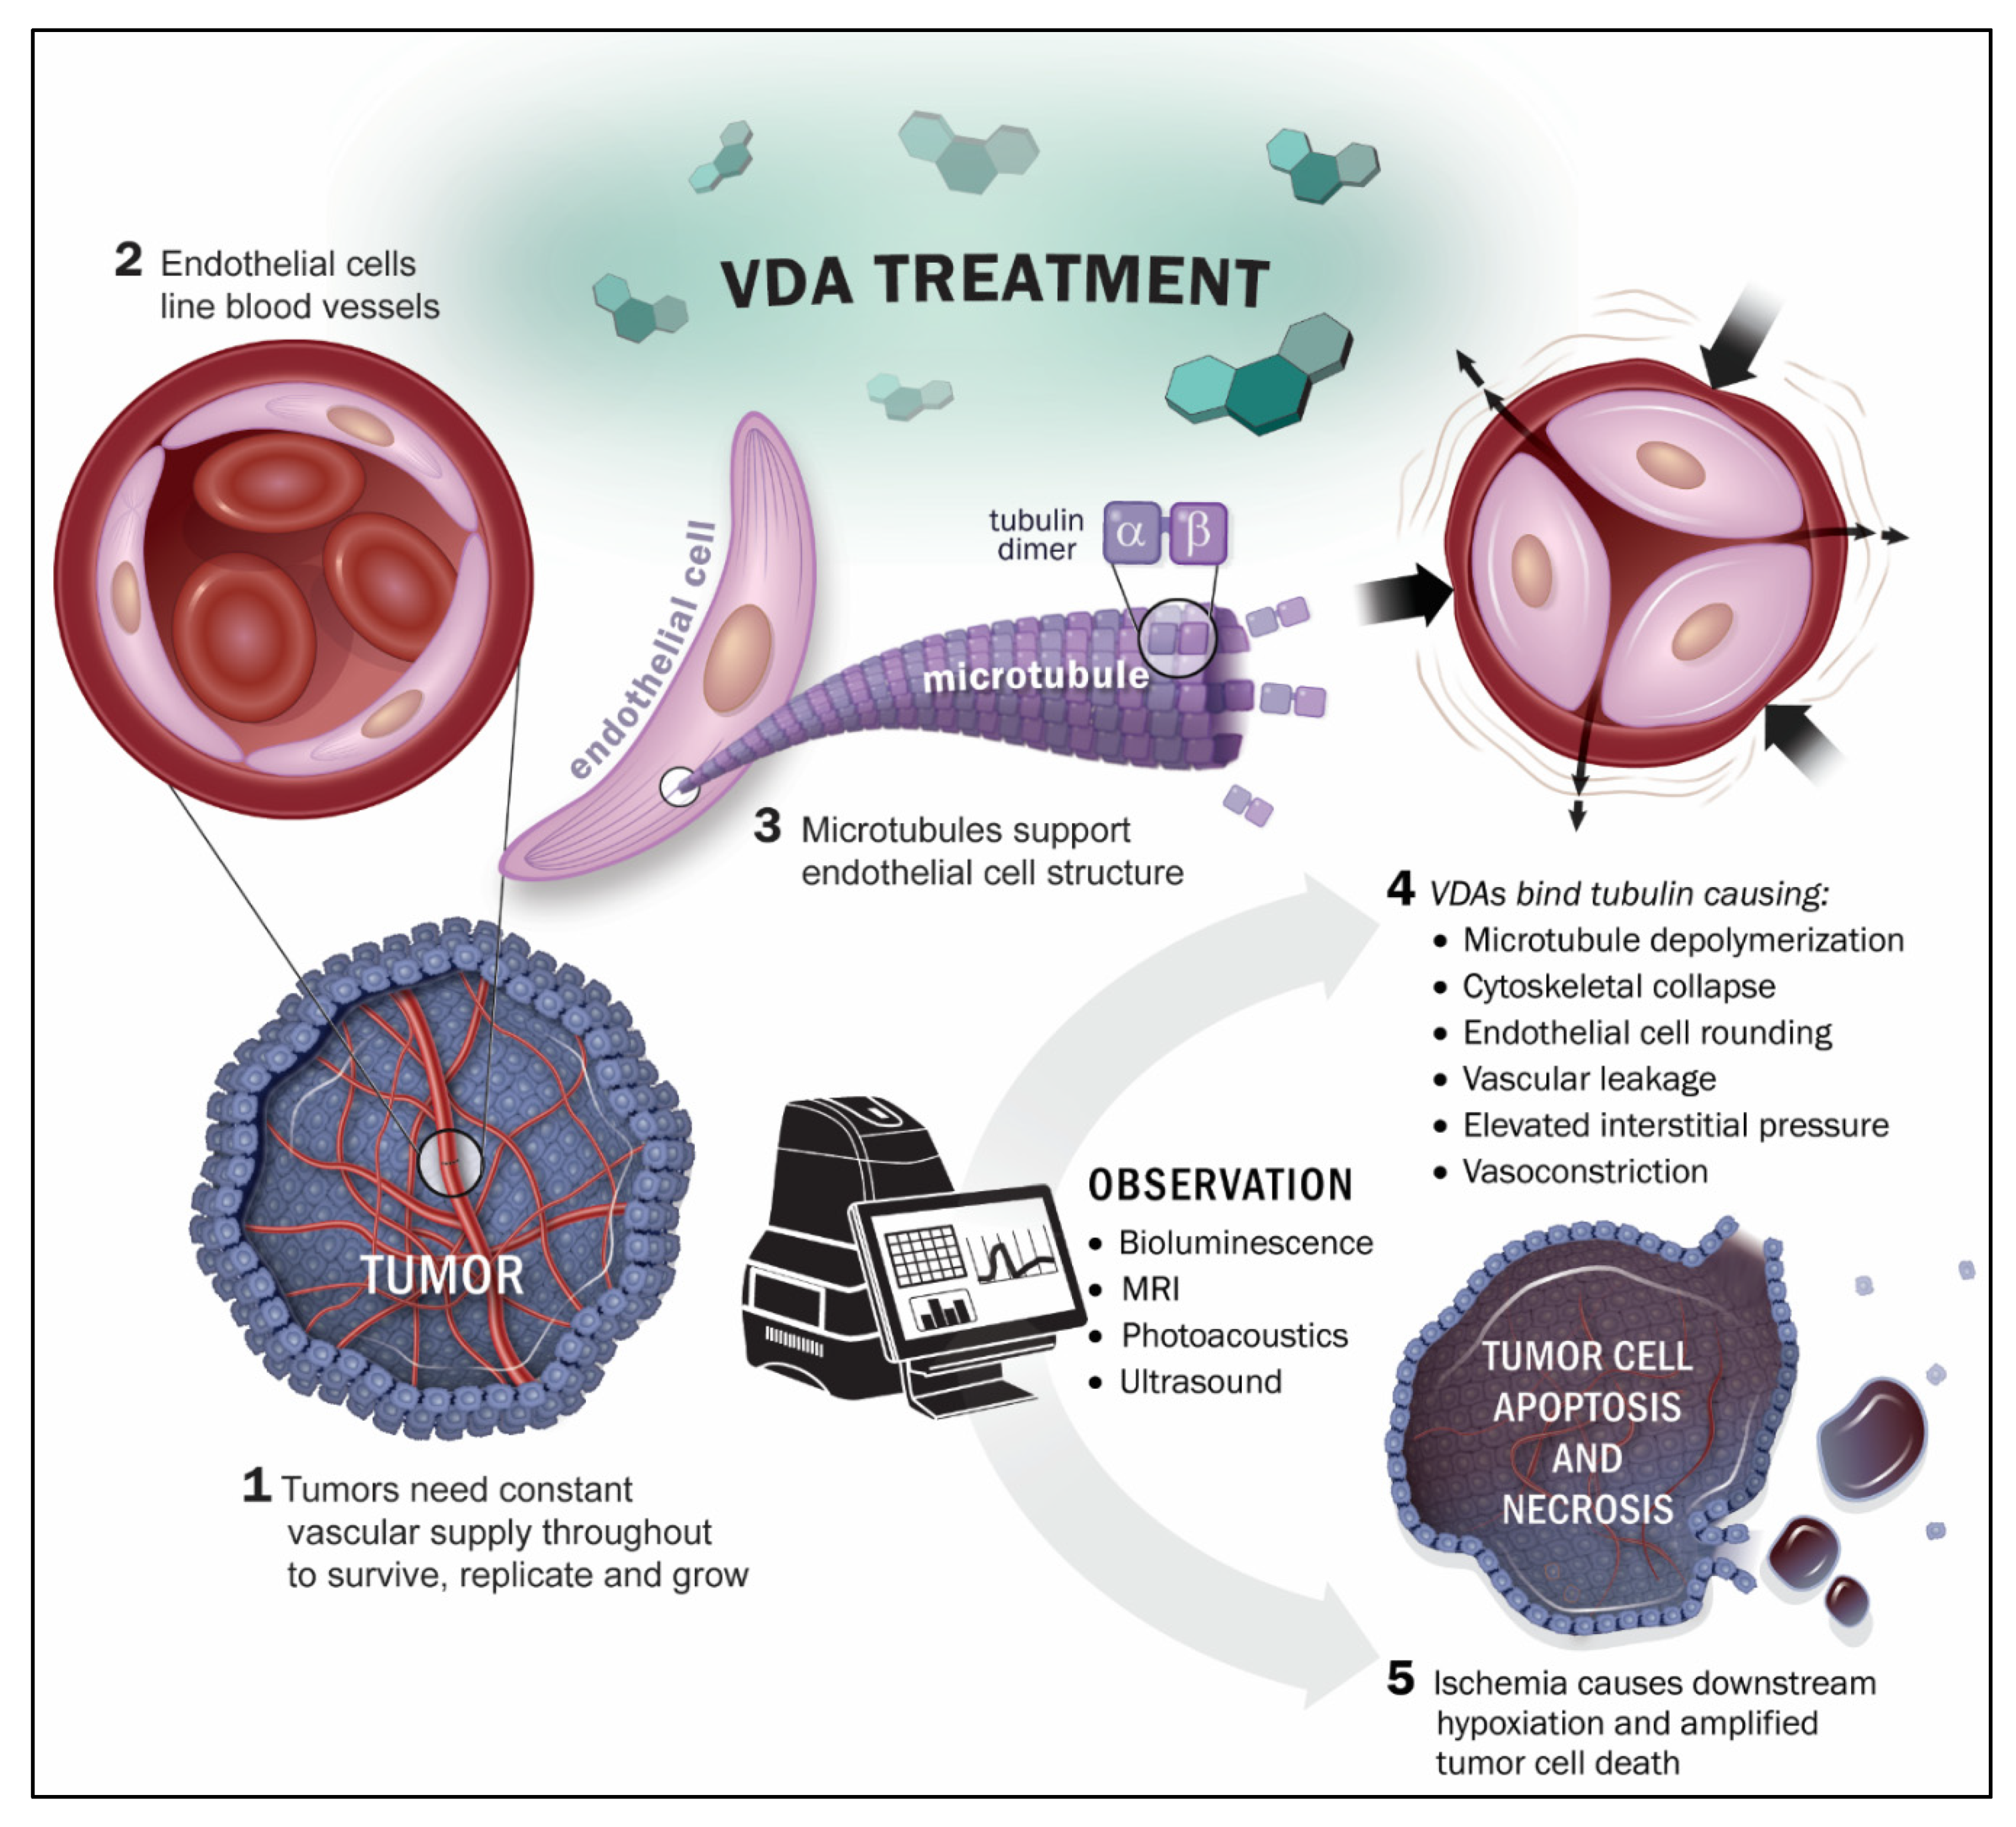
:1. Introduction
2. Imaging Technologies
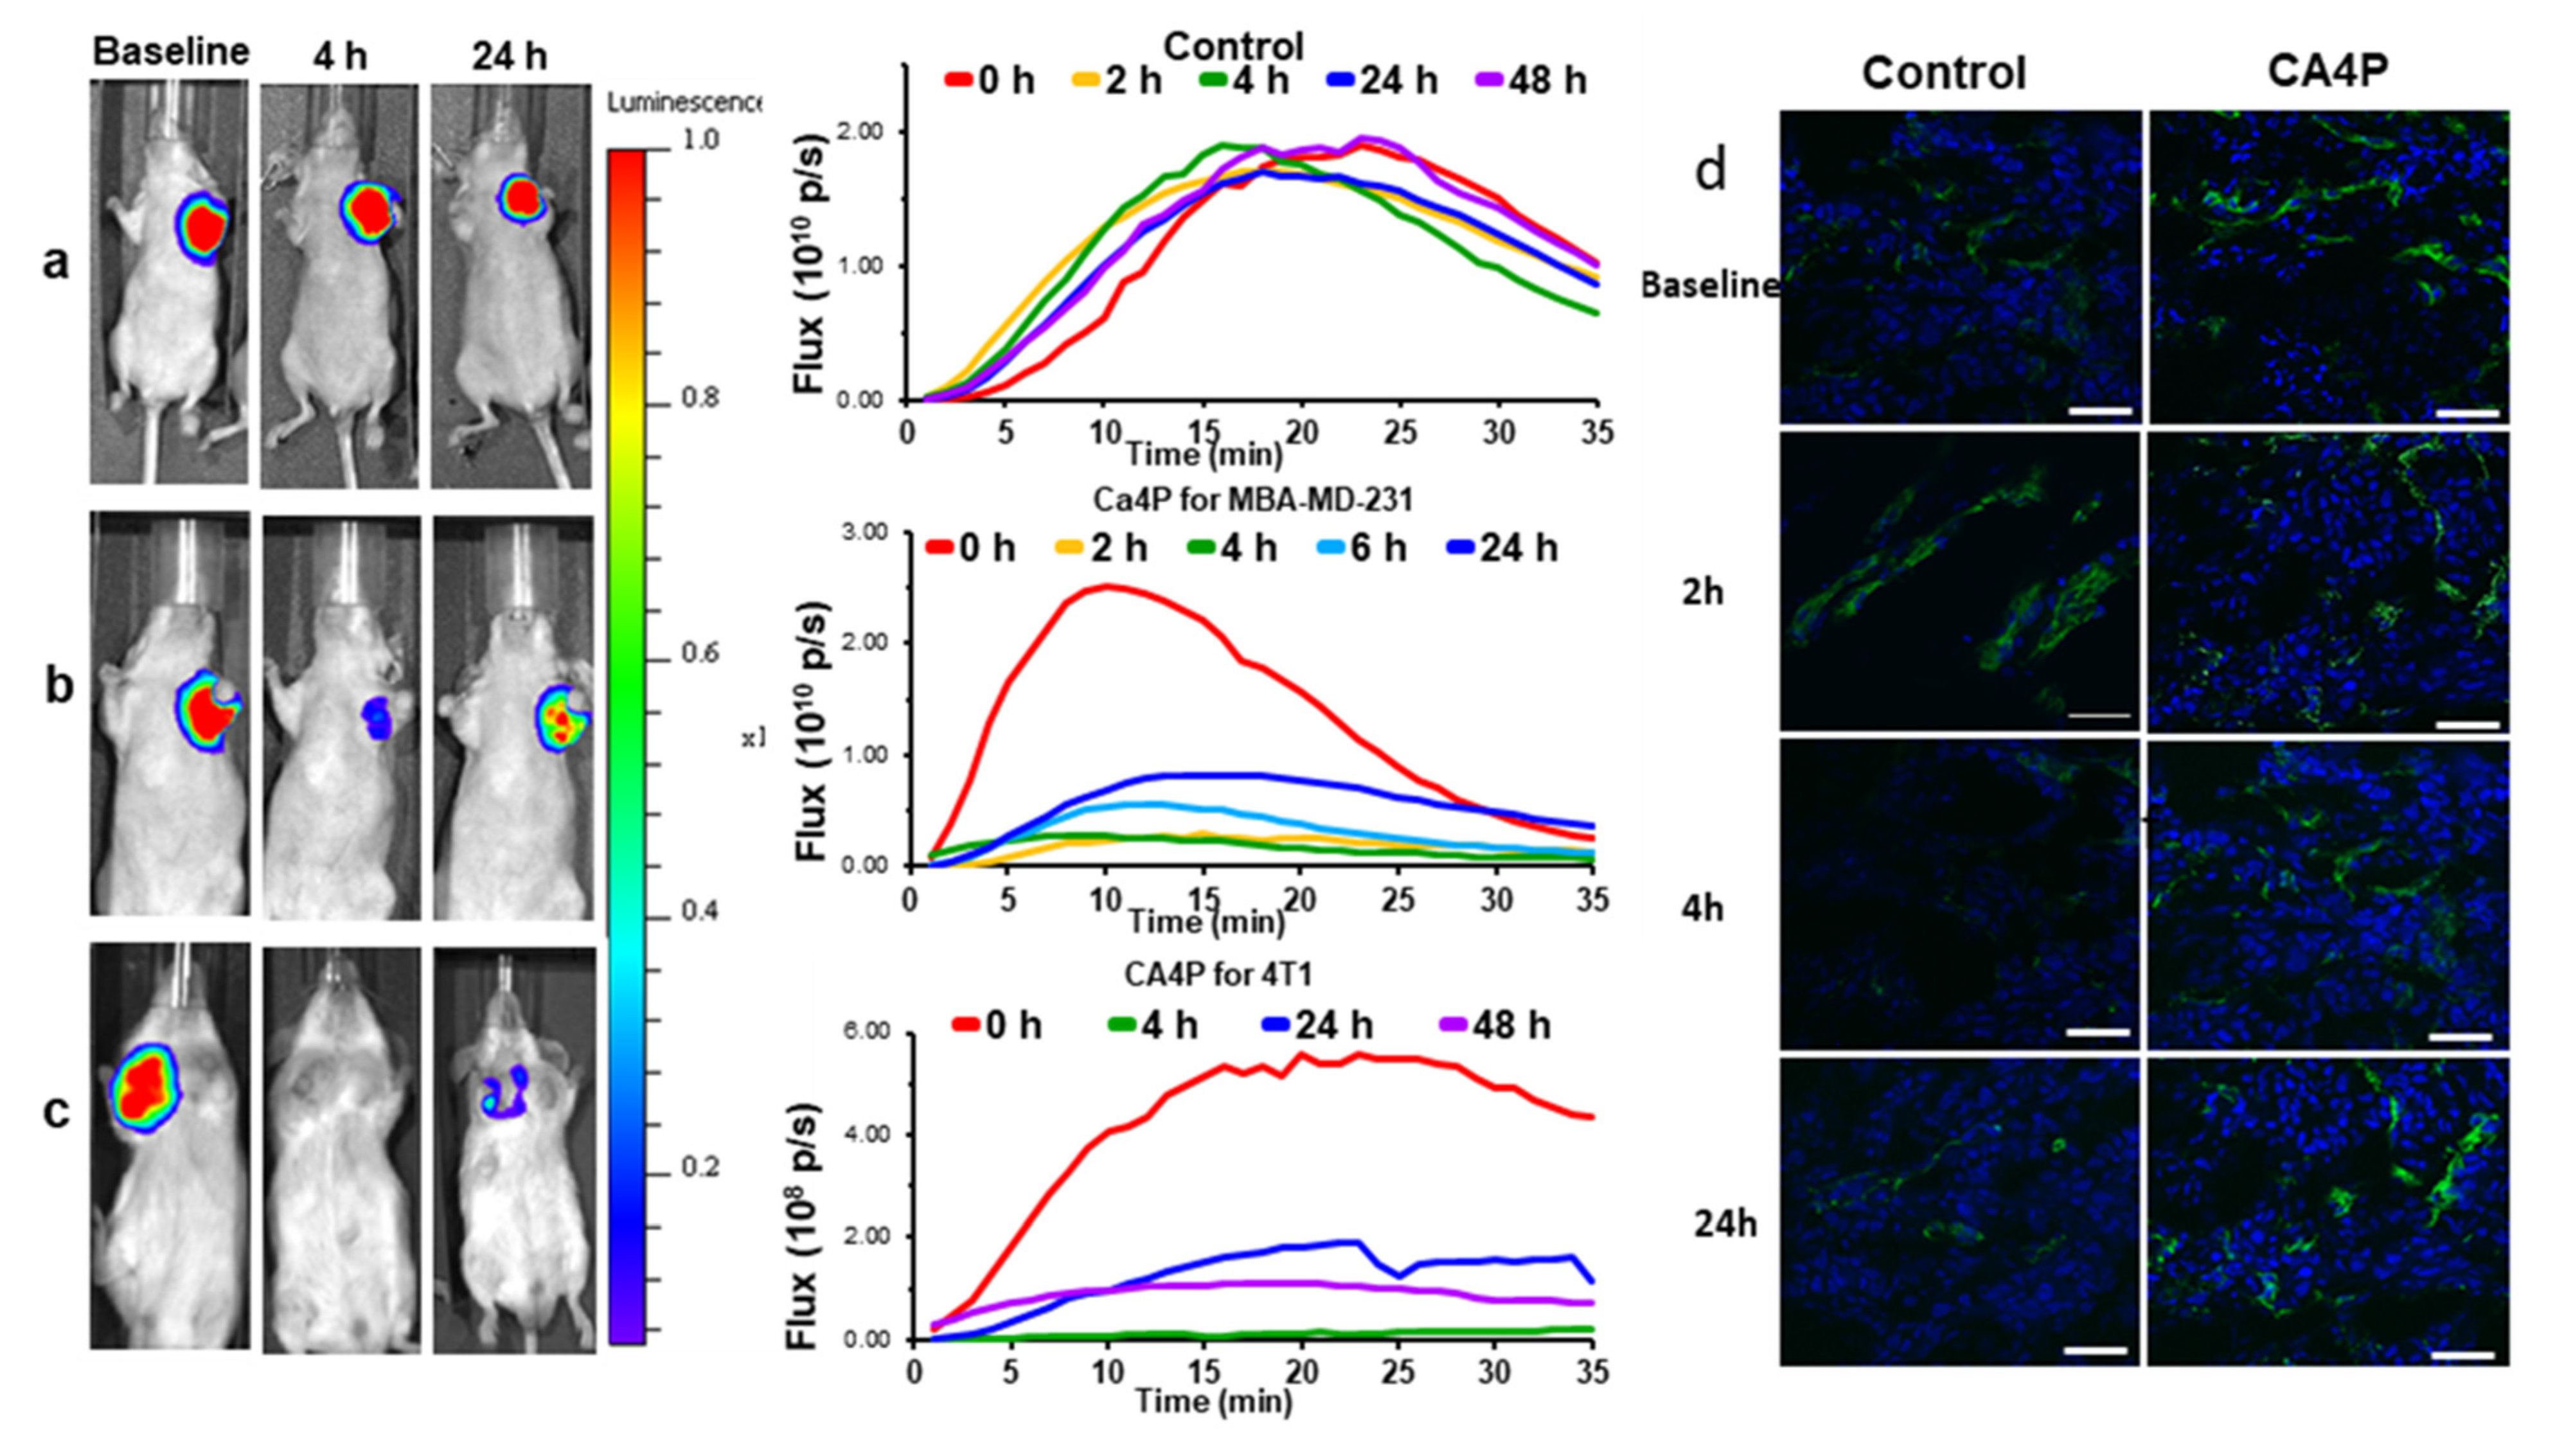
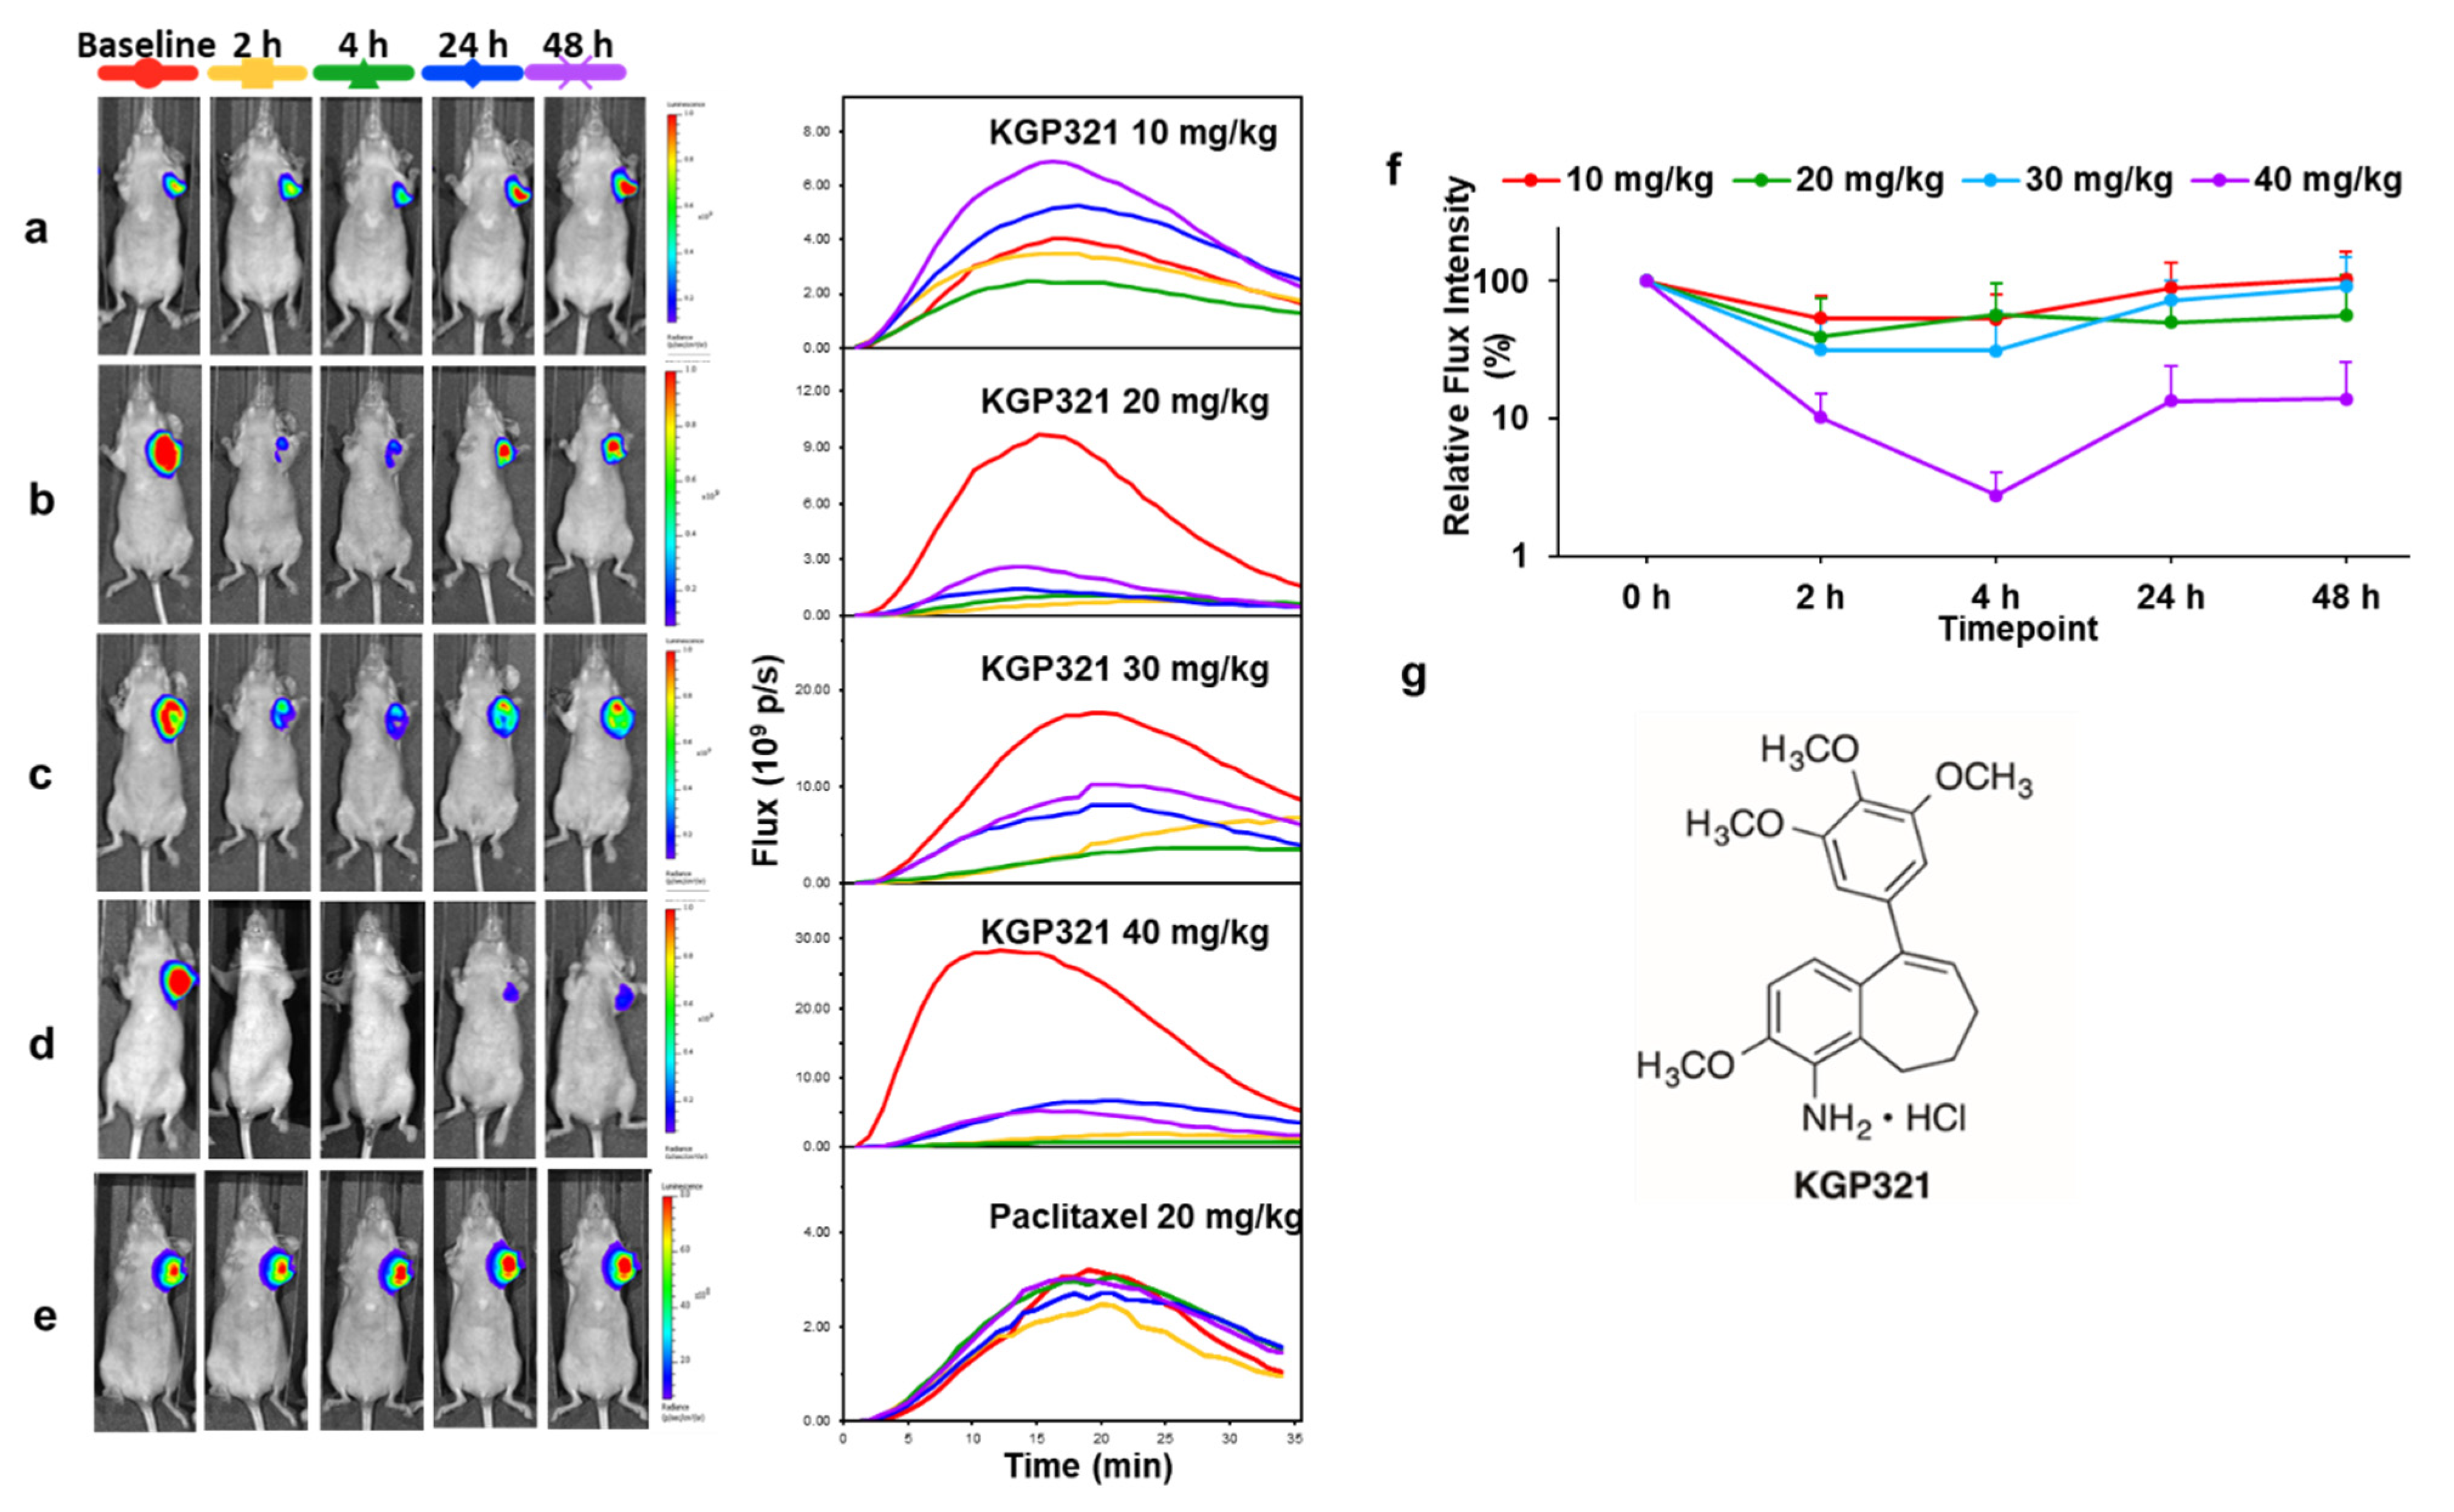
2.1. Bioluminescence Imaging (BLI)
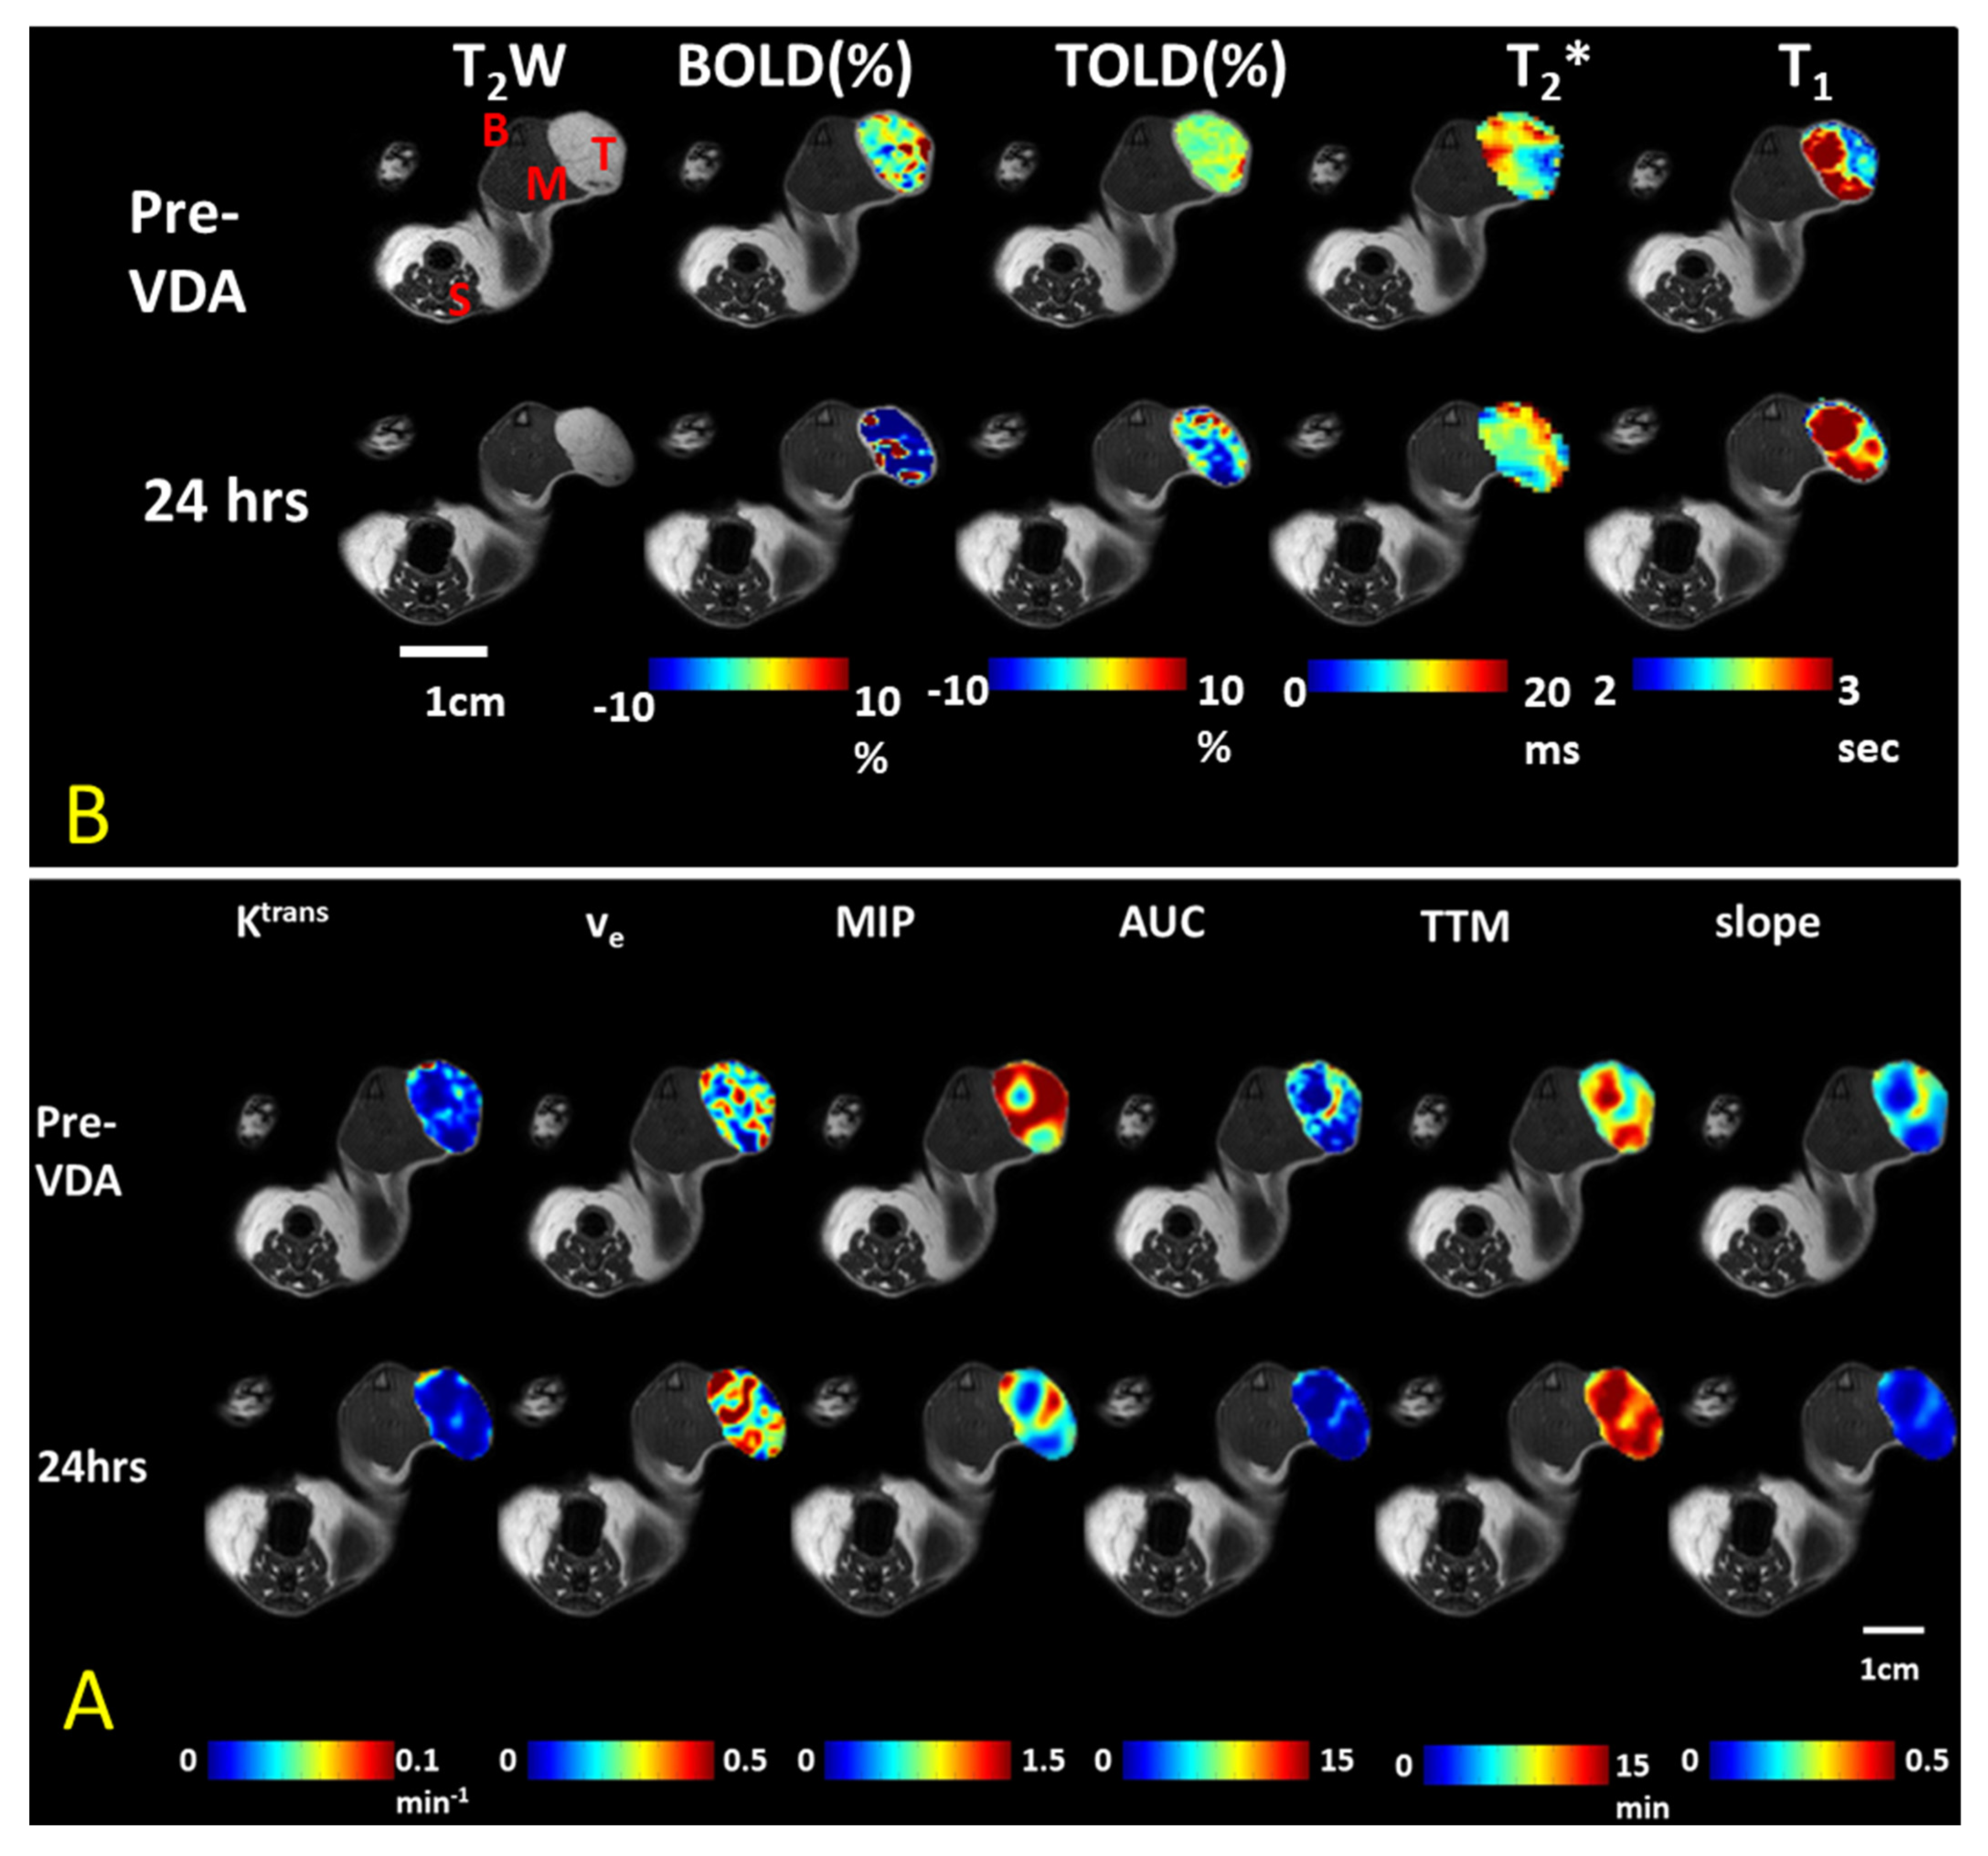
2.2. Magnetic Resonance Imaging (MRI)
2.4. Other Modalities
2.5. Optimizing Combination Therapy
3. Discussion
4. Materials and Methods
5. Patents
- Kevin G. Pinney, Haichan Niu, Depoprosad Mondal, “Benzosuberene Analogues and Related Compounds with Activity as Anticancer Agents” (United States Patent: US 10,807,932 B2), issued 20 October 2020.
- Kevin G. Pinney and Madhavi Sriram, “Combretastatin Analogs with Tubulin Binding Activity” (United States Patent: US 8,394,859), issued 12 March 2013.
- David J. Chaplin, Klaus Edvardsen, Kevin G. Pinney, Joseph Prezioso, Mark Wood, “Compositions and Methods with Enhanced Therapeutic Activity” (United States Patent: US 8,198,302), issued 12 June 2012.
- Kevin G. Pinney, Feng Wang, Maria Del Pilar Mejia, “Indole-Containing and Combretastatin-Related Anti-Mitotic and Anti-Tubulin Polymerization Agents” (EP 1 214 298 B1), issued 30 May 2012.
Supplementary Materials
Conflicts of Interest
Sample Availability
Appendix A. Typical Procedure for BLI
Appendix B. Typical Procedure for MRI
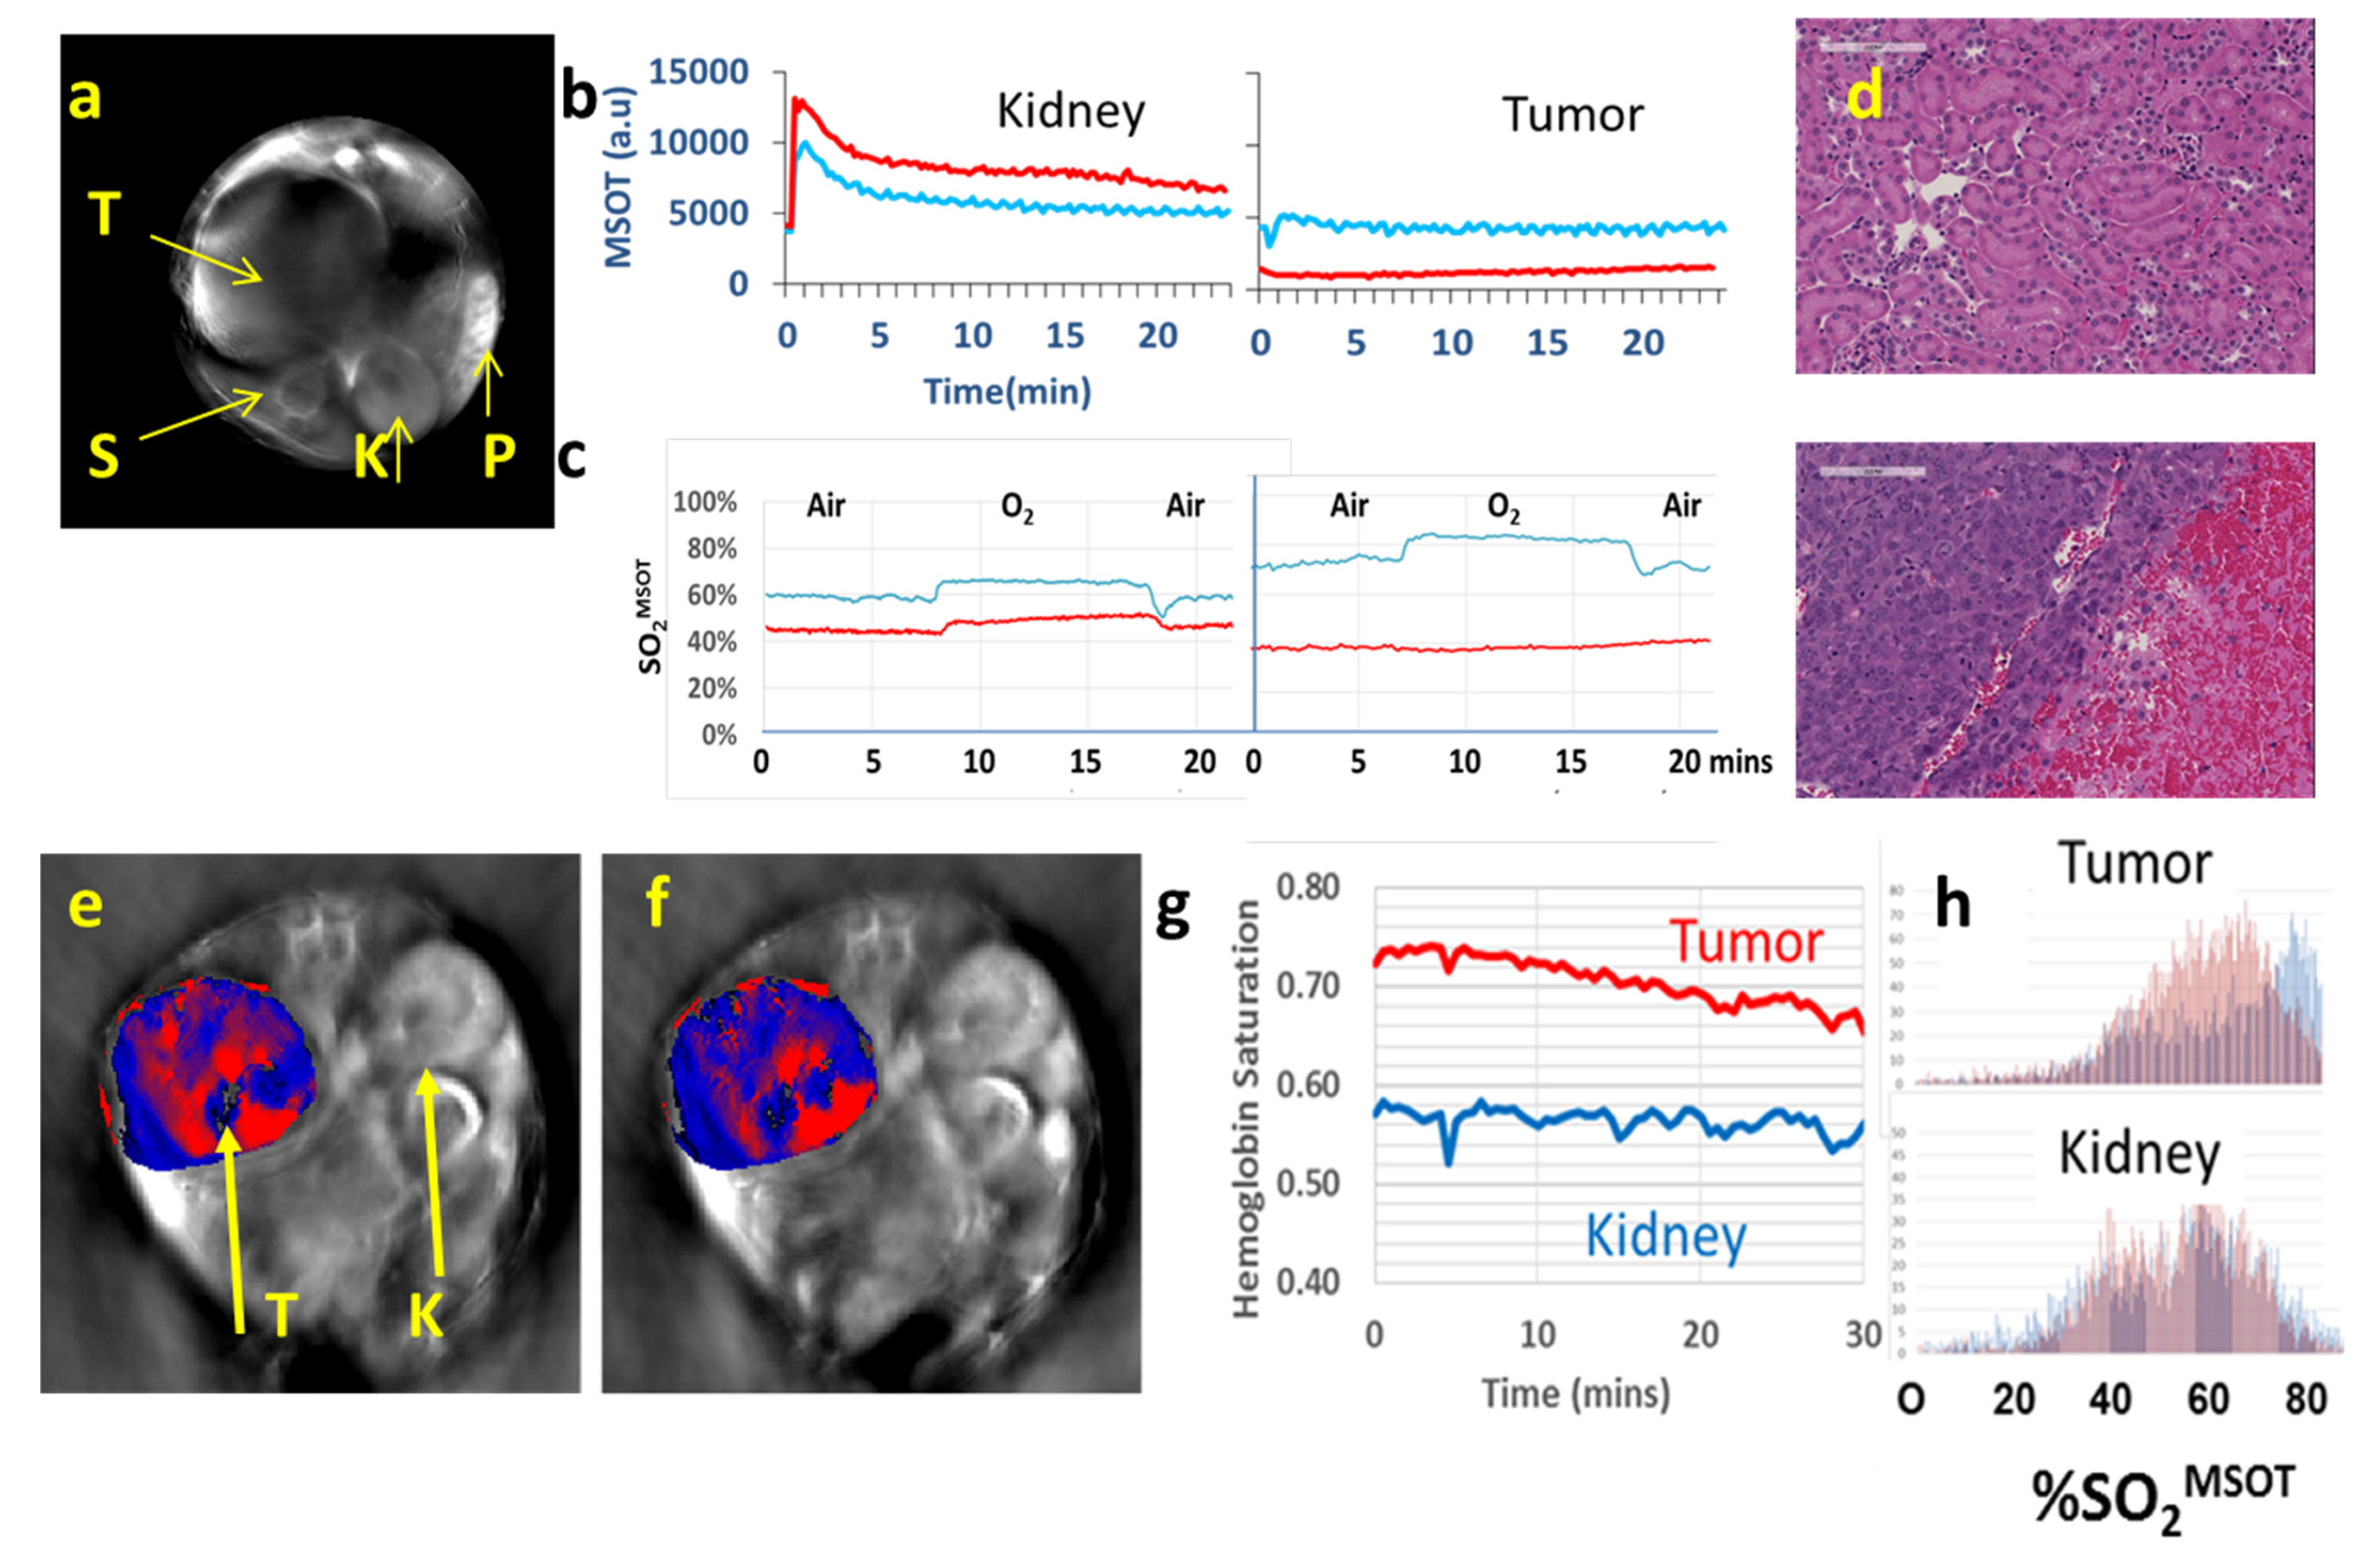
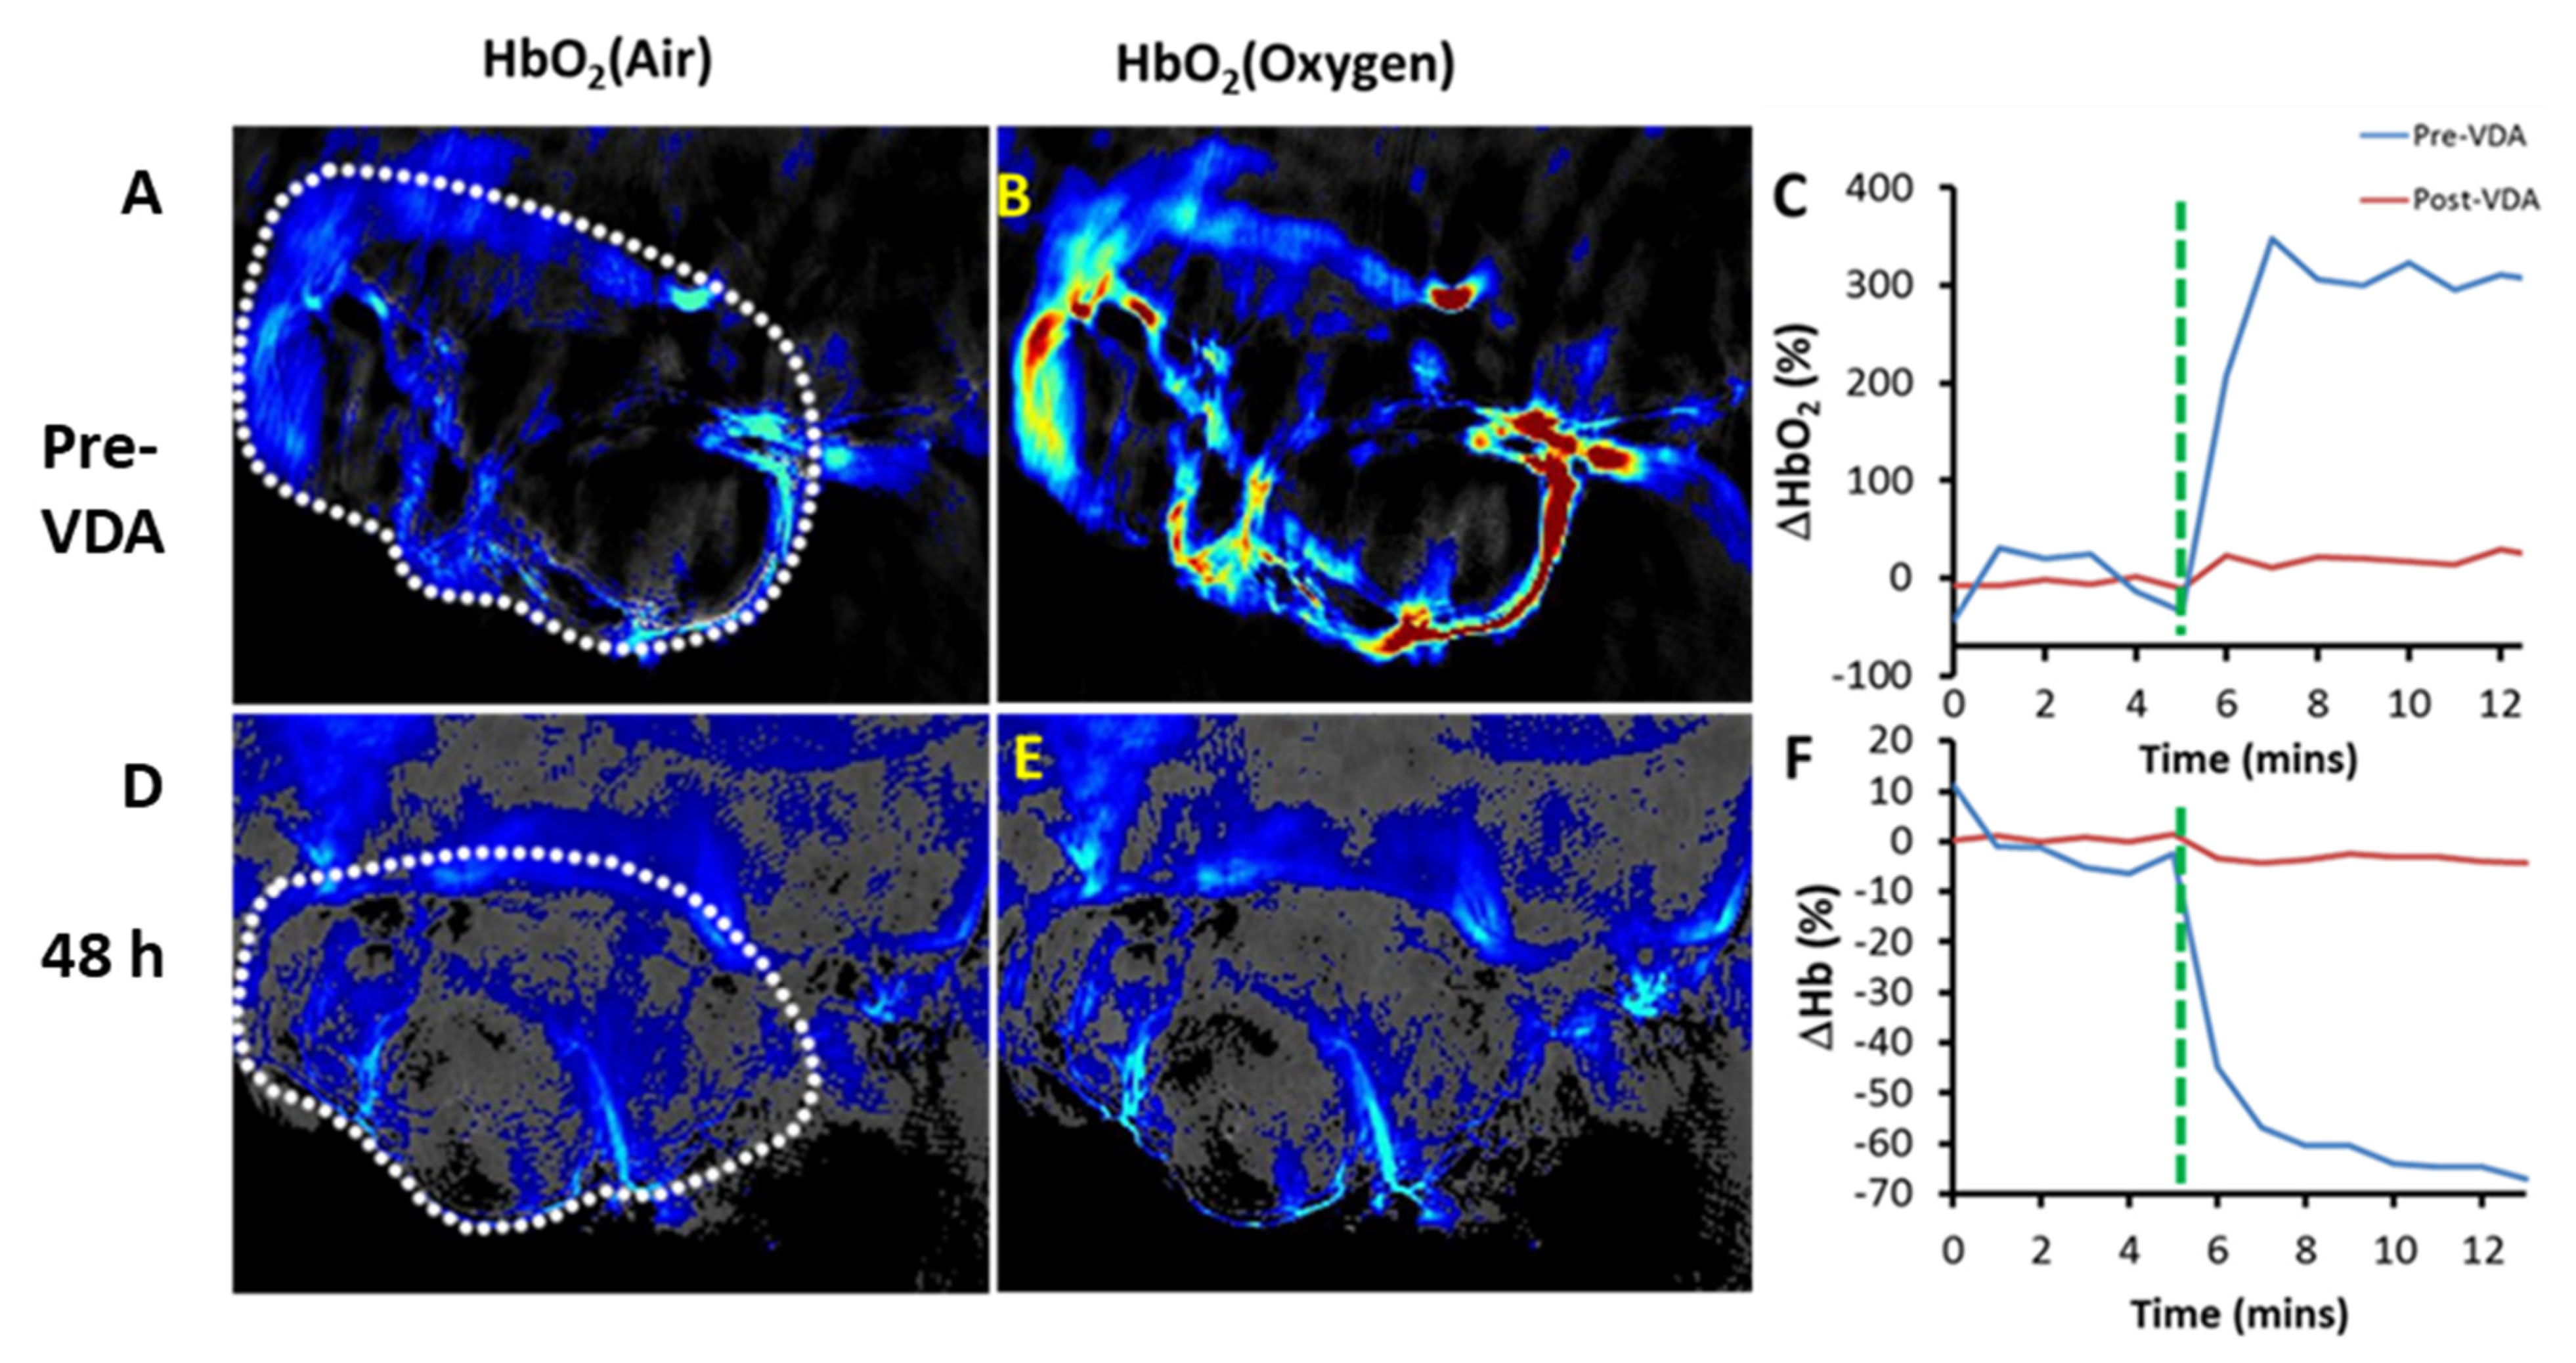
Appendix C. Typical Procedure for MSOT
Appendix D. Typical Procedure for US for Dog and Mouse
References
- Folkman, J. Tumor angiogenesis. Adv. Cancer Res. 1985, 43, 175–203. [Google Scholar] [CrossRef]
- Siemann, D.W.; Bibby, M.C.; Dark, G.G.; Dicker, A.P.; Eskens, F.A.; Horsman, M.R.; Marme, D.; Lorusso, P.M. Differentiation and definition of vascular-targeted therapies. Clin. Cancer Res. 2005, 11, 416–420. [Google Scholar]
- Denekamp, J. Vascular Attack as a Therapeutic Strategy for Cancer. Cancer Metastasis Rev. 1990, 9, 267–282. [Google Scholar] [CrossRef] [PubMed]
- Tozer, G.M.; Kanthou, C.; Baguley, B.C. Disrupting tumour blood vessels. Nat. Rev. Cancer 2005, 5, 423–435. [Google Scholar] [CrossRef] [PubMed]
- Mason, R.P.; Zhao, D.W.; Liu, L.; Trawick, M.L.; Pinney, K.G. A perspective on vascular disrupting agents that interact with tubulin: Preclinical tumor imaging and biological assessment. Integr. Biol. 2011, 3, 375–387. [Google Scholar] [CrossRef] [PubMed] [Green Version]
- Thorpe, P.E. Vascular targeting agents as cancer therapeutics. Clin. Cancer Res. 2004, 10, 415–427. [Google Scholar] [CrossRef] [Green Version]
- McDonald, D.M.; Choyke, P.L. Imaging of angiogenesis: From microscope to clinic. Nat. Med. 2003, 9, 713–725. [Google Scholar] [CrossRef]
- Kanthou, C.; Tozer, G.M. Microtubule depolymerizing vascular disrupting agents: Novel therapeutic agents for oncology and other pathologies. Int. J. Exp. Pathol. 2009, 90, 284–294. [Google Scholar] [CrossRef]
- Jayson, G.C.; Kerbel, R.; Ellis, L.M.; Harris, A.L. Antiangiogenic therapy in oncology: Current status and future directions. Lancet 2016, 388, 518–529. [Google Scholar] [CrossRef]
- Siemann, D.W. The unique characteristics of tumor vasculature and preclinical evidence for its selective disruption by Tumor-Vascular Disrupting Agents. Cancer Treat. Rev. 2011, 37, 63–74. [Google Scholar] [CrossRef] [Green Version]
- Liang, W.; Ni, Y.; Chen, F. Tumor resistance to vascular disrupting agents: Mechanisms, imaging, and solutions. Oncotarget 2016, 7, 15444–15459. [Google Scholar] [CrossRef]
- Hill, S.A.; Lonergan, S.J.; Denekamp, J.; Chaplin, D.J. Vinca Alkaloids-Antivascular Effects in a Murine Tumor. Eur. J. Cancer 1993, 29, 1320–1324. [Google Scholar] [CrossRef]
- Bai, R.; Hamel, E. (-)-Rhazinilam and the diphenylpyridazinone NSC 613241: Two compounds inducing the formation of morphologically similar tubulin spirals but binding apparently to two distinct sites on tubulin. Arch. Biochem. Biophys. 2016, 604, 63–73. [Google Scholar] [CrossRef] [PubMed] [Green Version]
- Pettit, G.R.; Singh, S.B.; Niven, M.L.; Hamel, E.; Schmidt, J.M. Isolation, structure, and synthesis of combretastatins A-1 and B-1, potent new inhibitors of microtubule assembly, derived from Combretum caffrum. J. Nat. Prod. 1987, 50, 119–131. [Google Scholar] [CrossRef] [PubMed]
- Pettit, G.R.; Singh, S.B.; Hamel, E.; Lin, C.M.; Alberts, D.S.; Garcia-Kendall, D. Isolation and structure of the strong cell growth and tubulin inhibitor combretastatin A-4. Experientia 1989, 45, 209–211. [Google Scholar] [CrossRef]
- Kanthou, C.; Tozer, G.M. The tumor vascular targeting agent combretastatin A-4-phosphate induces reorganization of the actin cytoskeleton and early membrane blebbing in human endothelial cells. Blood 2002, 99, 2060–2069. [Google Scholar] [CrossRef]
- Strecker, T.E.; Odutola, S.O.; Lopez, R.; Cooper, M.S.; Tidmore, J.K.; Charlton-Sevcik, A.K.; Li, L.; MacDonough, M.T.; Hadimani, M.B.; Ghatak, A.; et al. The vascular disrupting activity of O** oxygen-enhanced magnetic resonance imaging as a prognostic biomarker of radiation response. Cancer Lett. 2016, 380, 69–77. [Google Scholar] [CrossRef] [PubMed] [Green Version]
- Joseph, J.; Tomaszewski, M.R.; Quiros-Gonzalez, I.; Weber, J.; Brunker, J.; Bohndiek, S.E. Evaluation of Precision in Optoacoustic Tomography for Preclinical Imaging in Living Subjects. J. Nucl. Med. 2017, 58, 807–814. [Google Scholar] [CrossRef] [PubMed] [Green Version]
- McNally, L.R.; Mezera, M.; Morgan, D.E.; Frederick, P.J.; Yang, E.S.; Eltoum, I.E.; Grizzle, W.E. Current and Emerging Clinical Applications of Multispectral Optoacoustic Tomography (MSOT) in Oncology. Clin. Cancer Res. 2016, 22, 3432–3439. [Google Scholar] [CrossRef] [Green Version]
- Weber, J.; Beard, P.C.; Bohndiek, S.E. Contrast agents for molecular photoacoustic imaging. Nat. Methods 2016, 13, 639–650. [Google Scholar] [CrossRef] [Green Version]
- Abma, E.; De Spiegelaere, W.; Vanderperren, K.; Stock, E.; Van Brantegem, L.; Cornelis, I.; Daminet, S.; Ni, Y.; Vynck, M.; Verstraete, G.; et al. A single dose of intravenous combretastatin A4-phosphate is reasonably well tolerated and significantly reduces tumour vascularization in canine spontaneous cancers. Vet. Comp. Oncol. 2018, 16, 467–477. [Google Scholar] [CrossRef]
- Siim, B.G.; Laux, W.T.; Rutland, M.D.; Palmer, B.N.; Wilson, W.R. Scintigraphic imaging of the hypoxia marker (99m)technetium-labeled 2,2 ‘-(1,4-diaminobutane)bis(2-methyl-3-butanone) dioxime (Tc-99m-labeled HL-91; Prognox): Noninvasive detection of tumor response to the antivascular agent 5,6-dimethylxanthenone-4-acetic acid. Cancer Res. 2000, 60, 4582–4588. [Google Scholar]
- Liu, L.; Mason, R.P.; Gimi, B. Dynamic bioluminescence and fluorescence imaging of the effects of the antivascular agent Combretastatin-A4P (CA4P) on brain tumor xenografts. Cancer Lett. 2015, 356, 462–469. [Google Scholar] [CrossRef] [Green Version]
- Lee, J.A.; Biel, N.M.; Kozikowski, R.T.; Siemann, D.W.; Sorg, B.S. In vivo spectral and fluorescence microscopy comparison of microvascular function after treatment with O**4503, Sunitinib and their combination in Caki-2 tumors. Biomed. Opt. Express 2014, 5, 1965–1979. [Google Scholar] [CrossRef] [PubMed] [Green Version]
- Mita, M.M.; Sargsyan, L.; Mita, A.C.; Spear, M. Vascular-disrupting agents in oncology. Expert Opin. Investig. Drugs 2013, 22, 317–328. [Google Scholar] [CrossRef] [PubMed]
- Masunaga, S.; Nagasawa, H.; Nagata, K.; Suzuki, M.; Uto, Y.; Hori, H.; Kinashi, Y.; Ono, K. Dependency of the effect of a vascular disrupting agent on sensitivity to tirapazamine and gamma-ray irradiation upon the timing of its administration and tumor size, with reference to the effect on intratumor quiescent cells. J. Cancer Res. Clin. Oncol. 2007, 133, 47–55. [Google Scholar] [CrossRef] [PubMed]
- Zhao, D.; Chang, C.-H.; Kim, J.G.; Liu, H.; Mason, R.P. In vivo near-infrared spectroscopy and MRI monitoring of tumor response to Combretastatin A4 phosphate correlated with therapeutic outcome. Int. J. Radiat. Oncol. Biol. Phys. 2011, 80, 574–581. [Google Scholar] [CrossRef] [PubMed] [Green Version]
- Shen, N.; Wu, J.; Yang, C.G.; Yu, H.Y.; Yang, S.C.; Li, T.T.; Chen, J.T.; Tang, Z.H.; Chen, X.S. Combretastatin A4 Nanoparticles Combined with Hypoxia-Sensitive Imiquimod: A New Paradigm for the Modulation of Host Immunological Responses during Cancer Treatment. Nano Lett. 2019, 19, 8021–8031. [Google Scholar] [CrossRef] [PubMed]
- Welford, A.F.; Biziato, D.; Coffelt, S.B.; Nucera, S.; Fisher, M.; Pucci, F.; Di Serio, C.; Naldini, L.; De Palma, M.; Tozer, G.M.; et al. TIE2-expressing macrophages limit the therapeutic efficacy of the vascular-disrupting agent combretastatin A4 phosphate in mice. J. Clin. Investig. 2011, 121, 1969–1973. [Google Scholar] [CrossRef]


| Agent | Imaging Modality | Tumor Type | Trial | References |
|---|---|---|---|---|
| CA4P (fosbretabulin; Zybrestat) | DCE-MRI or -CT a DWI-MRI b 15O-PET | Lung cancer, ovarian, renal, breast | Phase 1 | [26,27,28,29] a [30] b [31] |
| CA1P (O**4503) | DCE-MRI 15O-PET | Various | Phase 1 | [32] |
| BNC105P | DCE MRI | Various | Phase 1 21 patients; now in Phase 2 | [33] |
| CYT997 | DCE-MRI | Various | 31 patients | [34] |
| AVE8062 (Ombrabulin) | DCE-US | Various, mostly ovarian | 25 patients | [35] |
| NPI2358 (Plinabulin) | DCE-MRI | Various | 38 patients | [36] |
| ZD6126 | DCE-MRI | Colon | [37] | |
| EPC2407 (Crolibulin) | DCE- & DWI-MRI | Various | 11 subjects, Phase 1 | [38] |
| MN-029 (Denibulin) | DCE-MRI | Various | 34 subjects, Phase 1 | [39] |
| DMXAA (ASA404; 5,6-dimethylxanthenone-4-acetic acid; vadimezan) | DCE-MRI | Various | Phase 1 | [40] |
| Agent | Imaging Modality | Tumor Type | References |
|---|---|---|---|
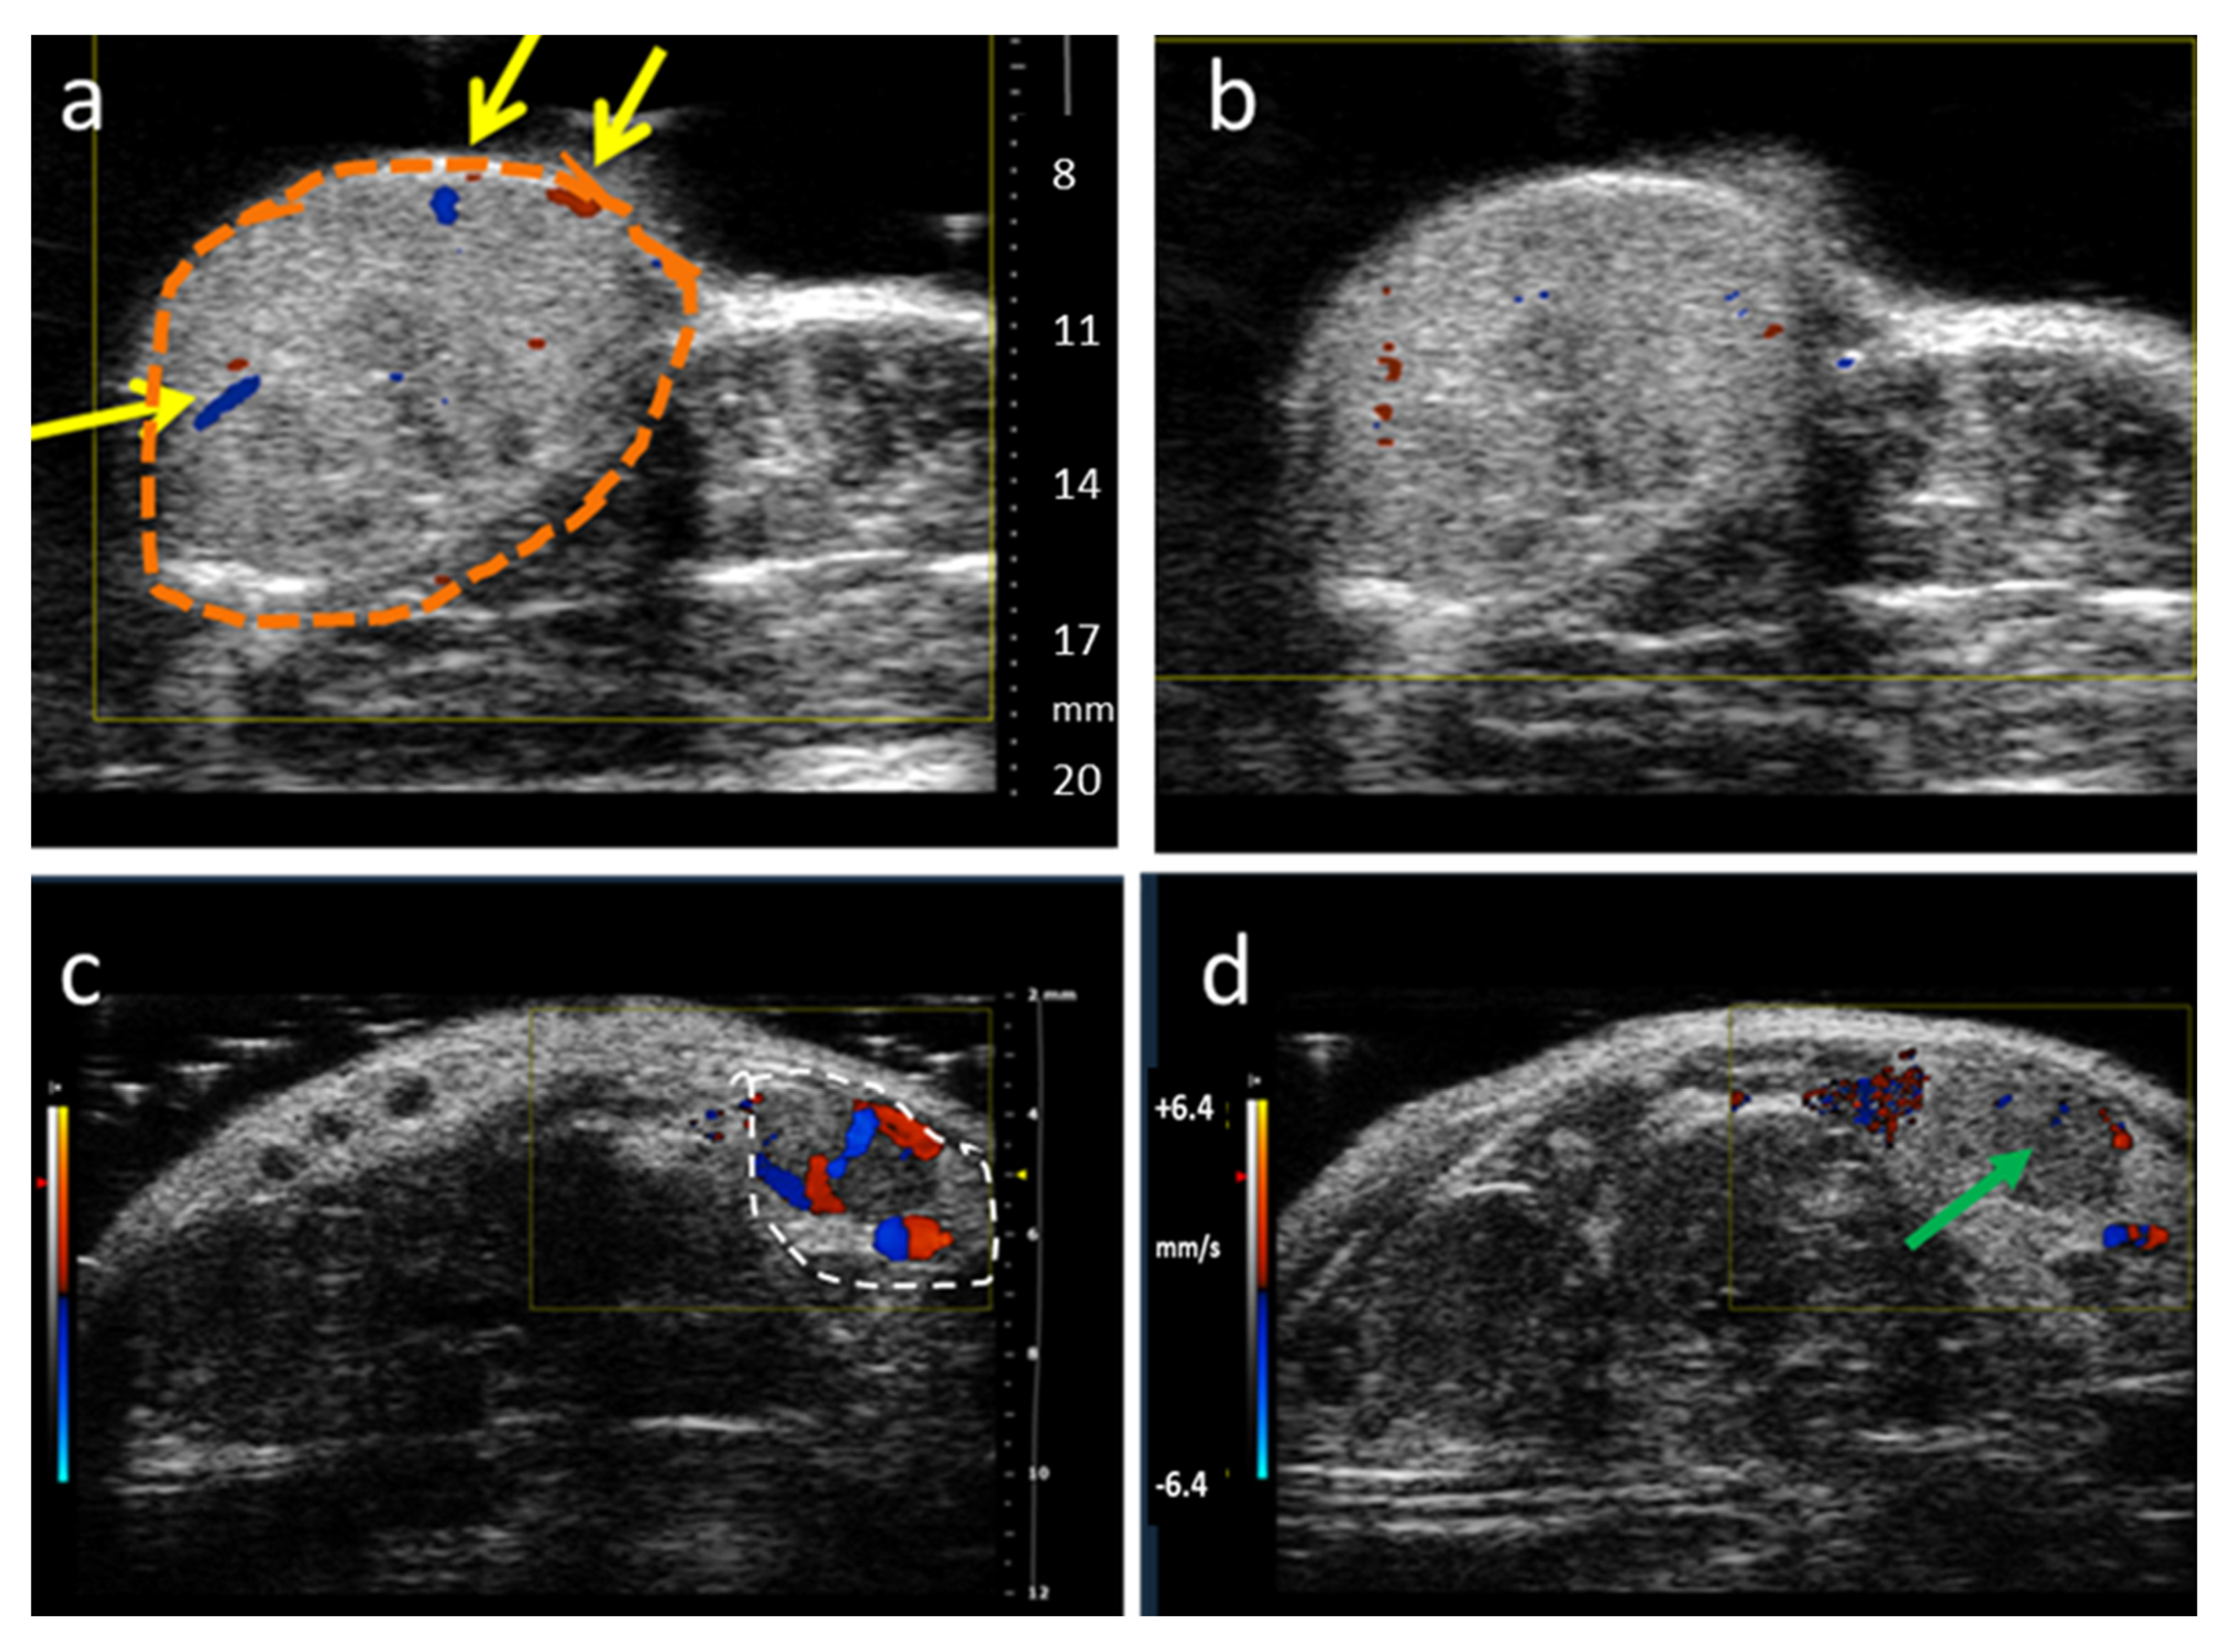
| CA4P | a BLI, b MRI, c MSOT/PAT, d PET/CT, e EPR, f US, g SPECT | Breast, liver, colorectal, bladder, pancreatic, prostate, lung, melanoma | a [5,89,90,91,92,93] cf. Figures 3 and 4 b [5,27,91,93,94,95,96,97,98,99,100,101,102,103,104,105,106,107] c [92] cf. Figures 8 and 9 d [105,108], e [95] f [109,110,111,112], g [113] |
| CA1P | a BLI, b MRI, c MSOT, d PET/CT, f US | Colorectal, H&N, breast | a [5,114,115] b [103,105,114,116,117] c [118,119] d [105], f [5,91] |
| BNC105P | BLI | Kidney | [120] |
| AVE8062 | BLI, MRI, FDG-PET, CE-US | Colon, Ovarian, H&N | [121,122,123] |
| NPI2358 | DCE-MRI | Breast, sarcoma | [124] |
| ZD6126 | DCE-MRI, BOLD MRI | Colon, breast, prostate, fibrosarcoma | [11,37,125,126,127,128] |
| BPR0L075 | BLI | Breast | [129] |
| EPC2407 | BOLD MRI, DCE-MRI, MSOT, BLI, US | Head & Neck, glioma, prostate | [130,131,132] |
| DMXAA | a BLI, b MRI, c MSOT, d FDG-PET | Breast, colorectal, glioma, kidney, H&N | a [133,134], b [91,96,134,135,136,137,138], c [133,139,140] d [141] |
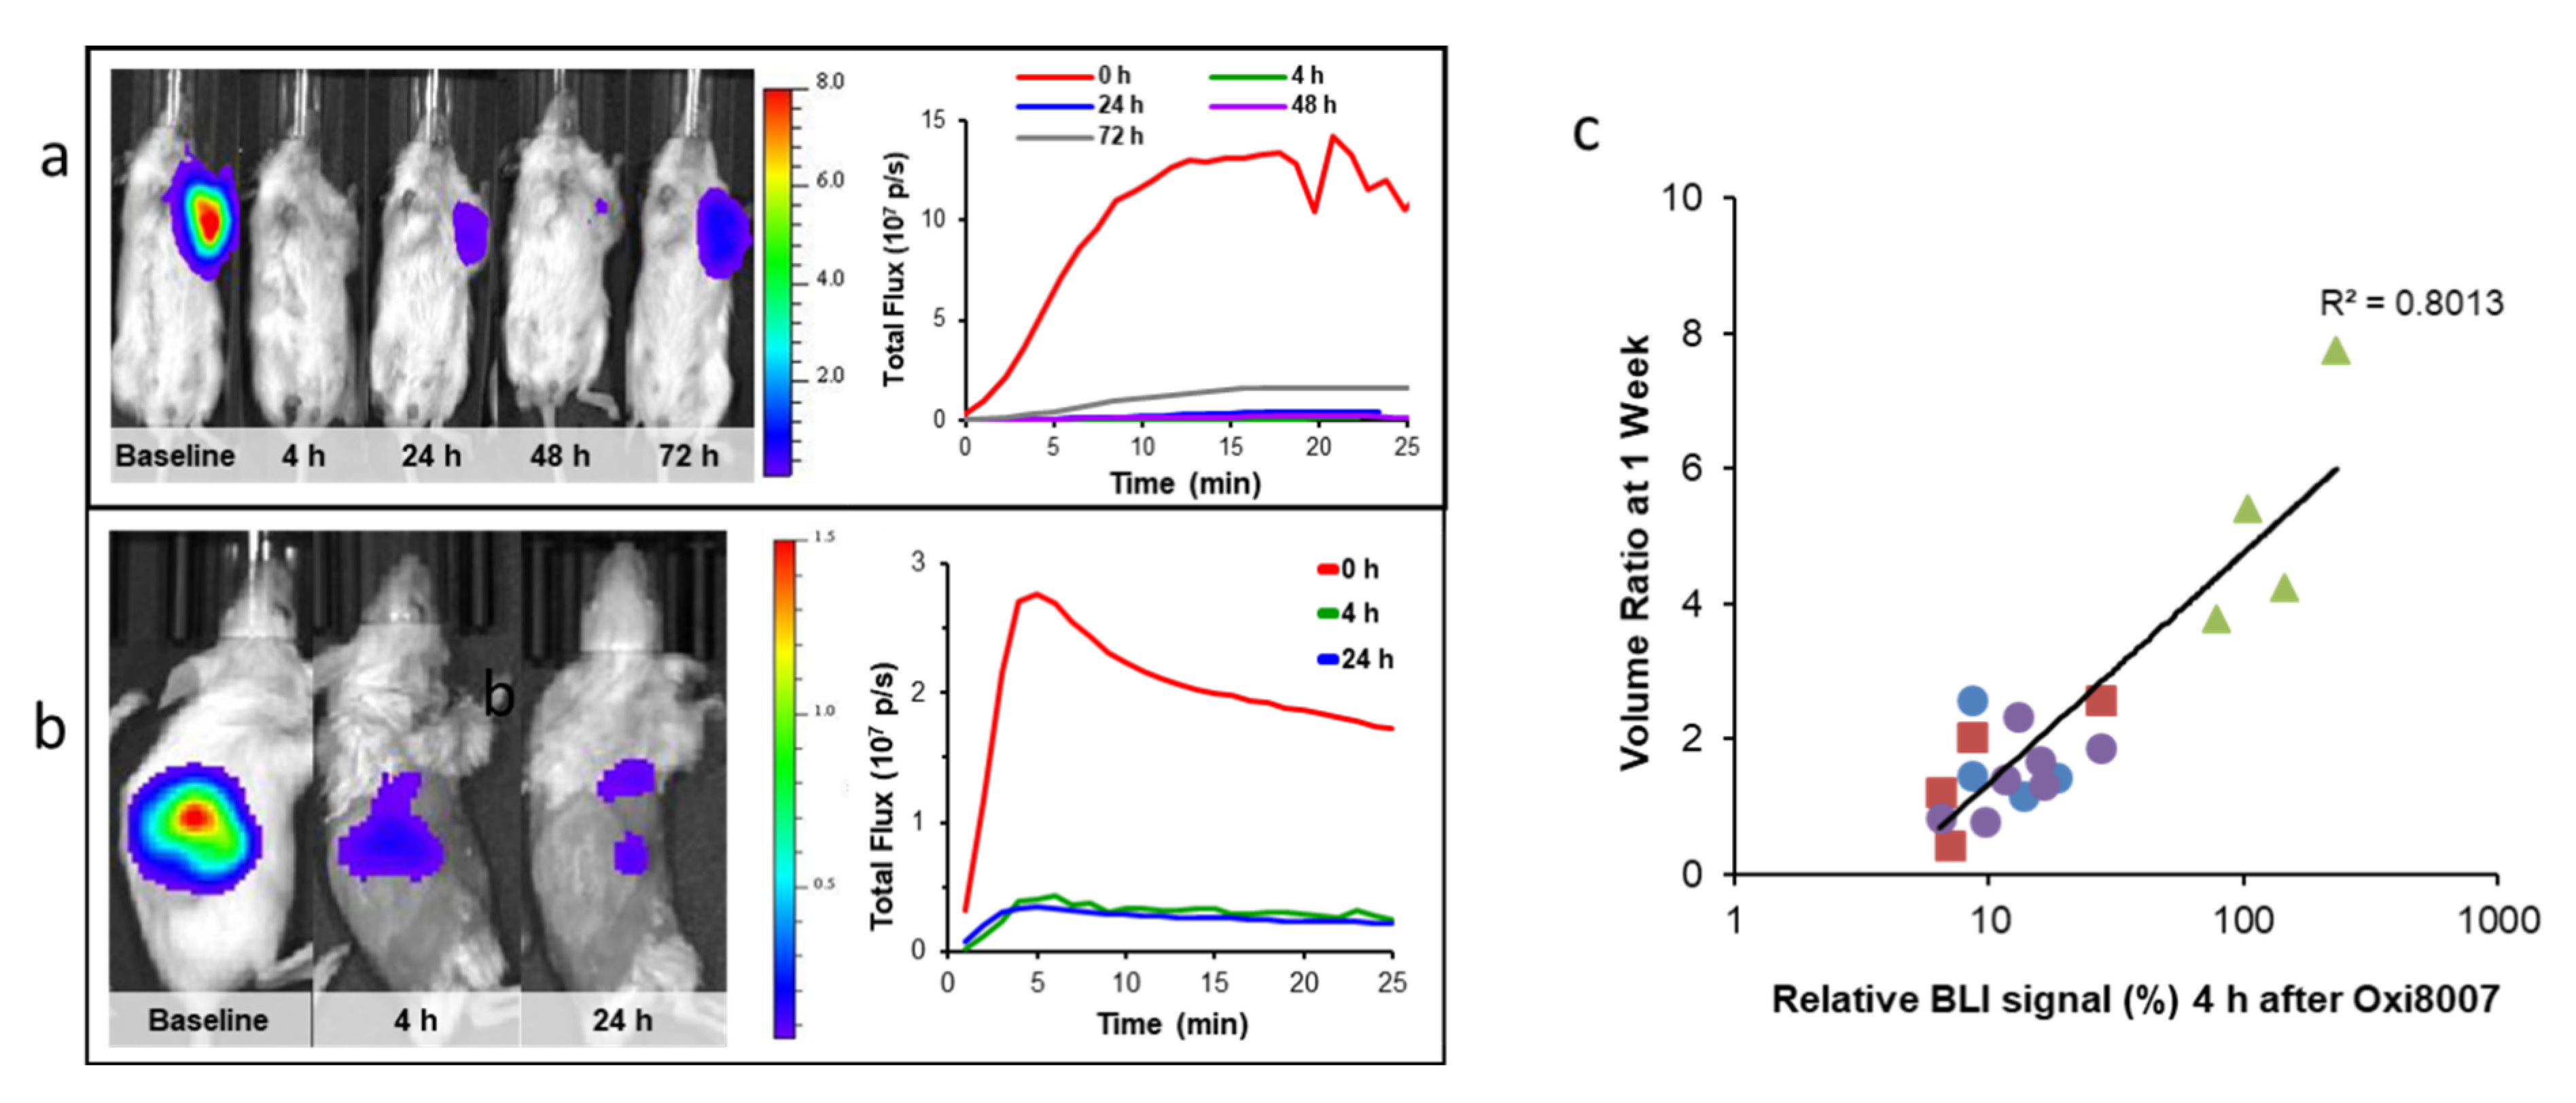
| O**8007 | BLI, MRI, US | Breast, prostate | [17,74,93] cf. Figures 5, 9 and 11 |
| C118P | MRI | Liver (rabbit) | [142] |
| ABT-751 | MRI | Glioma (rat) | [143] |
| CA4P analogs | BLI, US | Breast, prostate, lung | [66,74,144,145,146,147] |
| Targeted prodrugs | BLI | 4T1 breast | [148] |
| Nanoparticles | MRI, optical, MSOT | 4T1, MCF-7 breast | [149,150,151,152,153] |
| Conjugates | MSOT | Colon | [154] |
| MRI a | VDA | Tumor Type | References |
|---|---|---|---|
| Perfusion/flow/vascular permeability DCE; DSC | CA4P, DMXAA, EPC2407, ZD6126, CKD-516 | Liver, colorectal, pancreatic, breast, glioma, prostate, carcinosarcoma, VX2, kidney, H&N | [5,27,37,96,97,100,102,103,104,105,106,117,124,125,126,127,128,131,132,135,136,137,138,219,220,221] |
| Diffusion DWI/IVIM | CA4P, CKD-516 | Liver, rhabdomyosarcoma, lung, VX2 | [98,102,104,117,219,222] |
| ASL | CA1P | Colorectal | [116] |
| BOLD, OE-MRI, 19F oximetry | ZD6126, CA4P, O**8007 | Breast, bladder | [5,93,94,95,223] |
| CEST | TNF-α | SC colon tumors | [224] |
| pH | CA4P, DMXAA, ZD6126 | Breast | [91] |
| HP-pyruvate | CA1P, CA4P | Lymphoma, Breast | [105,225] |
| Modality | Cost | Throughput | Spatial Resolution | Temporal Resolution | Need for Contrast Agent | Ease of Use |
|---|---|---|---|---|---|---|
| BLI | $ | High 5–10 mice | Surface planar | 1 s | Yes | Easy |
| MRI | $$$$$ | Usually single subject | 200 µm in plane × 2 mm | s-mins | Typically, yes | Sophisticated methods available |
| MSOT | $$$ | Single subject | 120 µm in plane by 200 µm | s | No | Image quality very sensitive to meticulous setup |
| US | $$ | Single subject | 100 to 1000 µm | Sub second | Often | Fairly easy |
| PET/CT | $$$$$ | Typically, 1–4 mice or single larger subject | 3 mm isotropic | mins | Yes | Issues of radioactivity: expense/safety |
Short Biography of Authors
 | Li Liu has served on the faculty of UT Southwestern Medical Center in the department of Radiology since 2008 after completing her Ph.D. from Nankai University in Tian**, China, and postdoctoral fellowship training in molecular pharmacology at the Max Planck Chemical and Ecology Institute in Jena, Germany, in genetics and microbiology at the University of Florida, and in molecular imaging at UT Southwestern. Dr. Liu’s research focuses on development and application of reporter genes and molecular gene reporters for multimodality imaging, particularly related to cancer in small animal models. Dynamic imaging provides effective insight into tumor progression and response to therapy, particularly as applied to the development of vascular disputing agents in vivo. Most recently, she has explored multispectral optoacoustic tomography (MSOT) to provide real-time non-invasive insight into the vasculature of malignant tumors with respect to experimental drugs. |
 | Devin O’Kelly is a Computational Scientist at the BioHPC high-performance computing facility, located at the University of Texas Southwestern Medical Center at Dallas. He earned his Ph.D. in biomedical and molecular imaging with a supplement in computational and systems biology, develo** models and methods for interpreting MSOT data in the context of dynamic vascular imaging. His primary research interests focus on improving and enabling the effective analysis of high-dimensional imaging data, as well as relating acquired data to models of the underlying biological systems. |
 | Regan J. Schuetze is a research technician in the Prognostic Imaging Research Lab. He joined the lab at UT Southwestern in 2020 after graduating from Furman University with a degree in neuroscience. His previous research investigated the role of dopamine in post-traumatic stress disorder and comorbid substance abuse and his current research represents a new interest in broader physiology. |
 | Graham J. Carlson is a Ph.D. candidate at Baylor University carrying out research under the mentorship of Dr. Pinney. He joined the Pinney Laboratory in 2014 after graduating from Hope College with a degree in chemistry. His current research focuses on the design and synthesis of new inhibitors of tubulin polymerization together with corresponding vascular disrupting agents (VDAs) and various associated prodrugs, designed to enhance selectivity, efficacy and aqueous solubility of promising lead molecules. |
 | Heling Zhou received her undergraduate degree in biomedical engineering at Sun Yet-sen University and her doctorate degree in radiological sciences at UT Southwestern Medical Center. She developed imaging analytical techniques to assess tumor microenvironment and its relationship to treatment outcomes. She is now pursuing a career as a data engineer, building scalable data management and analytics solutions, and is currently a data engineer lead in a health-tech company develo** artificial intelligence for radiologists. |
 | Mary Lynn Trawick (formerly Dr. Mary Lynn Fink) is Associate Professor of Biochemistry in the Department of Chemistry and Biochemistry at Baylor University where she participates in the Institute for Biomedical Studies, the Molecular Biosciences Center, and the Center for Drug Discovery, and is a member of the Institutional Biosafety Committee. Her major research interests include the design, evaluation, and mechanism of action of novel anticancer agents with selectivity for the tumor microenvironment, and strategies to inhibit cancer metastasis. |
 | Kevin G. Pinney has served on the faculty of Baylor University in the Department of Chemistry and Biochemistry since 1993 after completing his Ph.D. at the University of Illinois, Urbana-Champaign and postdoctoral studies at the University of South Carolina. He is a Professor of Chemistry leading a dynamic research group focused on the design and synthesis of structurally diverse and biologically interesting small-molecule analogues, many of which are inspired by natural products. Well-established, diverse research projects include vascular disrupting agents (VDAs), inhibitors of tubulin polymerization, inhibitors of cathepsin L (and/or K), hypoxia-activated prodrugs and related drug-linker constructs. He teaches classes at both the undergraduate and graduate level in the area of organic chemistry. Research in his laboratory has been funded over the years by various grants from the National Institutes of Health, the Cancer Prevention and Research Institute of Texas (CPRIT), and a pharmaceutical company. He continues to enjoy productive research collaborations including those with the Mason Group (UT Southwestern Medical Center, Dallas, TX) and the Trawick Group (Baylor University). |
 | Ralph P. Mason is Professor of Radiology and Fellow of the Royal Society of Chemistry. He serves as the Director of the Small Animal Imaging Shared Resource at Simmons Comprehensive Cancer Center. He joined UT Southwestern 35 years ago after completing undergraduate and postgraduate studies at the University of Cambridge. His primary research interest is prognostic radiology: develo** and implementing methods for predicting optimal cancer therapy and assessing early response to treatment (precision medicine). His particular interests have long related to prostate and breast cancer and most recently lung and kidney. He serves as advisor to graduate students in biomedical engineering and cancer biology and as mentor to postdocs and young faculty. He has been the recipient of multiple awards from the NCI and CPRIT. For 10 years, he has collaborated closely with the team at Baylor University to evaluate novel small molecule vascular disrupting agents for selective cancer treatment. |
Publisher’s Note: MDPI stays neutral with regard to jurisdictional claims in published maps and institutional affiliations. |
© 2021 by the authors. Licensee MDPI, Basel, Switzerland. This article is an open access article distributed under the terms and conditions of the Creative Commons Attribution (CC BY) license (https://creativecommons.org/licenses/by/4.0/).
Share and Cite
Liu, L.; O’Kelly, D.; Schuetze, R.; Carlson, G.; Zhou, H.; Trawick, M.L.; Pinney, K.G.; Mason, R.P. Non-Invasive Evaluation of Acute Effects of Tubulin Binding Agents: A Review of Imaging Vascular Disruption in Tumors. Molecules 2021, 26, 2551. https://doi.org/10.3390/molecules26092551
Liu L, O’Kelly D, Schuetze R, Carlson G, Zhou H, Trawick ML, Pinney KG, Mason RP. Non-Invasive Evaluation of Acute Effects of Tubulin Binding Agents: A Review of Imaging Vascular Disruption in Tumors. Molecules. 2021; 26(9):2551. https://doi.org/10.3390/molecules26092551
Chicago/Turabian StyleLiu, Li, Devin O’Kelly, Regan Schuetze, Graham Carlson, Heling Zhou, Mary Lynn Trawick, Kevin G. Pinney, and Ralph P. Mason. 2021. "Non-Invasive Evaluation of Acute Effects of Tubulin Binding Agents: A Review of Imaging Vascular Disruption in Tumors" Molecules 26, no. 9: 2551. https://doi.org/10.3390/molecules26092551