
Propolis Efficacy: The Quest for Eco-Friendly Solvents
 , , and
Abstract
:
1. Introduction
2. Results and Discussion
2.1. Extraction Yield
2.2. Antimicrobial Activity
2.3. Antioxidant Activity
2.4. Chemical Characterization
2.4.1. In Vitro Evaluation of Total Ortho-Diphenols (TOC), Phenolics (TPC) and Flavonoids (TFC) Contents
2.4.2. UHPLC-DAD-ESI/MSn Analysis
2.5. Multivariate Analysis
3. Materials and Methods
3.1. Propolis Sample and Extracts Preparation
3.2. In Vitro Characterization of the Chemical Composition of Extracts of Propolis from Gerês Harvested in 2018
3.2.1. Total Ortho-Diphenols Content (TOC)
3.2.2. Total Phenolics Content (TPC)
3.2.3. Total Flavonoids Content (TFC)
3.3. Analysis of G18 Extracts Phenolic Compounds by UHPLC-DAD-ESI/MSn
3.4. In Vitro Evaluation of the Antioxidant Potential of Extracts of Propolis from Gerês Harvested in 2018
3.5. Antimicrobial Properties of G18 Extracts—Determination of Minimum Inhibitory Concentrations
3.6. Principal Component Analysis
3.7. Statistical Analysis
4. Conclusions
Supplementary Materials
Author Contributions
Funding
Institutional Review Board Statement
Informed Consent Statement
Data Availability Statement
Acknowledgments
Conflicts of Interest
Sample Availability
References
- Fokt, H.; Pereira, A.; Ferreira, A.M.; Cunha, A.; Aguiar, C. How do bees prevent hive infections? The antimicrobial properties of propolis. Curr. Res. Technol. Educ. Top. Appl. Microbiol. Microb. Biotechnol. 2010, 1, 481–493. [Google Scholar]
- Moreira, L.; Dias, L.; Pereira, J.A.; Estevinho, L. Antioxidant Properties, Total Phenols and Pollen Analysis of Propolis Samples from Portugal. Food Chem. Toxicol. 2008, 46, 3482–3485. [Google Scholar] [CrossRef] [PubMed] [Green Version]
- Pasupuleti, V.R.; Sammugam, L.; Ramesh, N.; Gan, S.H. Honey, propolis, and royal jelly: A comprehensive review of their biological actions and health benefits. Oxid Med. Cell Longev 2017, 2017, 1259510. [Google Scholar] [CrossRef] [PubMed] [Green Version]
- Santos-Buelga, C.; González-Paramás, A.M. Phenolic Composition of Propolis. Em: Bee Products—Chemical and Biological Properties; Alvarez-Suarez, J.M., Ed.; Springer International Publishing: Cham, Switzerland, 2017; pp. 99–111. [Google Scholar]
- Burdock, G.A. Review of the Biological Properties and Toxicity of Bee Propolis (propolis). Food Chem. Toxicol. 1998, 36, 347–363. [Google Scholar] [CrossRef]
- Pobiega, K.; Kraśniewska, K.; Derewiaka, D.; Gniewosz, M. Comparison of the antimicrobial activity of propolis extracts obtained by means of various extraction methods. J. Food Sci. Technol. 2019, 56, 5386–5395. [Google Scholar] [CrossRef] [Green Version]
- Sheng, J.; Zhou, J.; Wang, L.; Xu, J.; Hu, Q. Antioxidant activity of ethanol and petroleum ether extracts from Brazilian propolis. Eur. Food Res. Technol. 2007, 225, 249–253. [Google Scholar] [CrossRef]
- Asgharpour, F.; Moghadamnia, A.A.; Kazemi, S.; Nouri, H.R.; Motallebnejad, M. Applying GC-MS analysis to identify chemical composition of Iranian propolis prepared with different solvent and evaluation of its biological activity. Casp. J. Intern. Med. 2020, 11, 191. [Google Scholar]
- Kubiliene, L.; Laugaliene, V.; Pavilonis, A.; Maruska, A.; Majiene, D.; Barcauskaite, K.; Kubilius, R.; Kasparaviciene, G.; Savickas, A. Alternative preparation of propolis extracts: Comparison of their composition and biological activities. BMC Complement. Altern. Med. 2015, 15, 1–7. [Google Scholar] [CrossRef] [Green Version]
- Watanabe, M.A.E.; Amarante, M.K.; Conti, B.J.; Sforcin, J.M. Cytotoxic constituents of propolis inducing anticancer effects: A review. J. Pharm. Pharm. 2011, 63, 1378–1386. [Google Scholar] [CrossRef]
- Šuran, J.; Cepanec, I.; Mašek, T.; Starčević, K.; Tlak Gajger, I.; Vranješ, M.; Radić, B.; Radić, S.; Kosalec, I.; Vlainić, J. Nonaqueous polyethylene glycol as a safer alternative to ethanolic propolis extracts with comparable antioxidant and antimicrobial activity. Antioxidants 2021, 10, 978. [Google Scholar] [CrossRef]
- Pujirahayu, N.; Ritonga, H.; Uslinawaty, Z. Properties and flavonoids content in propolis of some extraction method of raw propolis. Int. J. Pharm. Pharm. Sci. 2014, 6, 338–340. [Google Scholar]
- Sun, C.; Wu, Z.; Wang, Z.; Zhang, H. Effect of ethanol/water solvents on phenolic profiles and antioxidant properties of Bei**g propolis extracts. Evid. Based Complement. Altern Med. 2015, 2015, 595393. [Google Scholar] [CrossRef] [PubMed] [Green Version]
- Cunha, I.; Sawaya, A.C.; Caetano, F.M.; Shimizu, M.T.; Marcucci, M.C.; Drezza, F.T.; Povia, G.S.; Carvalho, P.D.O. Factors that influence the yield and composition of Brazilian propolis extracts. J. Braz. Chem. Soc. 2004, 15, 964–970. [Google Scholar] [CrossRef]
- Mokhtar, S.U.; Hooi, H.S.; Lene, D.T.T.; Jayaraman, S. Comparison of total phenolic and flavonoids contents in Malaysian propolis extract with two different extraction solvents. Int. J. Eng. Technol. Sci. 2019, 6, 1–11. [Google Scholar] [CrossRef]
- Oroian, M.; Ursachi, F.; Dranca, F. Influence of ultrasonic amplitude, temperature, time and solvent concentration on bioactive compounds extraction from propolis. Ultrason. Sonochem. 2020, 64, 105021. [Google Scholar] [CrossRef] [PubMed]
- Stanciauskaite, M.; Marksa, M.; Babickaite, L.; Majiene, D.; Ramanauskiene, K. Comparison of Ethanolic and Aqueous Populus balsamifera L. Bud Extracts by Different Extraction Methods: Chemical Composition, Antioxidant and Antibacterial Activities. Pharmaceuticals 2021, 14, 1018. [Google Scholar] [CrossRef] [PubMed]
- Aboulghazi, A.; Bakour, M.; Fadil, M.; Lyoussi, B. Simultaneous Optimization of Extraction Yield, Phenolic Compounds and Antioxidant Activity of Moroccan Propolis Extracts: Improvement of Ultrasound-Assisted Technique Using Response Surface Methodology. Processes 2022, 10, 297. [Google Scholar] [CrossRef]
- Bankova, V.; Castro, S.L.; Marcucci, M.C. Propolis: Recent advances in chemistry and plant origin. Apidologie 2000, 31, 3–15. [Google Scholar] [CrossRef] [Green Version]
- Uzel, A.; Önçağ, Ö.; Çoğulu, D.; Gençay, Ö. Chemical compositions and antimicrobial activities of four different Anatolian propolis samples. Microbiol Res. 2005, 160, 189–195. [Google Scholar] [CrossRef]
- Freitas, A.S.; Cunha, A.; Cardoso, S.M.; Oliveira, R.; Almeida-Aguiar, C. Constancy of the bioactivities of propolis samples collected on the same apiary over four years. Food Res. Int. 2019, 119, 622–633. [Google Scholar] [CrossRef]
- Peixoto, M.; Freitas, A.S.; Cunha, A.; Oliveira, R.; Almeida-Aguiar, C. Antioxidant and antimicrobial activity of blends of propolis samples collected in different years. LWT 2021, 145, 111311. [Google Scholar] [CrossRef]
- Ramanauskienė, K.; Inkėnienė, A.M.; Petrikaitė, V.; Briedis, V. Total phenolic content and antimicrobial activity of different lithuanian propolis solutions. Evid. Based Complement. Altern Med. 2013, 2013, 842985. [Google Scholar] [CrossRef] [PubMed] [Green Version]
- Mavri, A.; Abramovič, H.; Polak, T.; Bertoncelj, J.; Jamnik, P.; Smole Možina, S.; Jeršek, B. Chemical properties and antioxidant and antimicrobial activities of Slovenian propolis. Chem. Biodivers. 2012, 9, 1545–1558. [Google Scholar] [CrossRef] [PubMed]
- Woźniak, M.; Mrówczyńska, L.; Waśkiewicz, A.; Rogoziński, T.; Ratajczak, I. Phenolic profile and antioxidant activity of propolis extracts from Poland. Nat. Prod. Commun. 2019, 14, 1934578X19849777. [Google Scholar] [CrossRef]
- Syed Salleh, S.N.A.; Mohd Hanapiah, N.A.; Ahmad, H.; Wan Johari, W.L.; Osman, N.H.; Mamat, M.R. Determination of total phenolics, flavonoids, and antioxidant activity and GC-MS analysis of Malaysian stingless bee propolis water extracts. Scientifica 2021, 2021, 3789351. [Google Scholar] [CrossRef]
- Ibrahim, M.E.E.D.; Alqurashi, R.M. Anti-fungal and antioxidant properties of propolis (bee glue) extracts. Int. J. Food Microbiol. 2022, 361, 109463. [Google Scholar] [CrossRef]
- Dönmez, M.; Karadeniz, Ş.; Yoldas, T.; Aydin, G.; Karagül, P.; Osman, A.K.S.U.; Rasgele, P.G. Comparison of Chemical Contents of Extracts in Different Solvents of Propolis Samples Produced in Duzce Province. Int. J. Tradit. Complement. Med. Res. 2020, 1, 137–146. [Google Scholar]
- Kubiliene, L.; Jekabsone, A.; Zilius, M.; Trumbeckaite, S.; Simanaviciute, D.; Gerbutaviciene, R.; Majiene, D. Comparison of aqueous, polyethylene glycol-aqueous and ethanolic propolis extracts: Antioxidant and mitochondria modulating properties. BMC Complement. Altern. Med. 2018, 18, 1–10. [Google Scholar] [CrossRef]
- Santos, F.A.; Bastos, E.M.A.; Uzeda, M.; Carvalho, M.A.R.; Farias, L.M.; Moreira, E.S.A.; Braga, F.C. Antibacterial activity of Brazilian propolis and fractions against oral anaerobic bacteria. J. Ethnopharmacol. 2002, 80, 1–7. [Google Scholar] [CrossRef]
- Kumazawa, S.; Hamasaka, T.; Nakayama, T. Antioxidant activity of propolis of various geographic origins. Food Chem. 2004, 84, 329–339. [Google Scholar] [CrossRef]
- Orsolić, N.; Saranović, A.B.; Basić, I. Direct and indirect mechanism(s) of antitumour activity of propolis and its polyphenolic compounds. Planta Med. 2006, 72, 20–27. [Google Scholar] [CrossRef] [PubMed] [Green Version]
- Chen, Y.J.; Huang, A.C.; Chang, H.H.; Liao, H.F.; Jiang, C.M.; Lai, L.Y.; Chan, J.T.; Chen, Y.Y.; Chiang, J. Caffeic acid phenethyl ester, an antioxidant from propolis, protects peripheral blood mononuclear cells of competitive cyclists against hyperthermal stress. J. Food Sci. 2009, 74, H162–H167. [Google Scholar] [CrossRef] [PubMed]
- Mihai, C.M.; Mărghitaş, L.A.; Dezmirean, D.S.; Bărnuţiu, L. Correlation between polyphenolic profile and antioxidant activity of propolis from Transylvania. Sci. Pap. Anim. Sci. Biotechnol. 2011, 44, 100–103. [Google Scholar]
- Yang, H.; Dong, Y.; Du, H.; Shi, H.; Peng, Y.; Li, X. Antioxidant compounds from propolis collected in Anhui, China. Molecules 2011, 16, 3444–3455. [Google Scholar] [CrossRef]
- Boisard, S.; Le Ray, A.M.; Gatto, J.; Aumond, M.C.; Blanchard, P.; Derbré, S.; Flurin, C.; Richomme, P. Chemical composition, antioxidant and anti-AGEs activities of a French poplar type propolis. J. Agric. Food Chem. 2014, 62, 1344–1351. [Google Scholar] [CrossRef]
- Daglia, M.; Di Lorenzo, A.; Nabavi, S.; Talas, Z.; Nabavi, S. Polyphenols: Well beyond the antioxidant capacity: Gallic acid and related compounds as neuroprotective agents: You are what you eat! Curr. Pharm. Biotechnol. 2014, 15, 362–372. [Google Scholar] [CrossRef]
- Patel, J.; Ketkar, S.; Patil, S.; Fearnley, J.; Mahadik, K.R.; Paradkar, A.R. Potentiating antimicrobial efficacy of propolis through niosomal-based system for administration. Integr Med. Res. 2014, 4, 94–101. [Google Scholar] [CrossRef] [Green Version]
- Boisard, S.; Le Ray, A.M.; Landreau, A.; Kempf, M.; Cassisa, V.; Flurin, C.; Richomme, P. Antifungal and antibacterial metabolites from a French poplar type propolis. Evid. Based Complement. Altern. Med. 2015, 2015, 319240. [Google Scholar] [CrossRef] [Green Version]
- Kandakumar, S.; Manju, D.V. Pharmacological applications of isorhamnetin: A short review. Int. J. Trend Res. Dev. 2017, 1, 672–678. [Google Scholar] [CrossRef]
- Li, Z.J.; Liu, M.; Dawuti, G.; Dou, Q.; Ma, Y.; Liu, H.G.; Aibai, S. Antifungal activity of gallic acid in vitro and in vivo. Phytother. Res. 2017, 31, 1039–1045. [Google Scholar] [CrossRef]
- de Moraes Alves, M.M.; Brito, L.M.; Souza, A.C.; de Carvalho, T.P.; Viana, F.J.C.; de Alcântara Oliveira, F.A.; Barreto, H.M.; de Sousa Macêdo Oliveira, J.S.; Chaves, M.H.; Arcanjo, D.D.R.; et al. Antimicrobial activity and cytotoxic assessment of gallic and ellagic acids. J. Interdiscip. Biociênc. 2018, 3, 17. [Google Scholar] [CrossRef] [Green Version]
- Adamczak, A.; Ożarowski, M.; Karpiński, T.M. Antibacterial activity of some flavonoids and organic acids widely distributed in plants. J. Clin. Med. 2019, 9, 109. [Google Scholar] [CrossRef] [Green Version]
- Tošović, J.; Bren, U. Antioxidative action of ellagic acid—A kinetic DFT study. Antioxidants 2020, 9, 587. [Google Scholar] [CrossRef] [PubMed]
- Tong, Z.; He, W.; Fan, X.; Guo, A. Biological Function of Plant Tannin and Its Application in Animal Health. Front. Vet. Sci. 2021, 8, 803657. [Google Scholar] [CrossRef] [PubMed]
- Mateos, R.; Espartero, J.L.; Trujillo, M.; Rios, J.J.; León-Camacho, M.; Alcudia, F.; Cert, A. Determination of phenols, flavones, and lignans in virgin olive oils by solid-phase extraction and high-performance liquid chromatography with diode array ultraviolet detection. J. Agric. Food Chem. 2001, 49, 2185–2192. [Google Scholar] [CrossRef] [PubMed]
- Mena, P.; Calani, L.; Dall’Asta, C.; Galaverna, G.; García-Viguera, C.; Bruni, R.; Crozier, A.; Del Rio, D. Rapid and comprehensive evaluation of (poly) phenolic compounds in pomegranate (Punica granatum L.) juice by UHPLC-MSn. Molecules 2012, 17, 14821–14840. [Google Scholar] [CrossRef] [Green Version]
- Sentandreu, E.; Cerdán-Calero, M.; Sendra, J.M. Phenolic profile characterization of pomegranate (Punica granatum) juice by high-performance liquid chromatography with diode array detection coupled to an electrospray ion trap mass analyzer. J. Food Compos. Anal. 2013, 30, 32–40. [Google Scholar] [CrossRef]
- Aguilar-Zárate, P.; Wong-Paz, J.E.; Michel, M.; Buenrostro-Figueroa, J.; Díaz, H.R.; Ascacio, J.A.; Contreras-Esquivel, J.C.; Gutiérrez-Sánchez, G.; Aguilar, C.N. Characterisation of pomegranate-husk polyphenols and semi-preparative fractionation of punicalagin. Phytochem. Anal. 2017, 28, 433–438. [Google Scholar] [CrossRef]
- Li, C.; Seeram, N.P. Ultra-fast liquid chromatography coupled with electrospray ionization time-of-flight mass spectrometry for the rapid phenolic profiling of red maple (Acer rubrum) leaves. J. Sep. Sci. 2018, 41, 2331–2346. [Google Scholar] [CrossRef]
- Dos Santos, C.; Galaverna, R.S.; Angolini, C.F.; Nunes, V.V.; De Almeida, L.F.; Ruiz, A.L.; de Carvalho, J.E.; Duarte, R.M.T.; Duarte, M.C.T.; Eberlin, M.N. Antioxidative, antiproliferative and antimicrobial activities of phenolic compounds from three Myrcia species. Molecules 2018, 23, 986. [Google Scholar] [CrossRef] [PubMed] [Green Version]
- Quintans-Júnior, L.J.; Gandhi, S.R.; Passos, F.R.S.; Heimfarth, L.; Pereira, E.W.M.; Monteiro, B.S.; dos Santos, K.S.; Duarte, M.C.; Abreu, L.S.; Nascimento, Y.M.; et al. Dereplication and quantification of the ethanol extract of Miconia albicans (Melastomaceae) by Hplc-Dad-Esi-/Ms/Ms, and assessment of its anti-hyperalgesic and anti-inflammatory profiles in a mice arthritis-like model: Evidence for involvement of TNF-α, IL-1β and IL-6. J. Ethnopharmacol. 2020, 258, 112938. [Google Scholar] [PubMed]
- Hanson, C.W.; Martin, W.J. Modified agar dilution method for rapid antibiotic susceptibility testing of anaerobic bacteria. Antimicrob. Agents Chemother. 1978, 13, 383–388. [Google Scholar] [CrossRef] [PubMed]


| Propolis Extracts | G18.EE | G18.EE70 | G18.HBE | G18.ME | G18.PGE | G18.WE |
|---|---|---|---|---|---|---|
| Yield (%) | 61.6 ± 1.2 a | 68.3 ± 0.7 a | 26.6 ± 2.8 b | 6.5 ± 1.0 c | 64.0 ± 5.2 a | 6.3 ± 0.7 c |
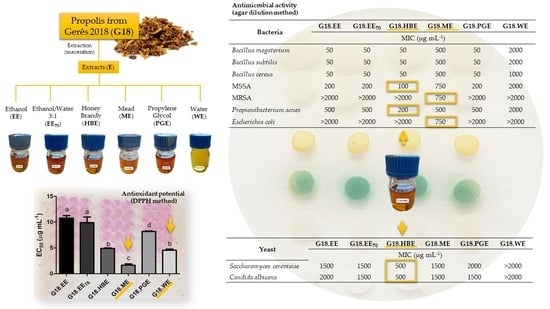
| Bacteria | G18.EE | G18.EE70 | G18.HBE | G18.ME | G18.PGE | G18.WE |
|---|---|---|---|---|---|---|
| MIC (µg/mL) | ||||||
| Bacillus megaterium | 50 | 50 | 50 | 500 | 50 | 2000 |
| Bacillus subtilis | 50 | 50 | 50 | 500 | 50 | 2000 |
| Bacillus cereus | 50 | 50 | 50 | 500 | 50 | 1000 |
| MSSA | 200 | 200 | 100 | 750 | 200 | 2000 |
| MRSA | >2000 | >2000 | >2000 | 750 | >2000 | >2000 |
| Propionibacterium acnes | 500 | 500 | 200 | 500 | 500 | 2000 |
| Escherichia coli | >2000 | >2000 | >2000 | 750 | >2000 | >2000 |
| Yeast | G18.EE | G18.EE70 | G18.HBE | G18.ME | G18.PGE | G18.WE |
|---|---|---|---|---|---|---|
| MIC (µg/mL) | ||||||
| Saccharomyces cerevisiae | 1500 | 1500 | 500 | 1500 | 2000 | >2000 |
| Candida albicans | 2000 | 1500 | 500 | 1500 | 1500 | >2000 |
| Propolis Extracts | G18.EE | G18.EE70 | G18.HBE | G18.ME | G18.PGE | G18.WE |
|---|---|---|---|---|---|---|
| DPPH• scavenging activity EC50 (µg/mL) | 10.78 ± 0.43 a | 9.91 ± 1.07 a | 4.90 ± 0.10 c | 1.63 ± 0.27 d | 8.17 ± 0.14 b | 4.54 ± 0.23 c |
| Propolis Extracts | Total Ortho-Diphenol Content | Total Phenolics Content | Total Flavonoid Content |
|---|---|---|---|
| mg GAE/g | mg GAE/g | mg QE/g | |
| G18.EE | 263.05 ± 15.19 a | 224.60 ± 10.86 a | 44.74 ± 1.26 a |
| G18.EE70 | 367.71 ± 18.86 b | 255.30 ± 3.26 a | 48.56 ± 0.64 b |
| G18.HBE | 664.16 ± 24.44 c | 581.40 ± 35.51 b | 50.97 ± 0.26 b |
| G18.ME | 1067.79 ± 37.24 d | 1267.57 ± 5.27 c | 13.26 ± 0.69 c |
| G18.PGE | 492.30 ± 6.52 f | 207.49 ± 8.55 a | 34.53 ± 2.43 e |
| G18.WE | 977.71 ± 51.59 e | 1261.11 ± 27.86 c | 7.40 ± 0.14 d |
Publisher’s Note: MDPI stays neutral with regard to jurisdictional claims in published maps and institutional affiliations. |
© 2022 by the authors. Licensee MDPI, Basel, Switzerland. This article is an open access article distributed under the terms and conditions of the Creative Commons Attribution (CC BY) license (https://creativecommons.org/licenses/by/4.0/).
Share and Cite
Freitas, A.S.; Cunha, A.; Parpot, P.; Cardoso, S.M.; Oliveira, R.; Almeida-Aguiar, C. Propolis Efficacy: The Quest for Eco-Friendly Solvents. Molecules 2022, 27, 7531. https://doi.org/10.3390/molecules27217531
Freitas AS, Cunha A, Parpot P, Cardoso SM, Oliveira R, Almeida-Aguiar C. Propolis Efficacy: The Quest for Eco-Friendly Solvents. Molecules. 2022; 27(21):7531. https://doi.org/10.3390/molecules27217531
Chicago/Turabian StyleFreitas, Ana Sofia, Ana Cunha, Pier Parpot, Susana M. Cardoso, Rui Oliveira, and Cristina Almeida-Aguiar. 2022. "Propolis Efficacy: The Quest for Eco-Friendly Solvents" Molecules 27, no. 21: 7531. https://doi.org/10.3390/molecules27217531