Article

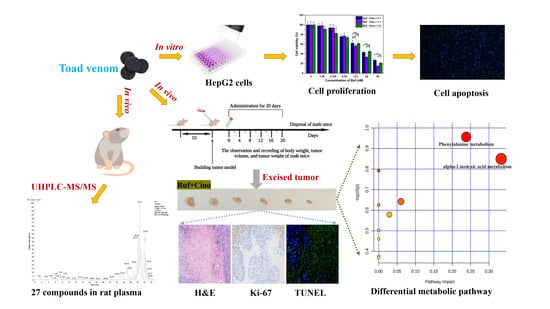
Uncovering the Mechanisms of Active Components from Toad Venom against Hepatocellular Carcinoma Using Untargeted Metabolomics

1
National Traditional Chinese Medicine Clinical Research Base, Drug Research Center of Integrated Traditional Chinese and Western Medicine, The Affiliated Traditional Chinese Medicine Hospital of Southwest Medical University, Luzhou 646000, China
2
State Key Laboratories for Quality Research in Chinese Medicines, Faculty of Chinese Medicine, Macau University of Science and Technology, Macau 853, China
3
Institute of Integrated Chinese and Western Medicine, Southwest Medical University, Luzhou 646000, China
*
Authors to whom correspondence should be addressed.
Molecules 2022, 27(22), 7758; https://doi.org/10.3390/molecules27227758
Submission received: 5 October 2022 / Revised: 7 November 2022 / Accepted: 8 November 2022 / Published: 10 November 2022
(This article belongs to the Special Issue Natural Products as Antitumor Agents)

Abstract

:
Toad venom, a dried product of secretion from Bufo bufo gargarizans Cantor or Bufo melanostictus Schneider, has had the therapeutic effects of hepatocellular carcinoma confirmed. Bufalin and cinobufagin were considered as the two most representative antitumor active components in toad venom. However, the underlying mechanisms of this antitumor effect have not been fully implemented, especially the changes in endogenous small molecules after treatment. Therefore, this study was designed to explore the intrinsic mechanism on hepatocellular carcinoma after the cotreatment of bufalin and cinobufagin based on untargeted tumor metabolomics. Ultraperformance liquid chromatography with tandem mass spectrometry (UHPLC-MS/MS) was performed to identify the absorbed components of toad venom in rat plasma. In vitro experiments were determined to evaluate the therapeutic effects of bufalin and cinobufagin and screen the optimal ratio between them. An in vivo HepG2 tumor-bearing nude mice model was established, and a series of pharmacodynamic indicators were determined, including the body weight of mice, tumor volume, tumor weight, and histopathological examination of tumor. Further, the entire metabolic alterations in tumor after treating with bufalin and cinobufagin were also profiled by UHPLC-MS/MS. Twenty-seven active components from toad venom were absorbed in rat plasma. We found that the cotreatment of bufalin and cinobufagin exerted significant antitumor effects both in vitro and in vivo, which were reflected in inhibiting proliferation and inducing apoptosis of HepG2 cells and thereby causing cell necrosis. After cotherapy of bufalin and cinobufagin for twenty days, compared with the normal group, fifty-six endogenous metabolites were obviously changed on HepG2 tumor-bearing nude mice. Meanwhile, the abundance of α-linolenic acid and phenethylamine after the bufalin and cinobufagin intervention was significantly upregulated, which involved phenylalanine metabolism and α-linolenic acid metabolism. Furthermore, we noticed that amino acid metabolites were also altered in HepG2 tumor after drug intervention, such as norvaline and Leu-Ala. Taken together, the cotreatment of bufalin and cinobufagin has significant antitumor effects on HepG2 tumor-bearing nude mice. Our work demonstrated that the in-depth mechanism of antitumor activity was mainly through the regulation of phenylalanine metabolism and α-Linolenic acid metabolism.

Graphical Abstract

1. Introduction

Hepatocellular carcinoma (HCC), the sixth most common cancer and the third leading cause of cancer death in the world in 2020, remains a major challenge to global public health [1]. Surgical resection is still the primary treatment for HCC patients diagnosed at the early stage, but it is not ideal for HCC patients diagnosed at the advanced stage [2]. Currently, despite the use of sorafenib, which can prolong the survival rate, the concomitant problems also greatly affect the prognosis of patients, such as severe side effects, short-term effects, and drug resistance [3]. Traditional Chinese medicine (TCM) has attracted increasing interest as a potential antitumor drug repository due to its beneficial effects and relatively low toxicity [4].
Toad venom, also named as Chansu, is a dried product of secretion from Bufo bufo gargarizans Cantor or Bufo melanostictus Schneider, which was firstly recorded in Yao ** to explain the in-depth mechanism of toad venom against HCC. After the intervention of Buf and Cino, the tumor growth of the Mix group was significantly inhibited. No obvious toxicity was observed in H&E staining results of major organs. An in vivo antitumor mechanism of Buf and Cino showed that Buf and Cino could inhibit cell proliferation and induce cell apoptosis on HepG2 tumor-bearing nude mice. Further, the tumor metabolomics results found that the abundance of many metabolite species in nude mice tumor changed significantly after the administration of Buf and Cino. The pathway enrichment of differential metabolites between the Mix group and the NS group were mainly involved in phenylalanine metabolism and α-linolenic acid metabolism.
It has been shown that the phenylalanine metabolism pathway was altered in gastric cancer and prostate cancer [28,29]. According to our studies, the biomarker that participated in phenylalanine metabolism in HCC was phenethylamine, which is an aromatic amino acid affecting the pathology of hepatitis B [14]. For example, phenylalanine metabolism efficiency decreased in the gut of patients with early chronic hepatitis B [30]. Moreover, phenylalanine could regulate substance metabolism as well as be a mediating factor of apoptosis. The induction of apoptosis by phenethylamine may be involved in three mechanisms: the FasR-mediated cell death receptor pathway, the Rho/ROCK pathway to activate mitochondria mediated apoptosis, and LAMP2 in graninase B signaling-mediated apoptosis [31]. Lamin B1 and PAK1 were found in the Fas/Fas ligand death receptor pathway, which have previously been shown to be involved in apoptosis [20]. Lamin B1, as the main component of the subnuclear layer, plays an important role in maintaining the integrity of the nuclear membrane. Destruction of nuclear membrane integrity is a sign of apoptosis. During the apoptosis process, Lamin B1 mRNA levels were decreased, which may be due to the induction of p53 or pRB tumor suppressor pathways [32]. References also indicated that downstream effector PAK1 of Fas/Fas ligand complex prevents apoptosis by restricting the expression of proapoptotic proteins or regulating post-translational modification of effectors [20]. Moustafa R. K et al. further confirmed that the altered phenylalanine metabolism activated several apoptosis pathways associated with key proteins such as HADHA and ACAT1 [20]. In view of the upregulation of phenethylamine in HCC with Buf and Cino cotreatment, an induction on cell apoptosis capacity can be speculated, which is consistent with the apoptotic phenotype observed in Buf and Cino-treated cells and tumor tissues.
α-linolenic acid metabolism is an extremely vital metabolic pathway that interferes with tumor proliferation and metabolism [33,34]. α-linolenic acid, a polyunsaturated fatty acid, has a variety of benefits, including improved immunity and anticancer and anti-inflammatory effects [35]. Due to its anti-inflammatory and antitumor properties, α-linolenic acid has been reported to be a potential adjuvant therapy candidate for breast, pancreatic, and colon cancer [36]. Currently, the main attention on the possible mechanism of α-linolenic acid inhibiting the growth of different breast cancer cell lines is increasing lipid peroxidation, altering the expression and activation of cell membrane receptors, changing transcription factors, and regulating tumor suppressor genes such as phosphatase and tensin homologous genes [37]. A study has shown that α-linolenic acid regulates the growth of cancer cells in breast cancer (MCF-7 and MDA-MB-231) and cervical cancer (SiHa and HeLa) by reducing NO release and inducing lipid peroxidation [38]. Julie K. et al. found that α-linolenic acid can reduce HER2-overexpressing breast cancer growth and demonstrated for the first time that docosahexaenoic acid (DHA) is responsible for the effects of α-linolenic acid-rich diets on HER2 signaling pathways [39]. Wang et al. found that α-linolenic acid could inhibit the migration of human triple-negative breast cancer cells by reducing the expression of Twist1 and inhibiting Twist1-mediated epithelial mesenchymal transformation [35]. Li et al. reported that dietary supplementation with α-linolenic acid induced n-3 LCPUFAs conversion and reduced prostate cancer growth in a mouse model [33]. Interestingly, the content of α-linolenic acid in HCC was lower than that of normal tissues [40]. In HepG2 cells, α-linolenic acid suppressed the proliferation, migration, and invasion. An evaluation of the underlying mechanisms suggested that α-linolenic acid enhances FXR expression and thus inhibits the Wnt/β-catenin signaling pathway, thereby hinting HCC progression [40]. Furthermore, Cis9 and trans11 conjugated linoleic acid induce HepG2 cell apoptosis by activating PPAR-γ signaling pathway [41]. Vecchini et al. reported that dietary intake of α-linolenic acid could decrease the expression of COX-2 and increase the apoptosis of liver cancer cells [42]. In this study, the abundance of α-linolenic acid detected in HepG2 tumor treated with Buf and Cino was significantly increased compared with the NS group, indicating their potential contribution to the progression of HCC.
Meanwhile, we noticed that amino acid metabolites were also altered in HepG2 tumor-bearing nude mice after the cotreatment of Buf and Cino, such as norvaline and Leu-Ala. Among them, norvaline, an isomer of valine, was involved in the cytotoxic activity of macrophages against breast tumor cells [43]. Furthermore, previous reports showed that norvaline could interact with gut microbiota to affect the occurrence of colorectal cancer [44]. A clinical study has confirmed that the levels of norvaline and Leu-Ala in plasma were significantly lower in patients with liver cancer than in healthy people. Compared with the NS group, the levels of these two amino acids were recovered after cotreatment of Buf and Cino, which is consistent with previous studies. Additionally, it is worth considering that some metabolites without ionization cannot be detected by UHPLC-MS/MS. So, in the future, nuclear magnetic resonance technology will be applied to make up for the deficiency of mass spectrometer detection [3]. Due to the limitation of the KEGG database and the MetaboAnalyst 5.0 database, several identified differential metabolites could not be matched with the corresponding KEGG ID, so they failed to participate in pathway enrichment, resulting in a small number of enriched pathways. Summarily, using Buf and Cino as model drugs, this study confirmed the antitumor activity of toad venom in HepG2 tumor-bearing nude mice and revealed its antitumor mechanism at a metabolic level. In our future work, transcriptomics and proteomics will be involved in deeper mechanism research of toad venom against HCC.

4. Materials and Methods

4.1. Materials and Reagents

Dried toad venom secretion originated from Bufo melanostictus Schneider was provided by Bei**g newborn toad breeding center (Bei**g, China) and authenticated as toad venom by Professor Qingrong Pu from the affiliated traditional Chinese medicine hospital of Southwest Medical University (Luzhou, China). Bufalin and cinobufagin were provided by Chengdu Ruifensi Biotechnology Co., LTD. Methanol, acetonitrile, and formic acid were purchased from Thermo Fisher Scientific (Shanghai, China) Co., Ltd. Cell-Counting-Kit-8 tests were obtained from Beyotime Biotechnology Co., Ltd. (Shanghai, China). Other reagents used in this study were of analytical reagent grade.

4.2. Cells and Animals

HepG2 cells were provided by Professor Jie Qing from the affiliated traditional Chinese medicine hospital of Southwest Medical University (Luzhou, China) and cultured in a DMEM high-glucose medium at 37 °C in an atmosphere containing 5% CO2. The female BALB/c nude mice (five weeks old) were purchased from Chongqing Tengxin Biotechnology Co., LTD (Chongqing, China). The nude mice were housed in a specific-pathogen-free (SPF) cleanliness level barrier system with a room temperature of 25 ± 2 °C and a relative humidity of 50 ± 10%. Animal welfare and experimental procedures were strictly performed in accordance with the Guide for the Care and Use of Laboratory Animals and the related ethics regulations of Southwest Medical University. Animal protocols were reviewed and approved by the Internal Animal Care and Use Committee of Southwest Medical University (Approval Number: 20211115-010).

4.3. In Vivo Compound Identification of Toad Venom in Rat Plasma

The sample preparation and UHPLC-MS/MS detection conditions are presented in the Supplementary Material. Based on the standard substances database established in our previous research, the prototypical compounds of toad venom in rat plasma were identified. Combined with reported references, metabolites of toad venom were further identified according to the first and second mass spectra of prototypes. The compounds absorbed in plasma were considered biologically active and deserved further study [45].

4.4. Cell Counting Kit-8 (CCK-8) Assay

The CCK-8 assay was used to study the antiproliferation of Buf and Cino. Briefly, HepG2 cells were grown in 96-well plates at a density of 1 × 10⁵ per well prior to the treatment with various concentrations of Buf (1.563, 3.125, 6.25, 12.5, 25, 50, 100, 200, 400 nM), Cino (12.5, 25, 50, 100, 200, 400, 800, 1600 nM), and Buf/Cino (2:1, 1:1, 1:2) for 24 h. Subsequently, the culture medium was removed and replaced by 10 μL CCK-8 reagent for an additional 2 h incubation. Finally, the absorbance (Abs) of each well was measured at 450 nm using a microplate reader (Synergy2, Biotek, Highland Park, IL, USA). The cell viability was calculated. The combination index (CI) was calculated according to the Chou–Talalay method, used for quantitative analysis of combination therapy in vitro [46].
Cell viability = [(AM − AB)/(AC − AB)]
AM, AC, and AB are defined as the absorbances of the drug-treated group, control group, and blank group, respectively.
CI = ( D 50 ) A D A + ( D 50 ) B D B
where (D) A and (D) B are the concentration of A and B used in combined therapy to achieve 50% inhibitory effects; (D50) A and (D50) B are the concentration of A and B to achieve the same effects individually.

4.5. Hoechst 33342 Staining Assay

HepG2 cells were grown in 6-well plates at a density of 2.5 × 10⁵ per well for 24 h. The culture medium was removed and replaced by Buf (12.5 nM), Cino (12.5 nM), and Buf/Cino (12.5/12.5 nM), respectively. After 24 h incubation, each well was added with 4% formaldehyde solution for the 30 min of fixation at −20 °C. After being washed twice with phosphate buffer, HepG2 cells were stained with Hoechst33342 solution for 10 min, then discarded and washed three times. Finally, a fluorescence microscope (Evos, Life Technologies, Carlsbad, CA, USA) was used to observe cell apoptosis.

4.6. In Vivo Antitumor Efficacy

To obtain tumor-bearing nude mice, the female BALB/c nude mice were injected with HepG2 cells (about 1 × 10⁷ cells) into the right armpit. When the volume of tumors reached about 100 mm3, nude mice were divided randomly into four groups (seven mice per group) as follows, (1) Normal Saline (NS, ip every two days, same dosing volume as Buf group), (2) Buf (ip every two days, 1 mg/kg), (3) Cino (ip every two days, 1.14 mg/kg), and (4) Mix (Buf (ip, 1 mg/kg) plus Cino (ip, 1.14 mg/kg)). Tumor volume and body weight of nude mice were monitored every two days during 20-day treatment. At day 20, the nude mice were sacrificed by cervical dislocation. The tumor volume (V) and the tumor inhibition rate (TIR) were calculated, respectively. The excised organs were used to evaluate the safety of the therapy. Pathological examinations, including H&E staining, Ki-67 staining, and TUNEL staining, were performed on the tumor tissues. The detailed procedures are shown in the Supplementary Material.
V = 0.5 × length × wide2
TIR = [(WC − WE) / WC] × 100%
where WE and WC are defined as the tumor weight of the experiment group and control group.

4.7. Nontargeted Metabolomics Analysis of Tumor Tissues

4.7.1. Metabolites Extraction

Firstly, 80 mg tumor tissue was weighed and slowly thawed at 4 °C. After that, the sample was immersed in 200 μL water to homogenize and treated with 800 μL precooled methanol/acetonitrile solution (1:1, v/v) to sonicate for 30 min at 4 °C. Then, it was placed at −20 °C for 2 h to precipitate protein. Subsequently, after centrifuging for 20 min at 4 °C at the rate of 14,000 rpm, the supernatant was taken and freeze-dried. Finally, 100 μL acetonitrile/water solution (1:1, v/v) was added to redissolve and vortex for 1 min. After centrifugation again at 14,000 gpm for 15 min at 4 °C, the supernatant was taken for UHPLC-Q-Exactive Orbitrap MS analysis.

4.7.2. UHPLC-Q-Exactive Orbitrap MS Analysis

In this study, UHPLC-Q-Exactive Orbitrap MS analysis was conducted with the application of the ThermoFisher Scientific Vanquish Ultra-High Performance Liquid Chromatography system associated with the ThermoFisher Scientific Q-Exactive Orbitrap mass spectrometer. The chromatographic separation was performed on the Xbridge BEH HILIC column (2.1 × 100 mm, 2.5 μm). The temperatures of the sample disk and column oven were set at 4 °C and 25 °C, respectively. The mobile phase consisted of solvent A (water containing 25 mM ammonium acetate and 25 mM ammonia solution) and B (acetonitrile). At a 0.3 mL/min flow rate, the injection volume was kept at 2 μL. The gradient elution procedure was as follows: 0–1.5 min, 98% B, 1.5–12 min, 98–2% B, 12–14 min, 2% B, 14–14.1 min, 2–98% B, and 14.1–17 min, 98% B. In order to avoid the influence of instrument detection signal fluctuation, random sequence was used for continuous analysis of samples. Quality control (QC) samples were inserted into the sample queue to monitor and evaluate the stability of the system and the reliability of the experimental data.
Further, the samples were analyzed by Q-Exactive Orbitrap mass spectrometer. Both the primary and secondary spectrograms of the samples were collected by electrospray ionization (ESI) in positive and negative ion modes. ESI source and mass spectrum setting parameters were as follows: atomizing gas auxiliary heating 1 (Gas1); 60, auxiliary heating 2 (Gas2); 60, curtain gas (CUR); 30 psi, ion source temperature; 600 °C, spray voltage (ISVF); ±5500 V (positive and negative two modes). Primary mass charge ratio detection range: 80–1200 Da; resolution: 60,000; scanning accumulation time: 100 ms. The secondary stage adopted the segmental acquisition method, with a: scanning range: 70–1200 Da; secondary resolution, 30,000; scanning accumulation time: 50 ms; dynamic exclusion time: 4 s.

4.7.3. MS Data Processing and Analysis

The original data were converted into MzXML format by ProteoWizard software. XCMS software was used for peak alignment, retention time correction, and peak area extraction. PCA and PLS-DA were performed via SIMCA-14.1 software. The screening condition of differential metabolites were VIP > 1 and p < 0.05 in the t-test, which was chosen as the in-depth metabolic pathway analysis. Eventually, pathway enrichment was obtained from the MetaboAnalyst 5.0 (https://www.metaboanalyst.ca, 10 September 2022) platform. All the data were expressed as mean ± standard deviation (SD). The independent sample’s t-test of two groups was performed by SPSS 26.0 (SPSS Inc., Chicago, IL, USA).

5. Conclusions

The current work identified the active components of toad venom in rat plasma. Next, we conducted in vitro and in vivo experiments to explore the underlying mechanism of Buf and Cino against HCC. The antitumor effect after the cotreatment of Buf and Cino was mainly through regulating the phenylalanine metabolism and α-Linolenic acid metabolism. It is suggested that amino acid metabolites such as norvaline and Leu-Ala may play the important role regarding toad venom in treating HCC. Taken together, these results suggest the use of toad venom as a promising candidate for further clinical studies against HCC.

Supplementary Materials

The following are available online at https://mdpi.longhoe.net/article/10.3390/molecules27227758/s1, Table S1. MS2 fragment of 27 compounds from toad venom extract detected in rat plasma. Table S2. Details of differential metabolites of HepG2 cell xenograft tumor among different groups compared with control group. Figure S1. Results of quality control. A Hotelling’s T2 test for the total sample in negative mode. B Multivariate control chart of QC samples in negative mode. C Relative standard deviation of QC samples in negative mode. D Pearson correlation analysis of QC samples in negative mode. E Principal component analysis of QC samples in negative mode. Figure S2. A and E Volcanograms showing up-and down-regulated metabolites between NS and Buf, NS and Cino group, respectively. Blue color indicates downregulated metabolites, while red color represents upregulated metabolites. B and F Score plot of 3D principal component analysis between NS and Buf, NS and Cino group, respectively. C and G Score plot of partial least-squares discriminant analysis between NS and Buf, NS and Cino group, respectively. D and H Corresponding validation plot between NS and Buf, NS and Cino group, respectively. Figure S3. A and C Correlation analysis of differential metabolites between NS and Buf, NS and Cino group, respectively. Red color indicates positive correlation and blue color indicates negative correlation. The higher the value, the stronger the correlation between the two metabolites. B and D Heatmap analysis of differential metabolites between NS and Buf, NS and Cino group, respectively. Red color indicates higher concentration of differential metabolites, blue color indicates concentration of differential metabolites. Figure S4. A-B Metabolic pathway of differential metabolites between NS and Buf, NS and Cino group enriched by MetaboAnalyst 5.0.

Author Contributions

Investigation, validation, data analysis, curation, and writing—original draft and visualization, P.L.; investigation, validation, and data analysis, Y.M.; data analysis, L.Y. and L.M.; visualization, C.S., Z.L. and M.M.; conceptualization and methodology, Q.S., S.Y. and W.R. All authors have read and agreed to the published version of the manuscript.

Funding

This work was supported by the Special Funding for Traditional Chinese Medicine Scientific Research from Sichuan Administration of Traditional Chinese Medicine (Number: 2020JC0150), Projects of the Affiliated Traditional Chinese Medicine Hospital of Southwest Medical University (Number: [2019] 119 and [2020] 33), University-level project of Southwest Medical University (Number: 2021ZKQN118), Innovation Team and Talents Cultivation Program of National Administration of Traditional Chinese Medicine (Number: ZYYCXTD-C-202207), and Innovation Team of Sichuan Provincial Administration of Traditional Chinese Medicine (Number: 2022C007).

Institutional Review Board Statement

Not applicable.

Informed Consent Statement

Not applicable.

Data Availability Statement

The Supplementary File shows all data produced in the course of this study.

Acknowledgments

Many thanks to the Jie Qing from the affiliated traditional Chinese medicine hospital of Southwest Medical University for the provision of HepG2 cells.

Conflicts of Interest

The authors declare no conflict of interest.

Abbreviations

ACAT1, Mitochondrial acetyl-CoA acetyltransferase; Buf, bufalin; Bcl-2, B-cell lymphoma-2; Bax, BCL2-Associated X; Cino, cinobufagin; CCK-8, cell counting Kit-8; CI, combination index; ESI, electrospray ionization; Fas, recombinant factor-related apoptosis; FasR, recombinant factor-related apoptosis receptor; FXR, Farnesoid X receptor; HCC: hepatocellular carcinoma; HADHA, hydroxyl-coenzyme A dehydrogenase/3-ketoacyl-coenzyme A thiolase; LAMP2, lysosomal-associated membrane protein 2; MCC, multivariate control chart; PCA, principal component analysis; PLS-DA, partial least squares discriminant analysis; QC, quality control; Rho/ROCK, Rho-associated kinase; TCM, traditional Chinese medicine.

References

  1. Wei, L.; Wang, Z.; **g, N.; Lu, Y.; Yang, J.; **ao, H.; Guo, H.; Sun, S.; Li, M.; Zhao, D.; et al. Frontier progress of the combination of modern medicine and traditional Chinese medicine in the treatment of hepatocellular carcinoma. Chin. Med. 2022, 17, 90. [Google Scholar] [CrossRef] [PubMed]
  2. Huang, J.; Chen, F.; Zhong, Z.; Tan, H.Y.; Wang, N.; Liu, Y.; Fang, X.; Yang, T.; Feng, Y. Interpreting the Pharmacological Mechanisms of Huachansu Capsules on Hepatocellular Carcinoma Through Combining Network Pharmacology and Experimental Evaluation. Front. Pharmacol. 2020, 11, 414. [Google Scholar] [CrossRef] [PubMed]
  3. Li, Z.; Bao, H. Anti-tumor effect of Inonotus hispidus petroleum ether extract in H22 tumor-bearing mice and analysis its mechanism by untargeted metabonomic. J. Ethnopharmacol. 2022, 285, 114898. [Google Scholar] [CrossRef] [PubMed]
  4. Fan, Y.; Ma, Z.; Zhao, L.; Wang, W.; Gao, M.; Jia, X.; Ouyang, H.; He, J. Anti-tumor activities and mechanisms of Traditional Chinese medicines formulas: A review. Biomed. Pharmacother. 2020, 132, 110820. [Google Scholar] [CrossRef] [PubMed]
  5. Wei, W.L.; Hou, J.J.; Wang, X.; Yu, Y.; Li, H.J.; Li, Z.W.; Feng, Z.J.; Qu, H.; Wu, W.Y.; Guo, D.A. Venenum bufonis: An overview of its traditional use, natural product chemistry, pharmacology, pharmacokinetics and toxicology. J. Ethnopharmacol. 2019, 237, 215–235. [Google Scholar] [CrossRef]
  6. Zhang, D.M.; Liu, J.S.; Tang, M.K.; Yiu, A.; Cao, H.H.; Jiang, L.; Chan, J.Y.; Tian, H.Y.; Fung, K.P.; Ye, W.C. Bufotalin from Venenum Bufonis inhibits growth of multidrug resistant HepG2 cells through G2/M cell cycle arrest and apoptosis. Eur. J. Pharmacol. 2012, 692, 19–28. [Google Scholar] [CrossRef]
  7. Qiu, D.Z.; Zhang, Z.J.; Wu, W.Z.; Yang, Y.K. Bufalin, a component in Chansu, inhibits proliferation and invasion of hepatocellular carcinoma cells. BMC Complement. Altern. Med. 2013, 12, 185. [Google Scholar] [CrossRef] [Green Version]
  8. Qi, F.; Inagaki, Y.; Gao, B.; Cui, X.; Xu, H.; Kokudo, N.; Li, A.; Tang, W. Bufalin and cinobufagin induce apoptosis of human hepatocellular carcinoma cells via Fas- and mitochondria mediated pathways. Cancer Sci. 2011, 102, 951–958. [Google Scholar] [CrossRef]
  9. Zhang, L.; Liang, B.; Xu, H.; Gong, Y.; Hu, W.; **, Z.; Wu, X.; Chen, X.; Li, M.; Shi, L.; et al. Cinobufagin induces FOXO1-regulated apoptosis, proliferation, migration, and invasion by inhibiting G9a in non-small-cell lung cancer A549 cells. J. Ethnopharmacol. 2022, 291, 115095. [Google Scholar] [CrossRef]
  10. Ren, W.; Chen, S.; Liao, Y.; Li, S.; Ge, J.; Tao, F.; Huo, Q.; Zhang, Y.; Zhao, Z. Near-infrared fluorescent carbon dots encapsulated liposomes as multifunctional nano-carrier and tracer of the anticancer agent cinobufagin in vivo and in vitro. Colloids Surf. B Biointerfaces 2019, 174, 384–392. [Google Scholar] [CrossRef]
  11. Yang, A.L.; Wu, Q.; Hu, Z.D.; Wang, S.P.; Tao, Y.F.; Wang, A.M.; Sun, Y.X.; Li, X.L.; Dai, L.; Zhang, J. A network pharmacology approach to investigate the anticancer mechanism of cinobufagin against hepatocellular carcinoma via downregulation of EGFR-CDK2 signaling. Toxicol. Appl. Pharmacol. 2021, 431, 115739. [Google Scholar] [CrossRef]
  12. Kim, G.H.; Fang, X.Q.; Lim, W.J.; Park, J.; Kang, T.B.; Kim, J.H.; Lim, J.H. Cinobufagin Suppresses Melanoma Cell Growth by Inhibiting LEF1. Int. J. Mol. Sci. 2020, 21, 6706. [Google Scholar] [CrossRef]
  13. Ren, W.; Han, L.; Luo, M.; Bian, B.; Guan, M.; Yang, H.; Han, C.; Li, N.; Li, T.; Li, S.; et al. Multi-component identification and target cell-based screening of potential bioactive compounds in toad venom by UPLC coupled with high-resolution LTQ-Orbitrap MS and high-sensitivity Qtrap MS. Anal. Bioanal. Chem. 2018, 410, 4419–4435. [Google Scholar] [CrossRef]
  14. Zhang, J.; Hong, Y.; **e, P.; Chen, Y.; Jiang, L.; Yang, Z.; Cao, G.; Chen, Z.; Liu, X.; Chen, Y.; et al. Spatial Lipidomics Reveals Anticancer Mechanisms of Bufalin in Combination with Cinobufagin in Tumor-Bearing Mice. Front. Pharmacol. 2020, 11, 593815. [Google Scholar] [CrossRef]
  15. Hou, Z.; Song, F.; **ng, J.; Zheng, Z.; Liu, S.; Liu, Z. Comprehensive fecal metabolomics and gut microbiota for the evaluation of the mechanism of Panax Ginseng in the treatment of Qi-deficiency liver cancer. J. Ethnopharmacol. 2022, 292, 115222. [Google Scholar] [CrossRef]
  16. Zhao, Y.Y.; Cheng, X.L.; Vaziri, N.D.; Liu, S.; Lin, R.C. UPLC-based metabonomic applications for discovering biomarkers of diseases in clinical chemistry. Clin. Biochem. 2014, 47, 16–26. [Google Scholar] [CrossRef] [Green Version]
  17. Tian, D.; Gao, Q.; Lin, J.; Chang, Z.; Wang, Y.; Shi, Y.; Su, R.; Han, Z.; Ma, D. Uncovering the mechanism of the Shenzhi Jiannao formula against vascular dementia using a combined network pharmacology approach and molecular biology. Phytomedicine 2021, 90, 153637. [Google Scholar] [CrossRef]
  18. Ploder, M.; Neurauter, G.; Spittler, A.; Schroecksnadel, K.; Roth, E.; Fuchs, D. Serum phenylalanine in patients post trauma and with sepsis correlate to neopterin concentrations. Amino Acids 2007, 35, 303–307. [Google Scholar] [CrossRef]
  19. Wiggins, T.; Kumar, S.; Markar, S.R.; Antonowicz, S.; Hanna, G.B. Tyrosine, phenylalanine, and tryptophan in gastroesophageal malignancy: A systematic review. Cancer Epidemiol. Biomarkers Prev. 2015, 24, 32–38. [Google Scholar] [CrossRef] [Green Version]
  20. Ali, M.R.; Wu, Y.; Han, T.; Zang, X.; **ao, H.; Tang, Y.; Wu, R.; Fernandez, F.M.; El-Sayed, M.A. Simultaneous Time-Dependent Surface-Enhanced Raman Spectroscopy, Metabolomics, and Proteomics Reveal Cancer Cell Death Mechanisms Associated with Gold Nanorod Photothermal Therapy. J. Am. Chem. Soc. 2016, 138, 15434–15442. [Google Scholar] [CrossRef]
  21. Rohrig, F.; Schulze, A. The multifaceted roles of fatty acid synthesis in cancer. Nat. Rev. Cancer 2016, 16, 732–749. [Google Scholar] [CrossRef]
  22. Wu, H.; Cheng, H.; Luo, S.; Peng, C.; Zhou, A.; Chen, Z.; Wu, H.; Li, Q. Use of cellular metabolomics and lipidomics to decipher the mechanism of Huachansu injection-based intervention against human hepatocellular carcinoma cells. J. Pharm. Biomed. Anal. 2022, 212, 114654. [Google Scholar] [CrossRef]
  23. Crous-Maso, J.; Palomeras, S.; Relat, J.; Camo, C.; Martinez-Garza, U.; Planas, M.; Feliu, L.; Puig, T. (-)-Epigallocatechin 3-Gallate Synthetic Analogues Inhibit Fatty Acid Synthase and Show Anticancer Activity in Triple Negative Breast Cancer. Molecules 2018, 23, 1160. [Google Scholar] [CrossRef] [Green Version]
  24. Fan, H.; Huang, W.; Guo, Y.; Ma, X.; Yang, J. alpha-Linolenic Acid Suppresses Proliferation and Invasion in Osteosarcoma Cells via Inhibiting Fatty Acid Synthase. Molecules 2022, 27, 2741. [Google Scholar] [CrossRef]
  25. Kong, W.S.; Shen, F.X.; **e, R.F.; Zhou, G.; Feng, Y.M.; Zhou, X. Bufothionine induces autophagy in H22 hepatoma-bearing mice by inhibiting JAK2/STAT3 pathway, a possible anti-cancer mechanism of cinobufacini. J. Ethnopharmacol. 2021, 270, 113848. [Google Scholar] [CrossRef]
  26. Chen, J.; Liu, Z.; Deng, F.; Liang, J.; Fan, B.; Zhen, X.; Tao, R.; Sun, L.; Zhang, S.; Cong, Z.; et al. Mechanisms of Lian-Gui-Ning-**n-Tang in the treatment of arrhythmia: Integrated pharmacology and in vivo pharmacological assessment. Phytomedicine 2022, 99, 153989. [Google Scholar] [CrossRef] [PubMed]
  27. Li, F.J.; Hu, J.H.; Ren, X.; Zhou, C.M.; Liu, Q.; Zhang, Y.Q. Toad venom: A comprehensive review of chemical constituents, anticancer activities, and mechanisms. Arch. Pharm. 2021, 354, e2100060. [Google Scholar] [CrossRef] [PubMed]
  28. Zhao, Y.; Lv, H.; Qiu, S.; Gao, L.; Ai, H. Plasma metabolic profiling and novel metabolite biomarkers for diagnosing prostate cancer. RSC Adv. 2017, 7, 30060–30069. [Google Scholar] [CrossRef] [Green Version]
  29. Lario, S.; Ramirez-Lazaro, M.J.; Sanjuan-Herraez, D.; Brunet-Vega, A.; Pericay, C.; Gombau, L.; Junquera, F.; Quintas, G.; Calvet, X. Plasma sample based analysis of gastric cancer progression using targeted metabolomics. Sci. Rep. 2017, 7, 17774. [Google Scholar] [CrossRef] [Green Version]
  30. Yao, X.; Li, Z.; Gong, X.; Fu, X.; **ao, X.; He, M.; Huang, B.; Xu, Z. Total saponins extracted from Abrus cantoniensis Hance suppress hepatitis B virus replication in vitro and in rAAV8-1.3HBV transfected mice. J. Ethnopharmacol. 2020, 249, 112366. [Google Scholar] [CrossRef]
  31. Qi, G.; Wang, B.; Zhang, Y.; Li, H.; Li, C.; Xu, W.; **, Y. Living-Cell Imaging of Mitochondrial Membrane Potential Oscillation and Phenylalanine Metabolism Modulation during Periodic Electrostimulus. Anal. Chem. 2019, 91, 9571–9579. [Google Scholar] [CrossRef]
  32. Freund, A.; Laberge, R.M.; Demaria, M.; Campisi, J. Lamin B1 loss is a senescence-associated biomarker. Mol. Biol. Cell 2012, 23, 2066–2075. [Google Scholar] [CrossRef]
  33. Fang, Z.; Huang, H.; Wang, L.; Lin, Z. Identification of the alpha linolenic acid metabolism-related signature associated with prognosis and the immune microenvironment in nasopharyngeal carcinoma. Front. Endocrinol. 2022, 13, 968984. [Google Scholar] [CrossRef]
  34. Gu, Z.; Suburu, J.; Chen, H.; Chen, Y.Q. Mechanisms of omega-3 polyunsaturated fatty acids in prostate cancer prevention. Biomed. Res. Int. 2013, 2013, 824563. [Google Scholar] [CrossRef] [Green Version]
  35. Wang, S.C.; Sun, H.L.; Hsu, Y.H.; Liu, S.H.; Lii, C.K.; Tsai, C.H.; Liu, K.L.; Huang, C.S.; Li, C.C. alpha-Linolenic acid inhibits the migration of human triple-negative breast cancer cells by attenuating Twist1 expression and suppressing Twist1-mediated epithelial-mesenchymal transition. Biochem. Pharmacol. 2020, 180, 114152. [Google Scholar] [CrossRef]
  36. Li, Q.; Liu, X.; Wang, X.; Qiu, S.; Byambasuren, K.; Dang, L.; Wang, Z. Antiproliferative Ability and Fluorescence Tracking of alpha-Linolenic Acid-Loaded Microemulsion as Label-Free Delivery Carriers in MDA-MB-231 Cells. J. Agric. Food Chem. 2019, 67, 11518–11526. [Google Scholar] [CrossRef]
  37. Wiggins, A.K.; Mason, J.K.; Thompson, L.U. Growth and gene expression differ over time in alpha-linolenic acid treated breast cancer cells. Exp. Cell Res. 2015, 333, 147–154. [Google Scholar] [CrossRef]
  38. Kim, K.B.; Nam, Y.A.; Kim, H.S.; Hayes, A.W.; Lee, B.M. alpha-Linolenic acid: Nutraceutical, pharmacological and toxicological evaluation. Food Chem. Toxicol. 2014, 70, 163–178. [Google Scholar] [CrossRef]
  39. Mason, J.K.; Klaire, S.; Kharotia, S.; Wiggins, A.K.; Thompson, L.U. alpha-linolenic acid and docosahexaenoic acid, alone and combined with trastuzumab, reduce HER2-overexpressing breast cancer cell growth but differentially regulate HER2 signaling pathways. Lipids Health Dis. 2015, 14, 91. [Google Scholar] [CrossRef] [Green Version]
  40. Feng, S.; **e, X.; Chen, C.; Zuo, S.; Zhao, X.; Li, H. Alpha-linolenic acid inhibits hepatocellular carcinoma cell growth through Farnesoid X receptor/beta-catenin signaling pathway. Nutr. Metab. 2022, 19, 57. [Google Scholar] [CrossRef]
  41. Lu, G.; Zhang, G.; Zheng, X.; Zeng, Y.; Xu, Z.; Zeng, W.; Wang, K. c9, t11- conjugated linoleic acid induces HCC cell apoptosis and correlation with PPAR-γ signaling pathway. Am. J. Transl. Res. 2015, 7, 2752–2763. [Google Scholar] [PubMed]
  42. Vecchini, A.; Ceccarelli, V.; Susta, F.; Caligiana, P.; Orvietani, P.; Binaglia, L.; Nocentini, G.; Riccardi, C.; Calviello, G.; Palozza, P.; et al. Dietary alpha-linolenic acid reduces COX-2 expression and induces apoptosis of hepatoma cells. J. Lipid Res. 2004, 45, 308–316. [Google Scholar] [CrossRef] [PubMed] [Green Version]
  43. Zhu, Q.; Zai, H.; Zhang, K.; Zhang, X.; Luo, N.; Li, X.; Hu, Y.; Wu, Y. L-norvaline affects the proliferation of breast cancer cells based on the microbiome and metabolome analysis. J. Appl. Microbiol. 2022, 133, 1014–1026. [Google Scholar] [CrossRef]
  44. Coker, O.O.; Liu, C.; Wu, W.K.K.; Wong, S.H.; Jia, W.; Sung, J.J.Y.; Yu, J. Altered gut metabolites and microbiota interactions are implicated in colorectal carcinogenesis and can be non-invasive diagnostic biomarkers. Microbiome 2022, 10, 35. [Google Scholar] [CrossRef]
  45. Qu, J.; Ke, F.; Liu, Z.; Yang, X.; Li, X.; Xu, H.; Li, Q.; Bi, K. Uncovering the mechanisms of dandelion against triple-negative breast cancer using a combined network pharmacology, molecular pharmacology and metabolomics approach. Phytomedicine 2022, 99, 153986. [Google Scholar] [CrossRef] [PubMed]
  46. Wei, M.M.; Wu, P.; Gao, J.N.; Wang, Y.J.; Zhou, J.L.; **e, T.; Dong, X.M.; Fang, C.; Song, G.Q.; Huang, Z.H. A combination index and glycoproteomics-based approach revealed synergistic anticancer effects of curcuminoids of turmeric against prostate cancer PC3 cells. J. Ethnopharmacol. 2021, 267, 113467. [Google Scholar] [CrossRef] [PubMed]
Figure 1. Identification of active components of toad venom in rat blood. (A) Blank blood. (B) Toad venom in rat blood. (C) Toad venom extract.
Molecules 27 07758 g001
Figure 2. The detailed chemical structure of identified components of blood in rat plasma.
Molecules 27 07758 g002
Figure 3. The HepG2 cells viability were cultured in different concentrations of drugs for 24 h. (A) Buf, (B) Cino, (C) used in combination. (D) Hoechst 33342 staining was performed by the treatment of Buf, Cino, and the combination, respectively. “*” means p < 0.05, and “**” means p < 0.01 between two groups.
Molecules 27 07758 g003
Figure 4. The cotreatment of bufalin and cinobufagin inhibited the HepG2 tumor growth. (A) The designed experimental scheme on in vivo nude mice model. (BD) Changes in tumor volume, body weight, and tumor weight during 20 days’ drug intervention. (E) The excised tumor images with the treatment of NS, Buf, Cino, and in combination for 20 days. Values were presented as the mean ± S.D., n = 6. “**” means p < 0.01 between two groups.
Molecules 27 07758 g004
Figure 5. H&E staining analysis of major organs (heart, liver, spleen, lung, kidney) of HepG2 tumor-bearing nude mice model after 20 days’ drug intervention (original magnification: 200×).
Molecules 27 07758 g005
Figure 6. Pathological analysis of tumor with different treatment groups. H&E staining, pale pink areas suggest necrosis area. Ki-67 staining, Brown color represents the nucleus of vigorously proliferating cells. TUNEL staining, green fluorescence represents the nucleus of apoptotic cells. (Original magnification: 200× and 400×).
Molecules 27 07758 g006
Figure 7. Results of quality control. (A) Hotelling’s T2 test for the total sample in positive mode. (B) Multivariate control chart of QC samples in positive mode. (C) Relative standard deviation of QC samples in positive mode. (D) Pearson correlation analysis of QC samples in positive mode. (E) Principal component analysis of QC samples in positive mode.
Molecules 27 07758 g007
Figure 8. (A) Volcanograms showing up- and downregulated metabolites between NS and Mix group. Blue color indicates downregulated metabolites, while red color represents upregulated metabolites. (B) Score plot of 3D principal component analysis between NS and Mix group. (C) Score plot of partial least-squares discriminant analysis between NS and Mix group. (D) Corresponding validation plot from NS and Mix group.
Molecules 27 07758 g008
Figure 9. (A) Correlation analysis of differential metabolites between NS and Mix group. Red color indicates positive correlation and blue color indicates negative correlation. The higher the value, the stronger the correlation between the two metabolites. (B) Heatmap analysis of differential metabolites between NS and Mix group. Red color indicates higher concentration of differential metabolites, blue color indicates concentration of differential metabolites.
Molecules 27 07758 g009
Figure 10. (A) Metabolic pathway of differential metabolites between NS and Mix group enriched by MetaboAnalyst 5.0. (B,C) KEGG enrichment pathway of α-linolenic acid metabolism and phenylalanine metabolism, respectively.
Molecules 27 07758 g010
Table 1. UHPLC-HR-Q-Exactive Orbitrap MS data of 27 compounds from toad venom extract detected in rat plasma.
NoCompoundTypeRT
(Min)
Chemical FormulaError (Ppm)[M+H]+
Measured Mass
[M+H]+
Calculated Mass
1Bufotenidine-5-O-
glucuronide
M2.54C19H27O7N2−0.399395.18112395.1812
2BufotenidineP2.62C13H19ON2−0.020219.14917219.1492
3Pitneloyl arginineP5.28C13H25O5N4−1.060317.18185317.1820
4Suberoyl arginineP7.43C14H27O5N4−0.533331.19702331.1976
51-hydroxylarenobufaginM9.15C24H33O7−1.546433.22128433.2148
65-hydroxylarenobufaginM9.65C24H33O7−1.477433.22131433.2148
716-hydroxylarenobufaginM10.01C24H33O7−1.200433.22153433.2148
8HydratalbufarenoginM10.06C24H35O7−0.490435.23709435.2377
911α-hydroxytelocinobufaginP10.52C24H35O6−1.491419.24234419.2428
10Ψ-BufarenoginP10.75C24H33O6−1.522417.22638417.2272
11GamabufotalinP11.34C24H35O5−1.837403.24756403.2479
12BufarenoginP11.94C24H33O60.539417.22726417.2272
1319-hydroxylbufalinP12.43C24H35O5−0.101403.24799403.2479
14ArenobufaginP12.88C24H33O6−1.522417.22733417.2272
15DesacetylbufotalinP13.16C24H35O5−0.324403.24774403.2479
16HellebrigenolP13.38C24H35O60.035419.24289419.2428
17HellebrigeninP13.76C24H33O6−0.132417.22711417.2272
18BufotalininP15.97C24H31O6−1.241415.21106415.2115
19TelocinobufaginP22.47C24H35O5−0.101403.24774403.2479
20CinobufaginolP24.43C26H35O7−0.784459.23801459.2377
21DesacetylcinobufaginP26.84C24H33O5−0.901401.23135401.2323
22BufalinP26.95C24H35O4−1.178387.25244387.2530
23ResibufogeninP28.69C24H33O4−0.950385.23697385.2373
24CinobufaginP28.89C26H35O6−0.265443.24225443.2428
25UnknownM29.76C17H27O2−1.013263.20032263.2084
26Cinobufagin-3-O-
glucuronide
M31.19C31H41O12−0.076605.45453605.4545
27UnknownM31.57C20H33O2−1.824305.24695305.2553
Publisher’s Note: MDPI stays neutral with regard to jurisdictional claims in published maps and institutional affiliations.

