3.1. Photoelectrochemical Performance
The UV-Vis absorption spectra also investigated the optical properties of Fe
2O
3 photoanodes. The Ce do** specifically improved the light absorption performance of the Fe
2O
3 photoanode in the region of 800 to 620 nm, as shown in
Figure S2a. The band gaps of pristine FT and Ce doped samples, 1CFT, 5CFT, and 10CFT, are calculated to be 1.530, 1.478, 1.441, and 1.453 eV, respectively, as shown in
Figure S2b. The sample of 5CFT has the smallest band gap, and the FT sample has the largest band gap. Therefore, the Ce do** vastly increases the light absorption due to the narrowed band gap of Fe
2O
3.
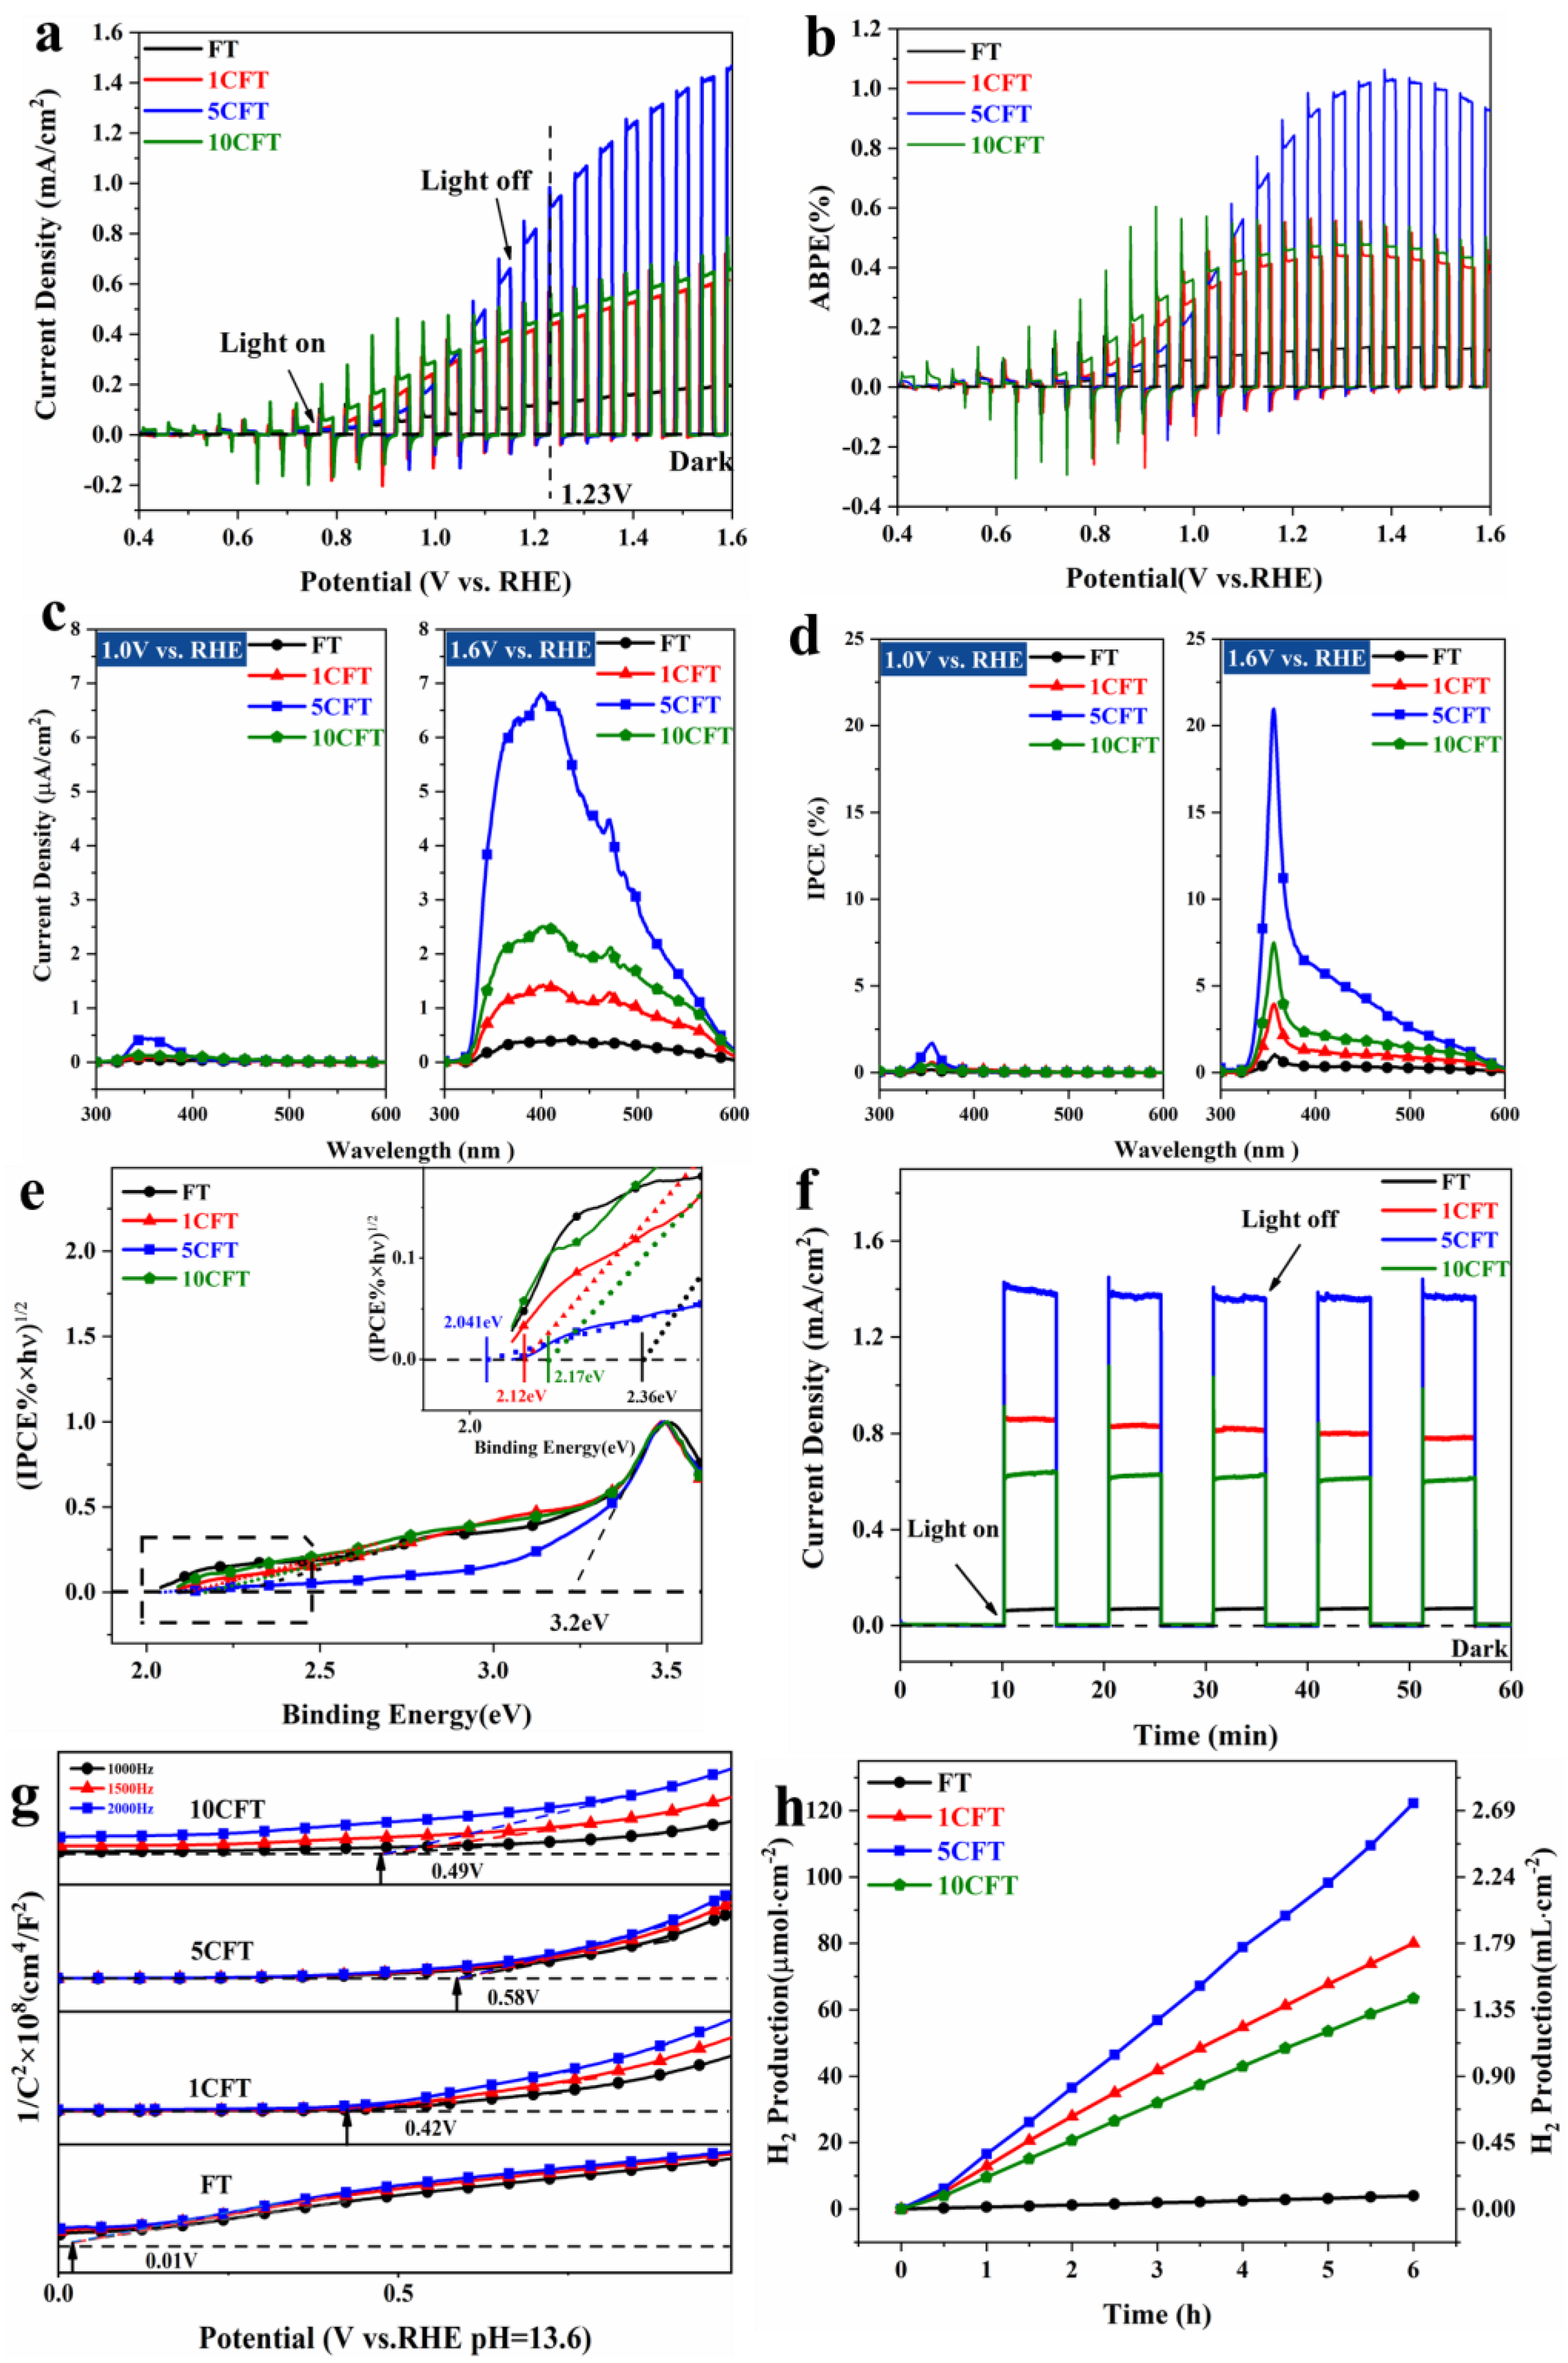
A series of photoelectric tests further evaluated the photochemical properties of the Ce-doped Fe
2O
3 nanorod arrays. Obviously, the Ce-doped Fe
2O
3 samples, which are 1CFT, 5CFT, and 10CFT, all exhibited much higher photocurrent density than pristine FT, as shown in
Figure 4a. Significantly, the photocurrent density of 5CFT (1.47 mA/cm
2) at 1.6 V vs. RHE is 7.3 times higher than that of pristine FT (0.2 mA/cm
2). The photocurrent density of 5CFT (0.95 mA/cm
2) at 1.12 V vs. RHE is 6.3 times higher than that of pristine FT (0.15 mA/cm
2). By the Ce do**, the PEC performance of Fe
2O
3 is highly improved. The 5CFT achieves the maximum ABPE of 1.02% at 1.39 V vs. RHE, which is 7.3 times as that of FT (0.14%), as shown in
Figure 4b.
The photocurrent densities of pristine Fe
2O
3 and Ce-doped Fe
2O
3 under monochromatic light with different applied bias pressures were measured. As the applied bias increases, the photocurrent densities of these samples increase, as shown in
Figure 4c,d and
Figure S3. At low bias (1V vs. RHE), the photocurrent response in visible light was faintly negligible due to the high rate of recombination of electron/hole pairs. The high applied bias helps the charge separation of Fe
2O
3, and the effect of Ce do** in Fe
2O
3 can be fully exhibited, especially under visible light. The photocurrents of the Ce-doped Fe
2O
3 nanorods are significantly larger than that of pristine Fe
2O
3 in the wide range of 300 nm–600 nm. The Ce do** increases the electrical conductivity of Fe
2O
3 and enhances the charge separation and transfer from the bulk material to the surface. These samples’ incident photon-to-current efficiency (IPCE) was obtained, as shown in
Figure 4d. The IPCE values of these samples became progressively larger as the applied voltage increased. The IPCE of 5CFT reaches a maximum value of 21% at 357 nm with bias voltage 1.6 V vs. RHE, which is 12.4 times increase to the FT sample (1.69% IPCE in the same situation).
The band gap of these samples can be evaluated by Tauc plotting [(IPCE% × hv)
1/2 versus photon energy (hv)] under electrochemical noise mode, as shown in
Figure 4e. The band gaps are 2.36 eV, 2.12 eV, 2.04 eV, and 2.17 eV of FT, 1CFT, 5CFT, and 10CFT, respectively. The substrate of TiO
2 has a band gap of 3.2 eV. Clearly, the band gap of Fe
2O
3 was narrowed by Ce do** which highly enhances the visible light absorption of Fe
2O
3. Moreover, the Ce-doped Fe
2O
3 also behaved with superior photostability, as shown in
Figure 4f.
The Electrochemical impedance spectroscopy (EIS) results are shown in
Figure S4, where the reduction in semicircular response with frequency change can be seen. The inset shows a modified Randles circuit [
41] for the EIS. The fitting parameters for each fitted component are given in
Table S3. The EIS curves of all samples show a standard semicircle, and the resistance values of the Ce-doped samples are all significantly smaller than the undoped FT, with the 5CFT sample being the smallest, demonstrating that the Ce do** enhances the electron transfer efficiency of Fe
2O
3 and reduces the resistance values of the samples. In addition, all the curves in the Nyquist plot pass through the origin of the coordinate axis, indicating that the resistance of the solution can be neglected, and the value of Rs is much smaller than Rp, as can be seen from the fitted circuit values.
The Mott–Schottky measurements were conducted to determine the flat band potentials of these samples, as shown in
Figure 4g. Using the Mott–Schottky equation, the flat band potentials can be fitted, which are 0.01 V, 0.42 V, 0.58 V, and 0.49 V vs. RHE of FT, 1CFT, 5CFT, and 10CFT, respectively. For n-type semiconductors, the flat-band potential is positive 0.1–0.3 eV compared to the conduction band potential; for p-type semiconductors, the flat-band potential is negative 0.1–0.3 eV compared to the valence band potential. The flat band potential is infinitely near the bottom of the conduction band (CB) of the semiconductor materials, which can indirectly indicate the valence band position of the material. Although a slight positive shift shifts the CB of the Ce-doped sample compared to the FT, it still crosses the reduction potential invited and retains the ability to produce hydrogen, and the Ce-doped samples have much higher carrier concentration than pristine FT, implying high charge transfer efficiency in Ce-doped Fe
2O
3, as illustrated in
Figure S5. Therefore, the Ce ions do** highly promote the photocatalytic performance of Fe
2O
3 by facilitating the charge transfer and inhibiting the recombination of electron/hole pairs.
The H
2 production performance of Fe
2O
3 samples was also explored under simulated solar light, as shown in
Figure 4h. The H
2 production of all samples increased cumulatively over time. The Ce-doped Fe
2O
3 showed significantly higher H
2 production than pristine Fe
2O
3. After 6 h of the PEC reaction under 4.4 times AM1.5G illumination, the water-splitting H
2 production of 5CFT achieved 126 μmol/cm
2, which was 32 times higher than that of FT (which was 3.96 μmol/cm
2).
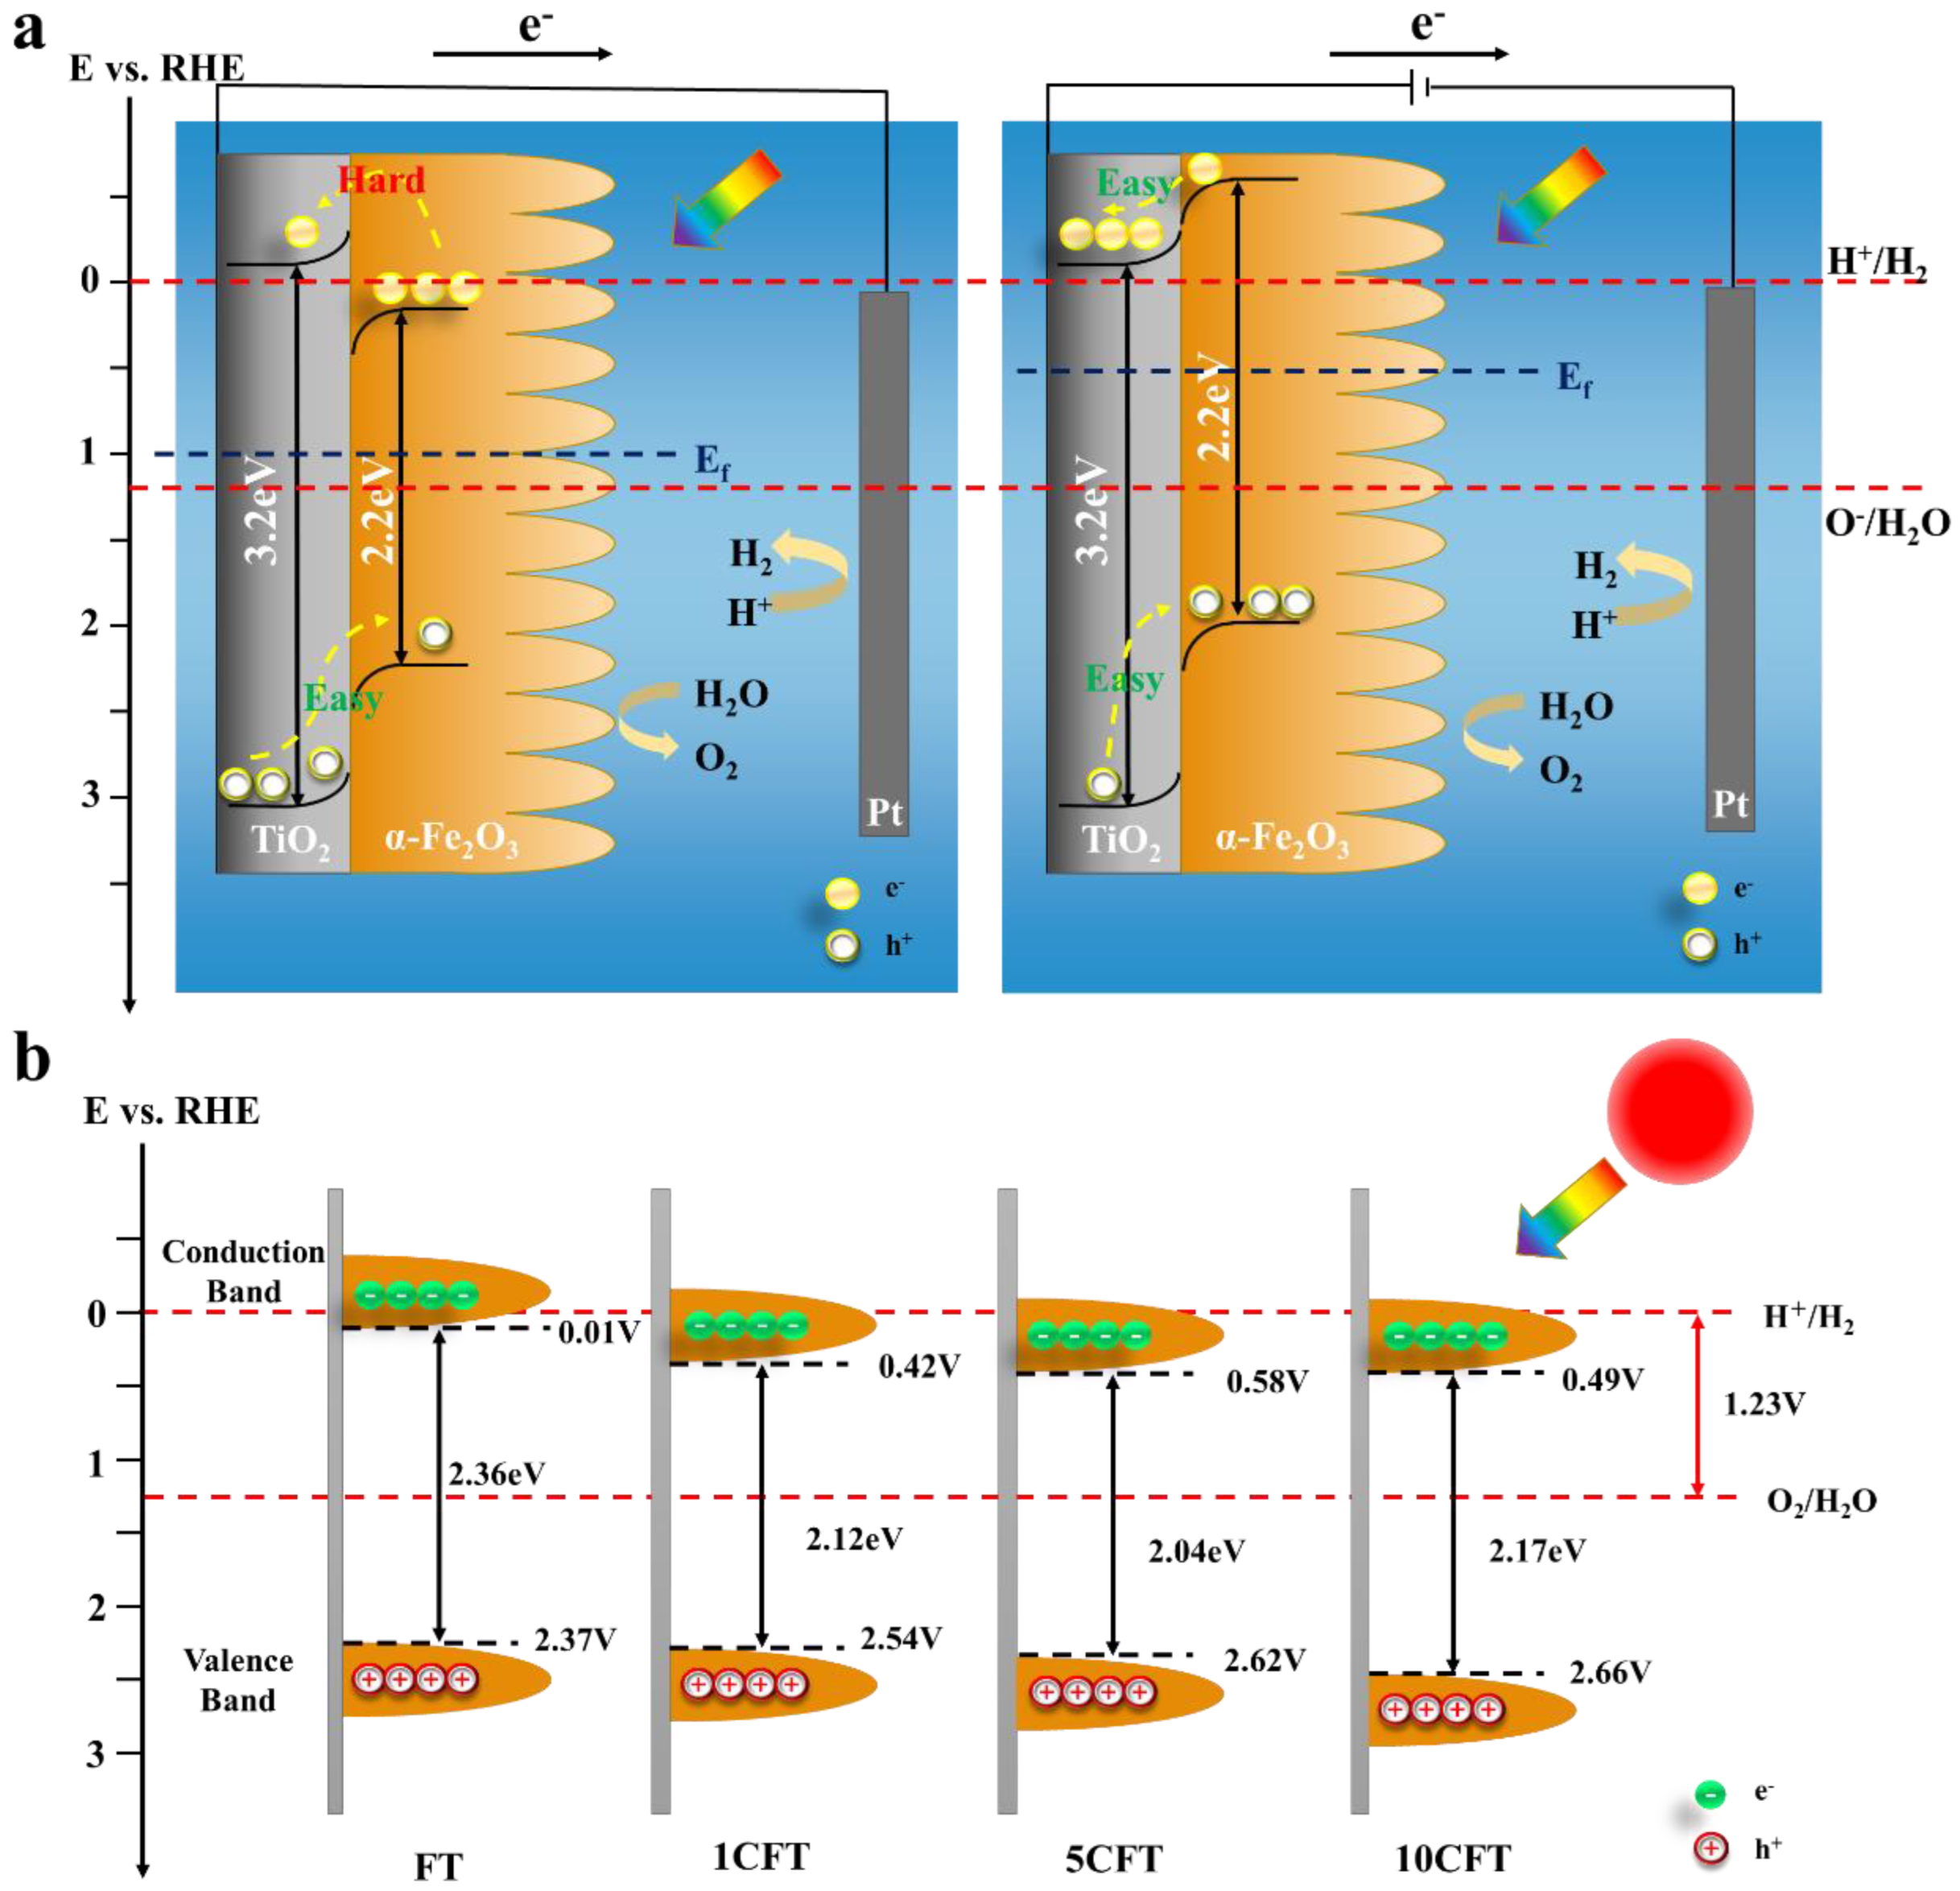
3.2. Photoelectrochemical Mechanism for Water Splitting under Solar Light
Based on the above, the PEC mechanism of H
2 production from water splitting was proposed, as shown in
Figure 5. Without the application of external bias (left part of
Figure 5a), the photogenerated electrons generated by the Fe
2O
3 require considerable energy to cross the potential barrier and transfer to the electrode surface. Under the applied bias, see the right part of
Figure 5a, the Fermi energy level of the Fe
2O
3 becomes smaller, and a new Fermi energy level is formed with the TiO
2. The conduction and valence band edges are elevated. Thus, the conduction band position of the Fe
2O
3 is rendered more negatively. The charge transfer of photogenerated electrons from Fe
2O
3 to TiO
2 can be facilitated. Therefore, the electron and hole complexation rates are significantly reduced with the help of applied bias, and the photocatalytic performance of Fe
2O
3 samples was dramatically improved, as shown in
Figure 5a. The band structures of pristine Fe
2O
3 and Ce-doped Fe
2O
3 nanorod arrays are illustrated in
Figure 5b. A smaller band gap reduces the energy barrier that must be crossed to generate photogenerated carriers, resulting in more photogenerated carriers entering the outer circuit to participate in the redox reaction, thus enhancing the photoelectrochemical performance of the sample.


 and
and 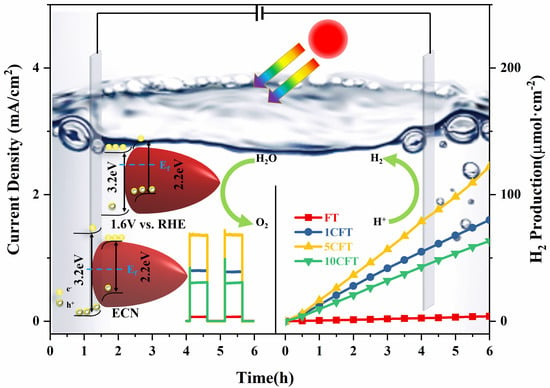


