1. Introduction
A massive increase in population, day-to-day technological improvements and their related projects, in this era have prompted exponential needs in our energy supply [
1,
2,
3]. In addition, multiple circumstances: increased greenhouse gas emission, energy production costs, trade policies and shortage of conventional fuels (coal, oil and natural gas) have moved the researchers to look for novel energy devices [
1,
2]. The intense advantages of fuel cells are diverse: reduced detrimental effect on the atmosphere, few moving components, zero noise, and simple operational mechanisms, make them the most favorable in a wide pool of energy conversion and storage devices (batteries, capacitors and supercapacitors) to achieve the above mentioned goals [
1,
2,
3]. Among different types, direct-liquid alcohol fuel cells (LAFCs) operating on methanol, ethanol and propanol, are favored due to their flexibility in the usage of liquid fuel (rather than hydrogen which experiences difficulties in transportation and storage), ambient temperature operation, high energy density of methanol and increased usage in portable electronic systems [
3,
4,
5].
In spite of LAFC’s advantages, its commercialization is greatly hindered by excess fuel crossover (or permeability) issues degrading power performance at both short and long time-scale operations [
5,
6]. Fuel crossover is the permeation of methanol from anode to cathode of the fuel cell through the membrane, propelled by the combined effect of diffusion and electro-osmotic drag coefficient [
6,
7,
8]. This permeated fuel at the cathode in the presence of catalyst leads to mixed-potential and short-circuit overall, degrading its efficiency and durability [
6,
7]. Therefore, reducing the methanol crossover with an aim to improve the power performance is the motive of this study.
To reduce the impact of this crossover issue so as to improve the power performance of the fuel cell, a barrier layer is applied between the anode electrode and membrane region in their membrane electrode assembly (MEA) [
8,
9]. Previously materials like: mordenite, polybenzimidazole, clay, zeolite, chitosan biopolymer, palladium, platinum nanowire, polyaniline, sulphonated polystyrene employed by spin-coating, sputtering and electrochemical deposition methods were reported so far [
10,
11,
12]. All of them lowered fuel permeability values and resulted in higher power output than the standard ones [
9,
10]. However, the proton conductivity route was also affected in these works, so a balance between fuel crossover and conductivity were made to achieve power performance improvement [
10,
11]. Therefore, there is a still need for membranes with high selectivity (ratio of proton conductivity to fuel crossover ratio) to maximize performance improvements.
From a materials perspective, graphene, the first in the 2D materials family gets enhanced importance due to its exceptional physio-chemical properties: high thermal conductivity (5000 W·m
−1·K
−1), mechanical stability (Young’s modulus of 1 TPa), electron mobility (250,000 cm
2·V
−1·s
−1), surface area (2630 m
2·g
−1) and optical transparency (97.7%) [
13,
14]. Especially its carbon–carbon bond length of 0.142 nm—rendering ability to block all atoms of size greater than helium is of significant interest for use as methanol barrier layer in fuel cells [
15,
16]. This was experimentally shown by Nair et al. [
17] and Su et al. [
18] where graphene membrane (graphene oxide and reduced graphene oxide prepared by Hummer’s method followed by chemical reduction) has impeded: propanol, decane, hexane ethanol, acetone, formic acid and gases: argon, hydrogen and nitrogen.
Furthermore, Hu et al. [
19] have shown that single-layer graphene membranes (prepared by mechanical exfoliation) are prone to hydrogen ionic (protons) transport. These features of resisting liquid permeation, at the same time allowing ionic transport, show tremendous potential for use in liquid alcohol operated fuel cell membrane area [
6,
7,
8].
This concept was utilized in an actual fuel cell system by Holmes et al. [
20] and Yan et al. [
21] as a barricade layer, respectively. Holmes et al. [
20] used chemical vapor deposited (CVD) graphene transferred onto fuel cell anode and obtained 45% improvement in performance in active methanol fuel cell conditions. They reported different samples with various improvements, due to the difference in coverage of graphene over the electrode, caused during the transfer process. Meanwhile, Yan et al. [
21] obtained 120% performance improvement at high concentration methanol passive fuel cell systems. However, these works reported a major drawback of surface coverage of graphene over the electrode, which is caused due to practical difficulties in graphene transfer from CVD furnace to the electrode and preparation methodology.
Xu et al. [
22] used graphene-Nafion dispersion on the anode side and obtained 82% improvement at 8 M methanol and oxygen (60 °C cell temperature) conditions, where the graphene used were purchased from XFNANO Inc.
Considering the drawbacks of all the previous reports and in an effort to widen the horizons of this research, in this work we have used graphene from liquid phase exfoliation–bath sonication of graphite and utilized them as a barrier layer—(above the anode catalyst layer) showing an effective membrane with high selectivity (proton conductivity to fuel crossover ratio) for performance improvements in various LFACs—methanol, ethanol and propanol, respectively.
Liquid phase exfoliation involves dispersion of the precursor in a solvent (
N-methyl pyrrolidone (NMP), acetone, dimethyl sulphoxide (DMSO), 1,2-dichloro benzene (DCB), acetophenone, water, benzonitrile, 1,4-dioxane) and subjecting to exfoliation by bath sonication [
23,
24]. This method offers lesser complexity, when compared to CVD (requirement of high temperature/high pressure furnace operation), electrochemical exfoliation and mechanical exfoliation (low percentage yield of few layers of graphene and heavy manual work) [
23,
24,
25,
26].
From the scalability point of view, 2D materials dispersed in solvents in high volumes, can be transported and utilized without losing its properties for prolonged timelines [
23,
24]. In addition, it is known that no gaseous side products during liquid exfoliation process are released, unlike chemical reduction, where oxides of nitrogen and sulphur are released at chemical exfoliation of 3D graphite to form graphite oxide and further reduction steps [
25,
26].
Furthermore, the graphene is deposited onto an anode fuel cell electrode (above the catalyst layer), using spray deposition, which is considered easier compared to the transfer process from furnace to electrode where CVD is used and the mechanical exfoliation method was used [
27,
28,
29,
30]. Taking into account various viewpoints—scalability, preparation simplicity and environmental friendliness of liquid exfoliation and further application by simple spray coating, this offers multiple advantages and is henceforth utilized in this work.
These 2D materials from liquid phase exfoliation methodology were reported to have been utilized in several opto-electronic applications (solar cells and thin film transistors), nano-sensors and nano-composites [
23,
24]. To the best of our knowledge, none have been used as a barrier layer in the MEA of fuel cells and is reported in this work. Among different solvent mediums for exfoliation, acetone is selected, due to its low boiling point and ease during fuel cell spray coating process features [
28,
29].
In the fuel cell membrane region, it is known that methanol permeability (MP) and proton conductivity are inter-related [
6,
7,
8]. To evaluate this comprehensively, different weight (wt.%) percentages of graphene are employed above the anode catalyst layer as a barrier layer, due to its proximity to the membrane (in relation to weight of the base Nafion membrane). Coating onto the electrode is preferred, since approaches found in the literature: mounting barrier layer material directly onto membrane reported more complications: membrane swelling and membrane electrode assembly (MEA) damage [
20,
21,
22].
The results are evaluated by materials characterization (atomic force microscopy (AFM), scanning electron microscopy (SEM), energy dispersive spectroscopy (EDS) with elemental map** and Raman spectroscopy), electrode/membrane characterization—fuel permeability (MP—methanol permeability in case of methanol fuel usage) (electrochemical and gravimetric modes), water uptake, ion-exchange capacity, proton conductivity, fuel oxidation propensity (FOP)—oxidation current and peak oxidation potential, electrode reaction resistance (ERR), wettability and fuel cell polarization curves (open circuit voltage and peak power density values) at different fuel concentrations and temperatures.
Overall, this work of utilizing a liquid phase exfoliation approach of graphene synthesis, usage as a barrier layer on the anode side of MEA using simple spray deposition and with significant power performance increments obtained, will lead to advantages in multiple fronts: improving the commercial standpoint of LAFCs (efficiency and durability improvements as reported), influx of various liquid exfoliated 2D materials as high selective membranes into the fuel cell field and their further mechanism exploration studies.
2. Results and Discussion
2.1. Nano-Graphene Flake Characterization
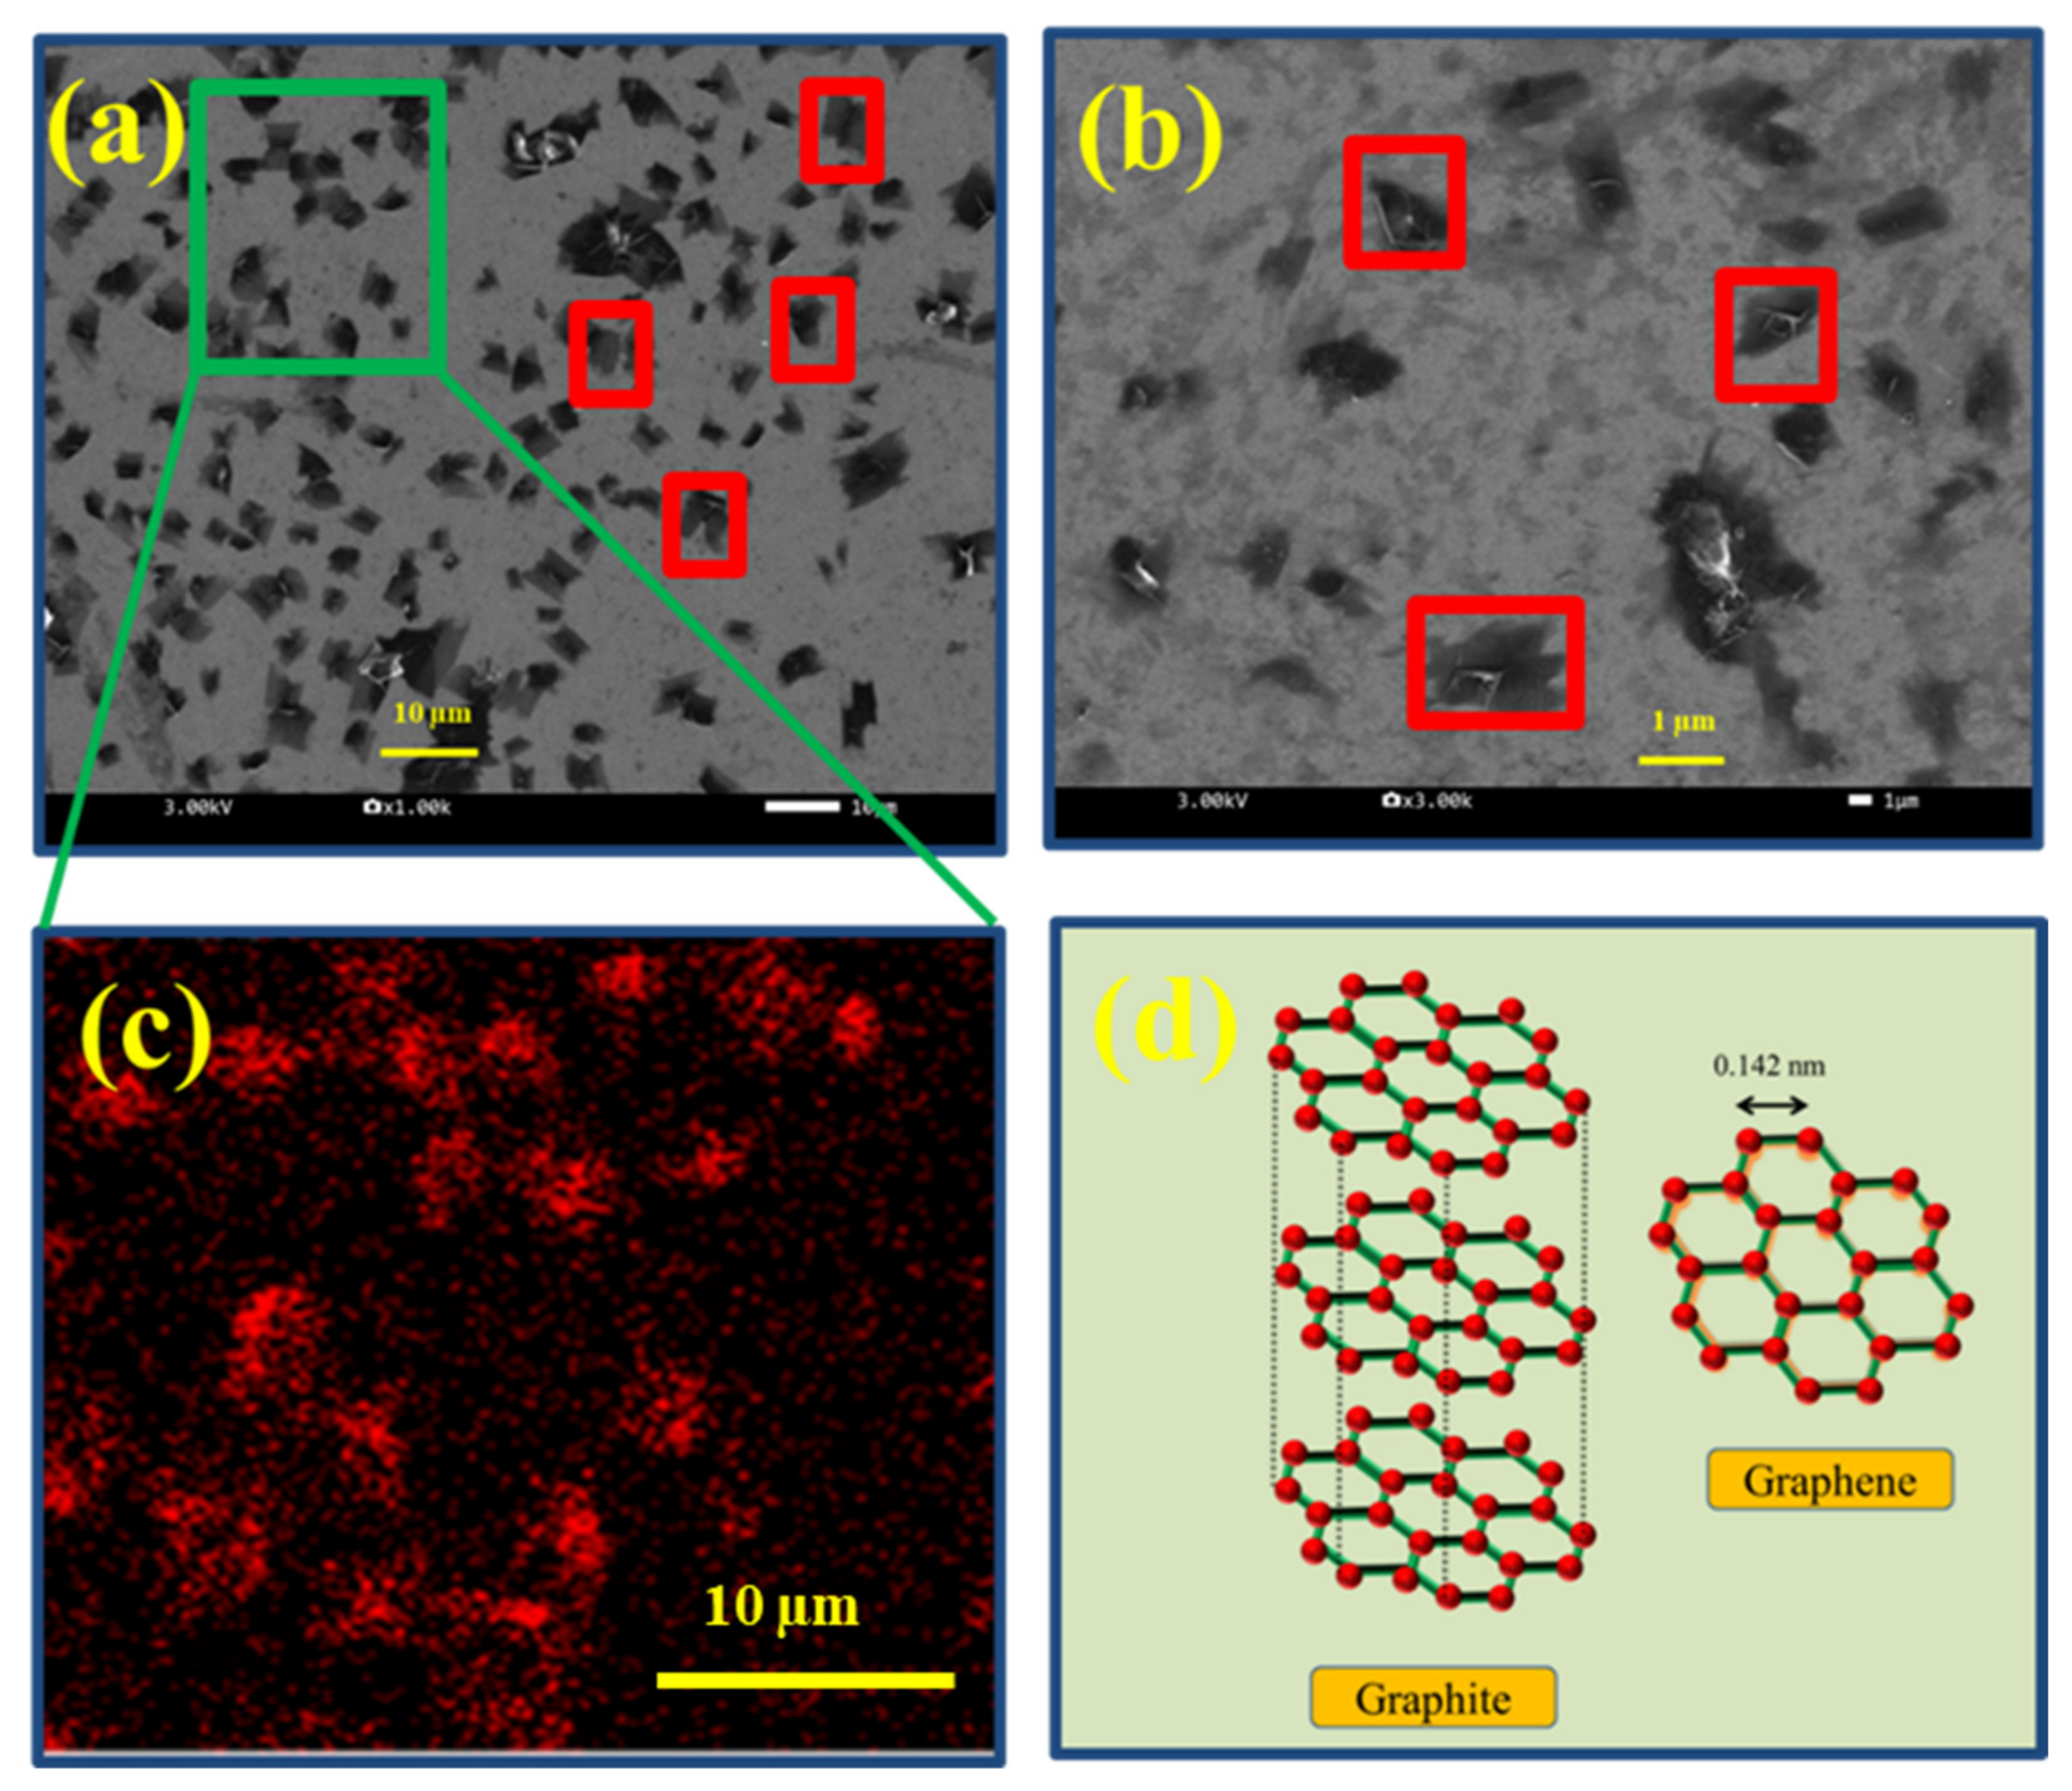
Figure 1a (10 µm magnification scale) and
Figure 1b (1 µm magnification scale) shows the uniformly sized graphene flakes with lateral size: ~2–4 µm (few particles marked in red boxes), confirming the effectivity of the liquid exfoliation and centrifuge steps, as described in the experimental section. Furthermore, the electron dispersive spectroscopy (EDS)—map** at
Figure 1c, (indicative of green region in
Figure 1a), further confirms the presence of carbon. Elemental analysis at different spots of this sample showed that the prepared graphene exhibited carbon to oxygen (C/O) ratio of 4.5 as given in
Table S1 (
Supplementary Materials), compared to a C/O ratio of 19.8 for graphite, which are in agreement with literature values [
13,
14,
15].
The above results confirm the exfoliation of multiple carbon layers (40 µm thick) containing graphite onto a few layers of graphene with ~2–4 µm size, as illustrated schematically in the
Figure 1d. The oxygen presence comes from the acetone ((CH
3)
2CO) medium exfoliation, as analyzed thoroughly by previous studies [
14,
15]. These oxygen groups are essential in obtaining spraying favorable dispersions, where they miscible with polar solvents [
15,
16]. Further importance of this C/O ratio (after spraying dispersions onto anode fuel cell electrode), altering hydrophilic/hydrophobic nature of electrodes and their role in affecting fuel cell performance are discussed in detail in the coming sections.
Figure S1 (
Supplementary Materials) shows the Raman patterns of graphite and graphene on silicon wafer. It can be inferred that increased intensity of D-band (or disorder band) for graphene at 1300 cm
−1, compared to graphite, indicates evaluation of defects and disorders in a sample arising from the exfoliation process [
31,
32]. The characteristic peak disappearance of the 2D-band (at 2700 cm
−1) confirms that the material is of few layers [
31]. These observations from D-band, G-band and 2D-band confirm the reduction in 325 mesh flake thick graphite (before exfoliation) to a few layers of graphene after the process, as previously illustrated in
Figure 1d.
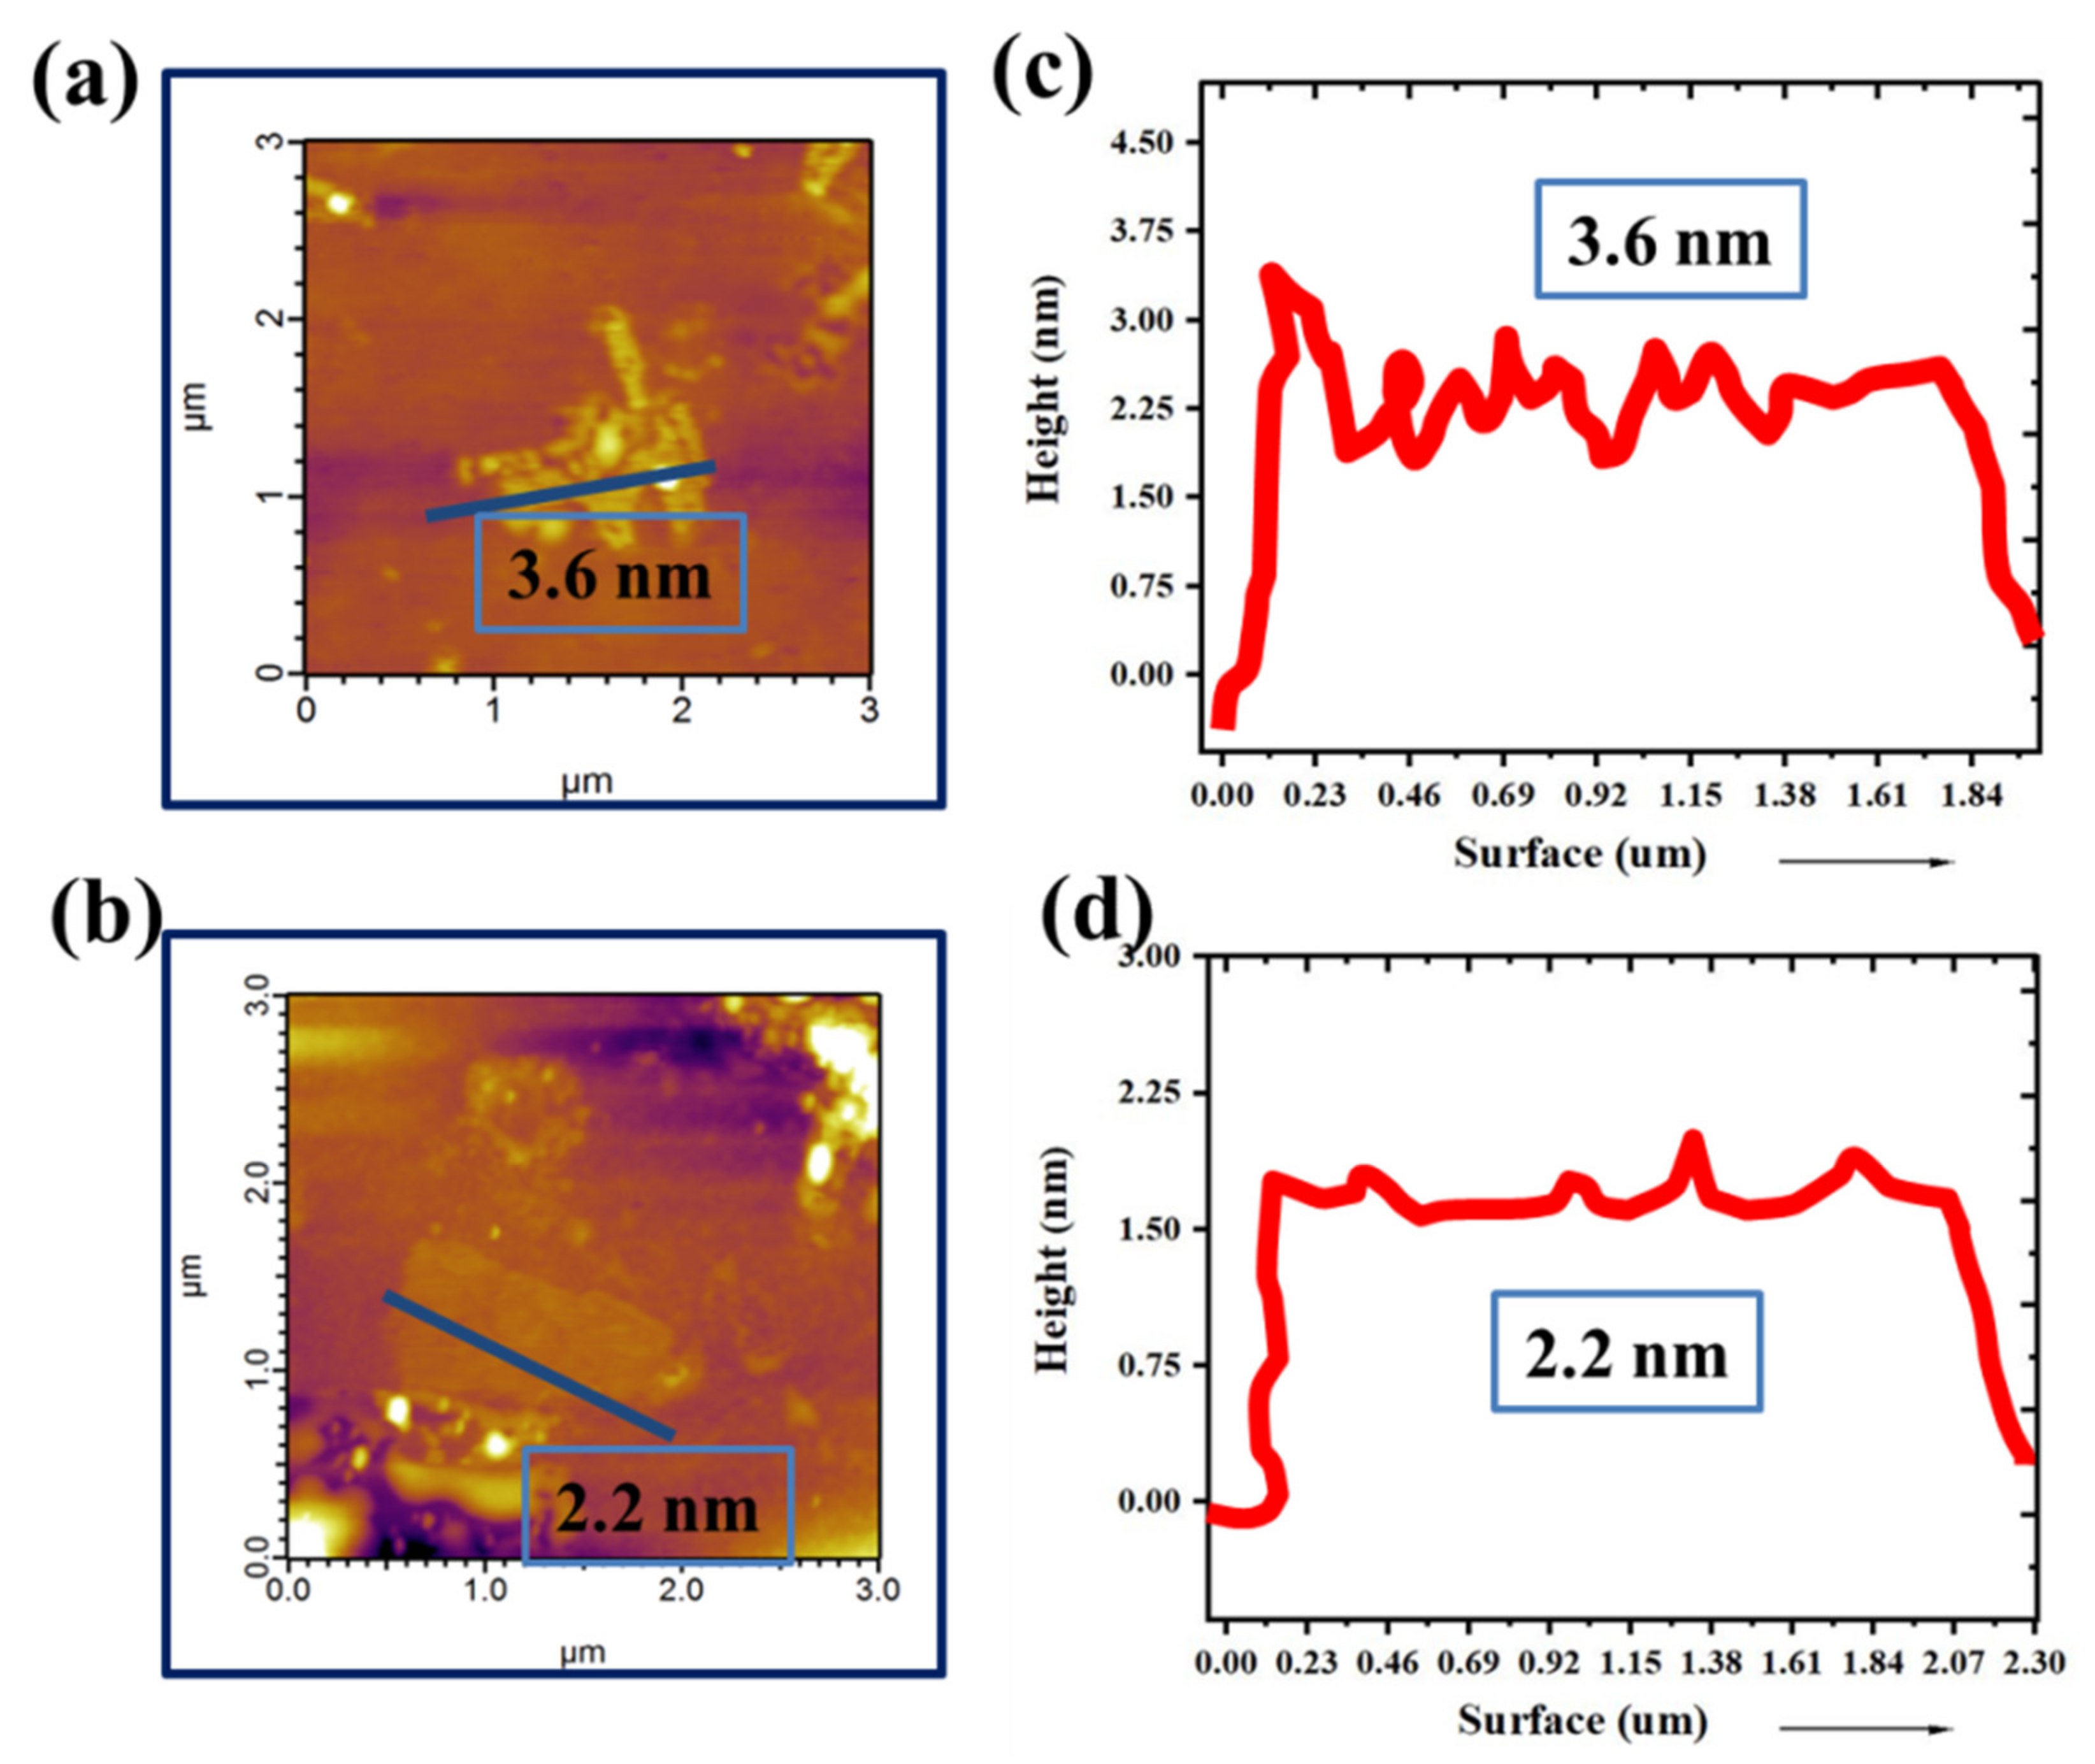
More precise information obtained from atomic force microscopy (AFM) and their corresponding surface profiles (marked in grey line) taken for different samples, shows that flake thickness is of 2–5 nm (
Figure 2a–d) [
33,
34,
35]. These characterizations agree well with the results in the followed graphene preparation procedure (Coleman et al. [
36]).
2.2. Different Graphene wt.% Barrier Layer Characteristics—Electrode and Membrane Characterization Results
To precisely estimate the effect of graphene, this spray was deposited at: 2.5 wt.%, 5 wt.%, 7.5 wt.%, 10 wt.%, 20 wt.% and 25 wt.% values (0 wt.% graphene is noted as standard) on the anode electrode (as barrier above the catalyst layer as mentioned in the materials and methods section) and evaluated.
Figure 3 and
Figure 4 show the scanning electron microscope (SEM) images depicting changes in electrode structure as a result of adding a graphene layer. The uniform distribution of tiny graphene flakes over the catalyst layer of the fuel cell electrode is evident in the top-view SEM images in
Figure 3a–f, confirming the reliability of spray coating.
It can be seen that the average crack separation length changed for the 5 wt.% graphene electrode (
Figure 3c), compared to standard electrode, which is around 200 µm (as indicated in
Figure 3a). On further increasing the graphene wt.%, the crack size enlarged (around 500 µm for 7.5 wt.% graphene layer as in
Figure 3d), then nearly disappeared (for 10 wt.% graphene layer as in
Figure 3e) and show agglomerated surface (for 12 wt.% graphene layer as in
Figure 3f).
Changes in crack separation length are crucial, as previous studies by Hiramitsu et al. [
37], Mohseninia et al. [
38] and Li et al. [
39] have attained improvements in hydrogen/methanol fuel cell performance by altering the microstructure of the electrode as a result of observing electrode crack size/porosity changes affecting water transport characteristics.
Since water transport changes also affect the methanol, which has direct influence on power performance [
4,
5,
6], it can be inferred that changes in power performance are expected, (in addition to increased water uptake and ion-exchange capacity values) which are discussed in detail in the coming sections.
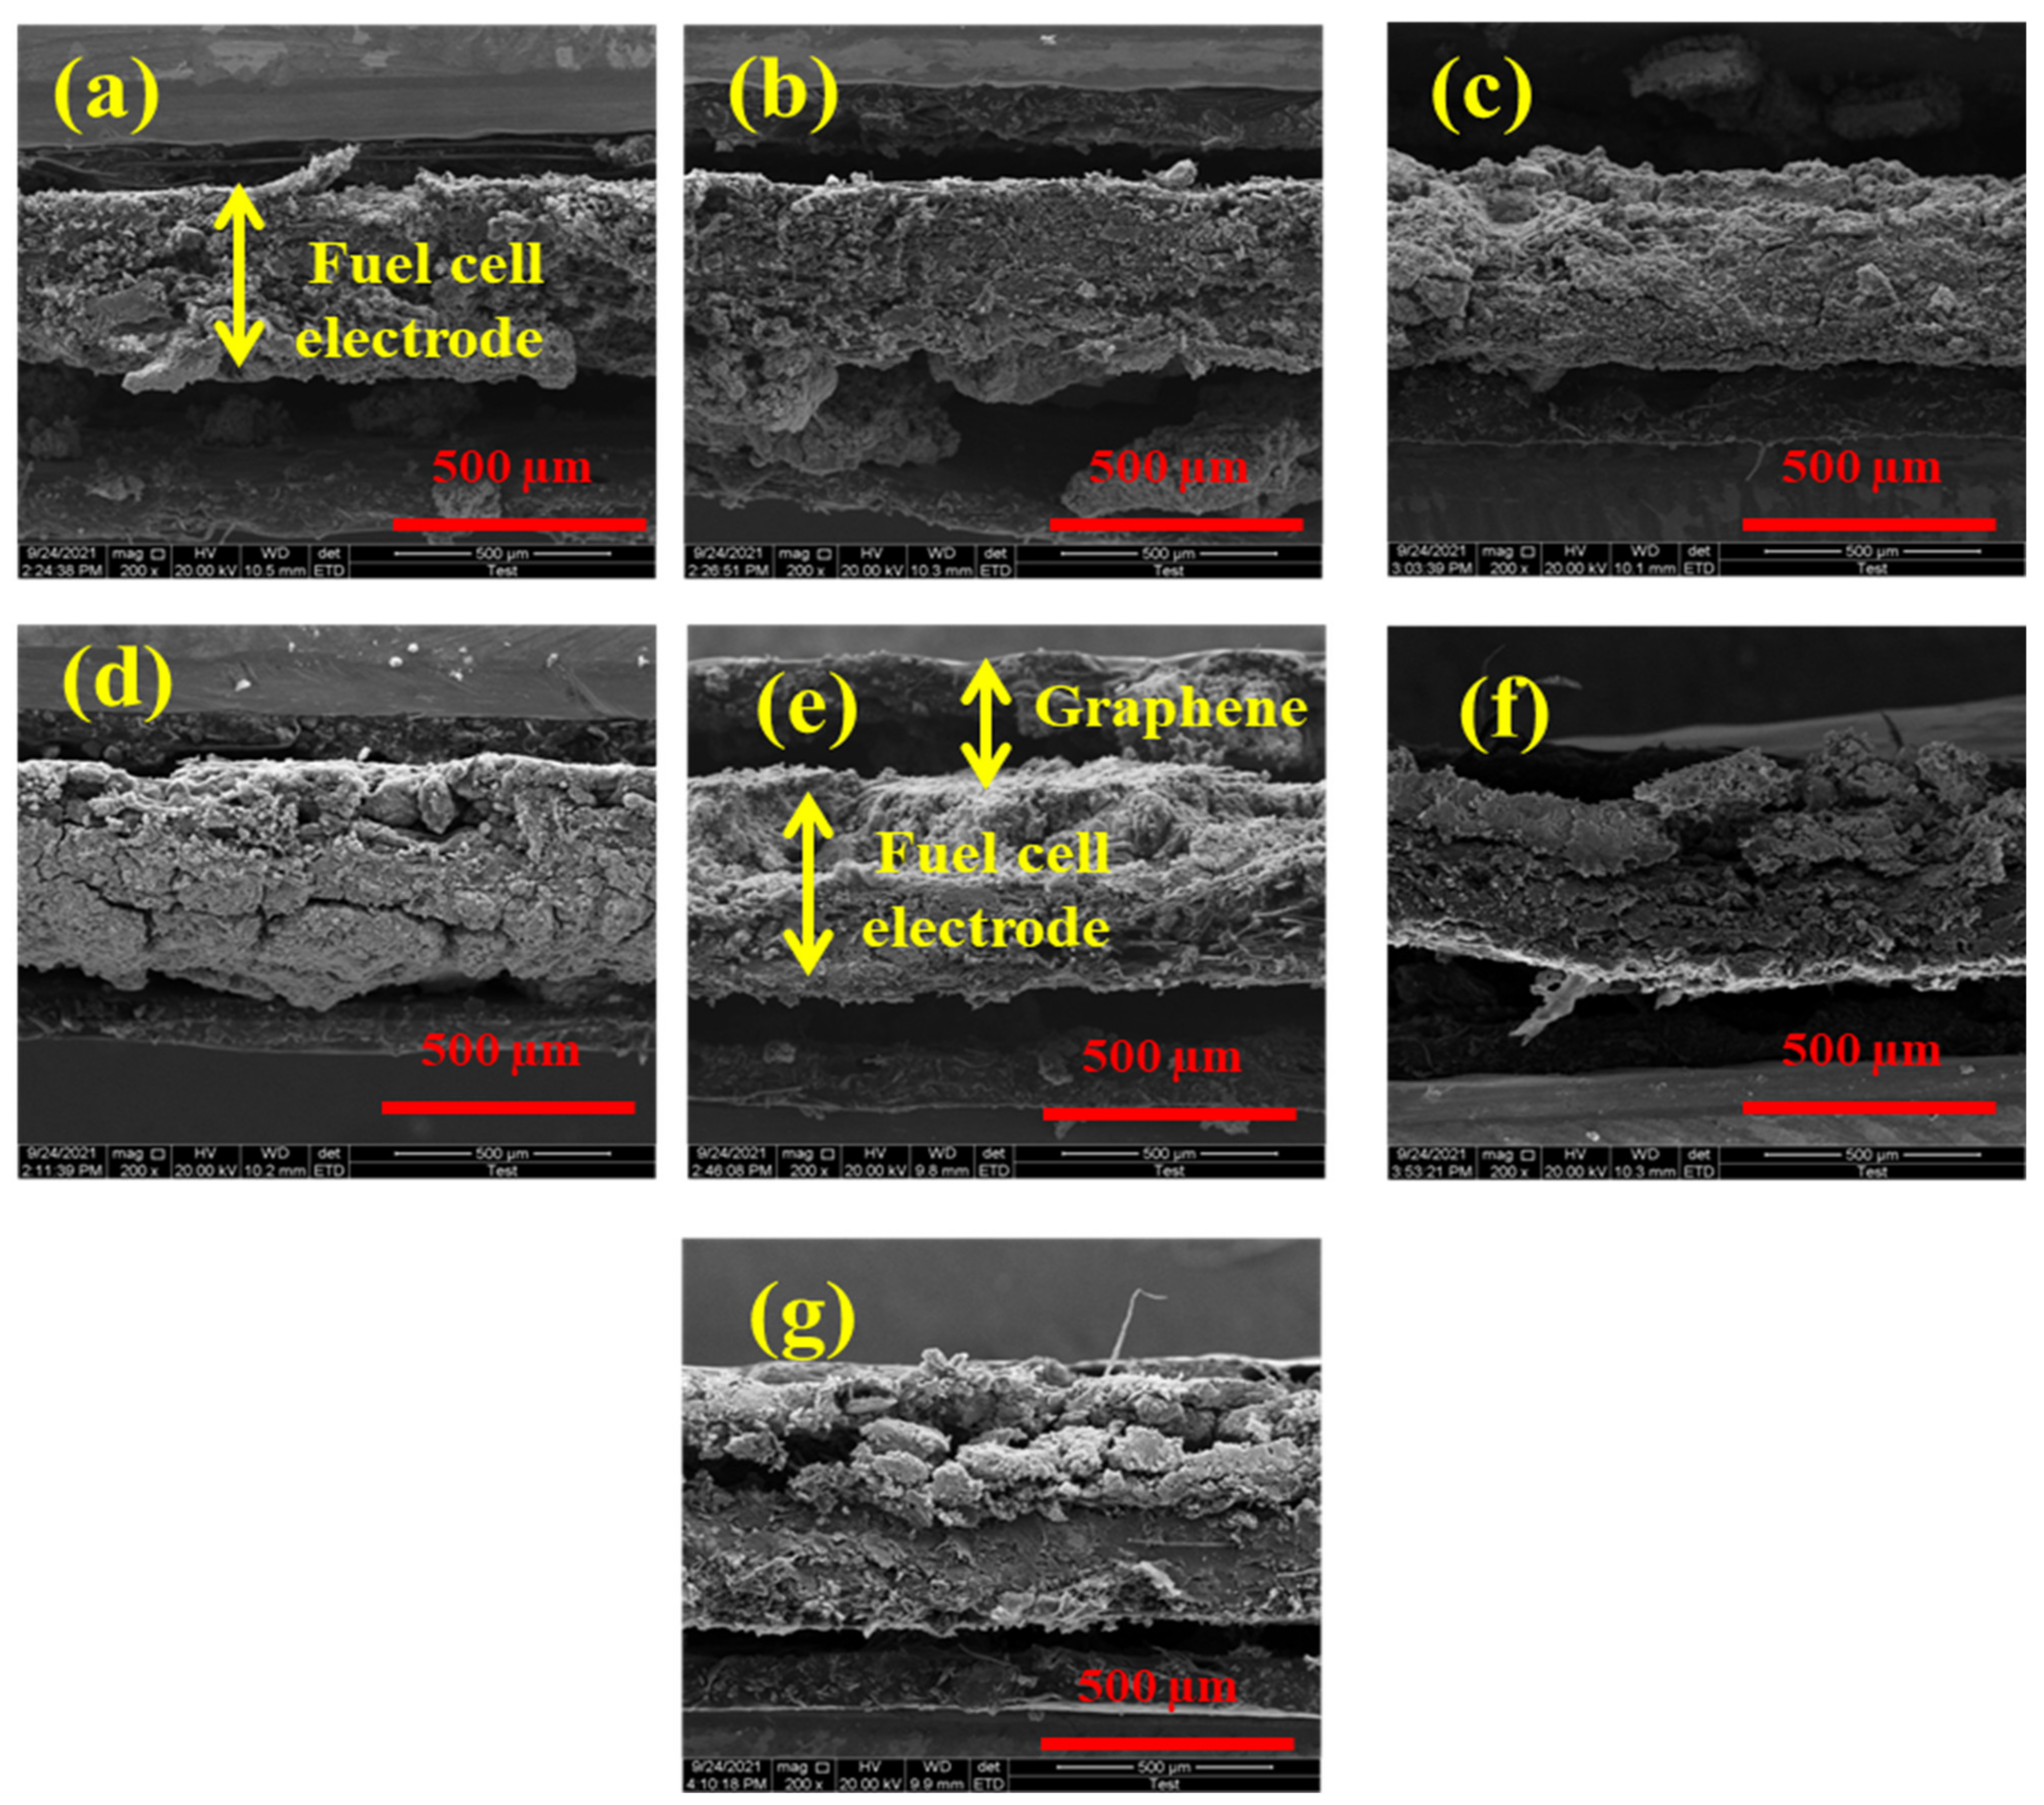
Figure 4 shows that the addition of graphene increased the thickness of the electrode (cross-sectional view) in proportion to the weight percentage of addition. From
Figure 4a–c, graphene layer is not clearly visible due to minor increase in thickness, due to low percentage addition of graphene, whereas from
Figure 4d–g, this becomes more clear than previous as indicated in
Figure 4e.
Electrode porosity (Complete, hydrophobic—estimation of water repelling pores and hydrophilic—estimation of water affinity pores) by weight loss method offers enhanced simplicity compared to gas-liquid porosimetry methods, and pertains to methanol/water transport in their structure [
38,
39]. Similarly, contact angle measurements gives approximation of wettability of electrode characteristics towards water and plays a major role in relating cell performance and water transport through its pores [
37,
39].
Hence, electrode porosity and contact angle values of different electrodes are determined as explained in the experimental procedure and given in
Table 1.
The hydrophobic porosity of electrodes increased with the graphene content, (60% to 73%), higher than that of standard electrode (60%). This is due to high carbon to oxygen (C/O) of 4.5 of the prepared graphene from electron dispersive spectroscopy (EDS) results, compared to platinum (and Nafion ionomer)-containing standard, which are well known for their water-affinity nature. The similar trend is observed in the contact angle measurements due to the above reasons. Studies by Bera et al. [
40] and others have reported contact angle values of 180° for water on single-layer graphene surfaces. This high value is not observed in this case because of low percentage additions of graphene, with the maximum being 25 wt.% graphene showing 163° contact angle. Furthermore, the increase is gradual, in accordance with the increase of graphene content.
These changes in hydrophobicity and contact angle values of the electrodes, along with the crack separation (as observed earlier) are expected to play a role in the water/methanol repelling characteristics of the electrode (as previous studied well in literature) and it will be interesting to observe the power performance.
Water uptake (WU) and ion-exchange capacities characteristics of a MEA gives an understanding of proton conductivity since protons undergoes Grotthus mechanism movement through functional groups of the membranes [
5,
6,
7]. Hence, these tests are carried out as explained in the experimental procedure and percentage difference (in relation to the standard MEA tabulated in
Table S2, Supplementary Materials).
From
Table S2, it can be seen that WU decreased with increasing graphene wt.% content. This is in accordance with hydrophobic porosity and contact angle measurements, which implies that graphene with high C/O ratios repelled water. Whereas, ion-exchange capacity values increased with graphene wt.% content, indicating that ascending oxygen functional groups with the graphene wt.% increase has led to this value.
Membrane characterizations results (methanol permeability (MP), electrochemical mode) and proton conductivity were carried out, as explained in the experimental section and tabulated in
Table 2. Since better fuel cell power was observed for 1 M methanol and 60 °C cell temperature conditions, characterizations are carried out at these conditions. Furthermore, membrane selectivity factor has direct relation to the fuel cell performance; this is calculated and given in
Table 2 as well.
It can be seen that MP, electrochemical mode values decrease with the increase in graphene weight percentage, showing that this graphene acted as a barrier layer, preventing fuel permeability thereby preventing undesirable fuel oxidation on the cathode. Meanwhile the proton conductivity has shown a declining trend, indicating that this layer though reduced MP has caused hindrance to proton conductivity. Hence, it can be inferred that the water-repelling nature of the graphene (as confirmed previously from hydrophobic porosity, water uptake and contact angle measurements) has resulted in reduced methanol permeation.
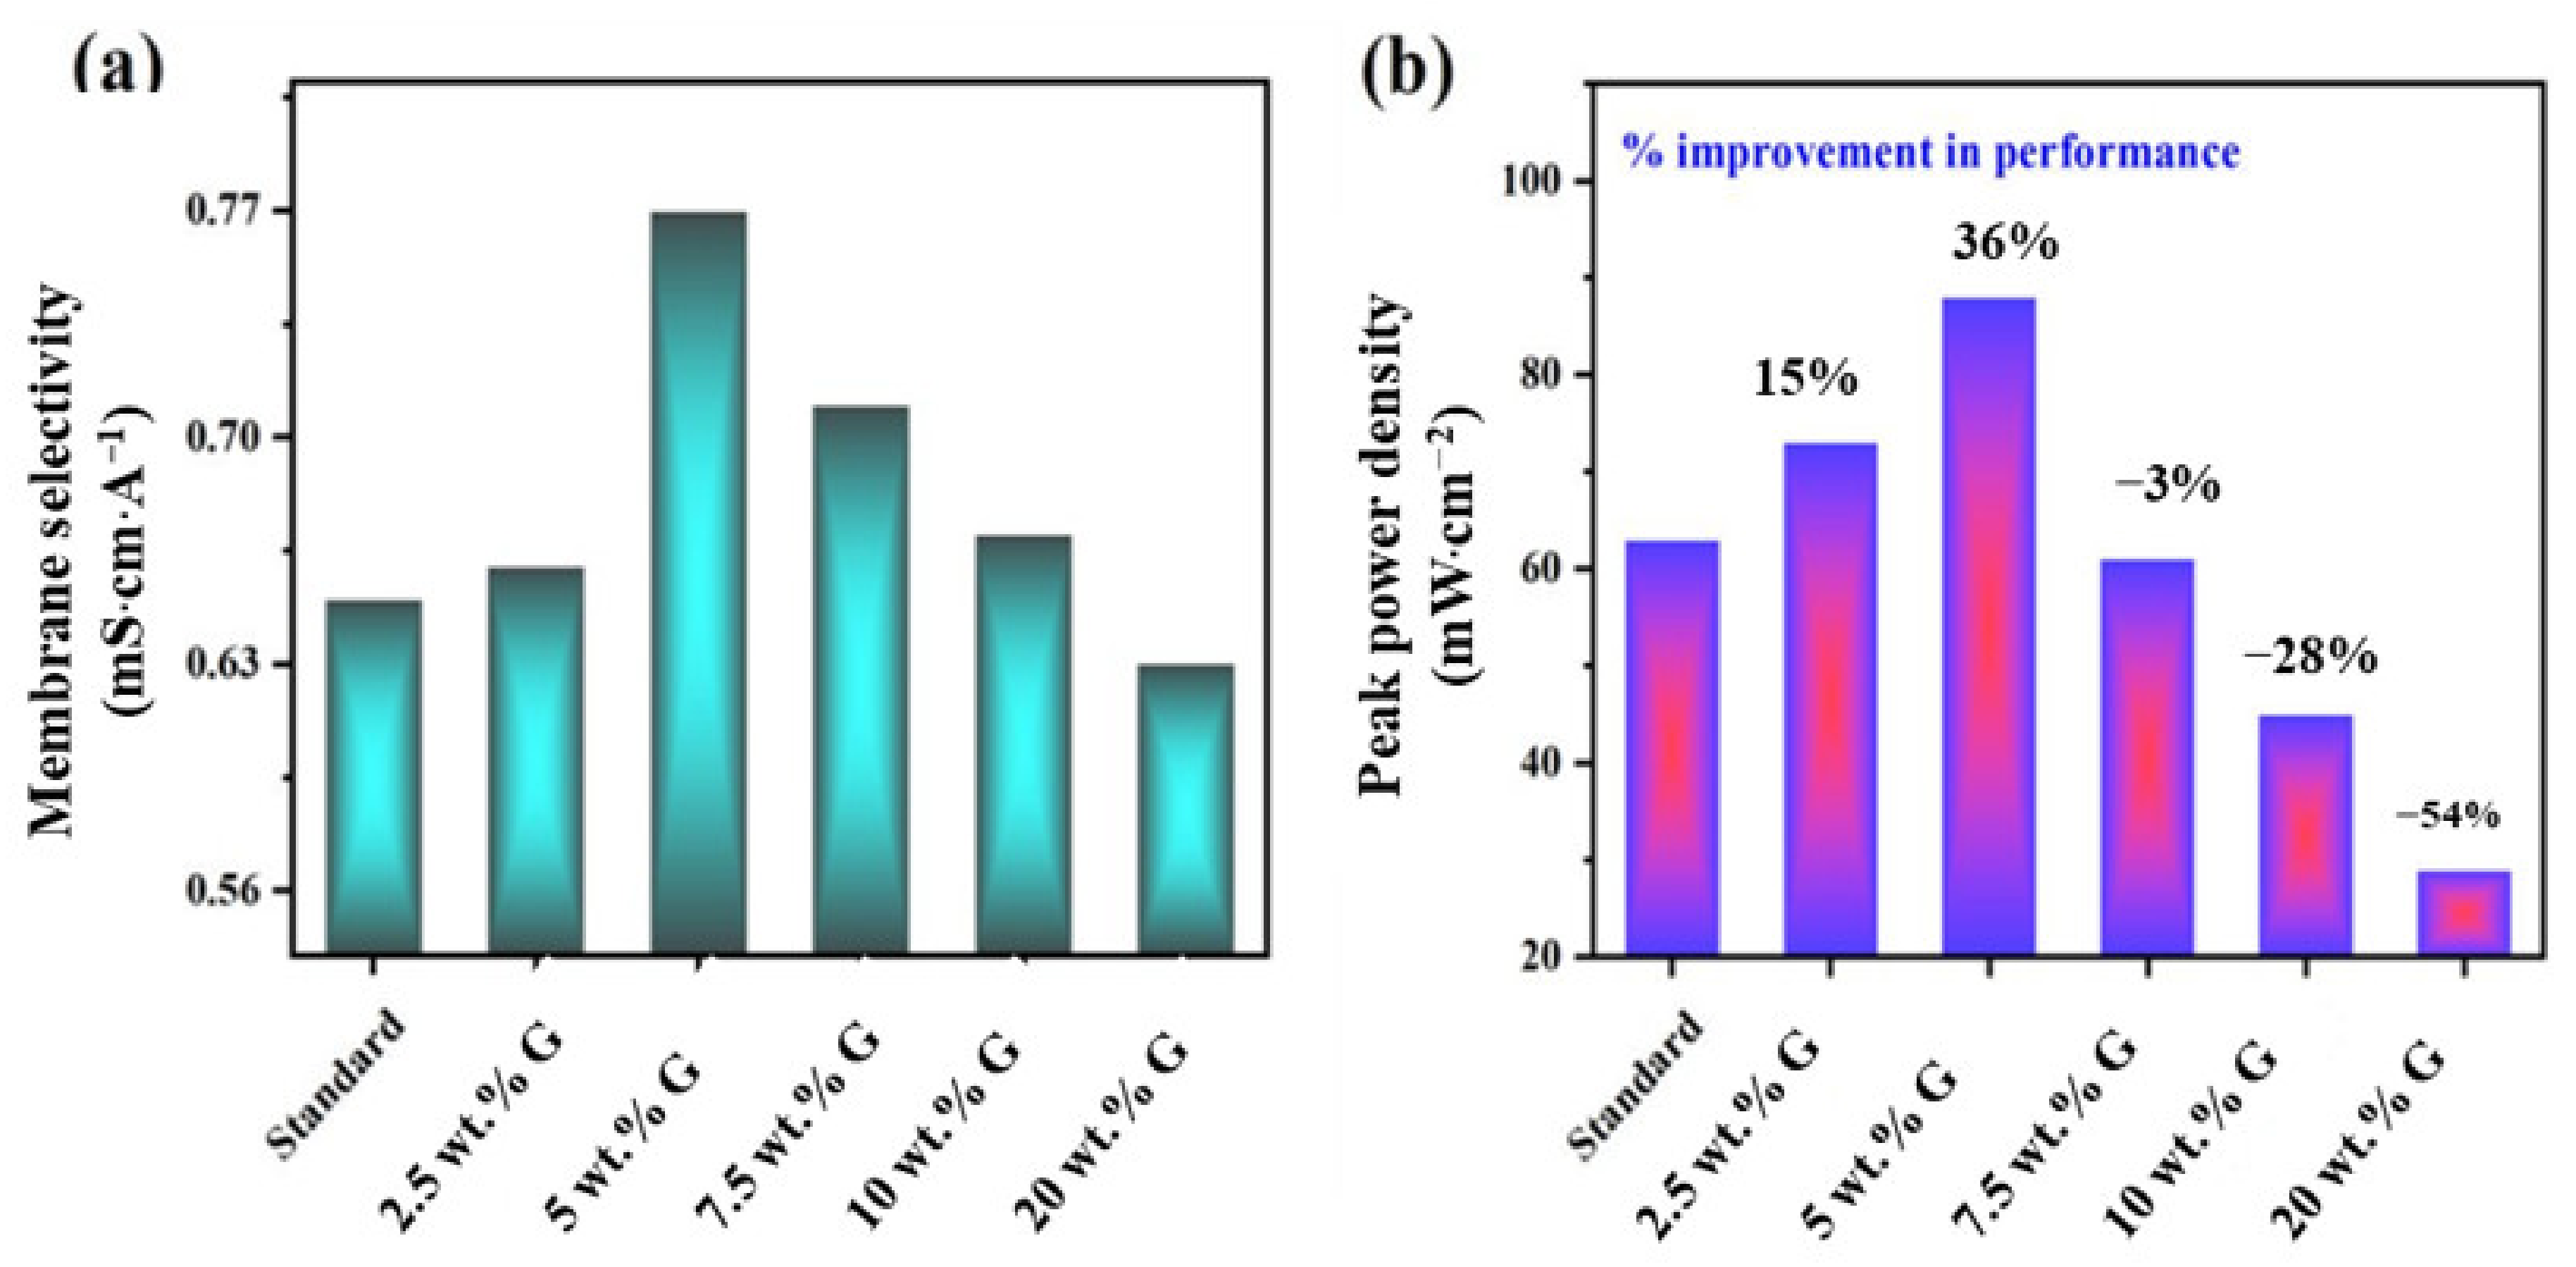
Calculating membrane selectivity for all samples, the 5 wt.% graphene exhibited a high value of 0.77 mS·cm·mA−1, indicating this layer prevented fuel permeation at the same time minimally affecting proton transfer route.
2.3. Different Graphene wt.% Barrier Layer Characteristics—Fuel Cell Results
To test their effect in fuel cells, standard and graphene-containing membrane electrode assemblies (MEAs) are compared at 60 °C cell temperature, 1 M methanol (10 mL·min−1) and oxygen (250 mL·min−1) operating parameters, as best standard power performance is obtained in these conditions.
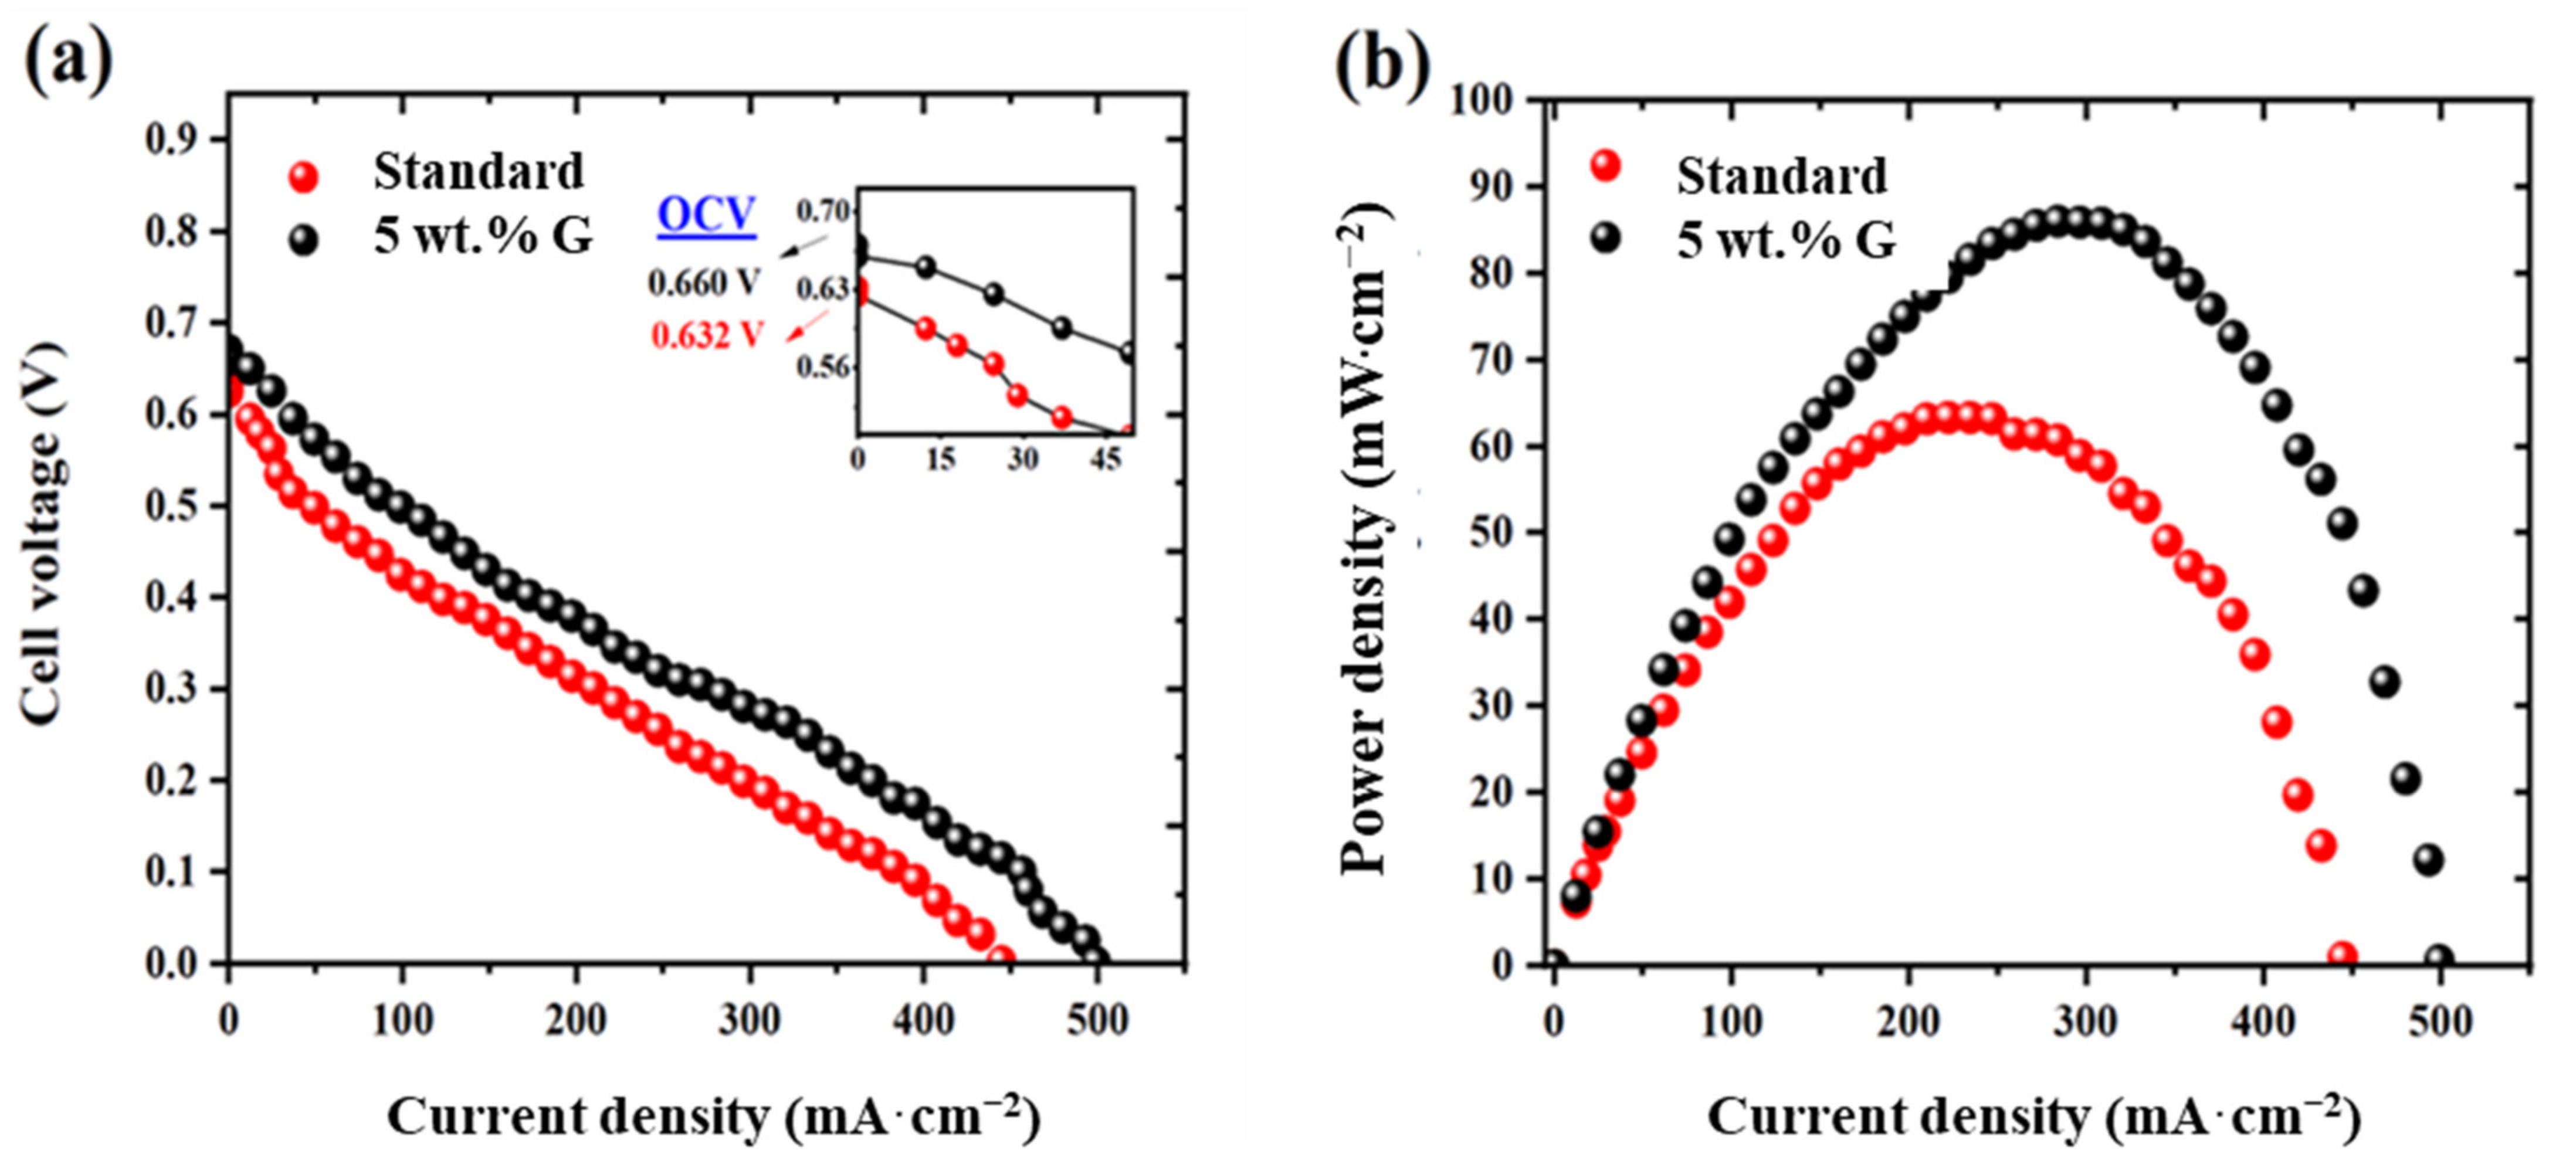
On increasing the graphene content at 5 wt.% (noted as 5 wt.% G in the
Figure 5), the peak power density of 91 mW·cm
−2 is attained (
Figure 5a,b). The voltage profile (inset of
Figure 5a) shows that the open circuit voltage (OCV) for graphene is 0.660 V, whereas for the standard is 0.630 V, indicating less methanol permeation. It is known that polarization curve consists of: activation (low current density), ohmic (middle region) and mass-transport (high current density) regions corresponding to interplay of methanol crossover, membrane conductivity and oxygen transfer phenomenon [
2,
3,
9]. The increase in OCV confirms this effect.
Since high value of membrane selectivity of 0.77 mS·cm·mA
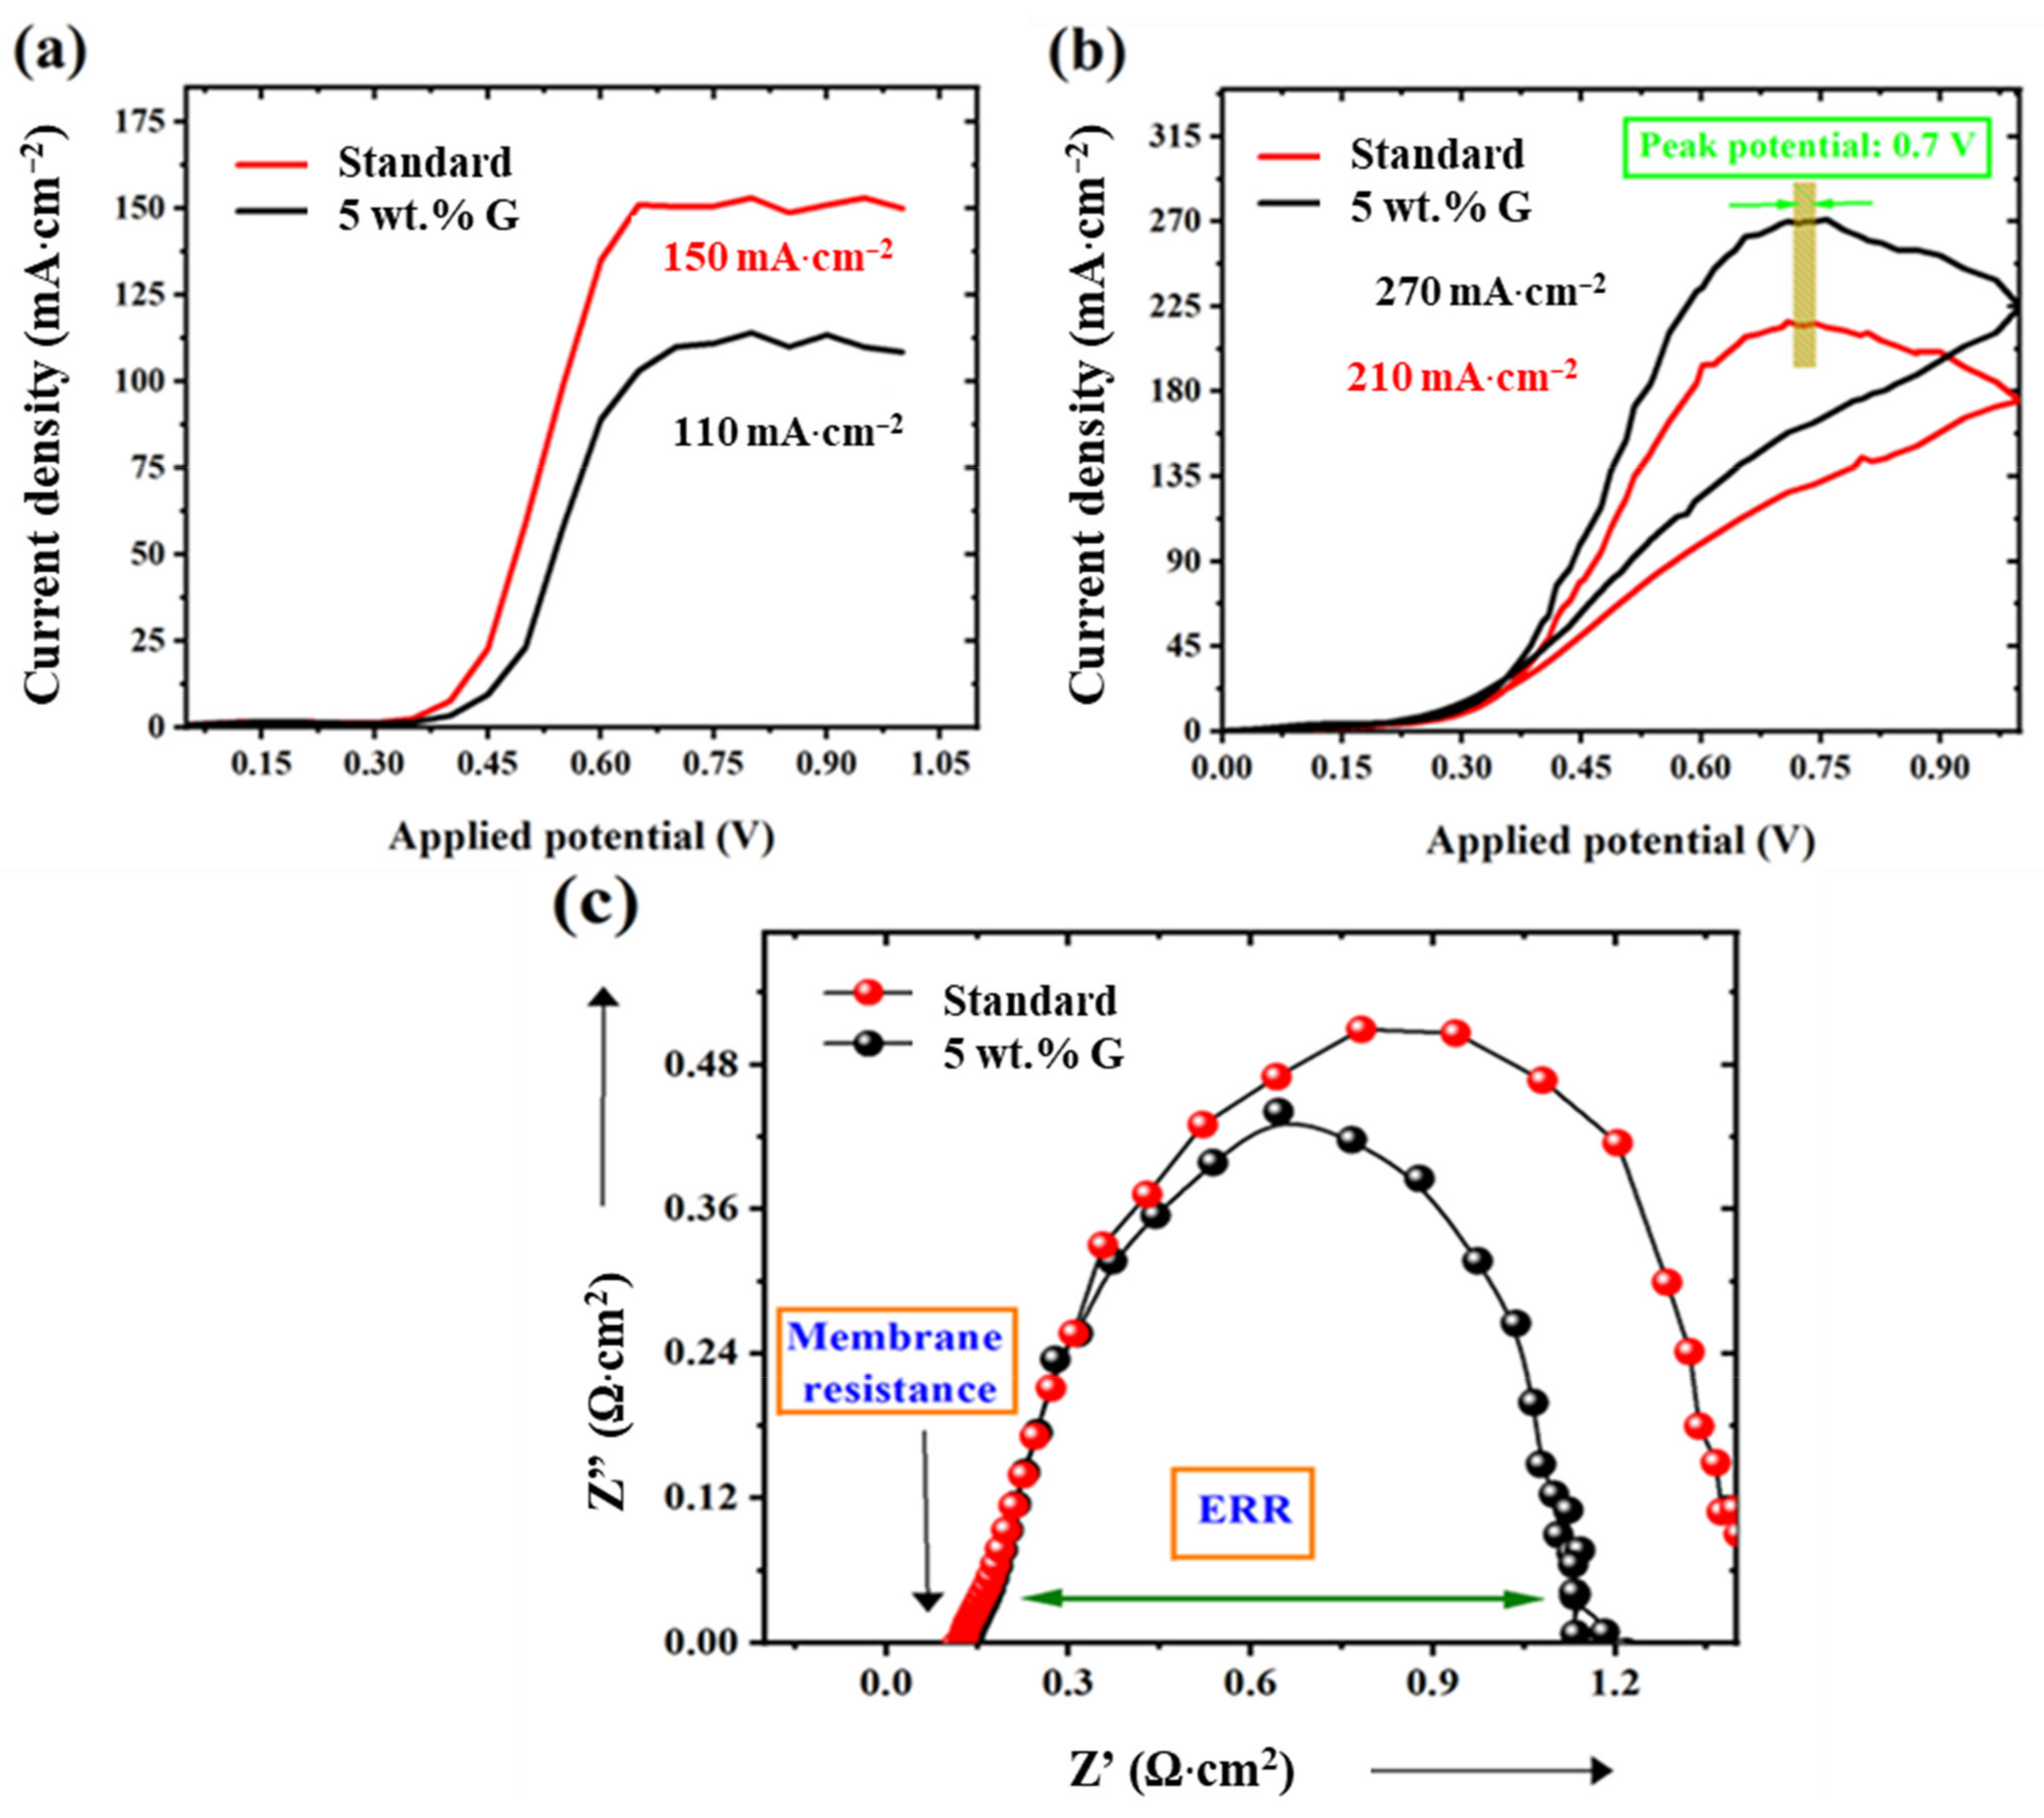
−1 is obtained for this 5 wt.% graphene electrode as in previous discussions, this MEA is studied in detail. On characterization for membranes, the methanol permeation (MP, electrochemical, mode) has reduced to 110 mA·cm
−2, compared to 150 mA·cm
−2 for the standard (
Figure 6a).
This methanol blocking has led to better methanol utilization on the anode side, showing enhanced fuel oxidation propensity (FOP)—methanol oxidation current of 270 mA·cm
−2 (graphene) than 210 mA·cm
−2 for the standard (
Figure 6b). Also, the similar peak potential at 0.7 V for both standard and 5 wt.% graphene, indicates negligible catalytic activity of graphene towards methanol oxidation.
Impedance spectroscopy plot shows that this 5 wt.% graphene barricade layer has reduced proton conductivity from 100 to 85·mS·cm
−1—calculated from x-axis intercept (
Figure 6c). However, this has not affected the overall fuel cell performance. This is due to decreased permeation and increased methanol oxidation effects being more dominant than the proton resistance effect. Furthermore, the ERR values for 5 wt.% graphene (1.1 Ω·cm
2) are lower than the standard (1.35 Ω·cm
2), (
Figure 6c) reflecting fuel cell results, caused by the above factors.
MP results by gravimetric modes as shown in
Figure S3a (
Supplementary Materials) indicated less loss in weight for the 5 wt.% graphene electrode than the standard, thereby confirming previous electrochemical results.
Figure S3b shows the electrode wettability of standard and 5 wt.% graphene, showing the hydrophobic nature of graphene compared to platinum surface.
On further increasing the graphene content above 5 wt.%, the performance drastically dropped from 63 mW·cm
−2 (standard) to 45 mW·cm
−2 for 10 wt.% graphene, then to 29 mW·cm
−2 for 20 wt.% graphene. This is due to the dominant impact of proton resistance on cell performance (
Table 2), though decreased methanol permeation effect is experienced, as listed in the
Table S3, Supplementary Materials.
Therefore, taking into account all the materials, electrode and membrane characterization results as discussed before, it can be inferred that all these factors have aided in increased selectivity, thereby enhancing performance facilitated by 5 wt.% graphene layer as depicted in
Figure 7a,b, showing influence of selectivity on performance for different samples.
2.4. Effect of Temperature on Fuel Cell Performance
This performance improvement was found to increase linearly with temperature showing that the 5 wt.% graphene barricade layer impeded methanol permeation, to a greater extent with slight resistance to protons at different temperatures.
Figure S4 (
Supplementary Materials) gives the peak power density at different temperatures.
2.5. High Concentration Methanol Fuel Cell Testing
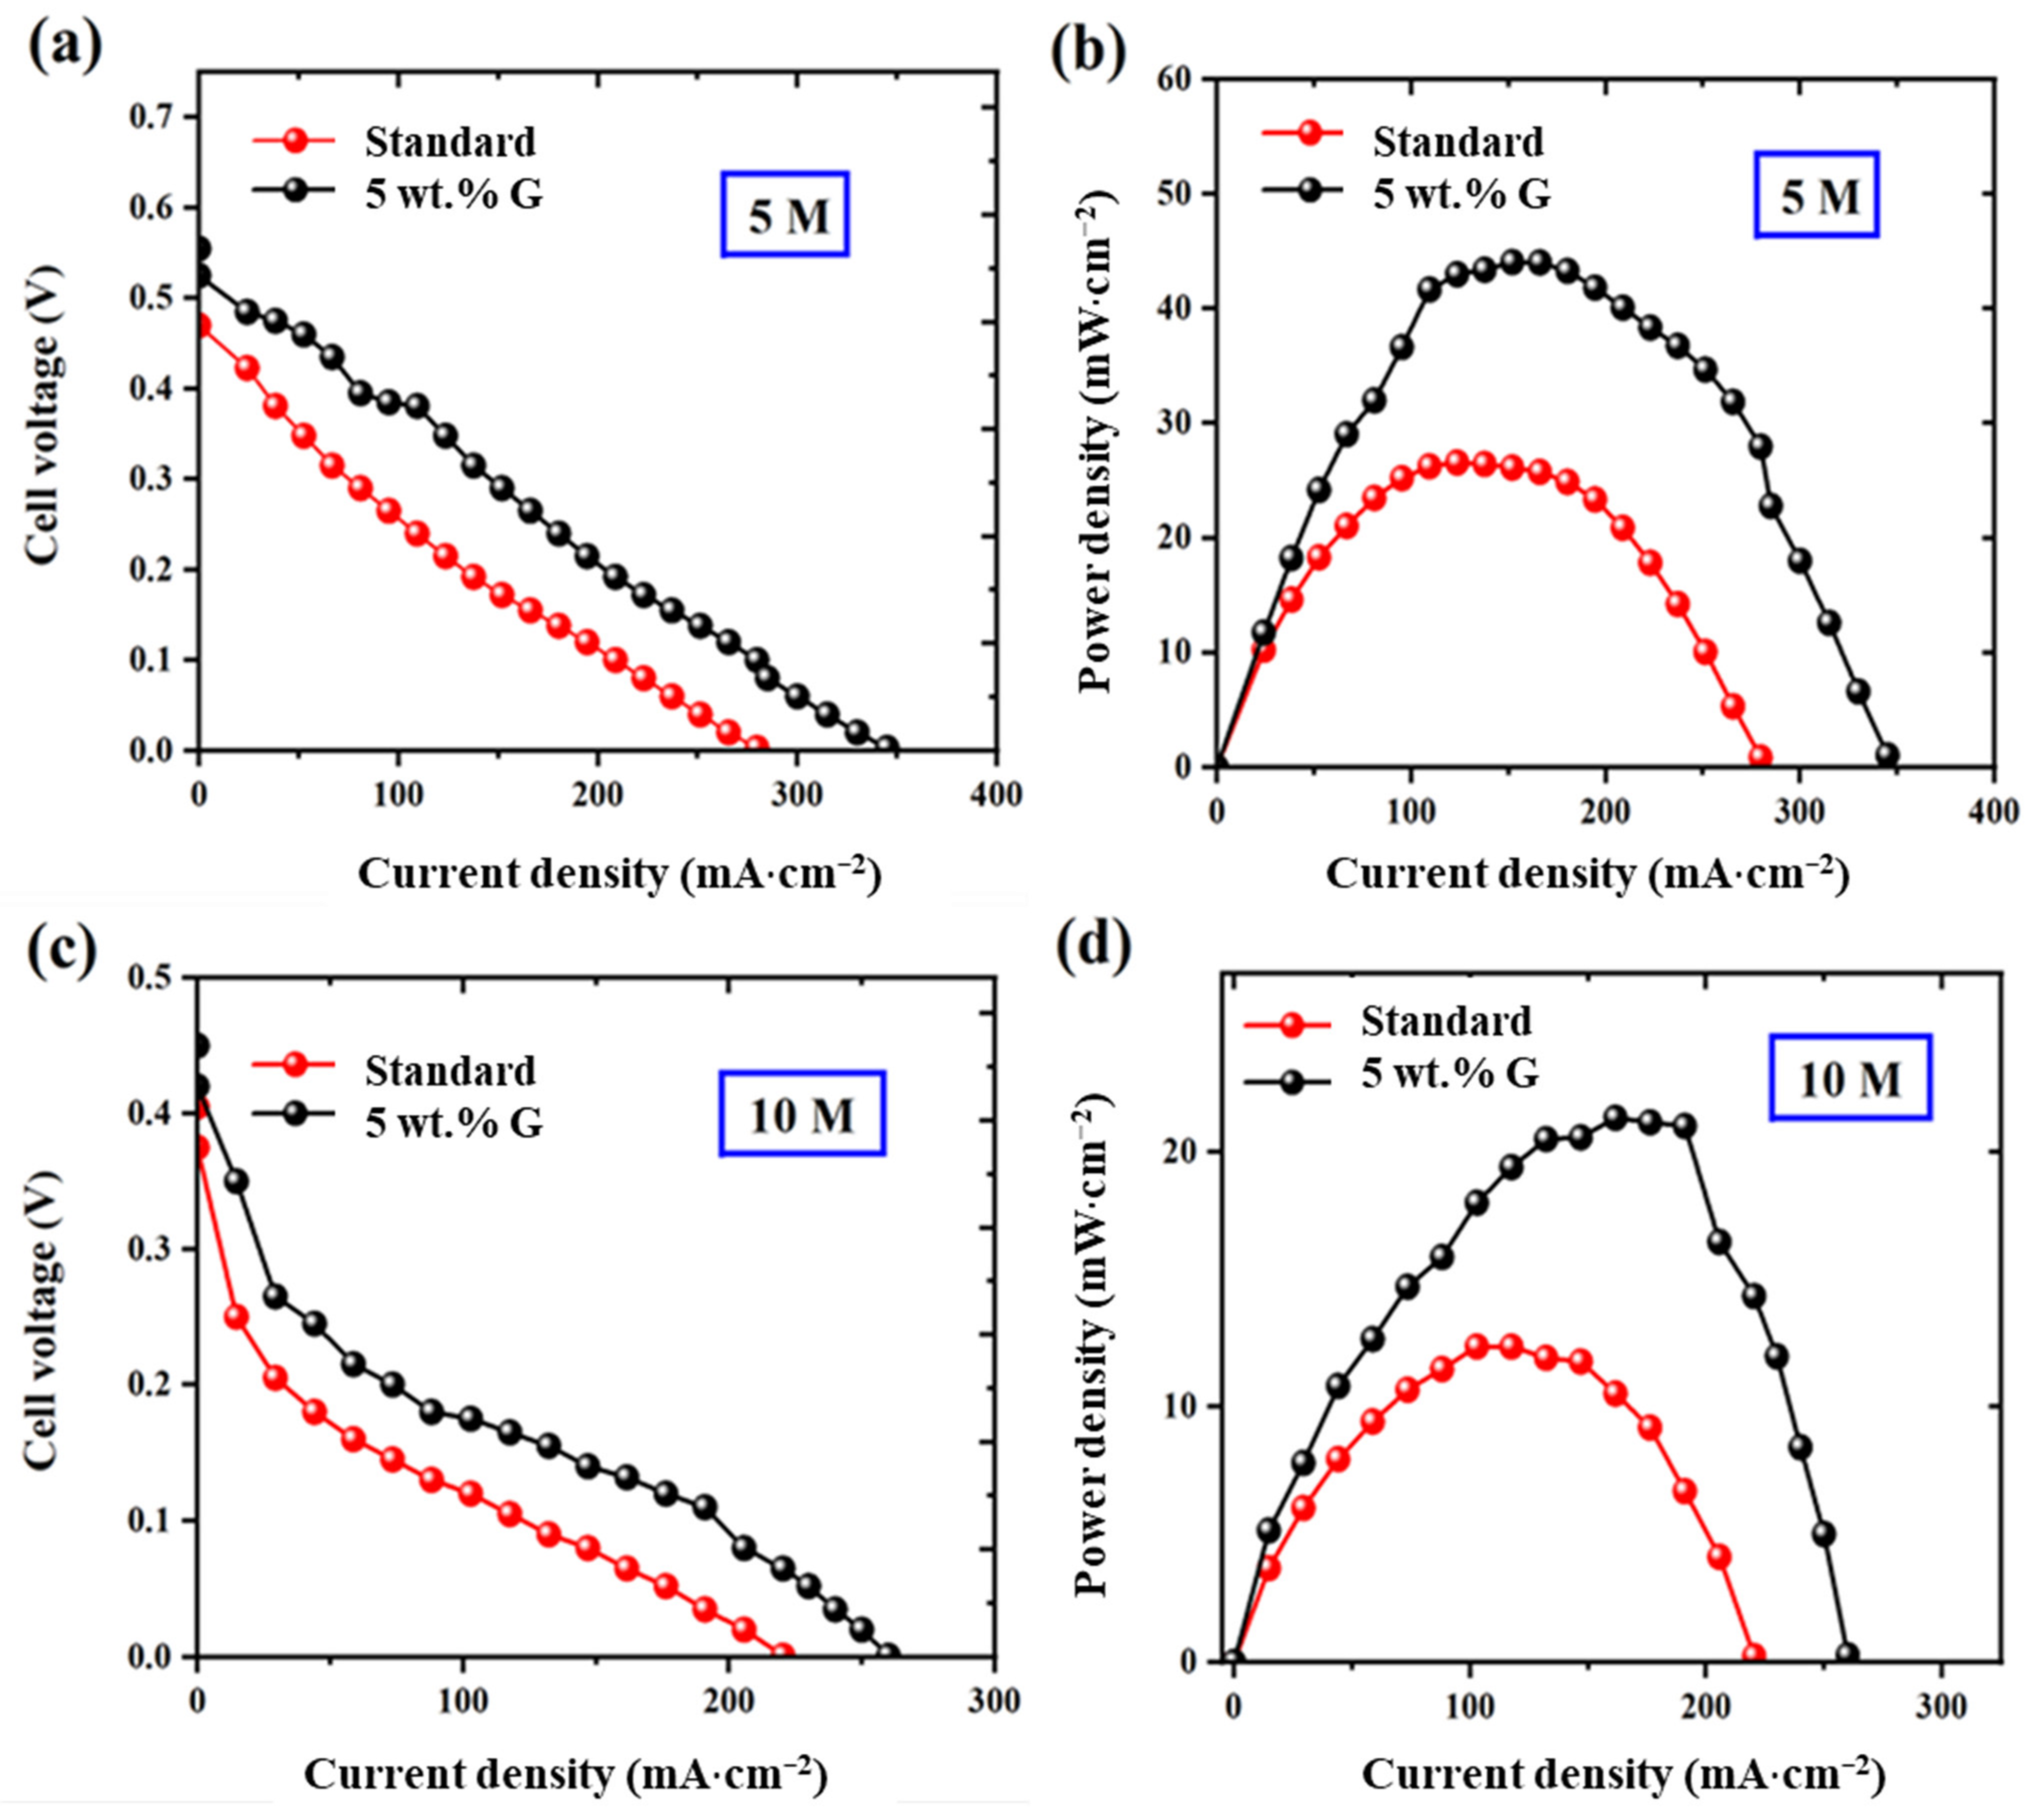
Testing at high methanol concentration is essential, as this can be of great use for comparison to commercial portable sources, henceforth carried out at 5 and 10 M concentrations [
7,
8,
9]. The impact of methanol blockage effect is more pronounced at these high concentrations—showing 56% (45 mW·cm
−2 peak power density compared to 25 mW·cm
−2 for the standard) and 75% (22 mW·cm
−2 peak power density compared to 12 mW·cm
−2 for the standard) performance improvements at 5 and 10 M concentrations, which are far higher than at 1 M concentration power performance results (36% improvement) as shown in polarization curve (voltage and power density profile) in
Figure 8 for standard and 5 wt.% graphene MEAs.
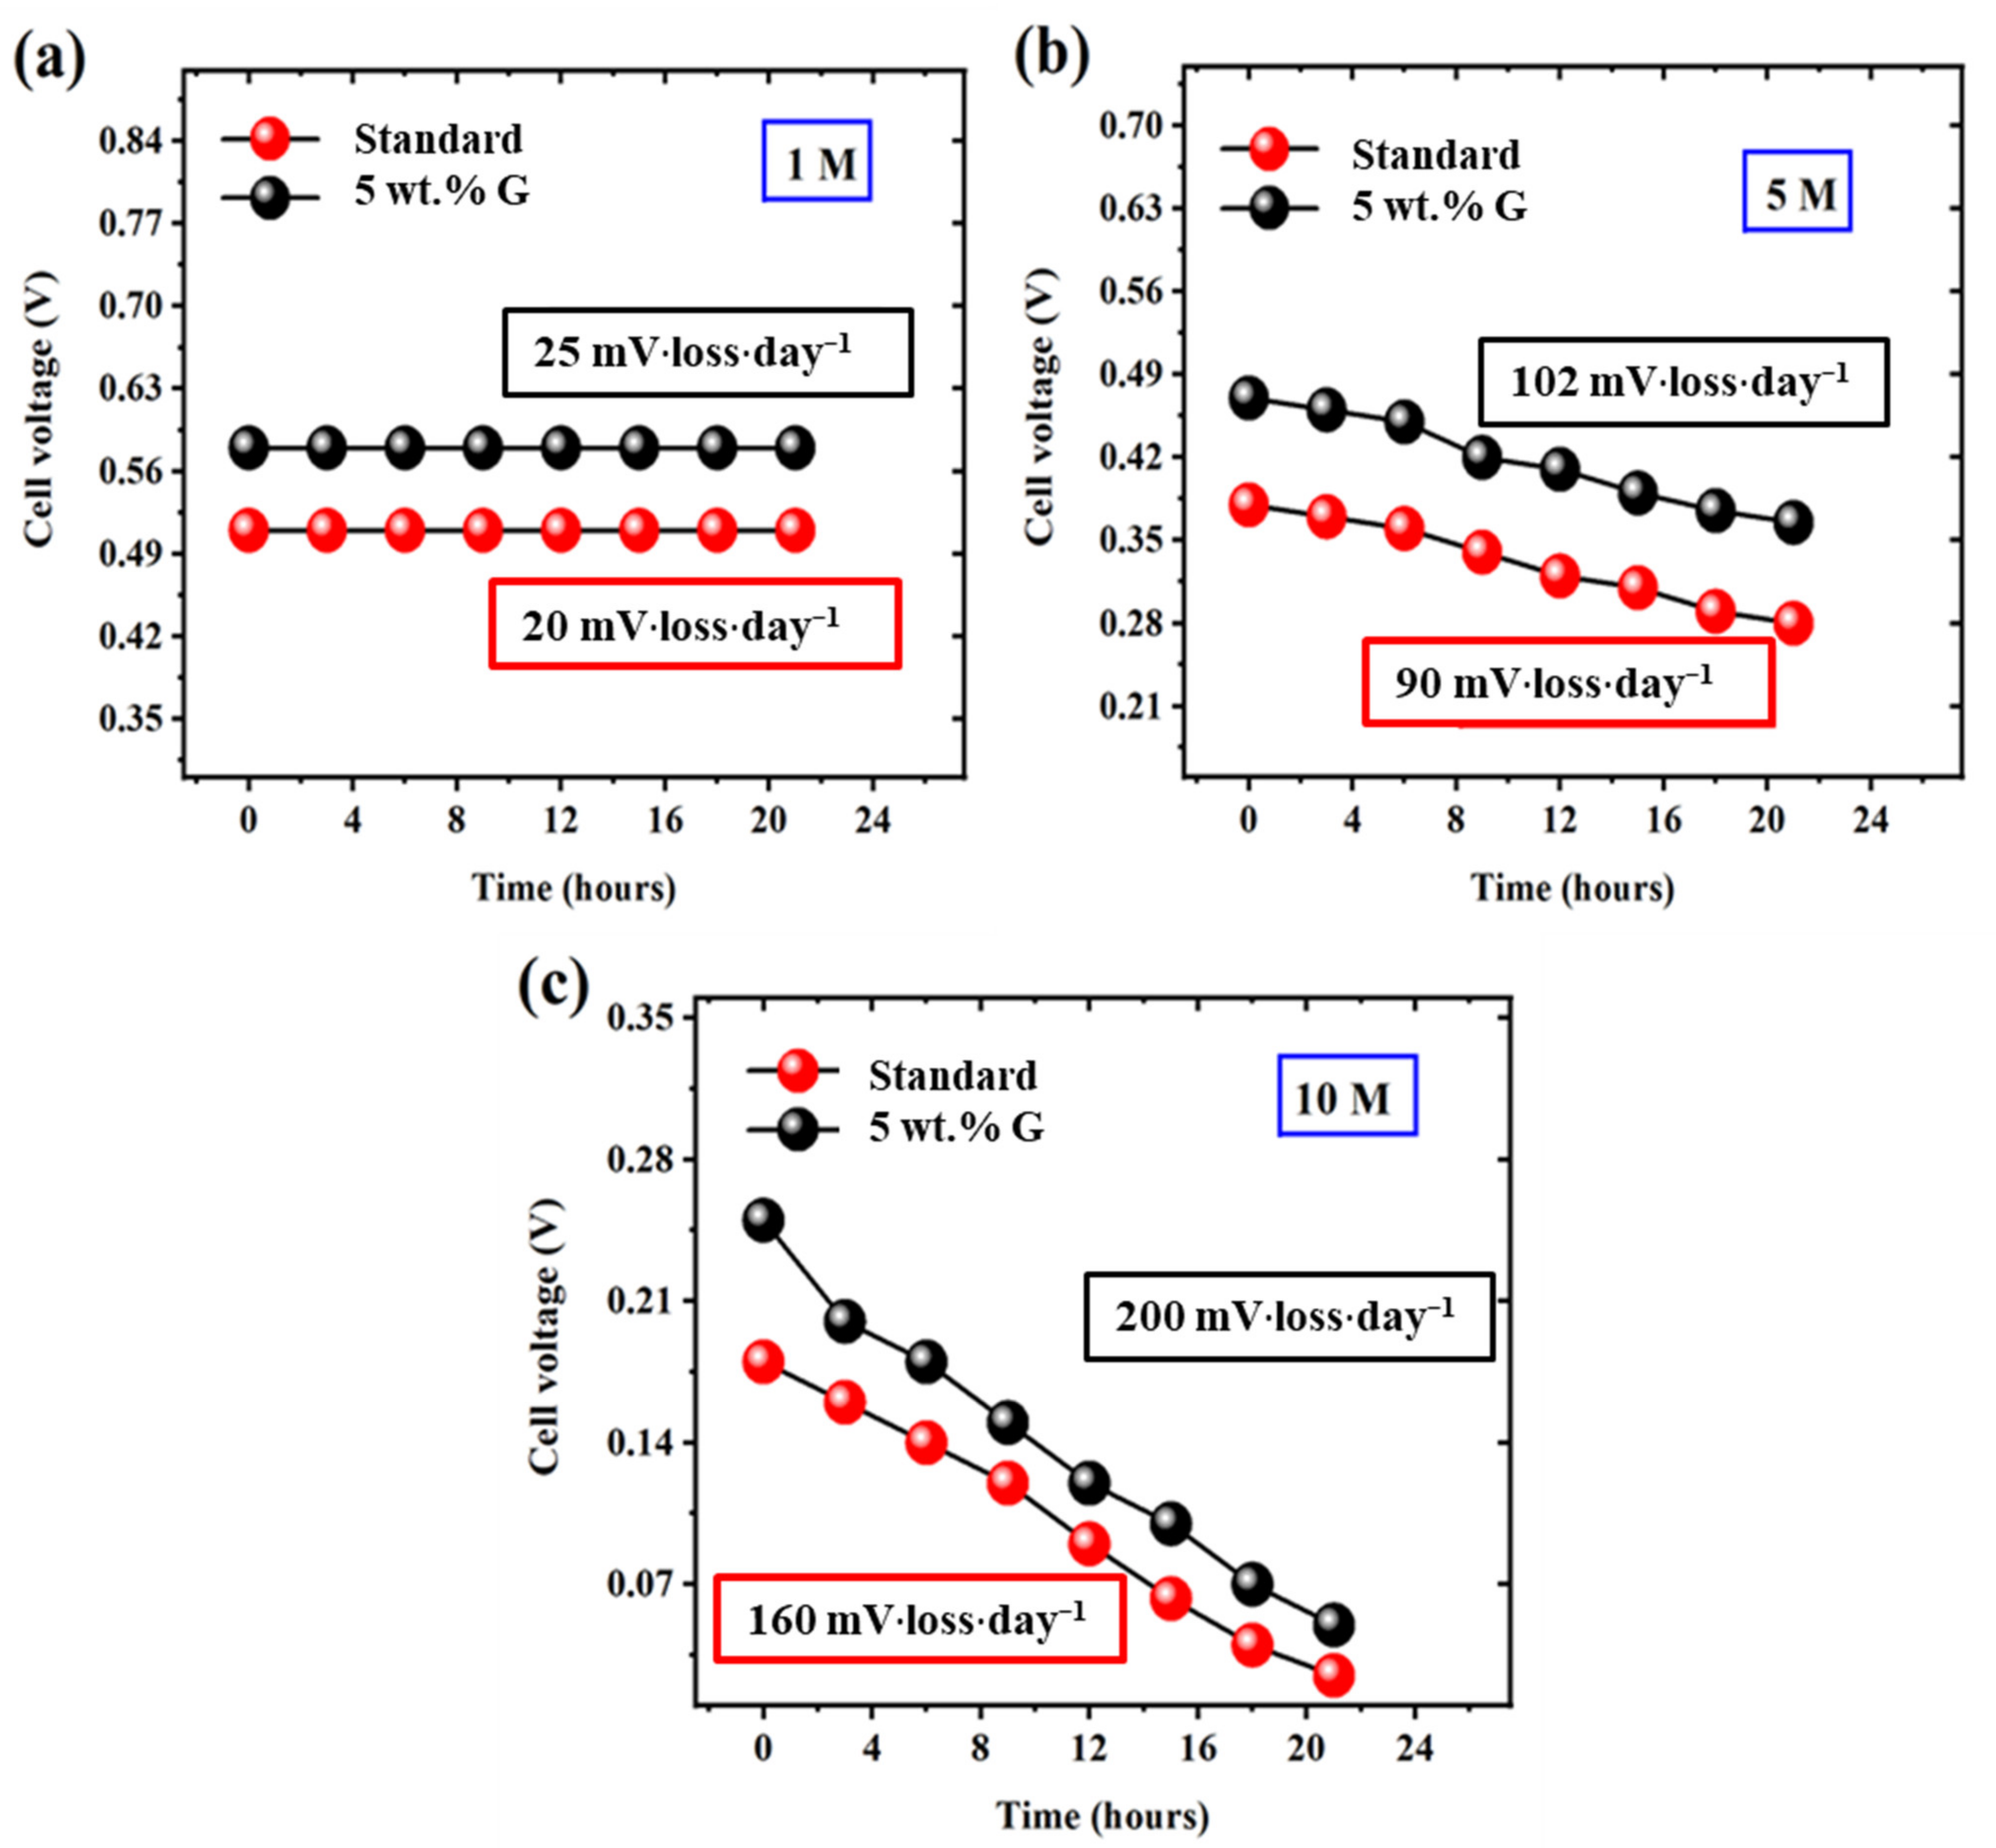
2.6. Durability Testing
Durability testing aids in evaluation of graphene stability for prolonged periods of time henceforth carried out for 20 h at constant current density of 50 mA·cm
−2.
Figure 9 shows the minimal (and similar profile) voltage losses for both 5 wt.% graphene barricade layer and standard MEAs, at different 1 M (
Figure 9a), 5 M (
Figure 9b) and 10 M (
Figure 9c) concentrations confirming their promising nature for long-term power supply applications.
After durability testing, minor reductions in open circuit voltage, peak power density and selectivity values are observed. This is attributed to the dissolution of graphene from the fuel cell electrode due to the high flow rate of incoming fuels. This is evident from top view (
Figure S5a,b) and cross-sectional view (
Figure S5c,d, Supplementary Materials) of SEM images of electrodes before and after durability testing, showing damaged surface. Since it is beyond the scope of this work, (considering multiple factors—experimental), to analyze the intrinsic behavior of electrodes during fuel cell operation, we have decided to take this for future studies.
2.7. Testing in Ethanol and 2-Propanol Fuel Cell Systems
It well-known that graphene prevents ethanol and propanol flow through its channels [
13,
14,
15], hence it is tested at fuel cell systems using these alcohols as fuels. Considerable performance improvements—power density curve (
Figures S6a and S7a, Supplementary Materials) are obtained, when tested at 1 M ethanol and 1 M 2-propanol fuel cell systems at wide temperature range (
Figures S6b and S7b). These results confirm the versatility of graphene usage in various liquid alcohol-based fuel cells.
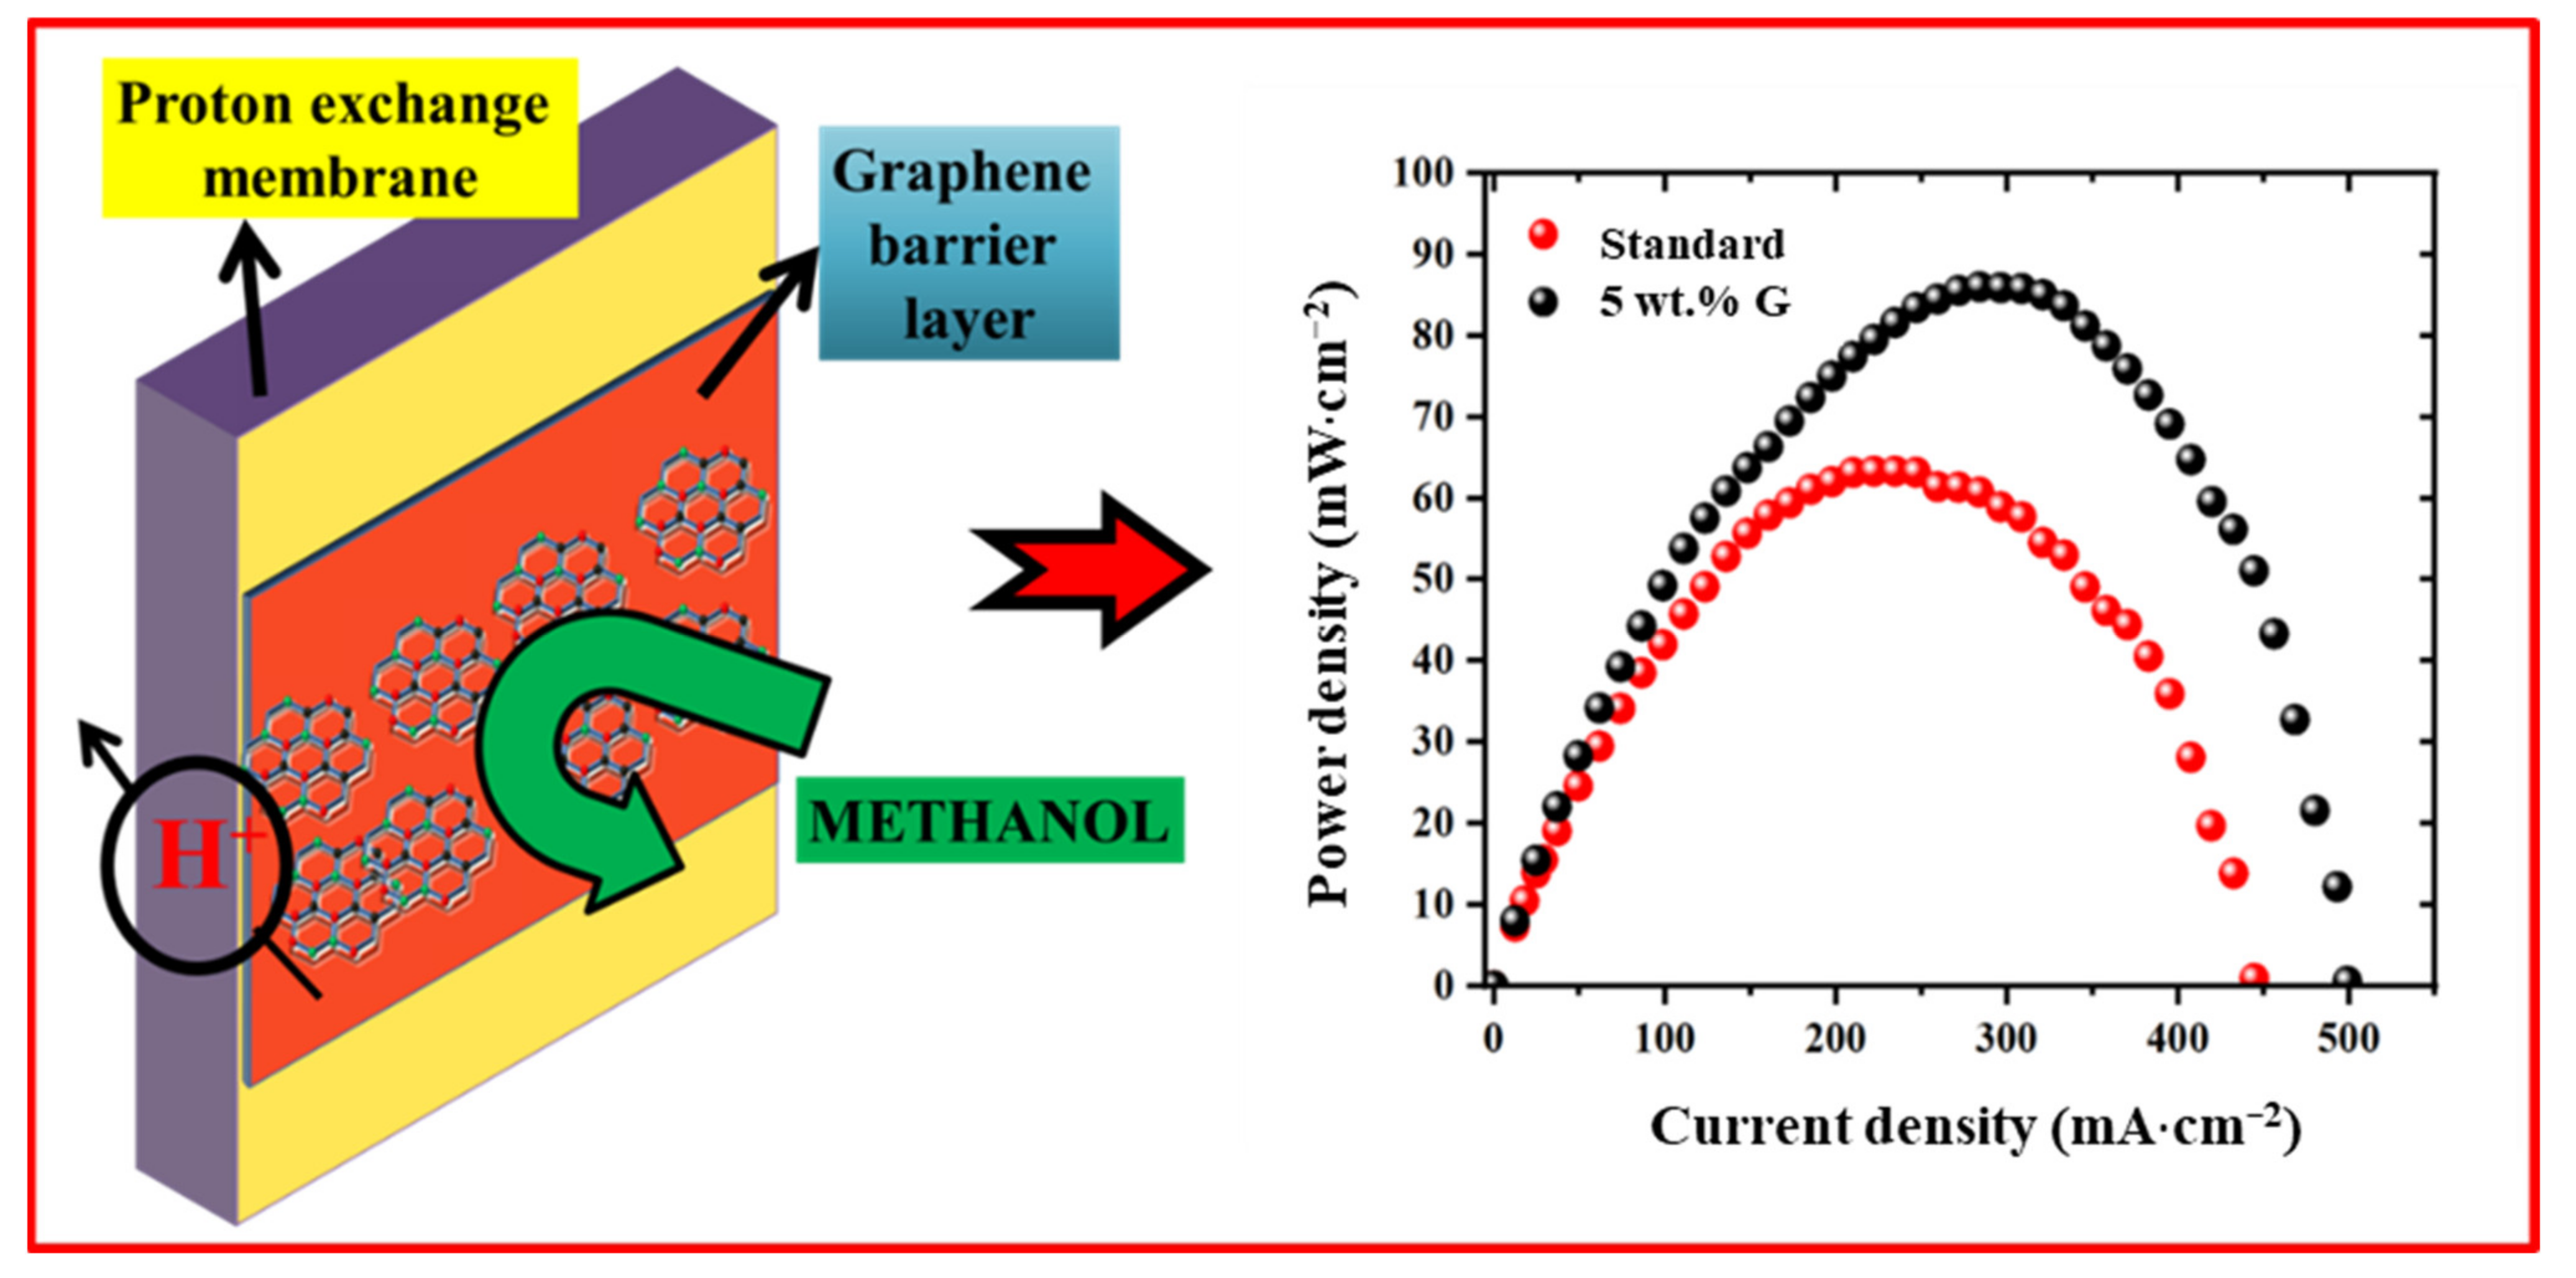
Overall, 2D graphene prepared by facile liquid phase exfoliation approach has been utilized as a barrier layer onto the anode side (sprayed above the catalyst layer) due to its imparting high selectivity to the membrane region (fuel passage prevention characteristics) and thereby enhanced improvements in performance in methanol/ethanol/propanol systems are obtained.
Starting from material characterization results, the high C/O ratio of prepared graphene has aided in enhanced hydrophobicity to the fuel cell electrode, whereas few layer thicknesses resulted in insignificant proton resistance. Combined effect of water/fuel transport on the anode due to changes in electrode crack separation, reduced fuel crossover (methanol permeability, MP), enhanced fuel oxidation on anode side and barrier effect have led to high membrane selectivity. This is depicted in the
Figure 10 to summarize the role of graphene on power performance.
Using this at low weight percentages—5 wt.%, has resulted in 40%, 56% and 75% improvement in 1, 5 and 10 M methanol concentrations in addition to enhancements in ethanol and propanol systems. These beneficial effects are also observed at ethanol and propanol fuel cell systems over a wide temperature range (20 °C to 60 °C). Further increasing the graphene weight percentage (stacking), gives poor performance due to the dominant effect of proton transfer resistance affecting selectivity.
In comparison to the previous work reported (using ozonated graphene, chemical vapor deposited graphene, mechanically exfoliated hexagonal boron nitride materials in the literature) the results obtained in this work offer advantages in various prospects: ease in preparation of graphene, utilization methodology, controllability, short- and long-term performance and diverse usage in various LAFCs, which are given in
Table S4, Supplementary Materials.
Also efforts like improving the efficiency of exfoliation (obtaining lesser thick material than obtained in current conditions, increased 2D material concentration by using solvents closer to the surface energy of graphite—80 mJ·m−2, rather than acetone in this work, effect of sonication time, centrifuge speed and duration), studying the effect of flake size, and testing in formic acid, ethanol, hydrogen fuel cells will be of significant interest and be the follow-up of this work.
4. Conclusions
In this work, few-layer graphene flakes prepared by facile, scalable and eco-friendly liquid phase exfoliation (bath sonication) approach of graphite in acetone medium and utilizing them as barrier layer by mounting them next to the membrane on the anode side (sprayed above the catalyst layer) in direct liquid alcohol fuel cells (LAFCs) involving methanol, ethanol and propanol systems is proposed. The material characterizations by atomic force microscopy (AFM), Raman spectroscopy and scanning electron microscopy (SEM), show that graphene is of 2–5 nm thickness and 4 µm uniform lateral size.
The cell performance tests exhibit that 5 wt.% graphene barrier layer, at direct methanol fuel cell (DMFC) testing conditions (60 °C and 1 M methanol), increases the maximum power density from for the standard 63 to 91 mW·cm−2. This barrier layer reduces the methanol permeation (MP) from 153 to 112 mA·cm−2, with slight decrease in proton conductivity from 101 to 84 mS·cm−1, which has led to better methanol utilization—overall improving membrane selectivity (proton conductivity to fuel crossover ratio).
This methanol barrier effect is more visible at highly concentrated methanol operations, where 36% and 75% improvements in fuel cell performance are observed. Long-term testing for 20 h also confirms this effect by displaying minimal voltage losses.
This newly reported work tends to eliminate limitations by using liquid phase exfoliated graphene as a barrier layer due to its feasibility, environmental friendliness and mass production characteristics—yielding few layer nano-materials, posing competition to expensive and complex—chemical vapor deposition (CVD) and mechanical exfoliation methods, in addition to power performance improvements. This also opens new possibilities for other crystals: hexagonal boron nitride (hBN), tungsten di sulphide (WS2) and molybdenum di sulphide (MoS2) to be used as barrier layers, overall pushing the commercial circle of direct LAFCs.


 and
and 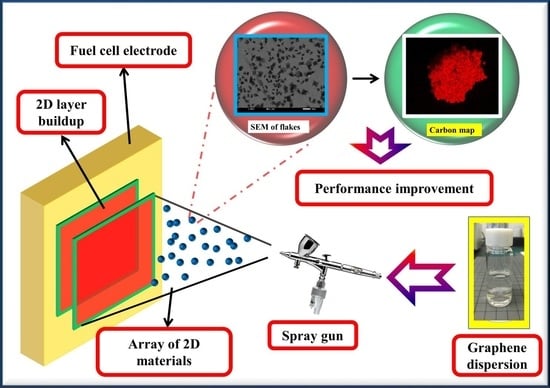


