1. Introduction
With the emerging employment of nuclear energy, tremendous attention has been paid to the proper disposal and treatment of radioactive pollutants [
1,
2,
3]. The
131I and
129I nuclides produced through uranium fission are highly volatile and hazardous.
131I has high radioactivity (4.6 × 10
15 Bq·g
−1) and high activity that can participate in human metabolism [
4], and the half-life of
129I is as long as 1.57 × 10
7 years, which is the major pollutant endangering human health and ecological environment [
5,
6]. The reprocessing condition of nuclear fuels usually requires a high temperature under high pressure. As-produced radioactive iodine exists in both vapor and liquid forms. For iodine vapor, the main capturing strategy is through physisorption [
7,
8,
9,
10,
11]. Bismuth-based compounds [
12,
13,
14] and mordenite-containing silver [
11,
15,
16] are usually used to adsorb gaseous iodine. However, these adsorbents usually have small porosity and limited specific surface area; thus, it is difficult to achieve the efficient adsorption of gaseous iodine [
17]. Recently, metal–organic frameworks (MOFs) have been employed to improve porosity and specific surface area. However, MOFs cannot be applied in liquid media, which require a wet-washing process due to their poor water stability [
18,
19]. By comparison, covalent organic frameworks (COFs) with porous structures and high stability have been demonstrated as potential adsorbents for iodine in vapor and various liquid media [
20,
21,
22,
23,
24,
25,
26,
27,
28,
29,
30,
31,
32,
33,
34,
35].
The mechanism of iodine adsorption for COF materials involves both physisorption and chemisorption, with physisorption playing the dominant role. For physisorption, the pore size and morphology of organic porous materials have important effects on the capture of iodine [
10]. In general, most COFs have two-dimensional AA stacked topology, resulting in dense and uniformly distributed one-dimensional pore channels. This “clean and perfectly straight” pore structure of COFs normally leads to a possible desorption process, i.e., the desorption and adsorption processes occur simultaneously, which limits the further improvement of the maximum iodine adsorption capacity. To address this challenging issue, it is, therefore, necessary to adjust the pore structure and morphology of COFs by controlling the stacking form [
36,
37,
38,
39,
40] or introducing flexible building blocks [
41,
42,
43,
44]. In this case, the twisted pore structure, rather than the perfectly straight structure, can efficiently expose the adsorption site while hindering the desorption process of iodine molecules, thus leading to the maximum adsorption capacity [
42,
43,
45,
46]. Therefore, it is highly appealing to design a COF with a molecularly defined pore structure for efficient iodine adsorption.
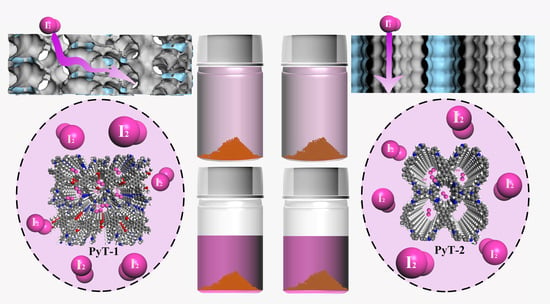
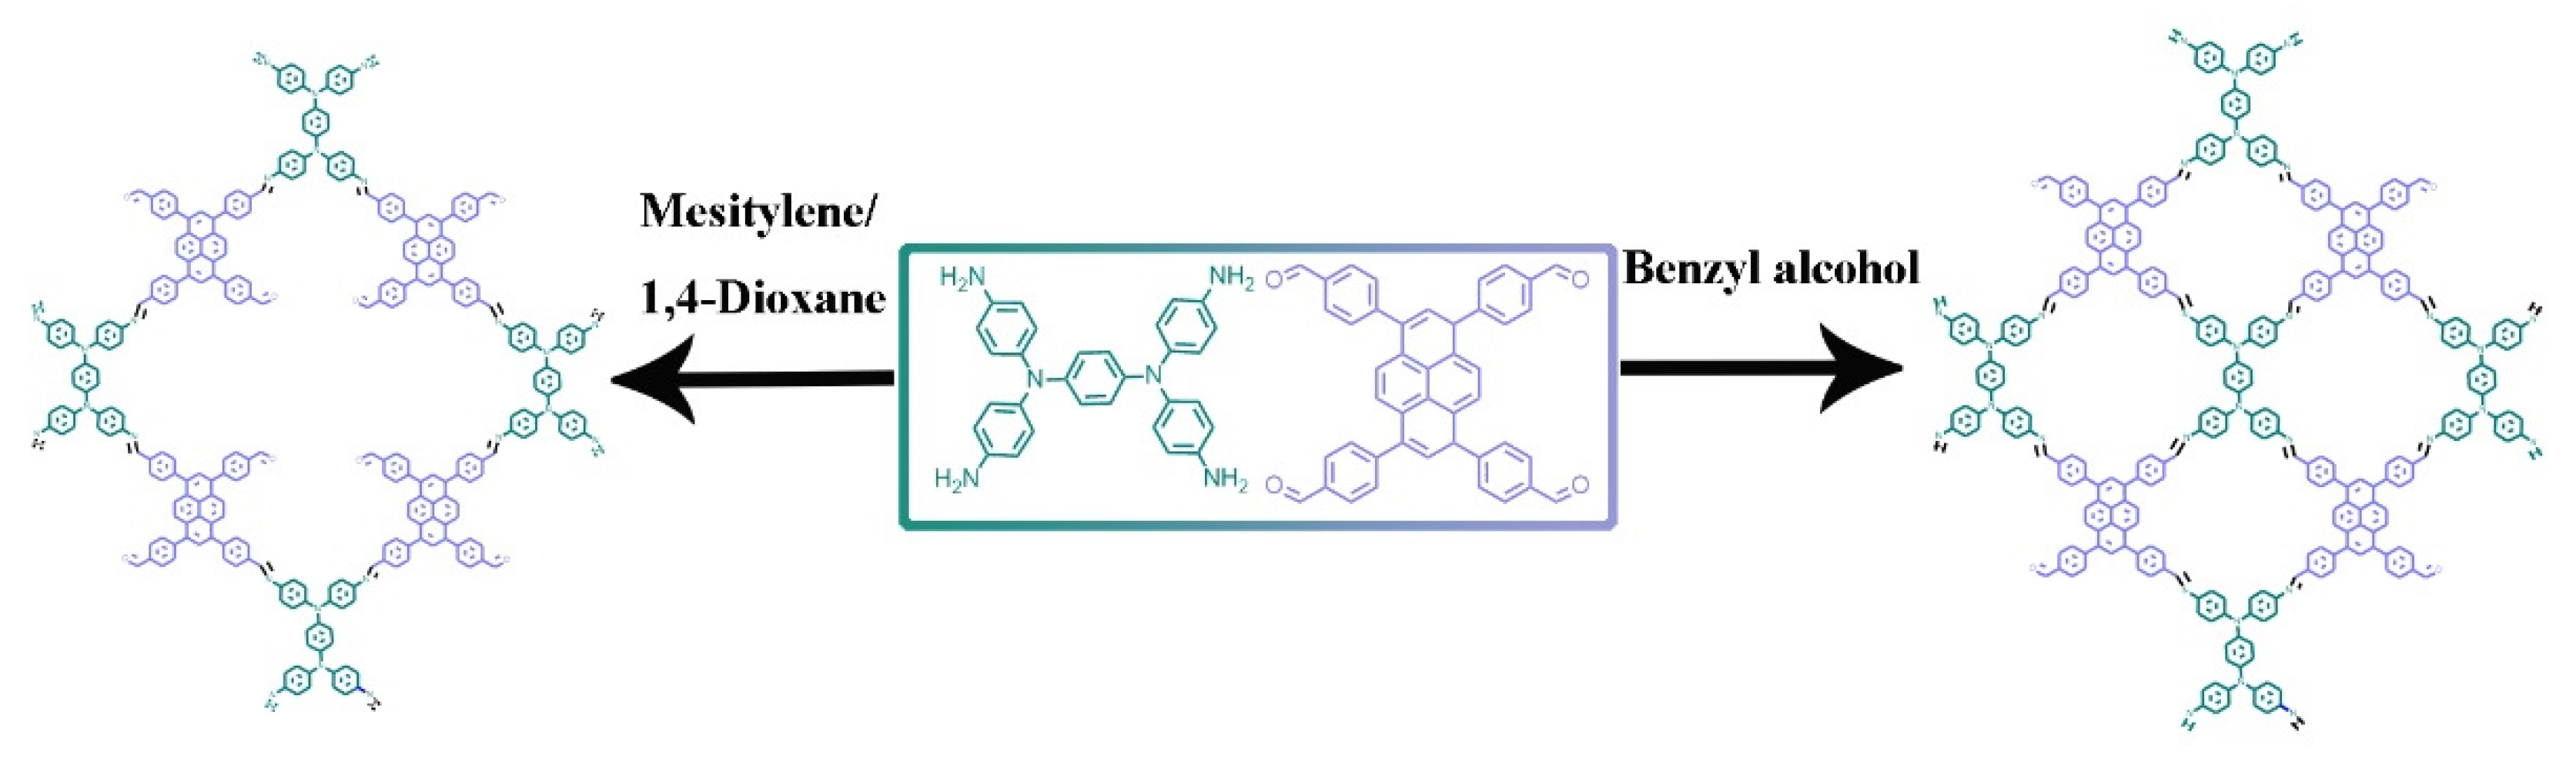
Herein, we report a precisely tuned pore structure of COFs by controlling the molecular ratio between the building blocks and the subsequent stacking orders. Monomer 4,4′,4″,4″′-(pyrene-1,3,6,8-tetrayl)tetrabenzaldehyde with a large conjugated structure and monomer N,N,N′,N′-tetrakis(4-aminophenyl)-1,4-benzenediamine with rich nitrogen elements were selected to facilely construct two-dimensional imine-linked COFs PyT-1 and PyT-2 with different topology combinations and stacking forms. Both PyT-1 and PyT-2 showed large specific surface area, high chemical, and thermal stabilities, as well as high iodine adsorption capacity. PyT-1 with an AB stacking form exhibited an excellent iodine adsorption property of 0.635 g g−1 in an n-hexane solution with a concentration of 400 mg L−1, which is comparable to the state-of-the-art iodine-absorbing materials reported so far. These results illustrate the significant variation in the iodine-capturing properties based on the molecularly defined pore structure, which may further stimulate the design strategy of novel iodine absorbents and their related applications.
2. Results and Discussion
Two COFs were synthesized via Schiff-base condensation reaction between 4,4′,4″,4″′-(pyrene-1,3,6,8-tetrayl)tetrabenzaldehyde (TFPPY) and N,N,N′,N′-tetrakis(4-aminophenyl)-1,4-benzenediamine (TPDA) (
Scheme 1). As a typical procedure, a mixture of TFPPY and TPDA in two solvent systems was heated in a sealed Pyrex tube at 120 °C for 7 days. PyT-1 was obtained by using 1,4-dioxane-mesitylene-acetic acid (aq., 6 M) (5/5/1,
v/
v/
v) mixtures as the solvents, and PyT-2 was synthesized by using benzyl alcohol (MeOH)-acetic acid (aq., 6 M) (10/1,
v/
v) mixtures as the solvents.
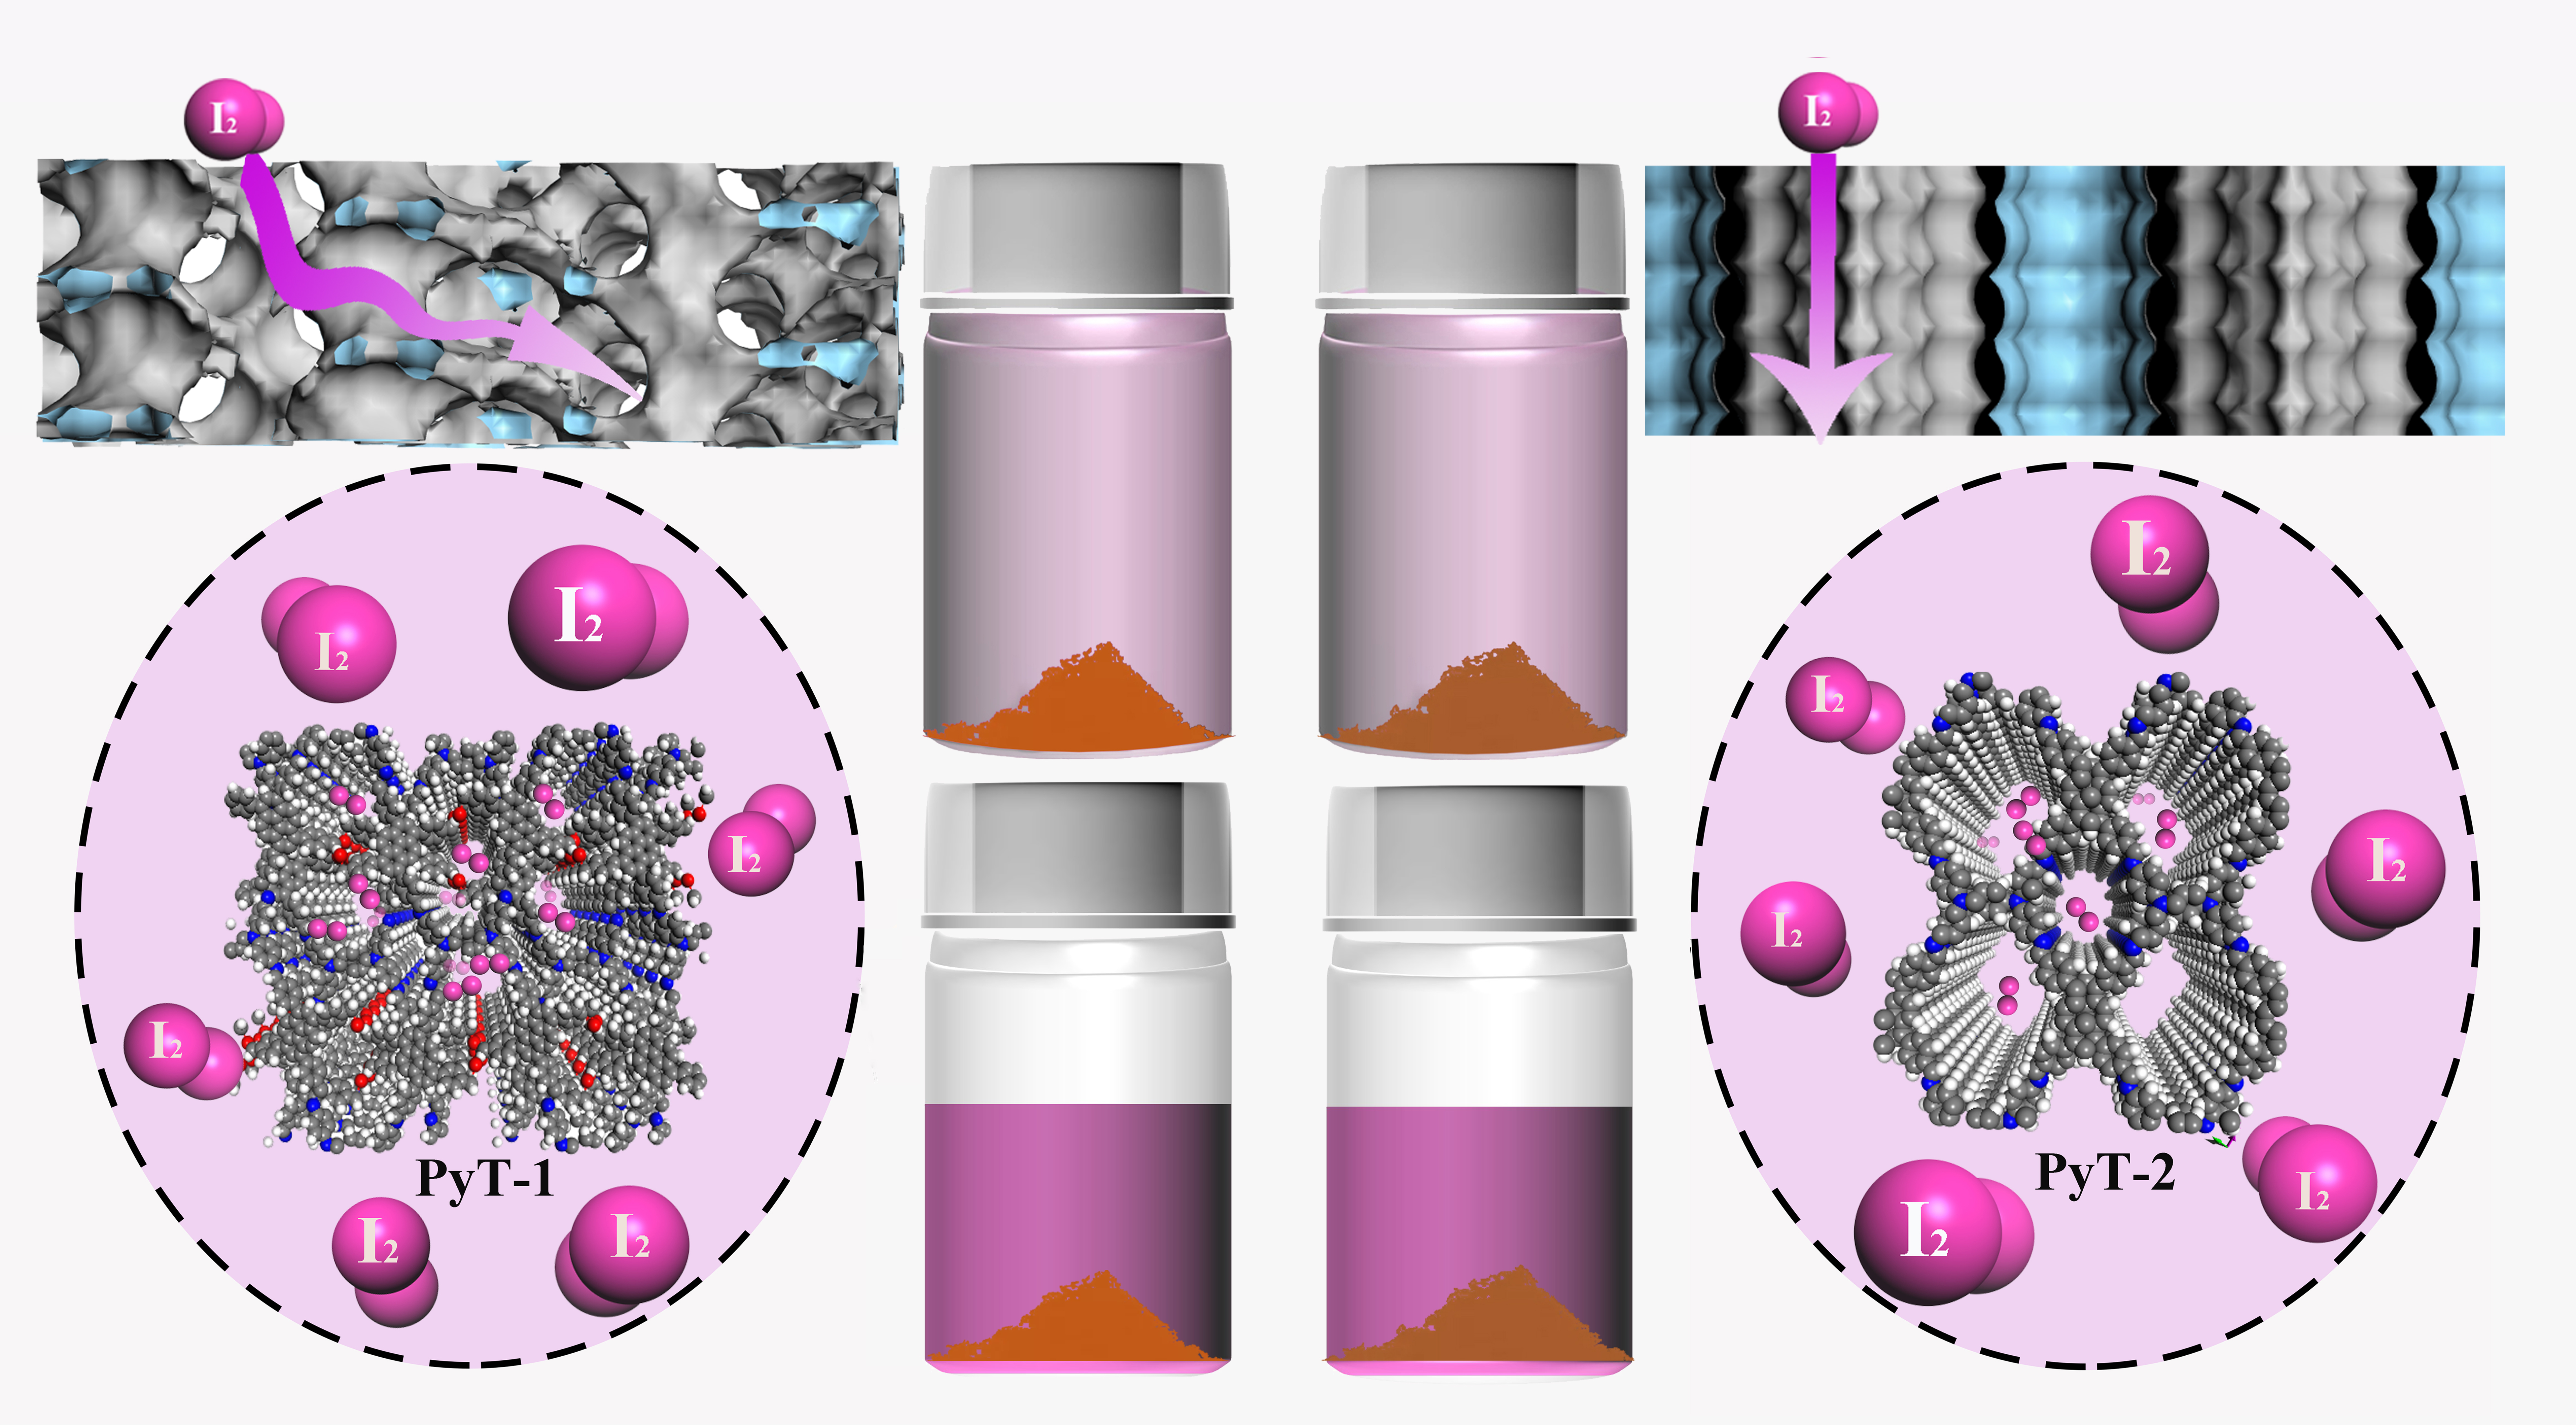
As shown in
Figure 1A, solid-state
13C NMR presented a signal peak at 154 ppm for PyT-1 and 156 ppm for PyT-2, which corresponded to the C atom on the C=N imine bond. The structures of the COFs were further verified using Fourier-transform infrared (FTIR) spectra. As shown in
Figure 1B (blue curve and pink curve), the appearance of the C=N stretching vibration peak at 1622 cm
−1 verified the occurrence of the imine condensation reaction. The infrared spectra and the NMR spectra of the two COFs were almost identical, indicating that the chemical structures of the two COFs were nearly the same.
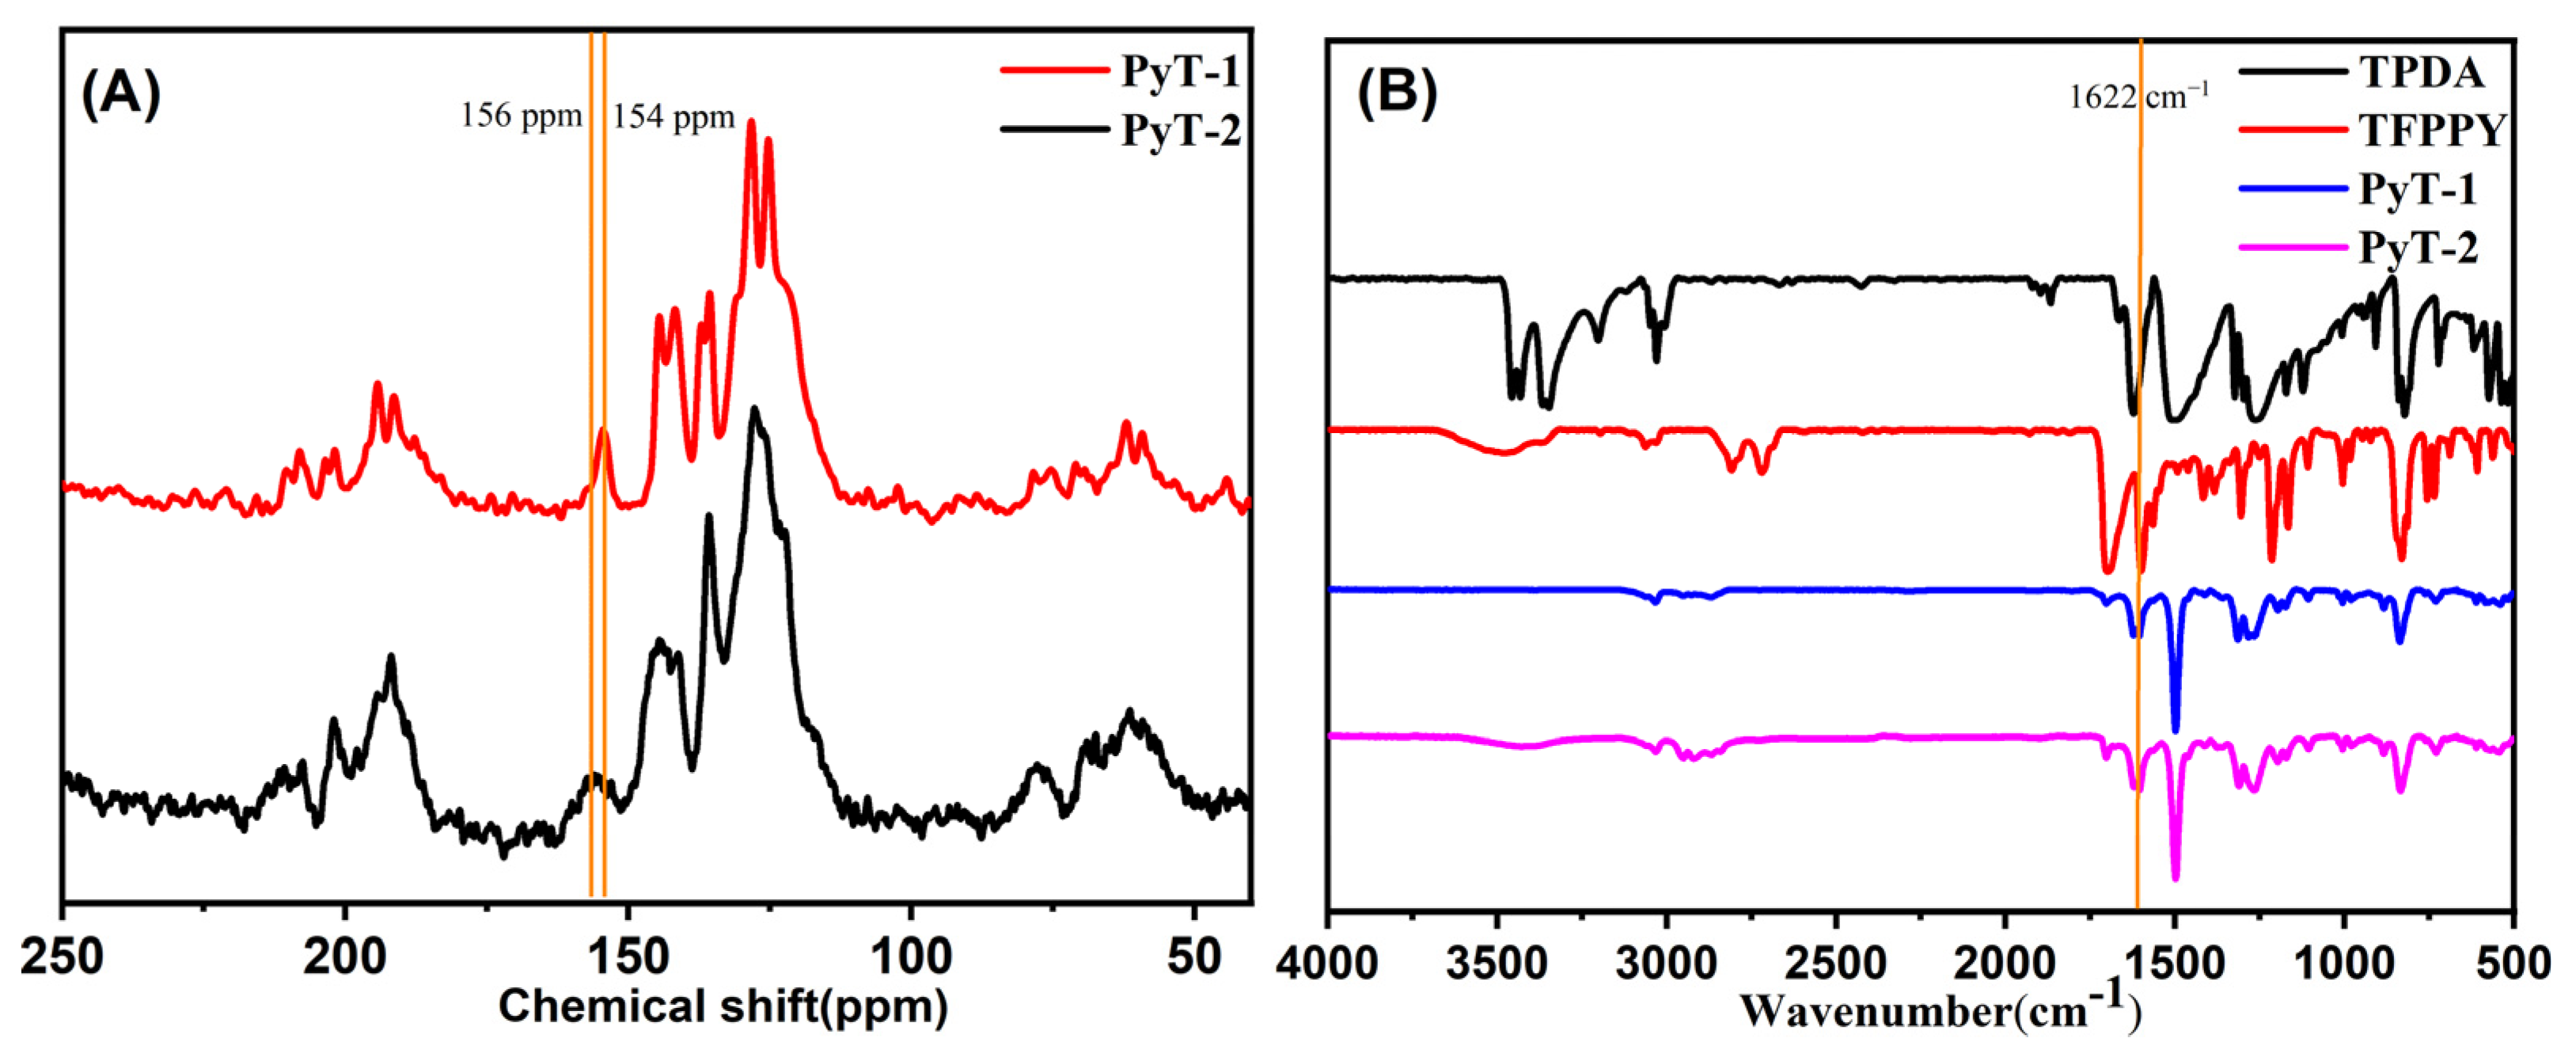
The crystalline structure of the two COFs was analyzed via powder X-ray diffraction (PXRD), structural simulation, and Pawley refinement. The experimental profile (black curve in
Figure 2A) was consistent with the simulated PXRD pattern for the staggered (AB) stacking form of PyT-1 (pink curve in
Figure 2A) but was different from the eclipsed (AA) stacking form (
Figure S1A,B, see supplymentary materials), demonstrating that the crystalline structure of PyT-1 had an AB stacking form (
Figure 2B,C). The PXRD pattern for the [C
4+C
2] topology combination (pink curve in
Figure 2A) displayed distinctly intensive PXRD peaks at 2.68°, 5.12°, 6.00°, 8.04°, and 10.96°, corresponding to (100), (200), (210), (220), and (400), indicating the high crystallinity of PyT-1. The lattice parameters were optimized using Pawley refinement until the error converged within a certain range (R
wp = 3.03%, R
p = 6.08%, respectively). The lattice parameters were a = 33.90Å, b = 56.32Å, c = 9.28Å, α = 89.73°, β = 89.20°, and γ = 92.36°, respectively.
The experimental profile (black curve in
Figure 2D) was consistent with the simulated PXRD pattern for the AA stacking form of PyT-2 (blue curve in
Figure 2A) but was different from the AB stacking form (
Figure S1C,D), demonstrating that the crystalline structure of PyT-2 had an AA stacking form (
Figure 2E,F). The PXRD pattern for the [C
4+C
4] topology combination (blue curve in
Figure 2D) displayed distinctly intensive PXRD peaks at 5.46°, 7.68°, 10.94°, and 12.28°, corresponding to (110), (200), (220), and (310), indicating the high crystallinity of PyT-2. The lattice parameters were optimized through Pawley refinement until the error converged within a certain range (R
wp = 3.32%, R
p = 4.23%, respectively). The lattice parameters were a = 7.67Å, b = 21.66Å, c = 24.53Å, α = 89.51°, β = 88.17°, and γ = 91.82°, respectively. The different monomer connection modes and stacking forms of PyT-1 and PyT-2 resulted in the different crystalline structures of the two COFs. PyT-1 with the [C
4+C
2] topology combination and the AB stacking form revealed a very staggered skeleton and distorted pores (
Figure 2B,C), while the pore structure of PyT-2 with the [C
4+C
4] topology combination and the AA stacking form was uniform (
Figure 2E,F).
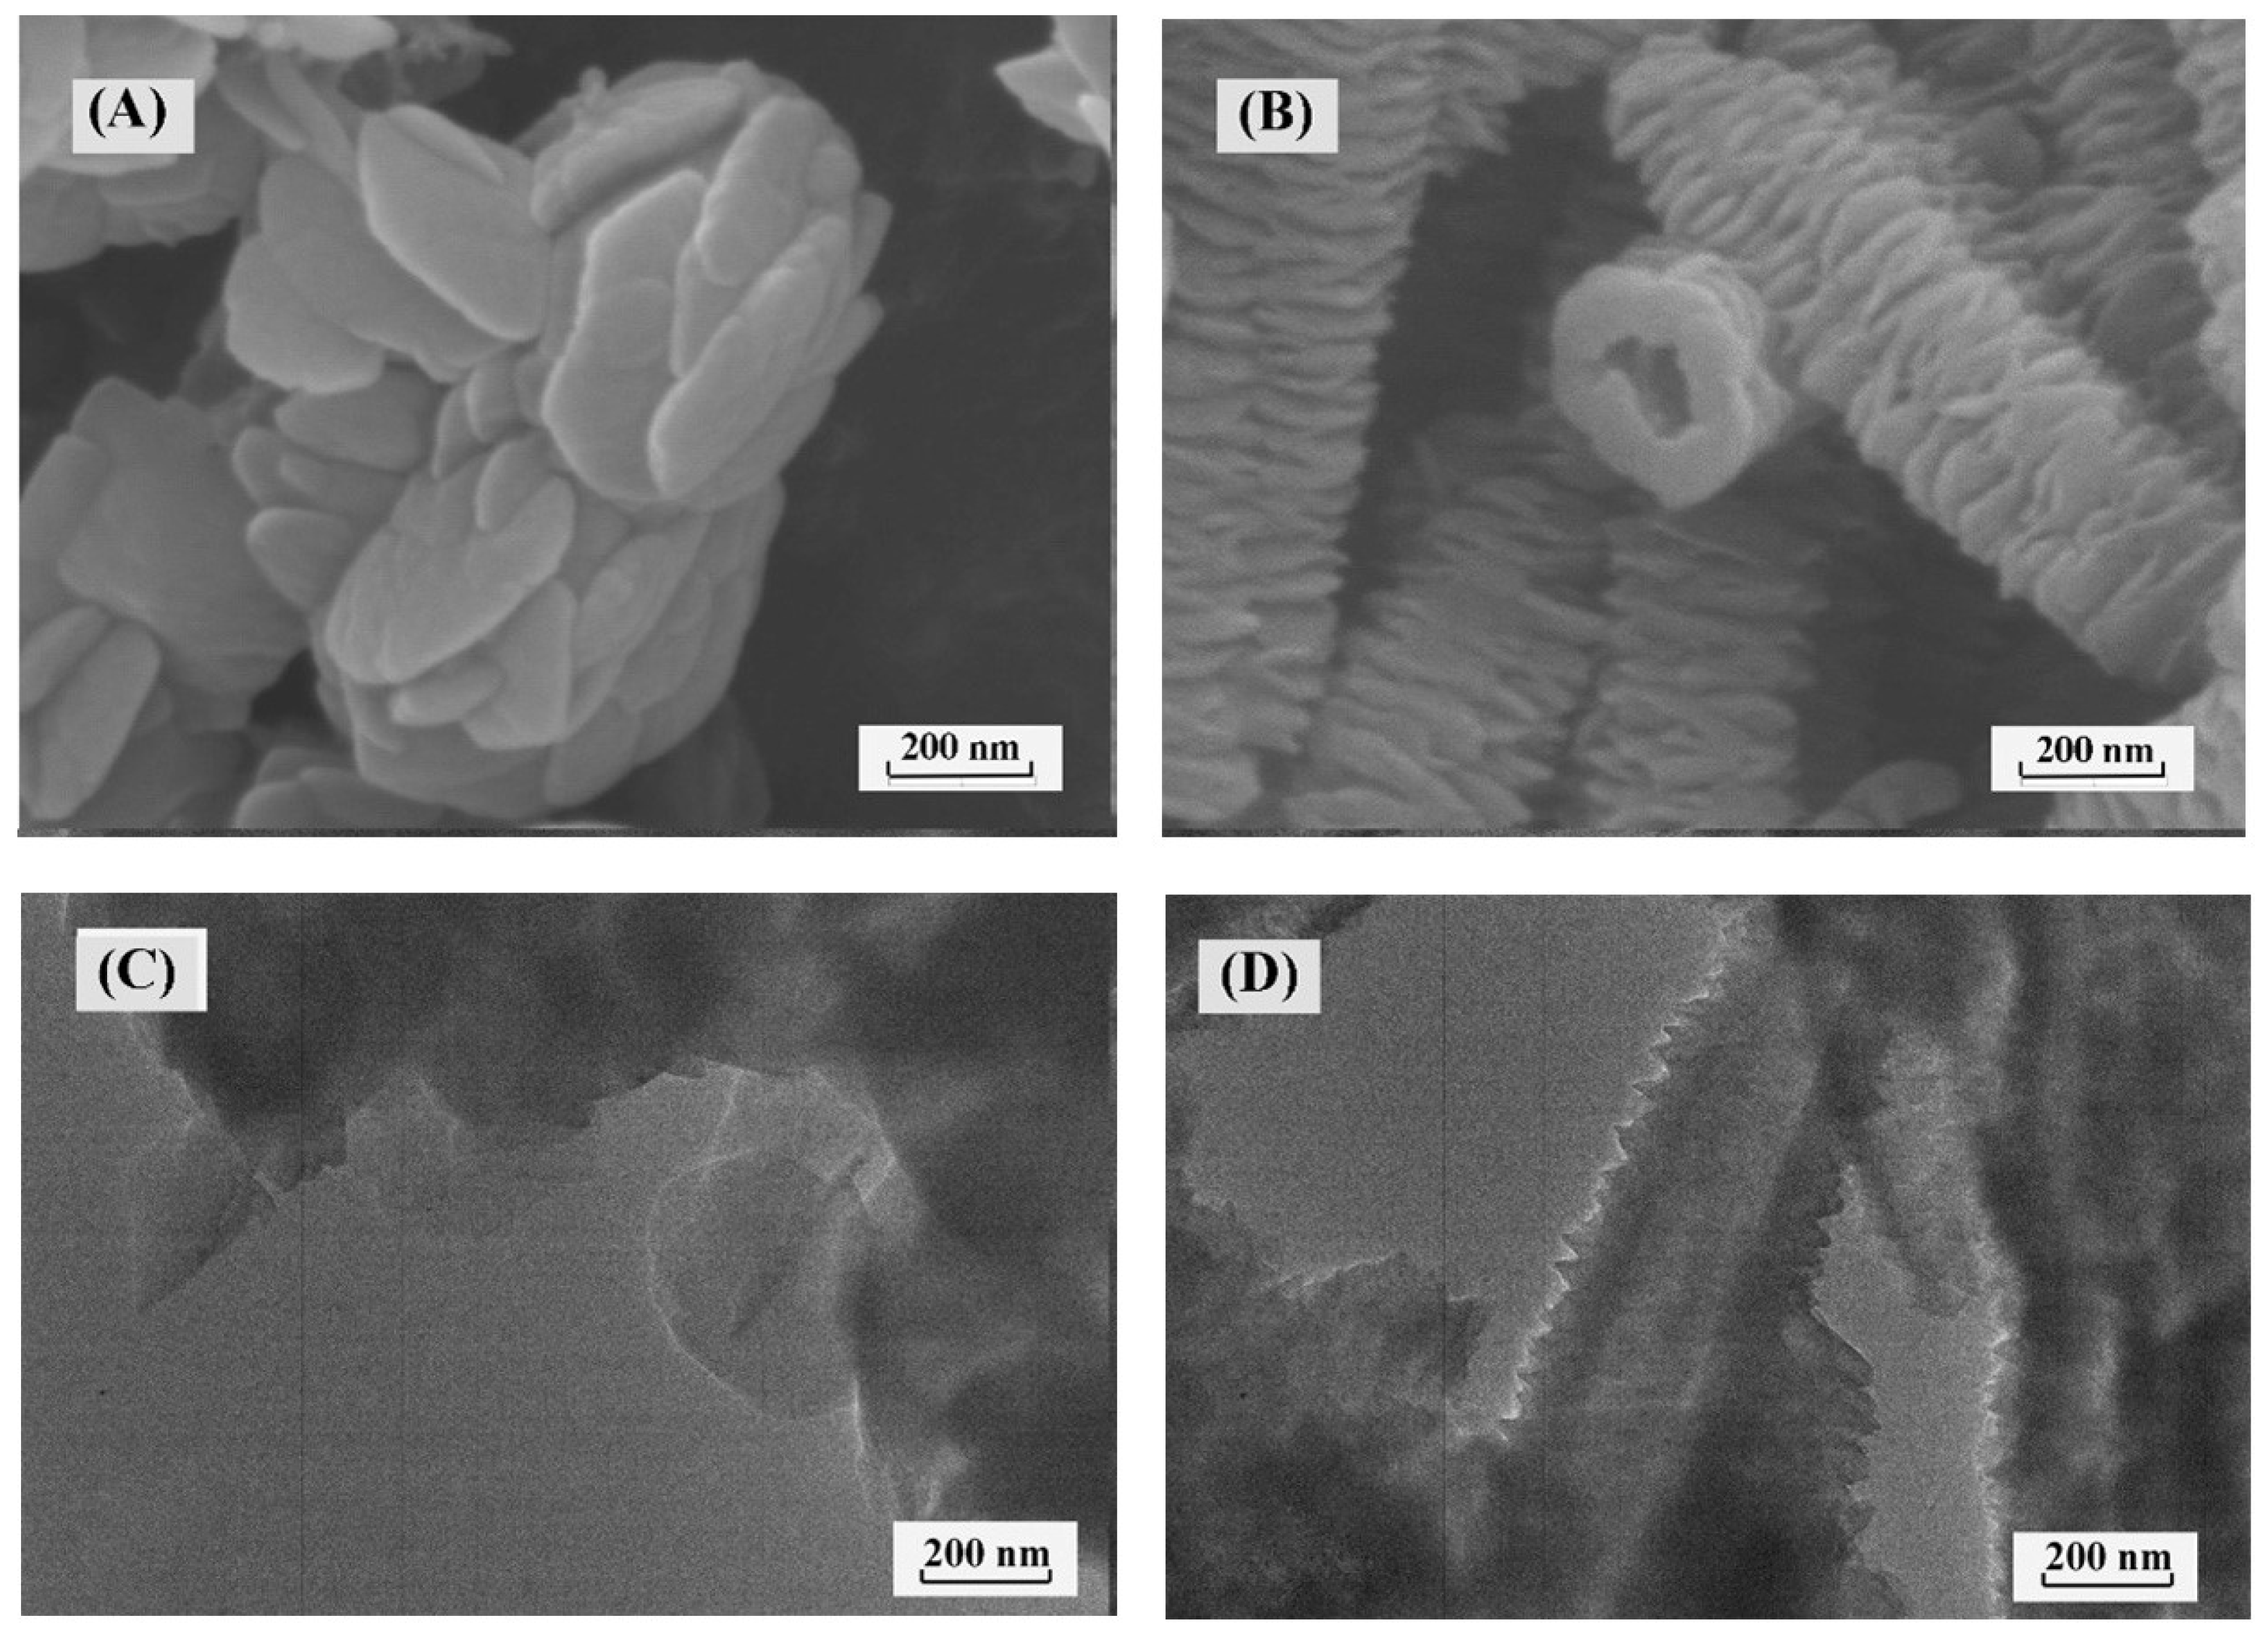
SEM and TEM images showed that PyT-1 exhibited a randomly distributed nanosheet morphology with an average diameter of 200 nm (
Figure 3A,C and
Figure S2), while PyT-2 exhibited a distinct tubular morphology, which was an ordered stacking with a nanosheet structure observed from the periphery (
Figure 3B and
Figure S3). TEM images clearly demonstrated the hollow nature and rough surface of the tubes (
Figure 3D).
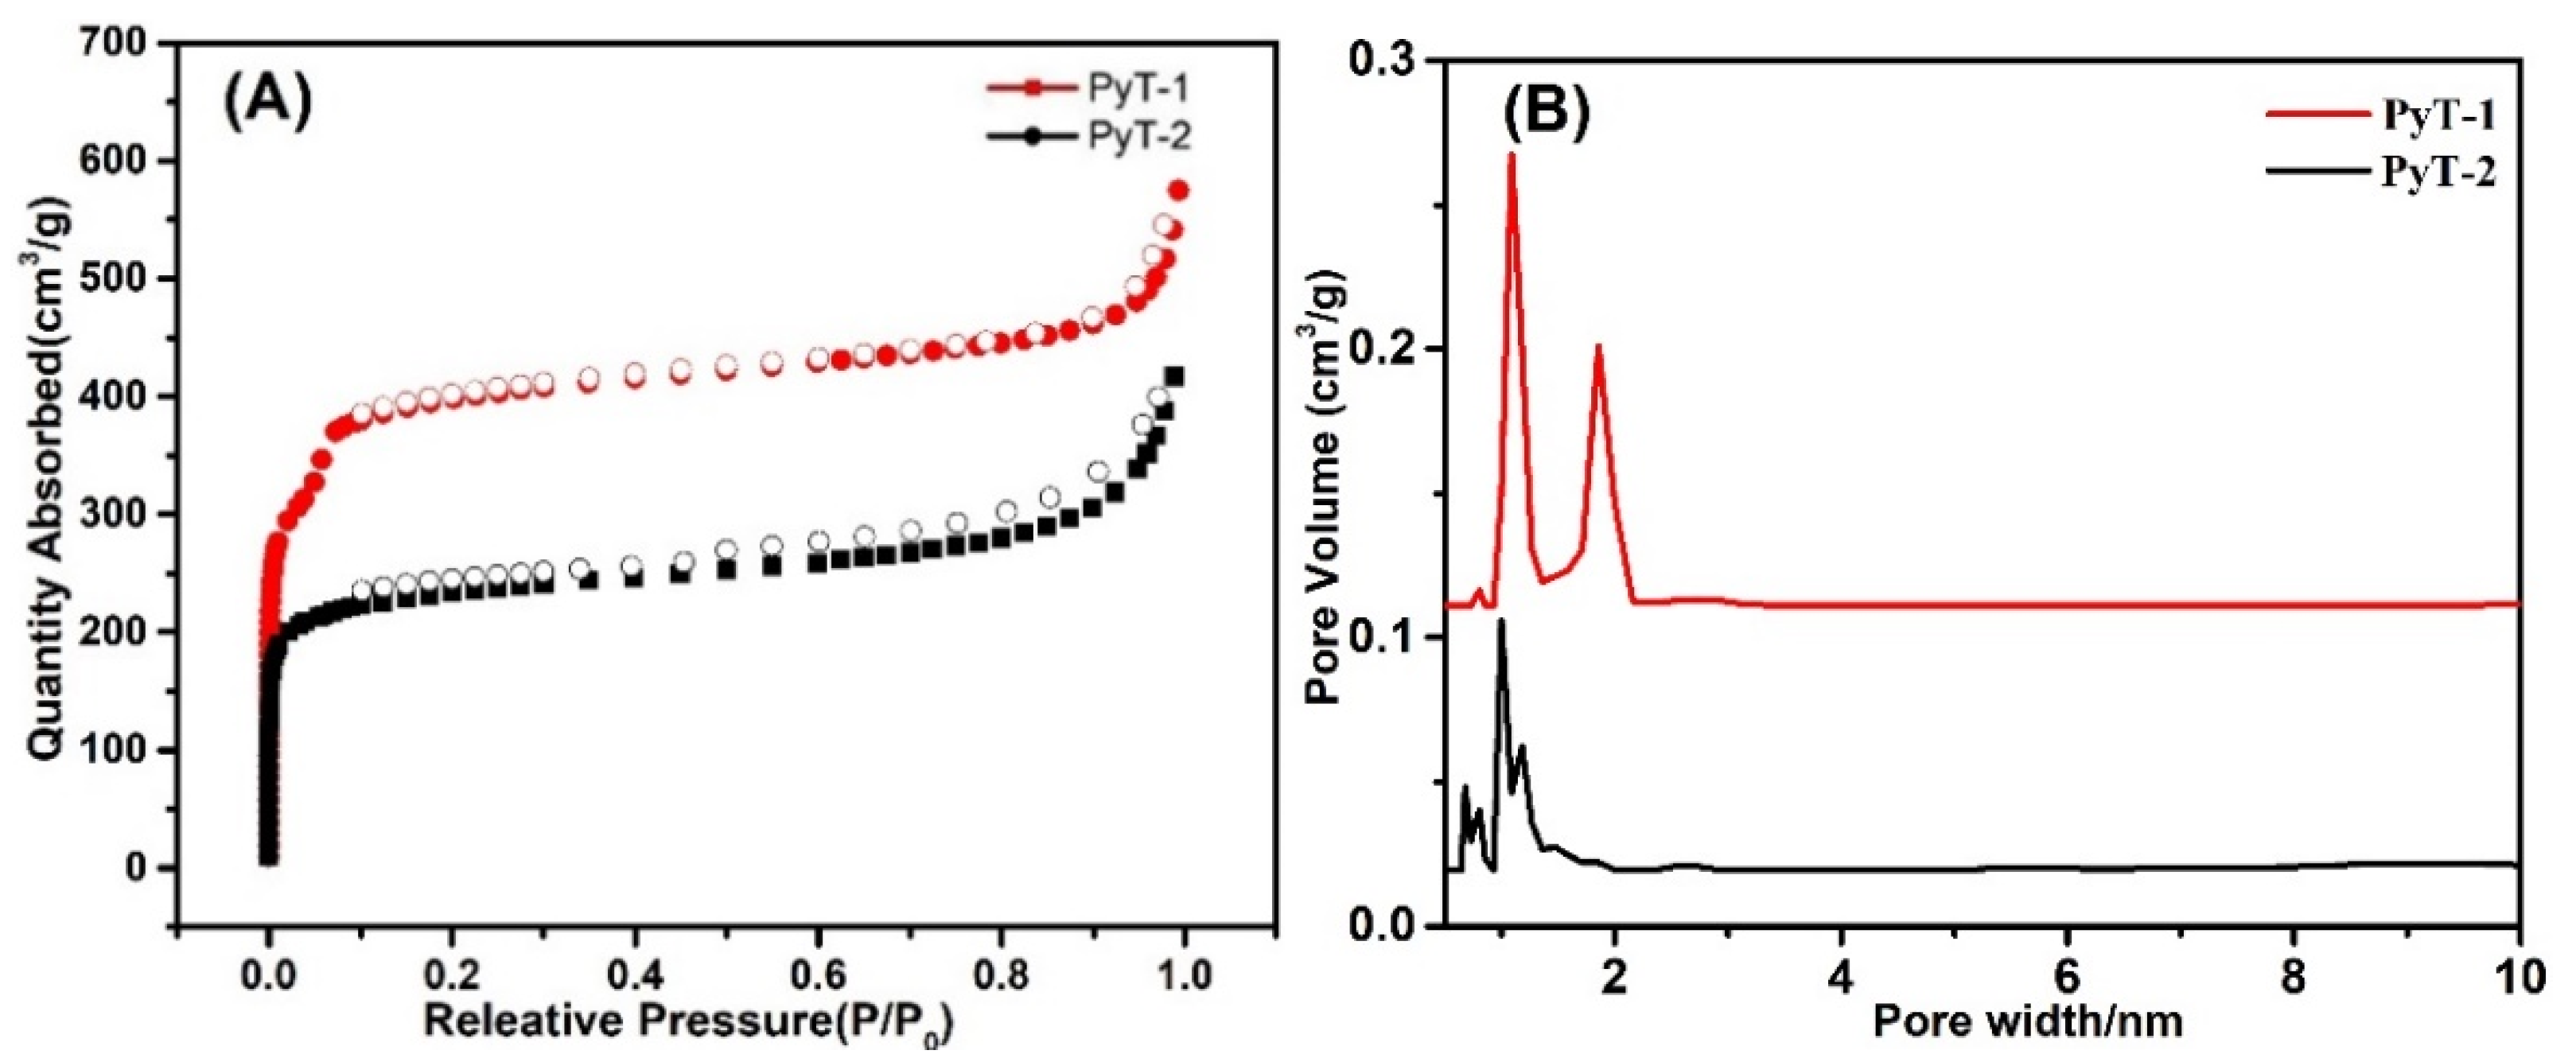
To characterize the porosity of the COFs, an experiment was performed using nitrogen adsorption isotherms. The two COFs exhibited the typical II adsorption isotherms. However, a convex curve appeared in PyT-1 at a relatively lower pressure of 0.01 < P/P
0 < 0.1 (
Figure 4A), indicating its porosity and a combination of type-I nitrogen sorption isotherm and type-H
2 hysteresis loops. The BET surface area and pore volume of the PyT-1 were remarkably high, achieving 1186.94 m
2 g
−1 and 0.89 cm
3 g
−1, and those values for PyT-2 were 704.96 m
2 g
−1 and 0.65 cm
3 g
−1 (P/P
0 = 0.99), respectively. The pore size of PyT-2 was calculated to be mainly around 0.8 and 1.0 nm by using the non-local density functional theory (NLDFT). Additionally, the pore size of PyT-1 was mainly around 1.09 nm, while some pores were distributed around 2.02 nm (
Figure 4B). The coexistence of micropores and sub-mesopores demonstrated the unique hierarchical porous structure of PyT-1, which contained ink-bottle-shaped pores and showed potential application in adsorption.
Thermogravimetric analysis (TGA) was performed to evaluate the thermal stability of COFs. PyT-1 and PyT-2 were stable before 350 °C. Even at 560 °C, the weight loss of the pristine COFs still remained below 20% (
Figure S4A,B), which showed good thermal stability. The COFs were also stable in organic solvents. We immersed the COF samples in MeOH, cyclohexane (CYH), tetrahydrofuran (THF), N,N-dimethylformamide (DMF), H
2O, 1M HCl, and 1M NaOH solvents for 24 h, and the COFs maintained their chemical structures (
Figure S4C,D).
In order to highlight the iodine adsorption property, we first performed iodine vapor adsorption tests by exposing the COFs to a temperature of 75 °C under ambient pressure. The maximum adsorption capacity
q toward iodine was calculated using Equation (1):
where
q is the adsorption value of iodine (g g
−1), and
m1 and
m2 are the masses of the COFs before and after the uptake of iodine, respectively.
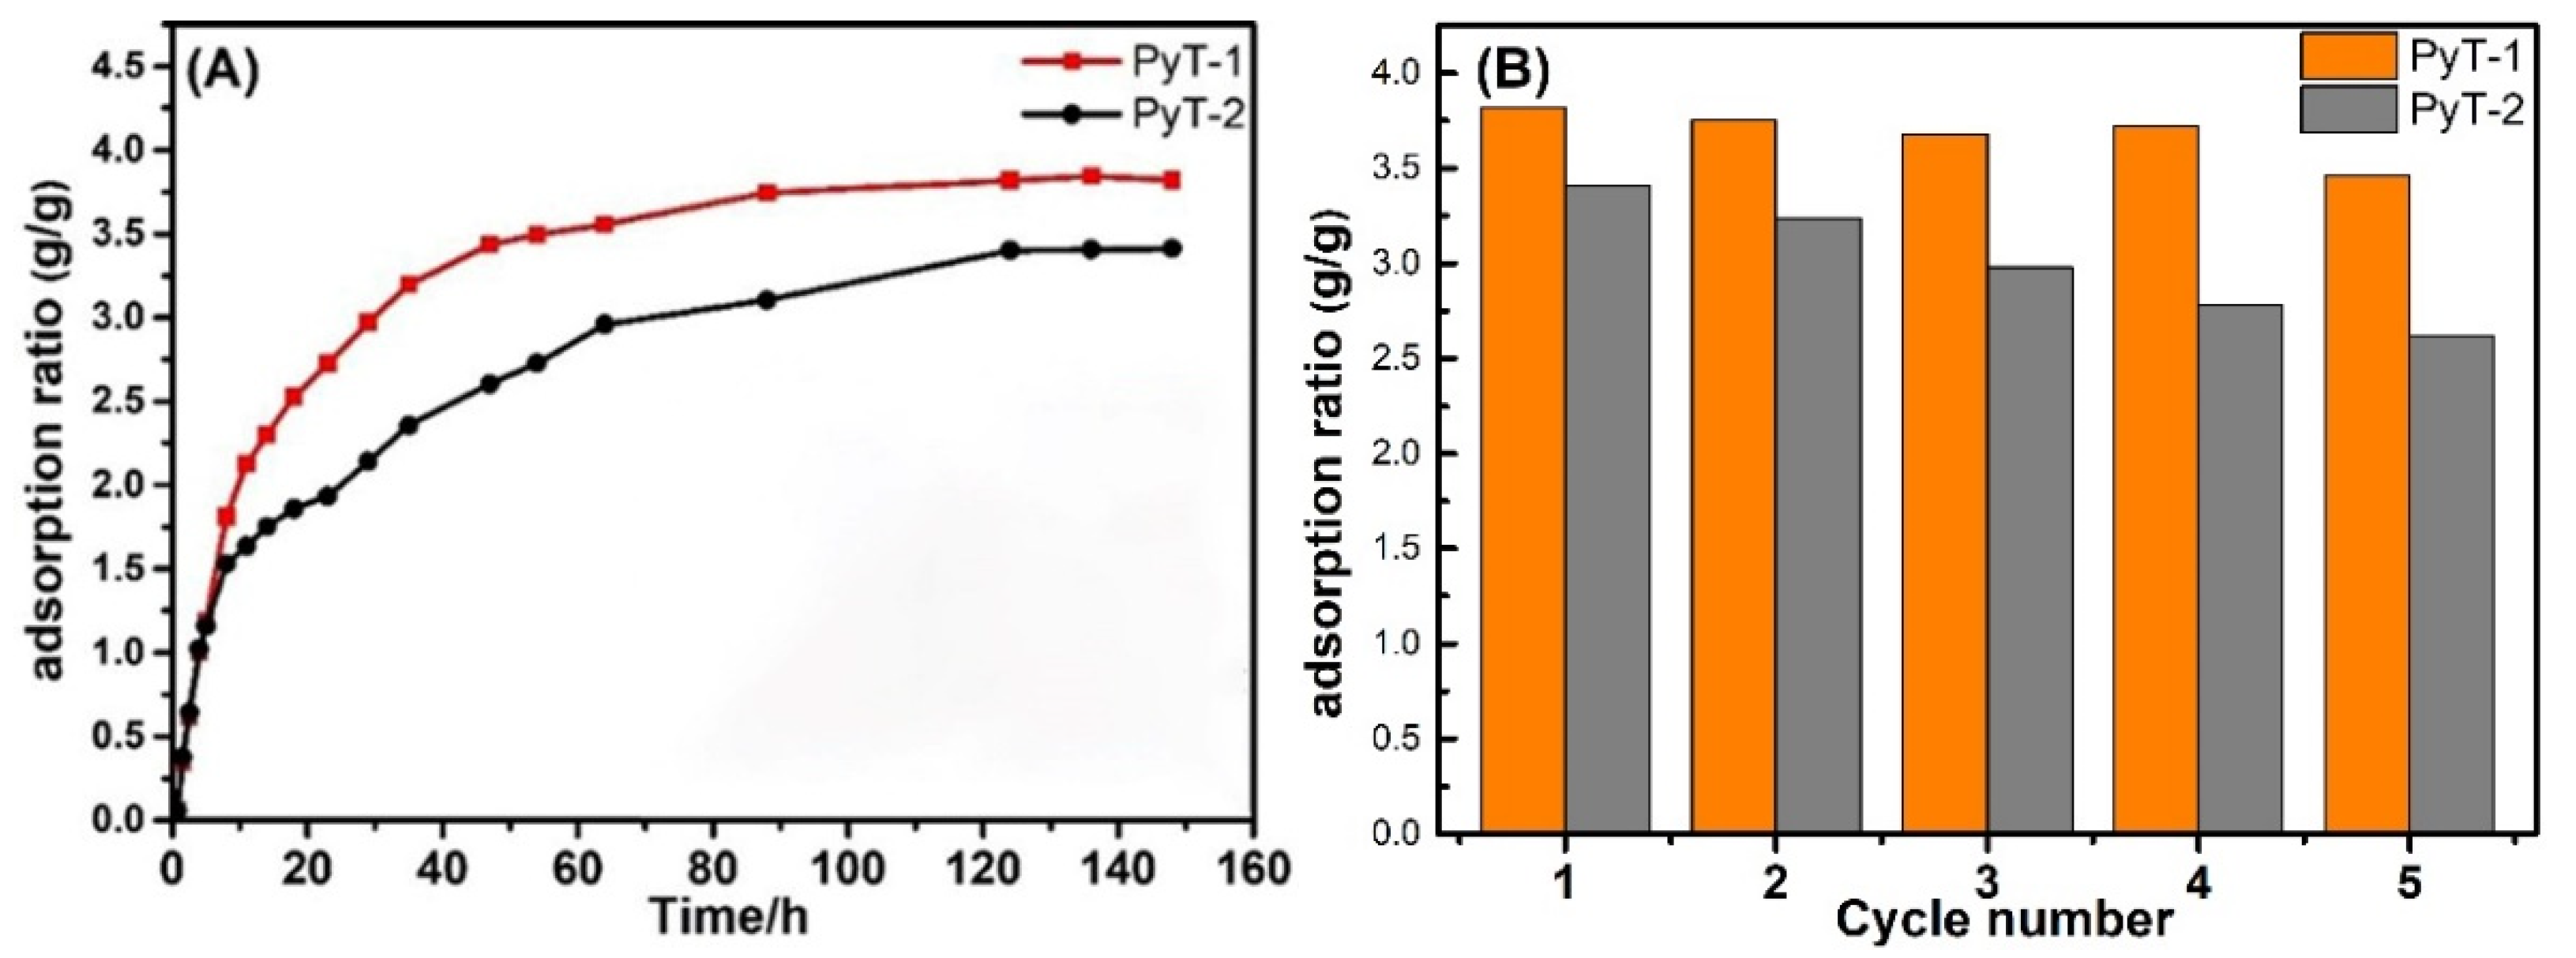
As shown in
Figure 5A, the amount of I
2 adsorption significantly increased within the initial 10 h and then slowly raised afterward. After 90 h, no obvious change was observed, indicating the arrival of adsorption equilibrium. The adsorption limit of the iodine vapor reached 3.82 g g
−1 and 3.41 g g
−1 for PyT-1 and PyT-2, respectively. After being exposed to the air at room temperature for seven days, more than 97% of the iodine molecules were retained in the COFs (
Figure S5). The iodine-laden COFs were rinsed in ethanol to release the adsorbed iodine for reuse in the next cycle. The iodine-captured PyT-1 sample was recyclable through ethanol rinse, retaining a 3.46 g g
−1 adsorption limit after five cycles. Under the same conditions, PyT-2 retained a 2.62 g g
−1 adsorption limit after five cycles. Moreover, the structural stability of PyT-1 and PyT-2 against organic solvents was also demonstrated by the iodine vapor adsorption experiment.
As shown in
Figure S4E,F, the adsorption capacities of the COFs exhibited neglectable variations before and after immersing them in
n-hexane, suggesting their maintained pore structures without degradation.
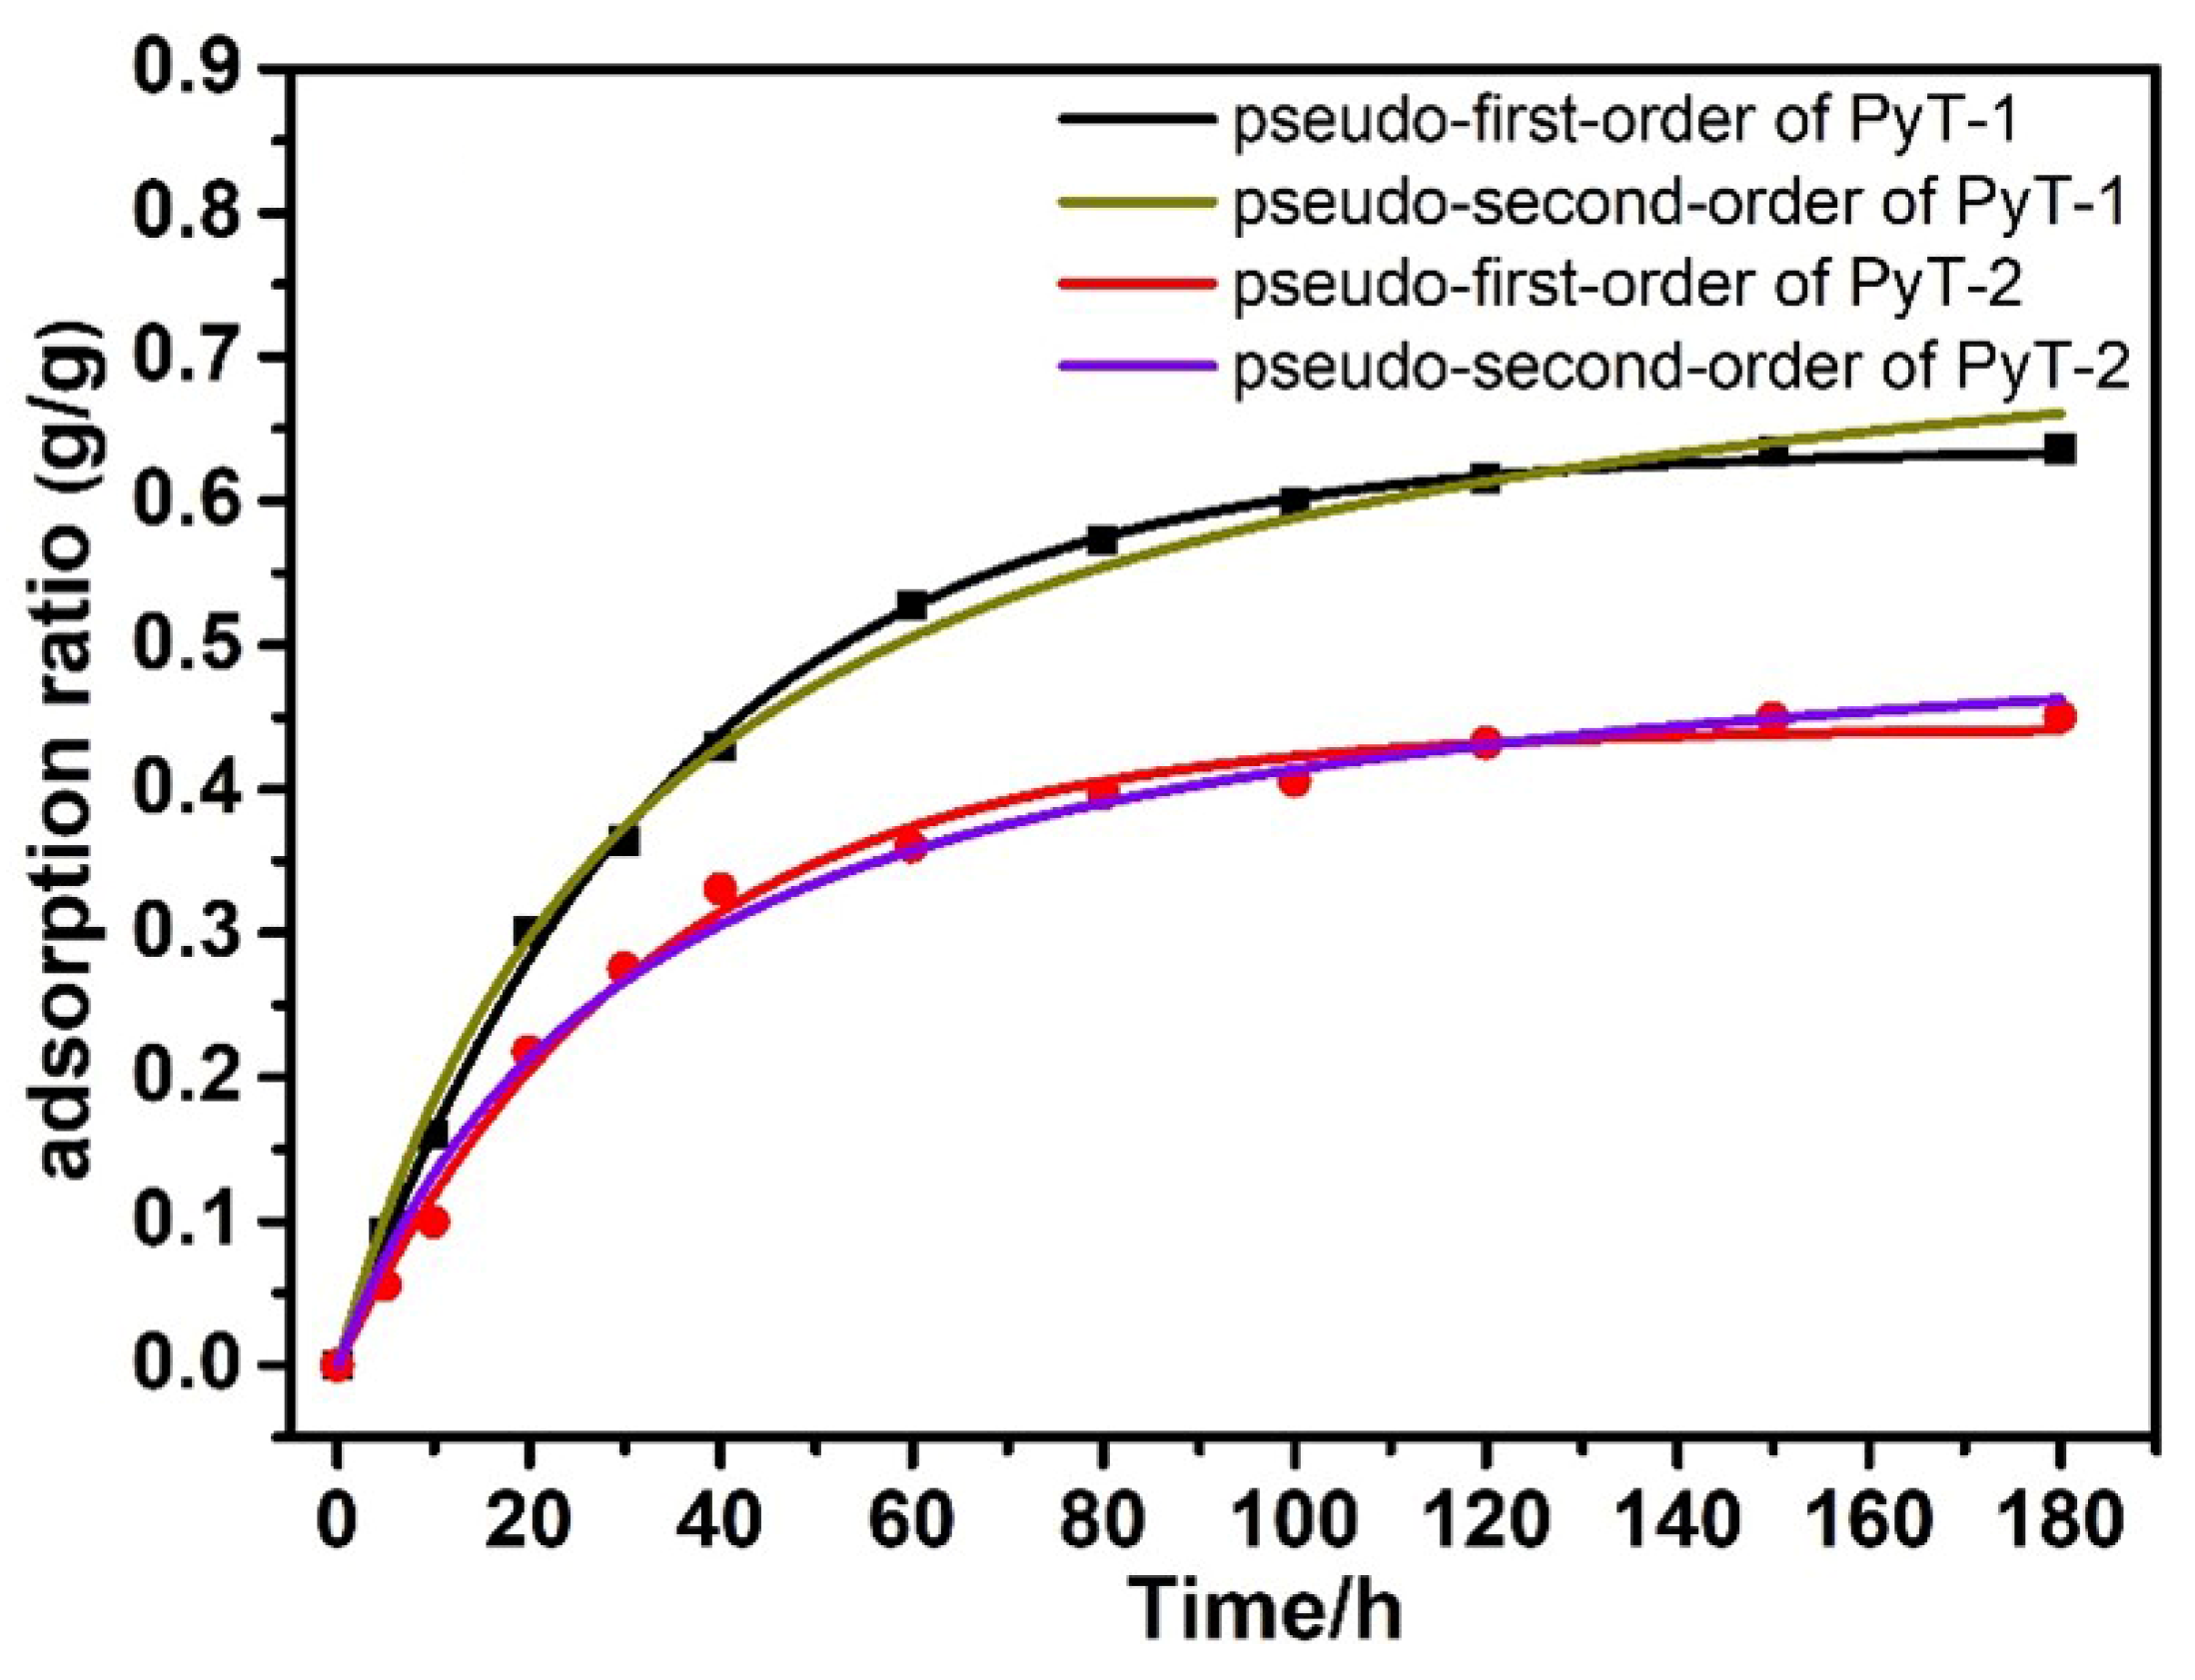
In order to explore the adsorption capacity of the COFs in the organic solution system, we conducted experiments with iodine adsorption solutions. The experiments were performed in
n-hexane at room temperature. Iodine-containing solutions at concentrations of 400 mg L
−1 and 200 mg L
−1 were prepared. The residual iodine concentration was measured at 523 nm with an ultraviolet spectrophotometer (
Figure S7). The adsorption limit
q of PyT-1 reached up to 0.365 g g
−1 in 200 mg L
−1 of iodine solution, and the adsorption limit
q of PyT-2 reached up to 0.315 g g
−1 (
Figure S6). The adsorption limit
q of PyT-1 reached up to 0.635 g g
−1 in 400 mg L
−1 of the iodine solution, and the adsorption limit
q of PyT-2 reached up to 0.445 g g
−1 (
Figure 6). It can be seen that the adsorption value rapidly increased in the first 40 min, and the adsorption equilibriums were reached within 180 min. The pseudo-first-order and pseudo-second-order kinetic models were used to explore the adsorption kinetics. The experimental data fitted well to the pseudo-second-order adsorption kinetics model with a good correlation coefficient (R
2 = 0.998), demonstrating that the adsorption process of PyT-1 to iodine followed the pseudo-second-order kinetic model.


