Figure 1.
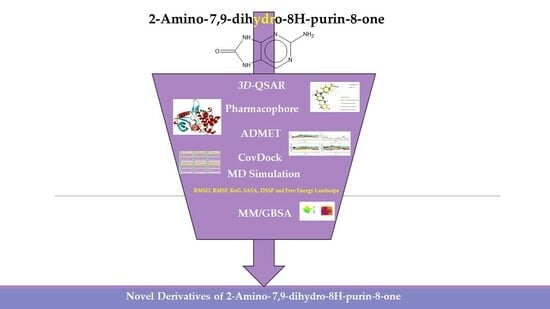
2-Amino-7,9-dihydro-8H-purin-8-one.
Figure 1.
2-Amino-7,9-dihydro-8H-purin-8-one.
Figure 2.
Two-dimensional representations of baricitinib, tofacitinib, and upadacitinib.
Figure 2.
Two-dimensional representations of baricitinib, tofacitinib, and upadacitinib.
Figure 3.
Graphical comparison of predicted versus actual pIC50 values for field-based models in the training and test sets.
Figure 3.
Graphical comparison of predicted versus actual pIC50 values for field-based models in the training and test sets.
Figure 4.
Comparison of predicted versus actual pIC50 values for atom-based models in the training and test sets.
Figure 4.
Comparison of predicted versus actual pIC50 values for atom-based models in the training and test sets.
Figure 5.
Field-based contour maps were employed in conjunction with compound 35 to elucidate the molecular effects. (A) Steric contour maps were generated, where green contours correspond to regions favoring steric interactions, while yellow contours represent regions disfavoring steric interactions. (B) Electrostatic contour maps were constructed, with blue contours signifying regions favoring positively charged substituents and red contours indicating regions favoring negatively charged substituents. (C) Hydrophobic contour maps were analyzed, with yellow contours denoting hydrophobic regions, which were favored, and grey contours indicating hydrophilic regions, which were disfavored. (D) Acceptor contour maps were examined, where magenta contours depicted regions favoring electron acceptor groups and red contours portray regions disfavoring electron acceptor groups. (E) H-bond donor contour maps were investigated, where cyan contours indicate regions favoring electron donor groups and purple contours reveal regions disfavoring electron donor groups.
![Molecules 28 05914 g005]()
Figure 6.
Atom-based contour maps where blue and red colors indicate favored and unfavored biological productivity, respectively. (A) H-bond donor. (B) Hydrophobic/non-polar. (C) Three withdrawing electrons.
Figure 6.
Atom-based contour maps where blue and red colors indicate favored and unfavored biological productivity, respectively. (A) H-bond donor. (B) Hydrophobic/non-polar. (C) Three withdrawing electrons.
Figure 7.
(A) Angles between the features of the DHRRR1 model. (B) Distances between the features of the DHRRR1 model.
Figure 7.
(A) Angles between the features of the DHRRR1 model. (B) Distances between the features of the DHRRR1 model.
Figure 8.
Map** of the regions conducive to the development of biological activity against JAK3/STAT.
Figure 8.
Map** of the regions conducive to the development of biological activity against JAK3/STAT.
Figure 9.
ROC analysis and screen results for the performance evaluation of screening.
Figure 9.
ROC analysis and screen results for the performance evaluation of screening.
Figure 10.
Covalent bonds with Cys909 in protein interaction pocket.
Figure 10.
Covalent bonds with Cys909 in protein interaction pocket.
Figure 11.
Two-dimensional and three-dimensional interactions of the newly designed compounds with JAK3 protein using CovDock analysis. Figure shows the docking analyses for the new compounds, D1 to D5, which favor (A–E), respectively. (F) favors Tofacitinib, which is FDA-approved.
Figure 11.
Two-dimensional and three-dimensional interactions of the newly designed compounds with JAK3 protein using CovDock analysis. Figure shows the docking analyses for the new compounds, D1 to D5, which favor (A–E), respectively. (F) favors Tofacitinib, which is FDA-approved.
Figure 12.
RMSD, RMSF, SASA and RoG plots of the newly designed compounds.
Figure 12.
RMSD, RMSF, SASA and RoG plots of the newly designed compounds.
Figure 13.
H-bonds plots of the newly designed compounds.
Figure 13.
H-bonds plots of the newly designed compounds.
Figure 14.
Codes used in the DSSP program.
Figure 14.
Codes used in the DSSP program.
Figure 15.
Analysis of the newly designed compounds compared to apoprotein using DSSP.
Figure 15.
Analysis of the newly designed compounds compared to apoprotein using DSSP.
Figure 16.
Free energy landscape of compounds D1 and D2.
Figure 16.
Free energy landscape of compounds D1 and D2.
Figure 17.
Free energy landscape of compounds D3 and D4.
Figure 17.
Free energy landscape of compounds D3 and D4.
Figure 18.
Free energy landscape of compounds D5 and tofacitinib.
Figure 18.
Free energy landscape of compounds D5 and tofacitinib.
Figure 19.
Free energy landscape of all compounds with Tofacitinib drug.
Figure 19.
Free energy landscape of all compounds with Tofacitinib drug.
Figure 20.
(A) Illustration of the significant model features associated with the reference molecule exhibiting the highest pIC50 values (pIC50 = 9.15). (B) Alignment of molecules based on the pharmacophore model.
Figure 20.
(A) Illustration of the significant model features associated with the reference molecule exhibiting the highest pIC50 values (pIC50 = 9.15). (B) Alignment of molecules based on the pharmacophore model.
Table 1.
Partial least squares (PLS) parameters for generating field-based models.
Table 1.
Partial least squares (PLS) parameters for generating field-based models.
| Factors | SD | R2 | R2CV | R2 Scramble | F | p-Value | RMSE | Q2 | Pearson-r |
|---|
| 1 | 0.52 | 0.62 | 0.49 | 0.30 | 42.50 | 0.00 | 0.39 | 0.69 | 0.91 |
| 2 | 0.38 | 0.81 | 0.40 | 0.49 | 53.00 | 0.00 | 0.35 | 0.75 | 0.87 |
| 3 | 0.30 | 0.88 | 0.48 | 0.63 | 59.30 | 0.00 | 0.30 | 0.81 | 0.91 |
| 4 | 0.24 | 0.93 | 0.51 | 0.73 | 78.50 | 0.00 | 0.25 | 0.87 | 0.94 |
Table 2.
Data for field-based fractions.
Table 2.
Data for field-based fractions.
| Factors | Steric | Electrostatic | Hydrophobic | H-Bond Acceptor | H-Bond Donor |
|---|
| 1 | 0.579 | 0.071 | 0.161 | 0.131 | 0.059 |
| 2 | 0.514 | 0.078 | 0.22 | 0.155 | 0.034 |
| 3 | 0.491 | 0.087 | 0.213 | 0.182 | 0.028 |
| 4 | 0.47 | 0.092 | 0.206 | 0.203 | 0.029 |
Table 3.
PLS parameters for generating atom-based models.
Table 3.
PLS parameters for generating atom-based models.
| Factors | SD | R2 | R2CV | R2 Scramble | Stability | F | p-Value | RMSE | Q2 | Pearson-r |
|---|
| 1 | 0.50 | 0.65 | 0.51 | 0.38 | 0.95 | 48.70 | 0.00 | 0.34 | 0.77 | 0.94 |
| 2 | 0.33 | 0.86 | 0.51 | 0.53 | 0.79 | 74.30 | 0.00 | 0.40 | 0.67 | 0.86 |
| 3 | 0.28 | 0.90 | 0.51 | 0.68 | 0.74 | 71.10 | 0.00 | 0.31 | 0.80 | 0.91 |
| 4 | 0.23 | 0.94 | 0.47 | 0.78 | 0.61 | 85.30 | 0.00 | 0.26 | 0.86 | 0.93 |
Table 4.
Data for atom-based fractions.
Table 4.
Data for atom-based fractions.
| Factors | H-Bond Donor | Hydrophobic/Non-Polar | Electron Withdrawal |
|---|
| 1 | 0.042 | 0.753 | 0.205 |
| 2 | 0.018 | 0.813 | 0.169 |
| 3 | 0.02 | 0.818 | 0.162 |
| 4 | 0.029 | 0.804 | 0.167 |
Table 5.
PHASE-generated numerous pharmacophore theories.
Table 5.
PHASE-generated numerous pharmacophore theories.
| Model | Survival | Site | Vector | Volume | Selectivity | Num-Matched | Inactive | Adjusted | Sites | PhaseHypo |
|---|
| DHRRR1 | 5.88 | 0.83 | 0.99 | 0.76 | 2.02 | 19 | 2.27 | 3.61 | 8.85 | 8.55 |
| DHRRR2 | 5.86 | 0.83 | 0.99 | 0.75 | 2.02 | 19 | 2.27 | 3.60 | 8.85 | 8.55 |
| DHRRR3 | 5.86 | 0.82 | 0.99 | 0.76 | 2.02 | 19 | 2.28 | 3.58 | 8.85 | 8.55 |
| DHRRR4 | 5.85 | 0.83 | 0.98 | 0.75 | 2.01 | 19 | 2.28 | 3.57 | 8.85 | 8.55 |
| DHRRR5 | 5.83 | 0.80 | 0.98 | 0.74 | 2.04 | 19 | 2.27 | 3.56 | 8.85 | 8.55 |
| DHRRR6 | 5.83 | 0.80 | 0.98 | 0.74 | 2.03 | 19 | 2.24 | 3.59 | 8.85 | 8.55 |
| DHRRR7 | 5.81 | 0.82 | 0.99 | 0.72 | 2.01 | 19 | 2.21 | 3.60 | 8.85 | 8.55 |
| DHRRR8 | 5.80 | 0.80 | 0.97 | 0.72 | 2.02 | 19 | 2.14 | 3.66 | 8.85 | 8.55 |
| DHRRR9 | 5.76 | 0.82 | 0.97 | 0.69 | 2.01 | 19 | 2.09 | 3.67 | 8.85 | 8.55 |
| DHRR10 | 5.37 | 0.83 | 0.99 | 0.76 | 1.51 | 19 | 2.22 | 3.14 | 8.85 | 8.55 |
| DRRR11 | 5.34 | 0.93 | 0.99 | 0.80 | 1.34 | 19 | 2.23 | 3.11 | 8.85 | 8.55 |
| DHRR1 | 5.33 | 0.81 | 0.99 | 0.75 | 1.50 | 19 | 2.26 | 3.07 | 8.85 | 8.55 |
| DHRR2 | 5.34 | 0.83 | 0.98 | 0.75 | 1.50 | 19 | 2.23 | 3.11 | 8.85 | 8.55 |
| DHRR3 | 5.35 | 0.83 | 0.98 | 0.75 | 1.51 | 19 | 2.25 | 3.10 | 8.85 | 8.55 |
| DHRR4 | 5.34 | 0.88 | 1.00 | 0.72 | 1.47 | 19 | 2.16 | 3.18 | 8.85 | 8.55 |
| DHRR5 | 5.35 | 0.87 | 1.00 | 0.74 | 1.46 | 19 | 2.22 | 3.13 | 8.85 | 8.55 |
| HRRR1 | 5.33 | 0.83 | 0.99 | 0.76 | 1.48 | 19 | 2.70 | 2.63 | 8.85 | 8.55 |
| HRRR2 | 5.32 | 0.83 | 0.98 | 0.76 | 1.48 | 19 | 2.76 | 2.57 | 8.85 | 8.55 |
| DHRR5 | 5.34 | 0.81 | 0.99 | 0.76 | 1.49 | 19 | 2.24 | 3.10 | 8.85 | 8.55 |
Table 6.
Metrics for the DDRRR 1 hypothesis evaluation.
Table 6.
Metrics for the DDRRR 1 hypothesis evaluation.
| Hypothesis | DHRRR_1 |
|---|
| PhaseHypo Score | 1.35 |
| EF1% | 2.3 |
| BEDROC160.9 | 0.96 |
| ROC | 0.87 |
| AUAC | 0.74 |
| Ave Outranking Decoys | 4.29 |
| Total Actives | 17 |
| Ranked Actives | 17 |
| Matches | 4 of 5 |
| Excluded Volumes | Yes |
Table 7.
Predicted activity via field-based and atom-based methods.
Table 8.
ADMET analysis of the compounds that were newly designed.
Table 8.
ADMET analysis of the compounds that were newly designed.
| ADMET | Rule | D1 | D2 | D3 | D4 | D5 | D6 | D7 | D8 | D9 | D10 | D11 | D12 | D13 | Tofacitinib |
|---|
| LogS | −4–0.5 | −3.582 | −3.387 | −3.928 | −3.464 | −3.861 | −3.469 | −3.941 | −3.944 | −3.463 | −3.463 | −3.388 | −3.388 | −3.872 | −2.176 |
| LogD | 1–3 | 3.341 | 2.983 | 2.875 | 1.636 | 2.88 | 1.635 | 2.88 | 3.122 | 1.315 | 1.315 | 1.329 | 1.329 | 3.159 | 1.426 |
| LogP | 0–3 | 2.929 | 2.256 | 2.297 | 1.197 | 2.251 | 1.253 | 2.195 | 2.887 | 0.939 | 0.939 | 0.861 | 0.861 | 2.711 | 1.174 |
| HIA | >30 | 0.849 | 0.64 | 0.938 | 0.42 | 0.853 | 0.797 | 0.848 | 0.155 | 0.252 | 0.252 | 0.462 | 0.462 | 0.438 | 0.934 |
| Caco-2 | >−5.15 | −5.084 | −5.132 | −5.284 | −5.829 | −5.186 | −5.824 | −5.294 | −5.17 | −5.751 | −5.751 | −5.744 | −5.744 | −4.964 | −4.655 |
| MDCK | >20 × 10−6 | 1.33 × 10⁻⁵ | 1.07 × 10⁻⁵ | 4.10 × 10⁻⁶ | 7.24 × 10⁻⁶ | 3.84 × 10⁻⁶ | 4.97 × 10⁻⁶ | 4.26 × 10⁻⁶ | 8.33 × 10⁻⁶ | 4.48 × 10⁻⁶ | 4.48 × 10⁻⁶ | 5.18 × 10⁻⁶ | 5.18 × 10⁻⁶ | 5.59 × 10⁻⁶ | 6.3 × 10⁻⁶ |
| BBB | 0–0.3 | 0.041 | 0.027 | 0.012 | 0.107 | 0.011 | 0.073 | 0.01 | 0.009 | 0.35 | 0.35 | 0.073 | 0.073 | 0.037 | |
| VDss | 0.04–20 | 0.561 | 0.589 | 0.484 | 1.51 | 0.433 | 1.363 | 0.481 | 0.38 | 1.012 | 1.012 | 1.226 | 1.226 | 0.655 | |
| 1A2-inh | | Yes | No | No | No | No | No | No | Yes | No | No | No | No | No | Yes |
| 1A2-sub | | Yes | Yes | Yes | Yes | Yes | Yes | Yes | Yes | Yes | Yes | Yes | Yes | Yes | No |
| 2C19-inh | | Yes | Yes | Yes | No | No | No | No | Yes | No | No | No | No | Yes | No |
| 2C19-sub | | No | No | No | No | No | No | No | No | No | No | No | No | No | No |
| 2C9-inh | | Yes | Yes | Yes | Yes | Yes | No | No | Yes | No | No | No | No | No | No |
| 2C9-sub | | No | No | No | No | No | No | No | No | No | No | No | No | No | No |
| 2D6-inh | | No | No | No | No | No | No | No | No | No | No | No | No | No | No |
| 2D6-sub | | No | No | No | No | No | No | No | No | No | No | No | No | No | No |
| 3A4-inh | | Yes | Yes | Yes | Yes | Yes | Yes | Yes | Yes | Yes | Yes | Yes | Yes | Yes | No |
| 3A4-sub | | No | No | Yes | Yes | Yes | Yes | Yes | No | Yes | Yes | Yes | Yes | No | No |
| CL | ≥5 | 7.891 | 7.891 | 8.039 | 5.676 | 5.94 | 7.485 | 7.953 | 7.953 | 5.648 | 6.664 | 7.141 | 6.372 | 6.753 | 8.737 |
| Ames | | No | No | No | No | No | No | No | Yes | No | No | No | No | No | No |
Table 9.
The physicochemical features of the compounds that were newly designed.
Table 9.
The physicochemical features of the compounds that were newly designed.
| P. P | nHA | nHD | TPSA | nRot | nRing | MaxRing | nHet | fChar | nStereo | MW | Lipinski |
|---|
| Rule | 0~12 | 0~7 | 0~14 | 0~11 | 0~6 | 0~6 | 1~15 | −4~4 | ≤2 | 100~600 | Accepted |
| D1 | 8 | 3 | 111.69 | 3 | 4 | 9 | 10 | 0 | 0 | 402.040 |
| D2 | 8 | 3 | 111.69 | 3 | 4 | 9 | 9 | 0 | 0 | 368.080 |
| D3 | 9 | 4 | 127.48 | 2 | 5 | 9 | 10 | 0 | 0 | 393.070 |
| D4 | 11 | 3 | 151.61 | 4 | 5 | 9 | 12 | 0 | 0 | 477.140 |
| D5 | 9 | 4 | 127.48 | 2 | 5 | 9 | 10 | 0 | 0 | 393.070 |
| D6 | 11 | 4 | 154.51 | 4 | 5 | 9 | 12 | 0 | 0 | 465.140 |
| D7 | 9 | 4 | 127.48 | 2 | 5 | 9 | 10 | 0 | 0 | 393.070 |
| D8 | 9 | 3 | 116.62 | 2 | 5 | 9 | 10 | 0 | 0 | 393.070 |
| D9 | 12 | 3 | 156.54 | 4 | 5 | 9 | 13 | 0 | 0 | 466.140 |
| D10 | 12 | 3 | 156.54 | 4 | 5 | 9 | 13 | 0 | 0 | 466.140 |
| D11 | 12 | 4 | 167.4 | 4 | 5 | 9 | 13 | 0 | 0 | 466.140 |
| D12 | 12 | 4 | 167.4 | 4 | 5 | 9 | 13 | 0 | 0 | 466.140 |
| D13 | 8 | 3 | 111.69 | 2 | 4 | 9 | 9 | 0 | 0 | 360.110 |
| Tofacitinib | 7 | 1 | 88.910 | 4 | 18 | 9 | 7 | 0 | 2 | 312.170 | |
Table 10.
The affinity of compounds studied by CovDock.
Table 10.
The affinity of compounds studied by CovDock.
| Compound | D1 | D2 | D3 | D4 | D5 | D6 | D7 | D8 | D9 | D10 | D11 | D12 | D13 | Tofacitinib |
|---|
| Affinity (Kcal/mol) | −9.10 | −9.55 | −9.37 | −9.53 | −9.5 | −5.63 | −6.71 | −7–24 | −6.36 | −4.15 | −7.42 | −6.66 | −8.10 | −7.50 |
Table 11.
Comparative study of delta energy (Kcal/mol) for the newly designed compounds D1–D5 in comparison with tofacitinib using MM/GBSA.
Table 11.
Comparative study of delta energy (Kcal/mol) for the newly designed compounds D1–D5 in comparison with tofacitinib using MM/GBSA.
| Delta Energy (Kcal/mol) | D1 | D2 | D3 | D4 | D5 | Tofacitinib |
|---|
| ΔVDWAALS | −33.95 | −36.93 | −40.29 | −32.60 | −37.09 | −22.82 |
| ΔEEL | −30.27 | −29.89 | −33.86 | −32.77 | −19.55 | −32.93 |
| ΔEGB | 42.36 | 46.61 | 48.34 | 45.61 | 34.48 | 55.89 |
| ΔESURF | −5.00 | −4.78 | −5.55 | −4.78 | −4.64 | −3.34 |
| ΔGGAS | −64.22 | −66.82 | −74.15 | −65.37 | −56.64 | −55.75 |
| ΔGSOLV | 37.35 | 41.83 | 42.79 | 40.84 | 29.84 | 52.55 |
| ΔTOTAL | −26.87 | −24.99 | −31.37 | −24.54 | −26.80 | −3.20 |
Table 12.
A comparative analysis of the experimental and predicted pIC50 values utilizing 3D-QSAR, field-based, and atom-based models.


 ,
, 


