2.1. Coordination of Palladium on MWCNT/LS and Electrochemical Formation of MWCNT/LS/NPd
The coordination bonds between transition metal ions and o-quinone molecules have already been demonstrated [
58,
59,
60,
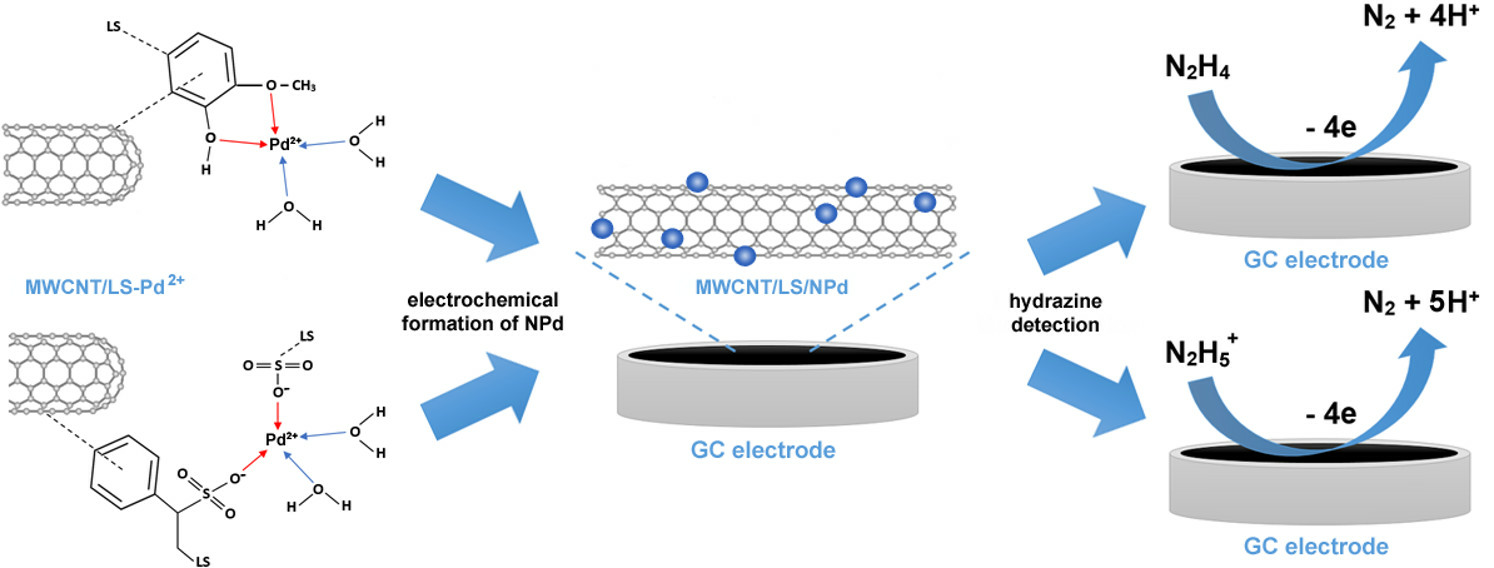
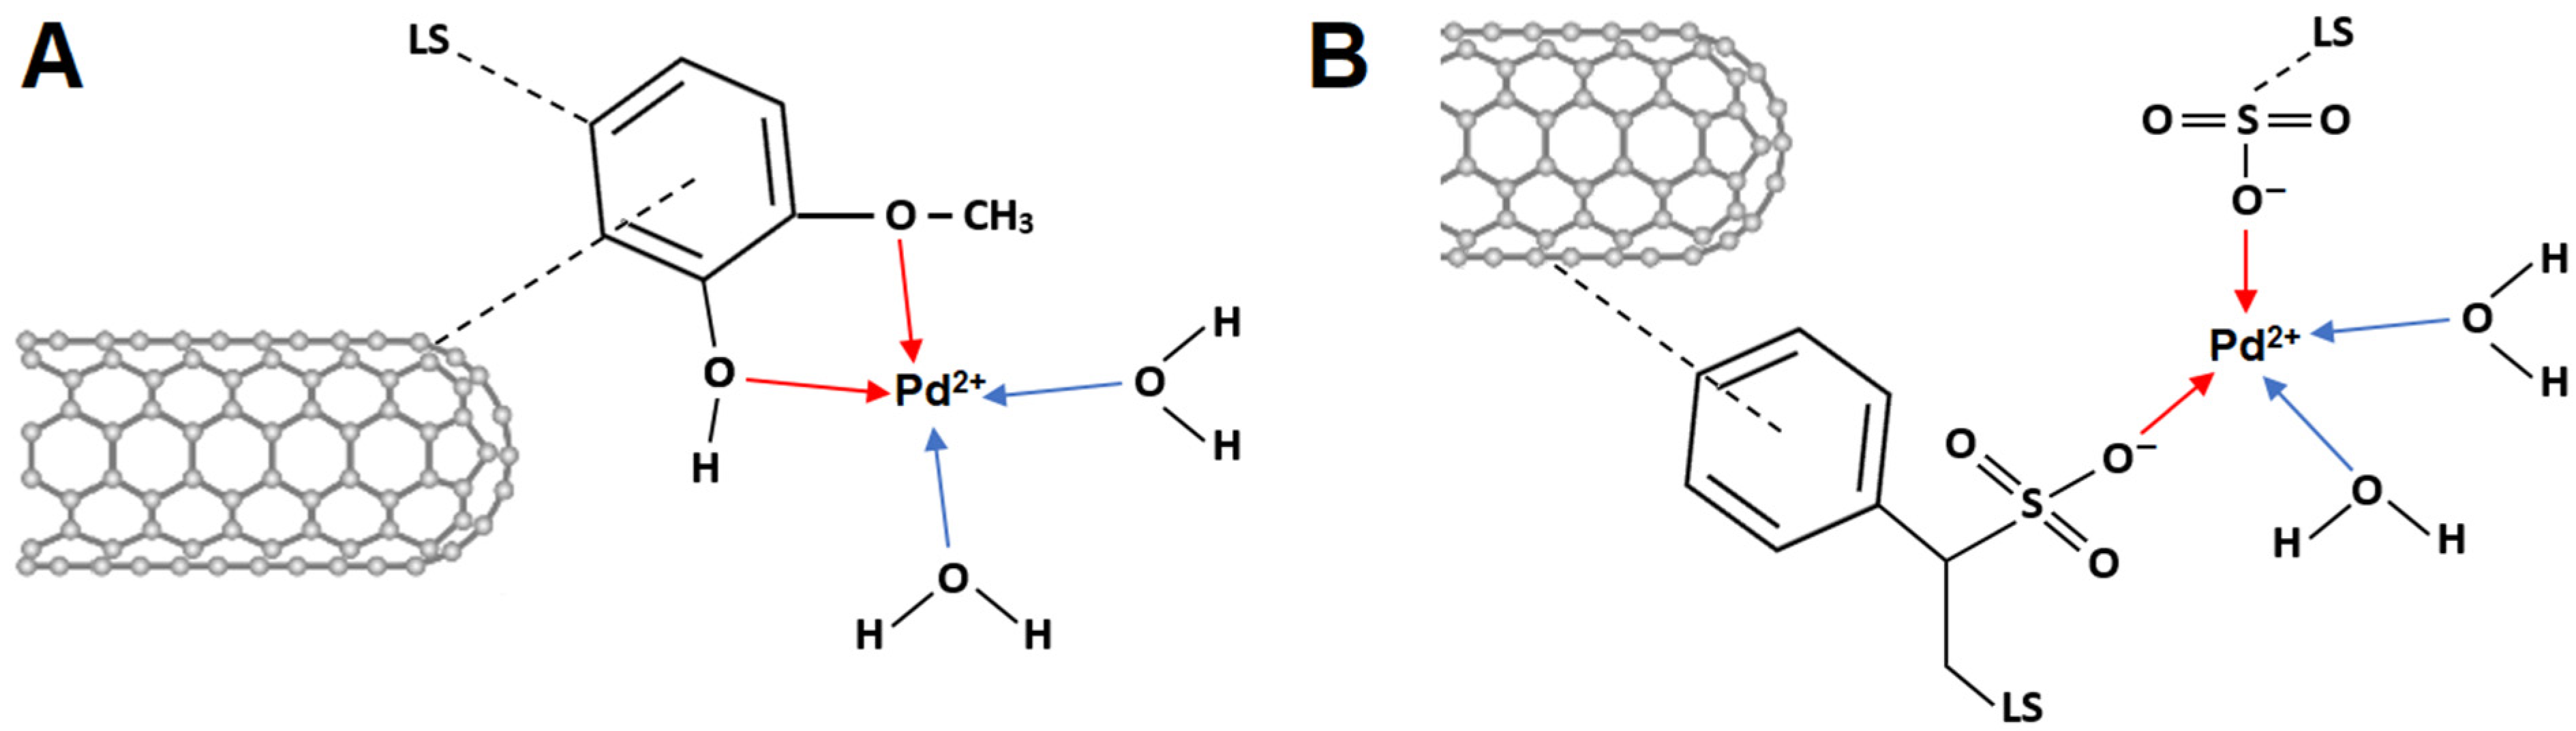
61]. Consequently, LS can act as a potential matrix for the pre-concentration of metal cations due to its multifunctional structure, containing various functional groups (phenolic, quinone, carboxyl, sulfonic, and hydroxyl). Furthermore, chemical interactions can be established between LS and Pd
2+ ions, and the possible interaction mechanism is presented in
Scheme 1. When the MWCNT/LS hybrid is mixed with the PdCl
2 solution for the intended duration, coordination bonds are formed, and Pd
2+ accumulates on the surface of the MWCNT/LS.
After immobilising Pd
2+, the resulting MWCNT/LS-Pd
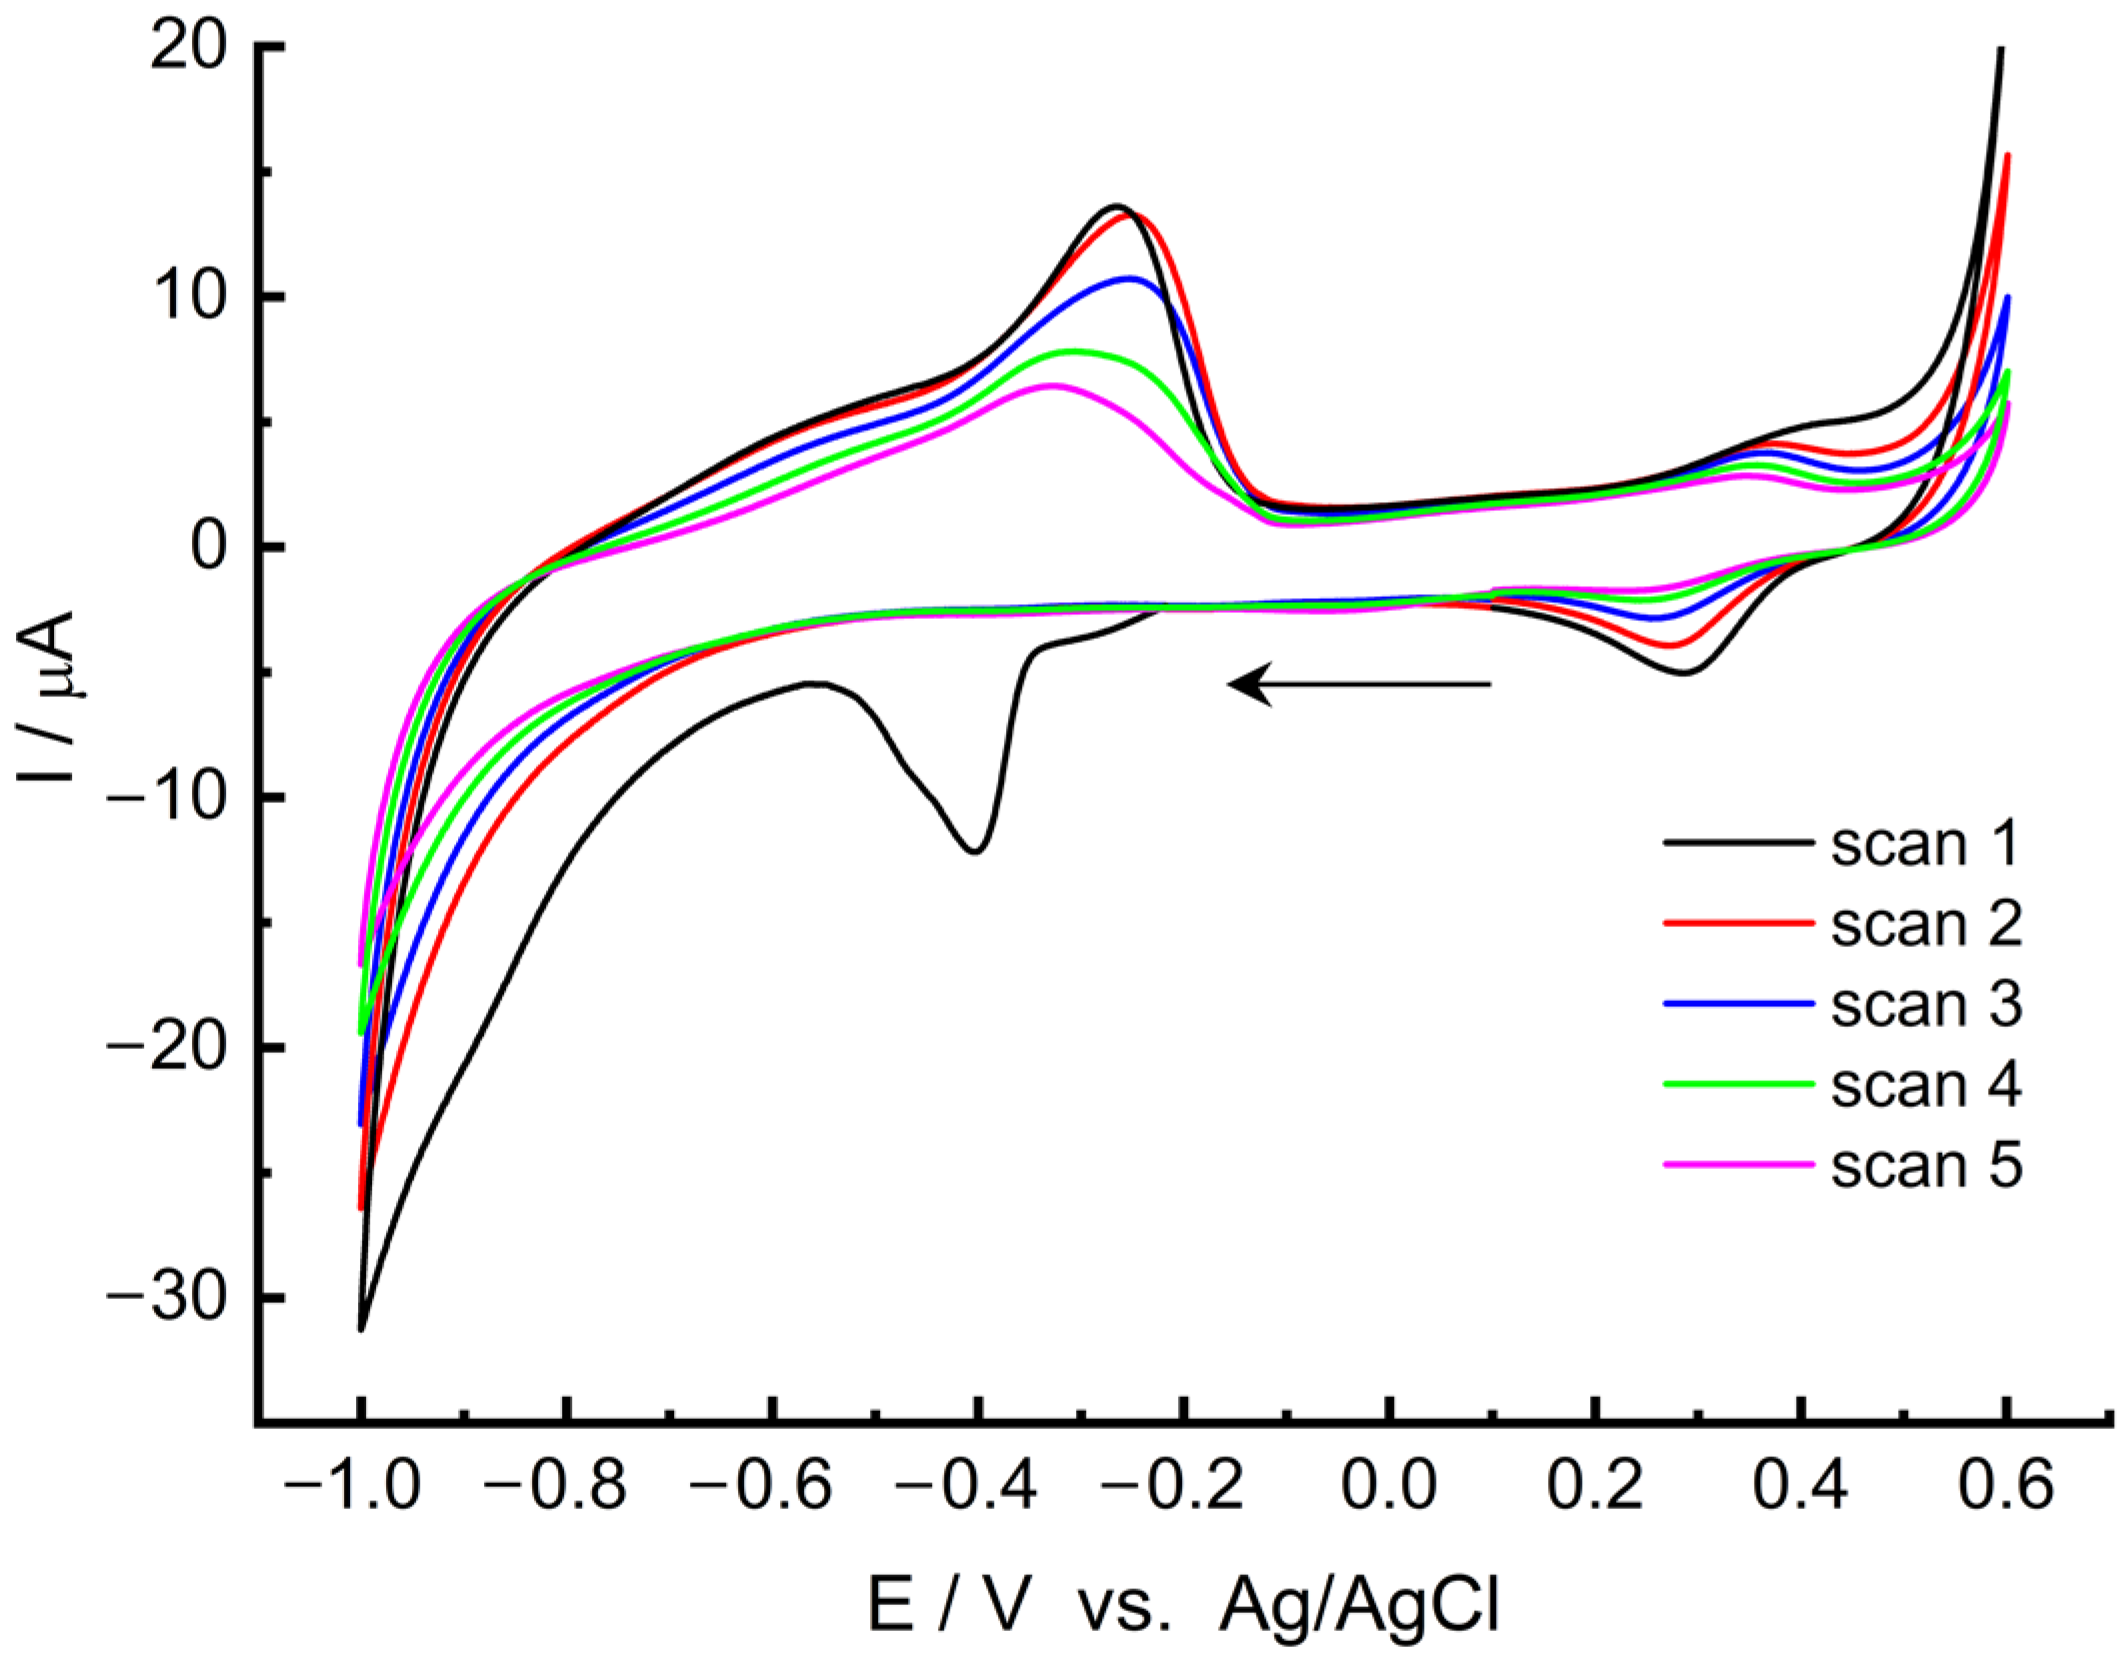
2+ composite was deposited onto the GC surface. Afterwards, the modified electrode was transferred to a 0.1 KCl electrolyte (pH ~ 7) for CV measurements (
Figure 1). In the initial scan, recorded from the open circuit potential (OCP) −0.21 V towards the negative potential, a well-defined cathode peak is visible at around −0.40 V. This peak is irreversible and vanishes in subsequent scans. The emergence of the peak can be attributed to the reduction of Pd
2+ accumulated in the MWCNT/LS matrix, leading to the formation of palladium in a metallic form (Equation (1)). Prior studies by Velmurugan et al. [
61,
62] and Wen et al. [
63] also acknowledged a comparable reduction peak of Pd
2+.
Further scans reveal a standard electrochemical behaviour of metallic palladium. Hydrogen sorption signals and its accumulation processes were detected in the negative potential range (spanning from −0.6 V to −1.0 V and from −1.0 V to −0.1 V), which are specific to metallic palladium [
36,
63]. Furthermore, redox couples gradually disappear with an anodic peak at around 0.35 V and a cathodic peak at around 0.27 V, indicating the formation of palladium oxides and their subsequent reduction [
36,
63,
64]. During the first five scans, the redox signal current decreases, indicating the gradual stabilization of NPds’ oxidation and reduction processes on the electrode surface. After five cycles, the electrode becomes stable and is fully prepared for further tests. Therefore, the electrode should be scanned five times before each measurement to properly prepare the electrode material for the experiments.
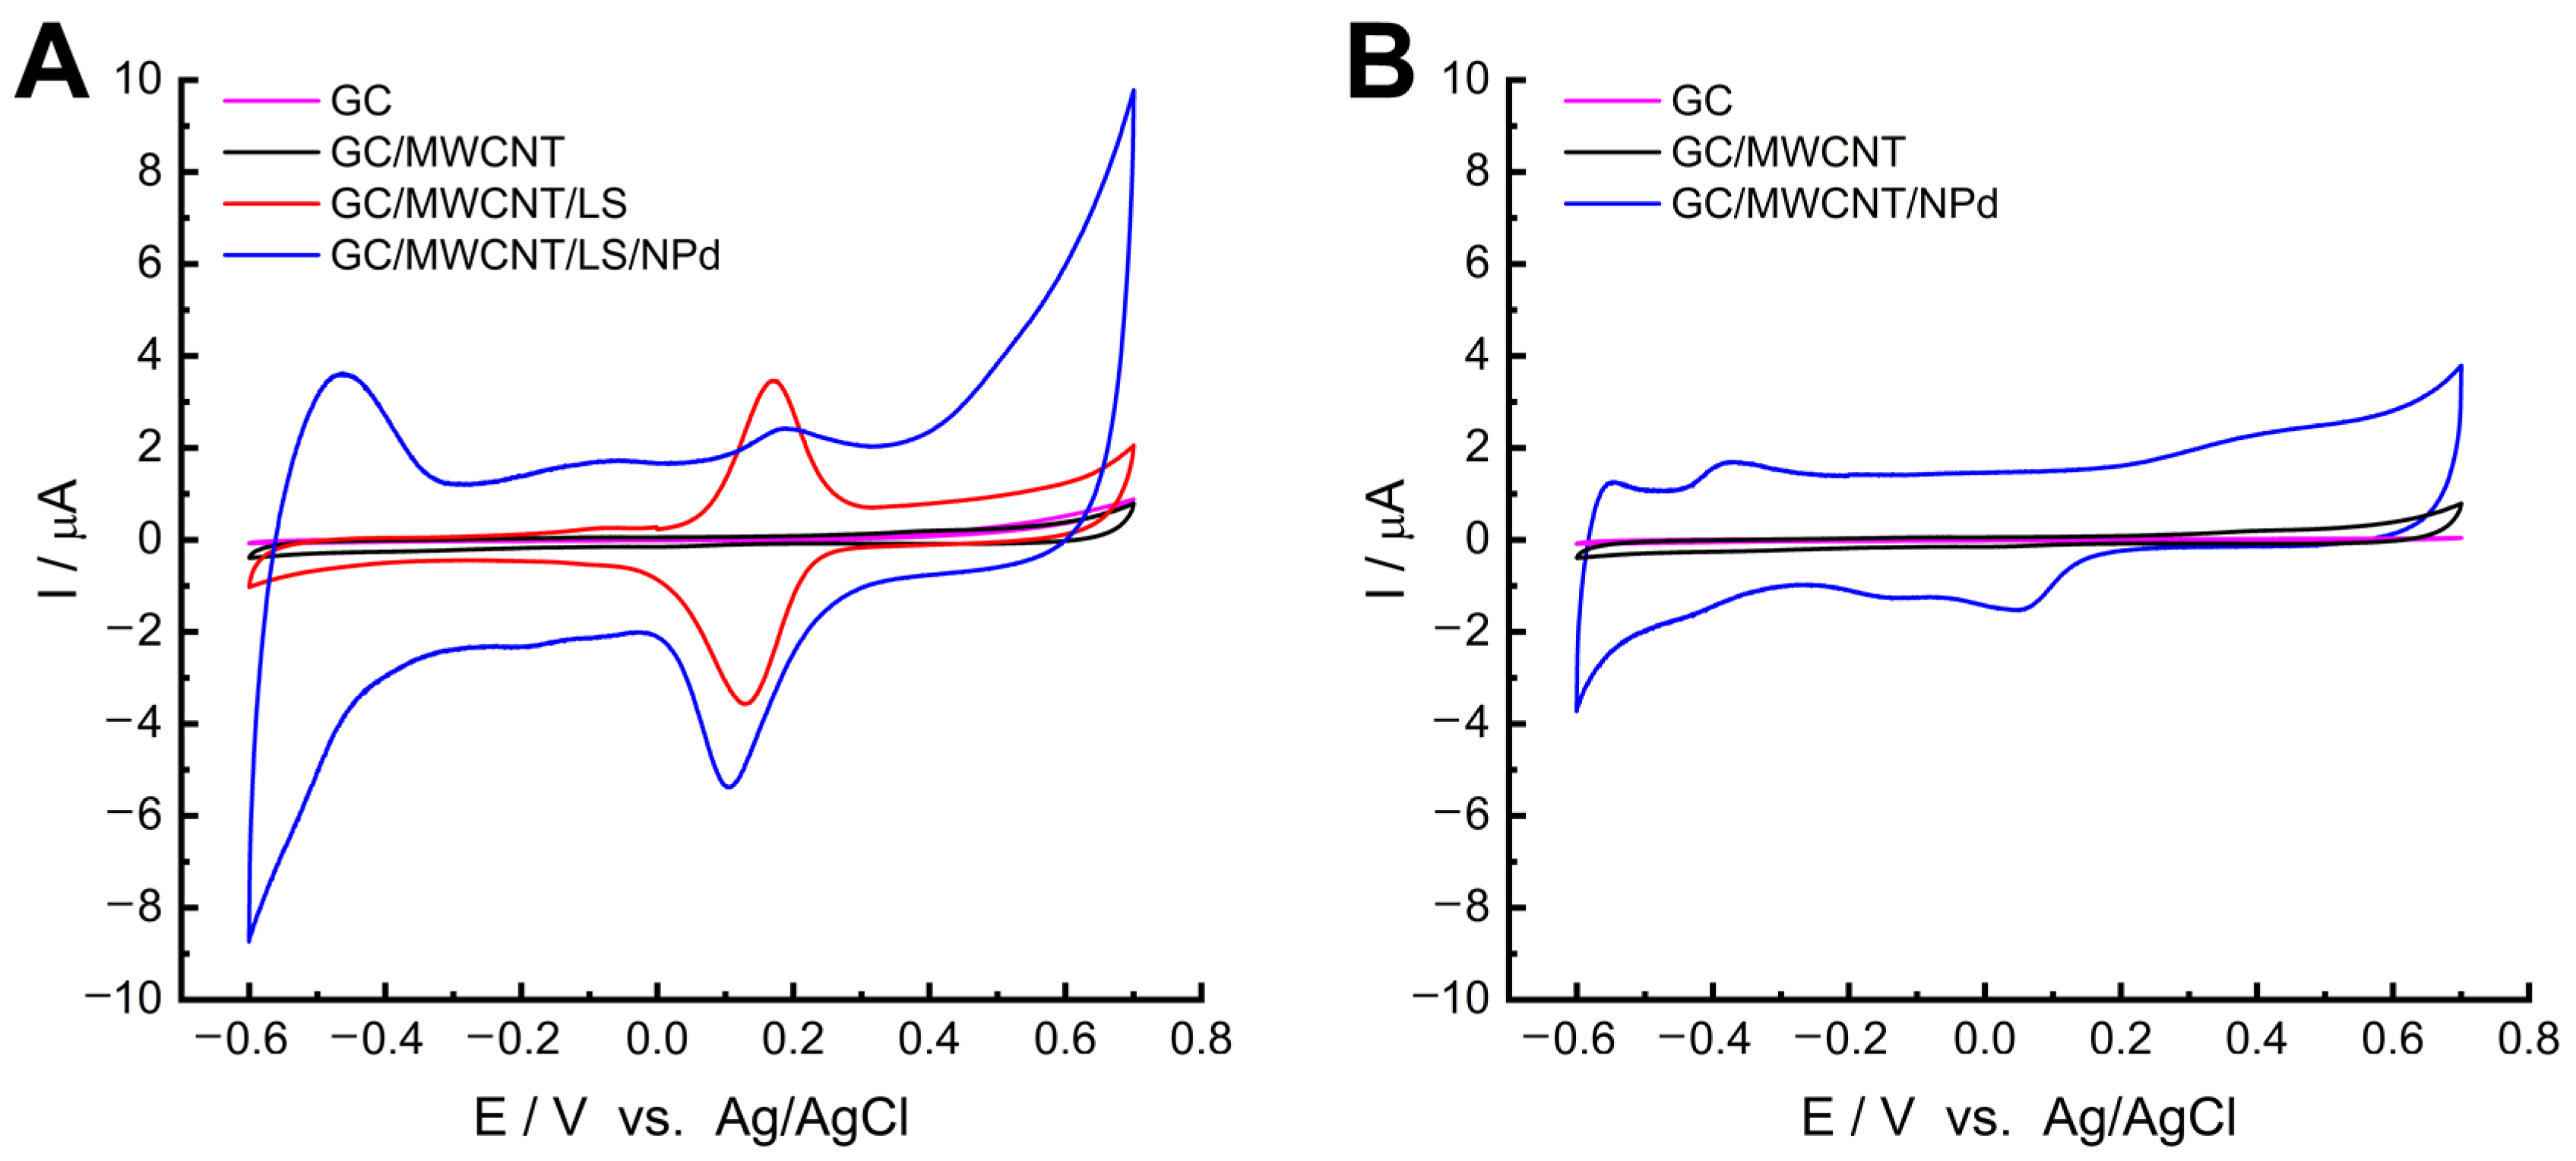
To verify that the LS can improve the accumulation of Pd
2+, we performed a control test for the GC electrode modified by MWCNTs with adsorbed Pd
2+ (GC/MWCNT-Pd
2+). The CVs of GC/MWCNT/LS/NPd and GC/MWCNT/NPd recorded in 0.05 M PB buffer (pH = 7.4) are presented in
Figure 2. Integrating the charge under the redox peaks allows the assessment of the palladium accumulation. The findings indicate that NPds may be deposited on the surface of the pristine MWCNTs, most likely due to the numerous oxygen-containing functional groups present in the structure [
65,
66]. Nonetheless, notably greater peak currents are evident on GC/MWCNT/LS/NPd as opposed to GC/MWCNT/NPd. This outcome can be accredited to the augmented quantity of chelated metal ions. It suggests that the adsorbed LS can enhance the chelating efficiency of MWCNTs to Pd
2+ [
65,
66].
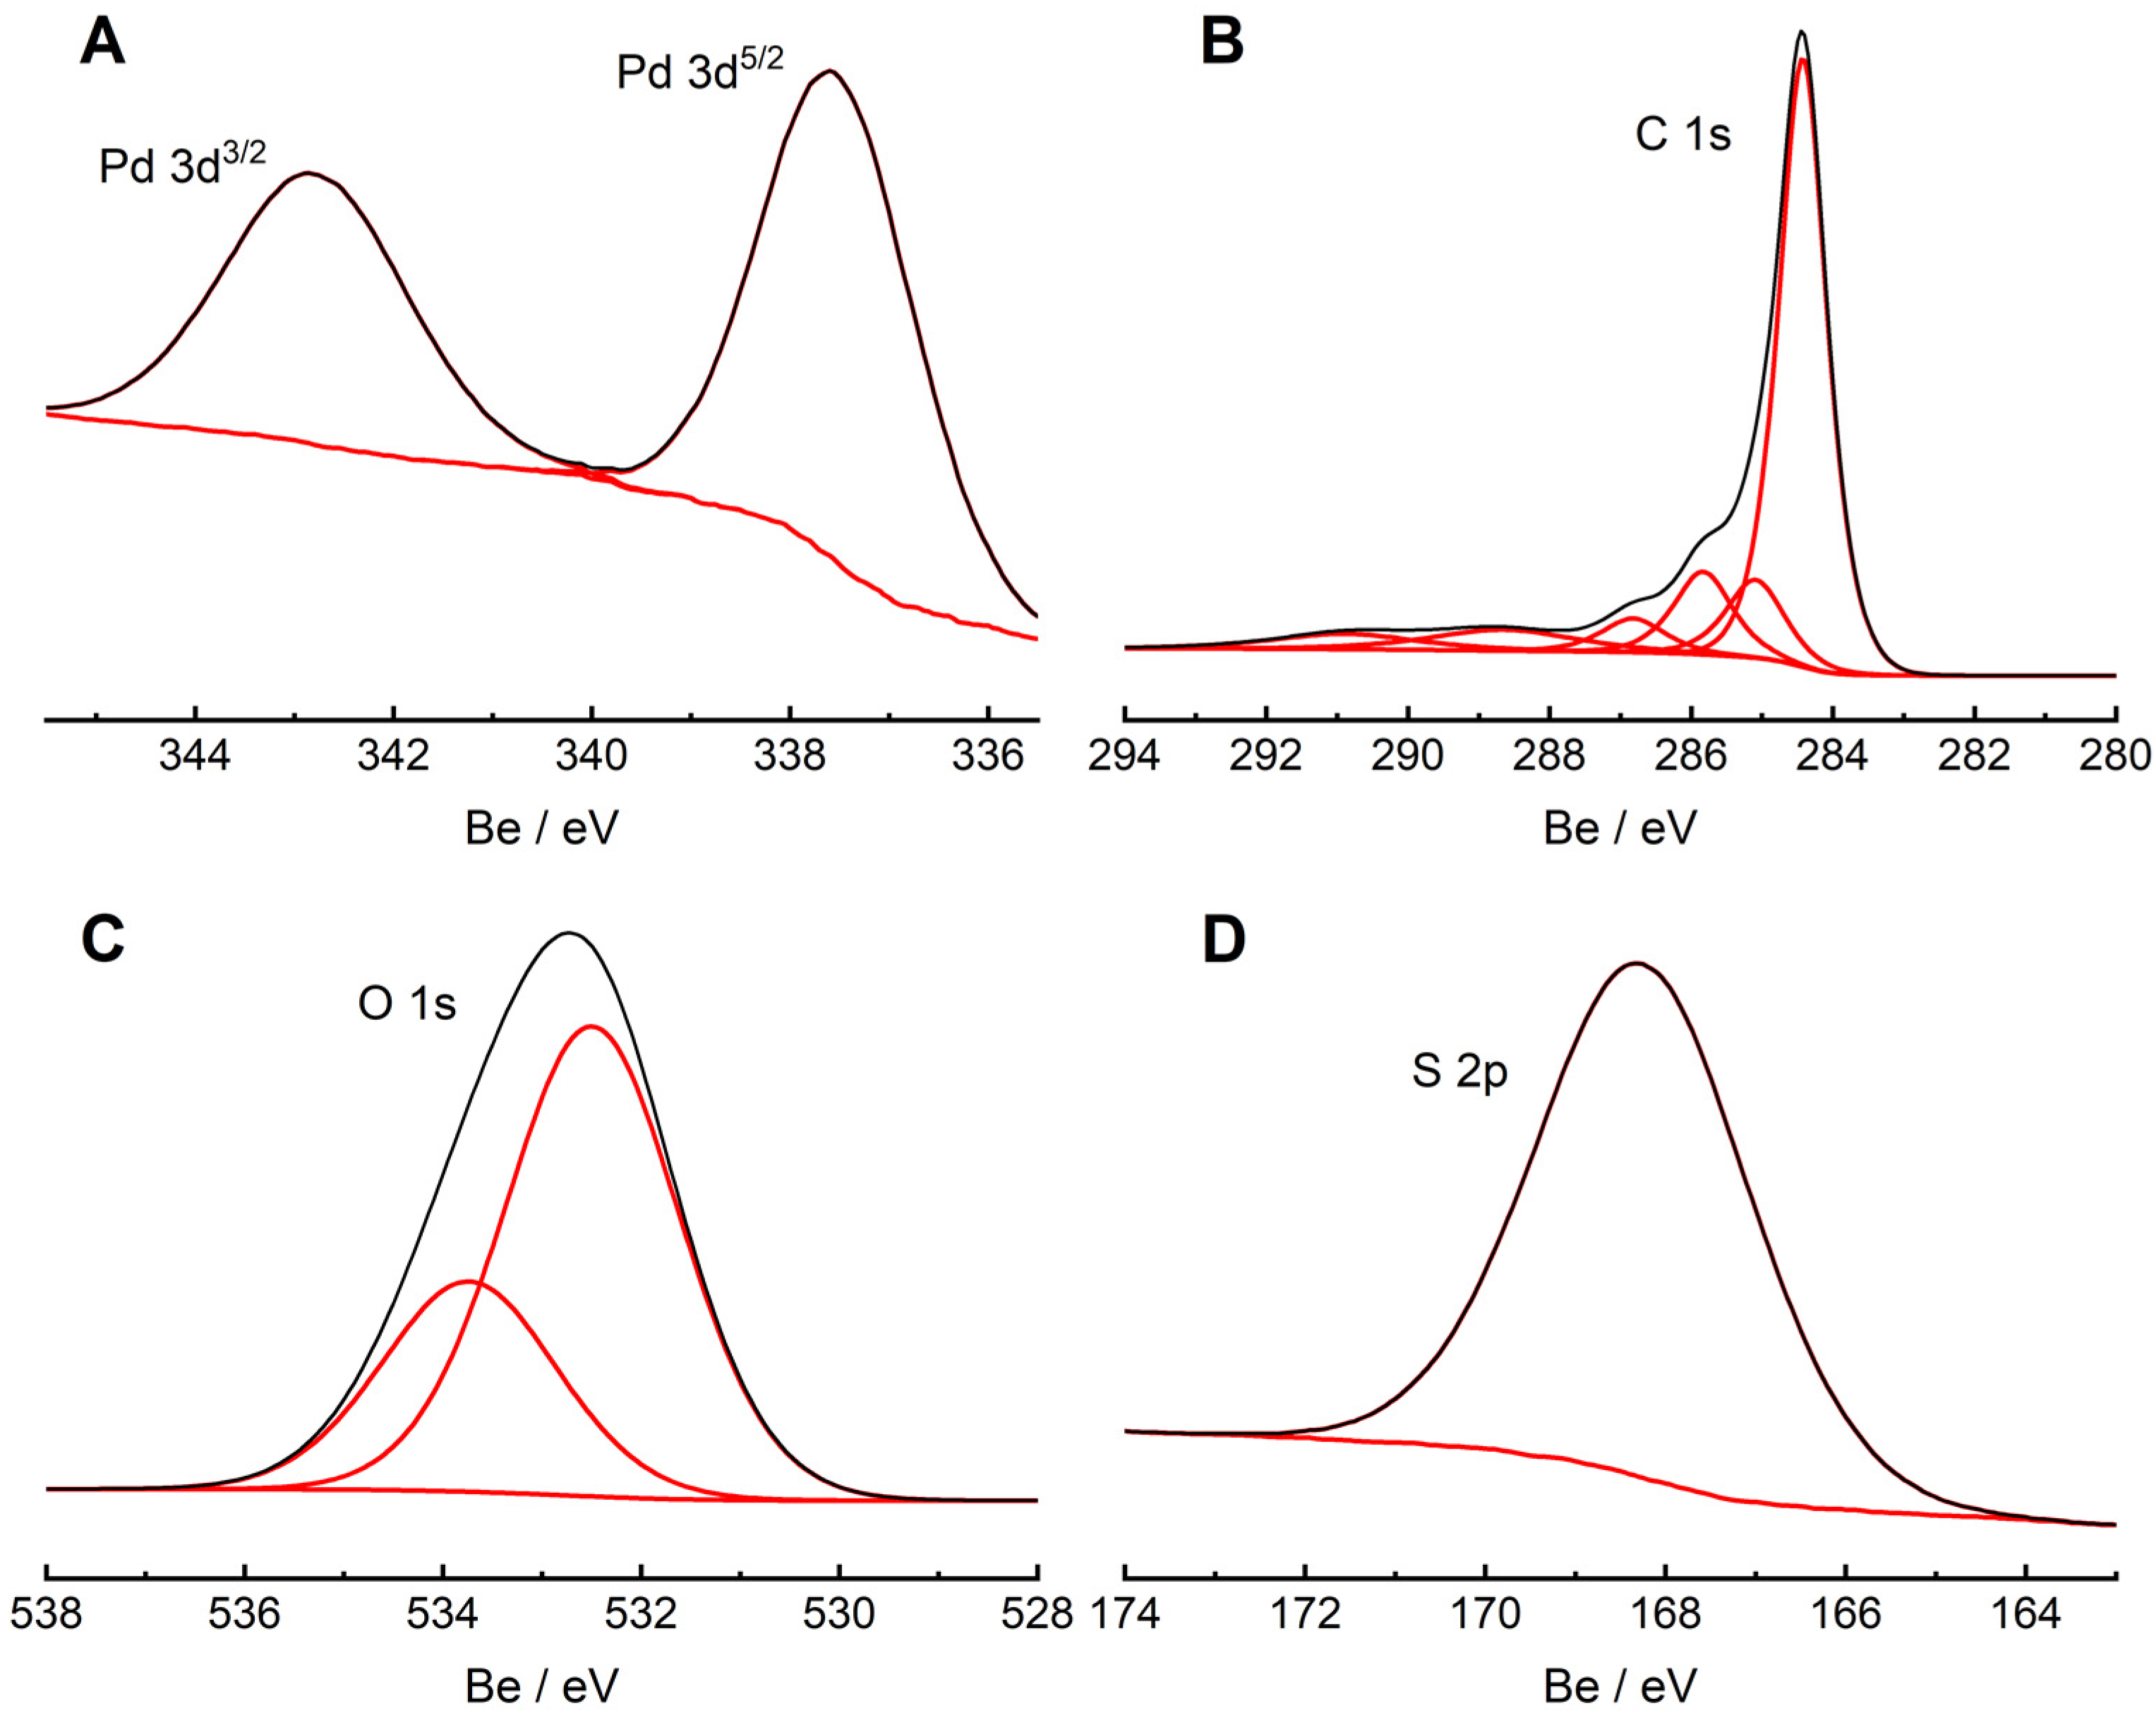
To verify the existence of palladium ions accumulated within the MWCNT/LS matrix, the XPS technique was also applied.
Figure 3A shows the high-resolution 3d Pd spectrum of the MWCNT/LS-Pd
2+ hybrid material. In this spectrum, a Pd 3d 3/2 and 3d 5/2 doublet was recorded at the binding energies of 342.9 eV and 337.6 eV, respectively, and shifted by 2.3 eV in comparison to the palladium metal position (335.3 eV) [
67,
68]. The peak pair is quite narrow; the full width at half maximum is 1.9 eV. Both the position of these two peaks and their characteristics indicate the presence of palladium in the formal oxidation state +2 and determine the formation of a palladium complex in the sample [
69,
70].
Figure 3B shows a C 1s spectrum, and the major peak at about 284.5 eV can be attributed to the sp
2-hybridized carbon atoms present in the MWCNT backbone [
71]. A peak at 285.2 eV relates to sp
3 C–C bonds, typical for MWCNTs. The peaks at 286.4, 287.7, 289.4, and 291.0 eV correspond to C–O bonds, C=O carbonyl groups, O–C=O carboxyl groups, and π–π*, respectively [
71,
72,
73].
Figure 3C shows the deconvoluted peaks of O 1s at 532.5 eV and 533.9 eV, attributed to C=O and C–O–H groups, respectively. [
56,
57,
74]. Moreover, a peak at 168.4 eV, which refers to S 2p, was recorded in the spectrum (
Figure 3D). It indicates the presence of oxidized sulfur from the sulfonic group, typical for lignosulfonate [
56,
57].
2.3. Electrochemical Study of GC/MWCNT/LS/NPd
The electrochemical study of the MWCNT/LS/NPd material was performed at the GC electrode using the CV technique. To best investigate the electrochemical performance of the modified electrode, measurements were carried out in three different electrolytes with various pH: 0.1 M HClO
4 (pH = 1.1), 0.05 M PB buffer (pH = 7.4), and 0.1 M NaOH (pH = 13.0). The recorded voltammograms are shown in
Figure 5. Analysis of the CV responses reveals typical signatures for palladium-based electrodes, including characteristic peaks for hydrogen adsorption/desorption [
79,
80,
81,
82,
83,
84,
85]. Specific palladium redox processes also occurred, which were particularly evident in 0.1 M HClO
4 (
Figure 5A), presumably due to the higher concentration of H
+ ions in the electrolyte. A broad wave of palladium oxide film formation was recorded from 0.7 V to 1.0 V, followed by a peak of reverse cathodic reduction of palladium oxides at E
0′ = 0.45 V.
The electrocatalytic activity of the modified electrode is anticipated to rely on the number, size, and surface area of NPds. Meanwhile, the properties of nanostructures can be linked to the quantity of LS adsorbed on the surface of a singular MWCNT. Consequently, we sought to compare the electrochemical properties of electrode materials with varying LS loadings to determine the most catalytically active electrode. A range of samples were prepared, with varying amounts of LS on the surface of the MWCNTs. A variety of LS concentrations were used, spanning from 0.4 to 5.0 mg mL
−1. Meanwhile, the PdCl
2 concentration remained constant at 0.01 M. The range of LS concentrations was limited between 0.4 and 5.0 mg mL
−1 as concentrations below this range would not ensure adequate chemical interactions between LS and Pd
2+ ions. Conversely, higher concentrations inevitably resulted in strong LS adsorption on the MWCNTs’ surface, leading to subsequent aggregation and thus impeding the access of analytes to the active nanoparticles [
56,
57].
To verify this phenomenon, an additional experiment was carried out to determine the amount of LS adsorbed on the MWCNTs’ surface as a function of the LS concentration used in the synthesis. The concentration range for LS was 0.1–20.0 mg mL
−1. The MWCNT/LS hybrid materials obtained during our study were analysed in relation to the current generated by the quinone/hydroquinone redox pair (
Figure S2). The current dependence on LS concentration has a similar shape to the Langmuir adsorption isotherm. The current values rapidly increase for samples containing 0.1 to 1.0 mg mL
−1, then gradually plateau at higher LS concentrations. Thus, the adsorption process can be considered as controlled.
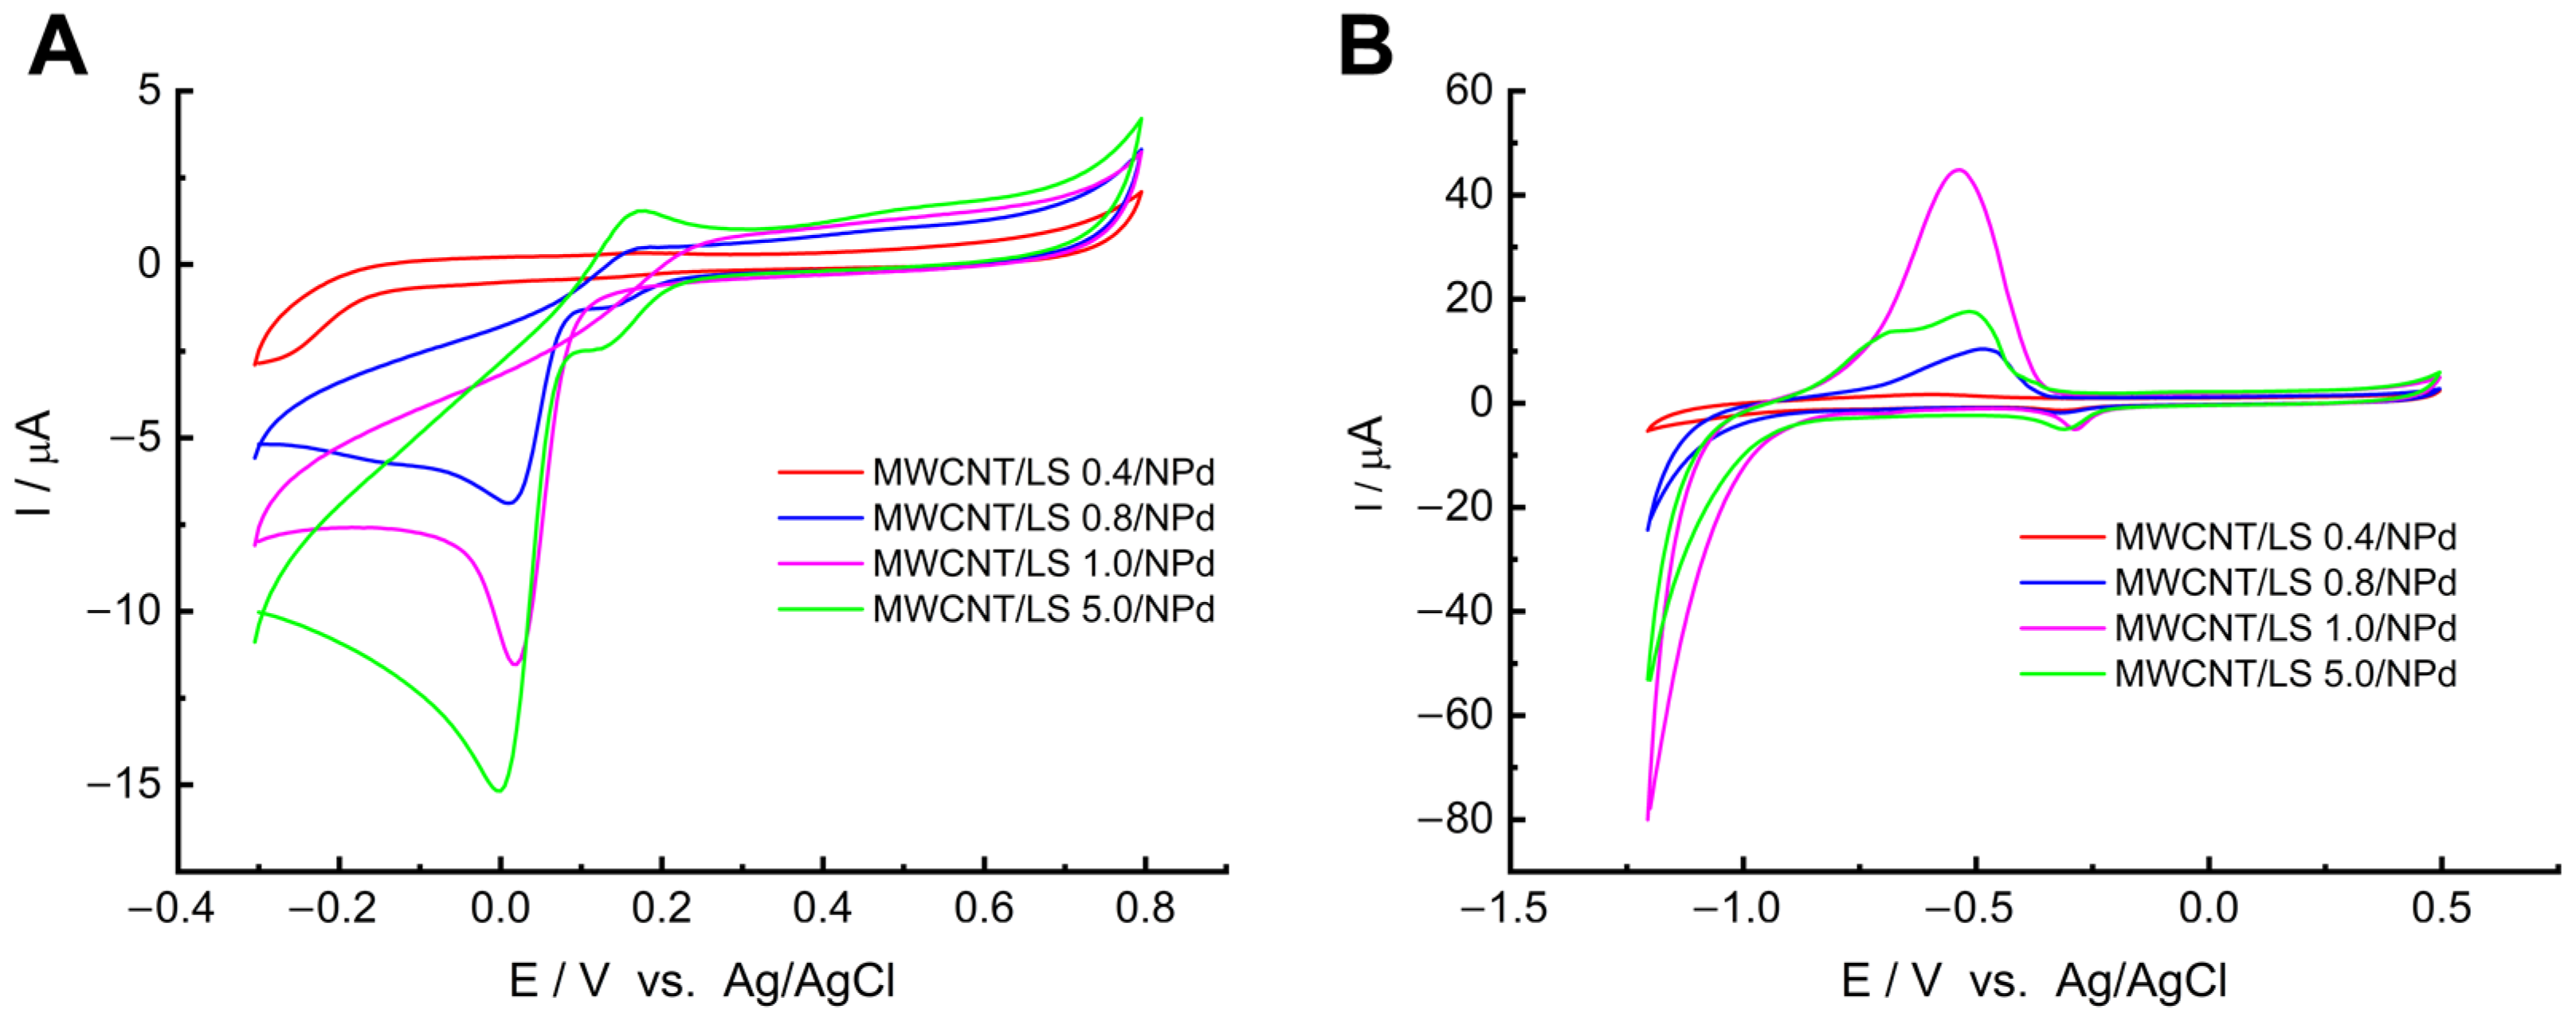
The effect of LS concentration on electrochemical activity was assessed with CV in PB buffer (0.05 M) in the presence of oxygen (
Figure 6A). The comparison of electrode materials can be achieved by contrasting their oxygen reduction capabilities. As depicted in
Figure 6A, electrodes with LS concentrations of 0.8 mg mL
−1 or more recorded an irreversible cathodic oxygen reduction peak at 0.0 V. With increasing quantities of LS, an increase in cathode current was noted at 0.0 V. However, the relationship between the quantity of nanoparticles in the electrode material and the quantity of LS present is non-linear (according to the quasi-Langmuir adsorption isotherm in
Figure S2). There is a noticeable correlation between the number of nanoparticles and the level of LS loading in the electrode material. The oxygen reduction peak from the current experiment is consistent with these findings, indicating the presence of both LS and NPds. The more NPds on the MWCNT/LS surface, the more catalytically active sites and, thus, higher oxygen reduction currents.
In order to definitively determine the optimum LS concentration, the electrodes were tested for hydrogen evolution. The hydrogen sorption capacity was investigated in a solution of 0.1 M NaOH, which we purged of dissolved oxygen with nitrogen for a few minutes before the experiment (
Figure 6B). Throughout the measurements, we maintained the system in a nitrogen atmosphere. The cyclic voltammetry (CV) response indicates that, as the concentration of LS increases, the overpotential for hydrogen evolution generally becomes less negative. Furthermore, a swift increase in the cathodic current occurred at −1.2 V, which is connected to processes of hydrogen sorption. This occurrence was particularly noticeable for the material with an LS loading of 1.0 mg mL
−1, and the current value recorded was approximately −79 µA. Furthermore, the signal for anodic hydrogen accumulation was highest at −0.52 V for the electrode with an LS loading of 1.0 mg mL
−1. Consequently, MWCNT/LS/NPd with an LS concentration of 1.0 mg mL
−1 was chosen as the electrode material that is most catalytically active.
2.4. Electrocatalytic Hydrazine Oxidation at GC/MWCNT/LS/NPd
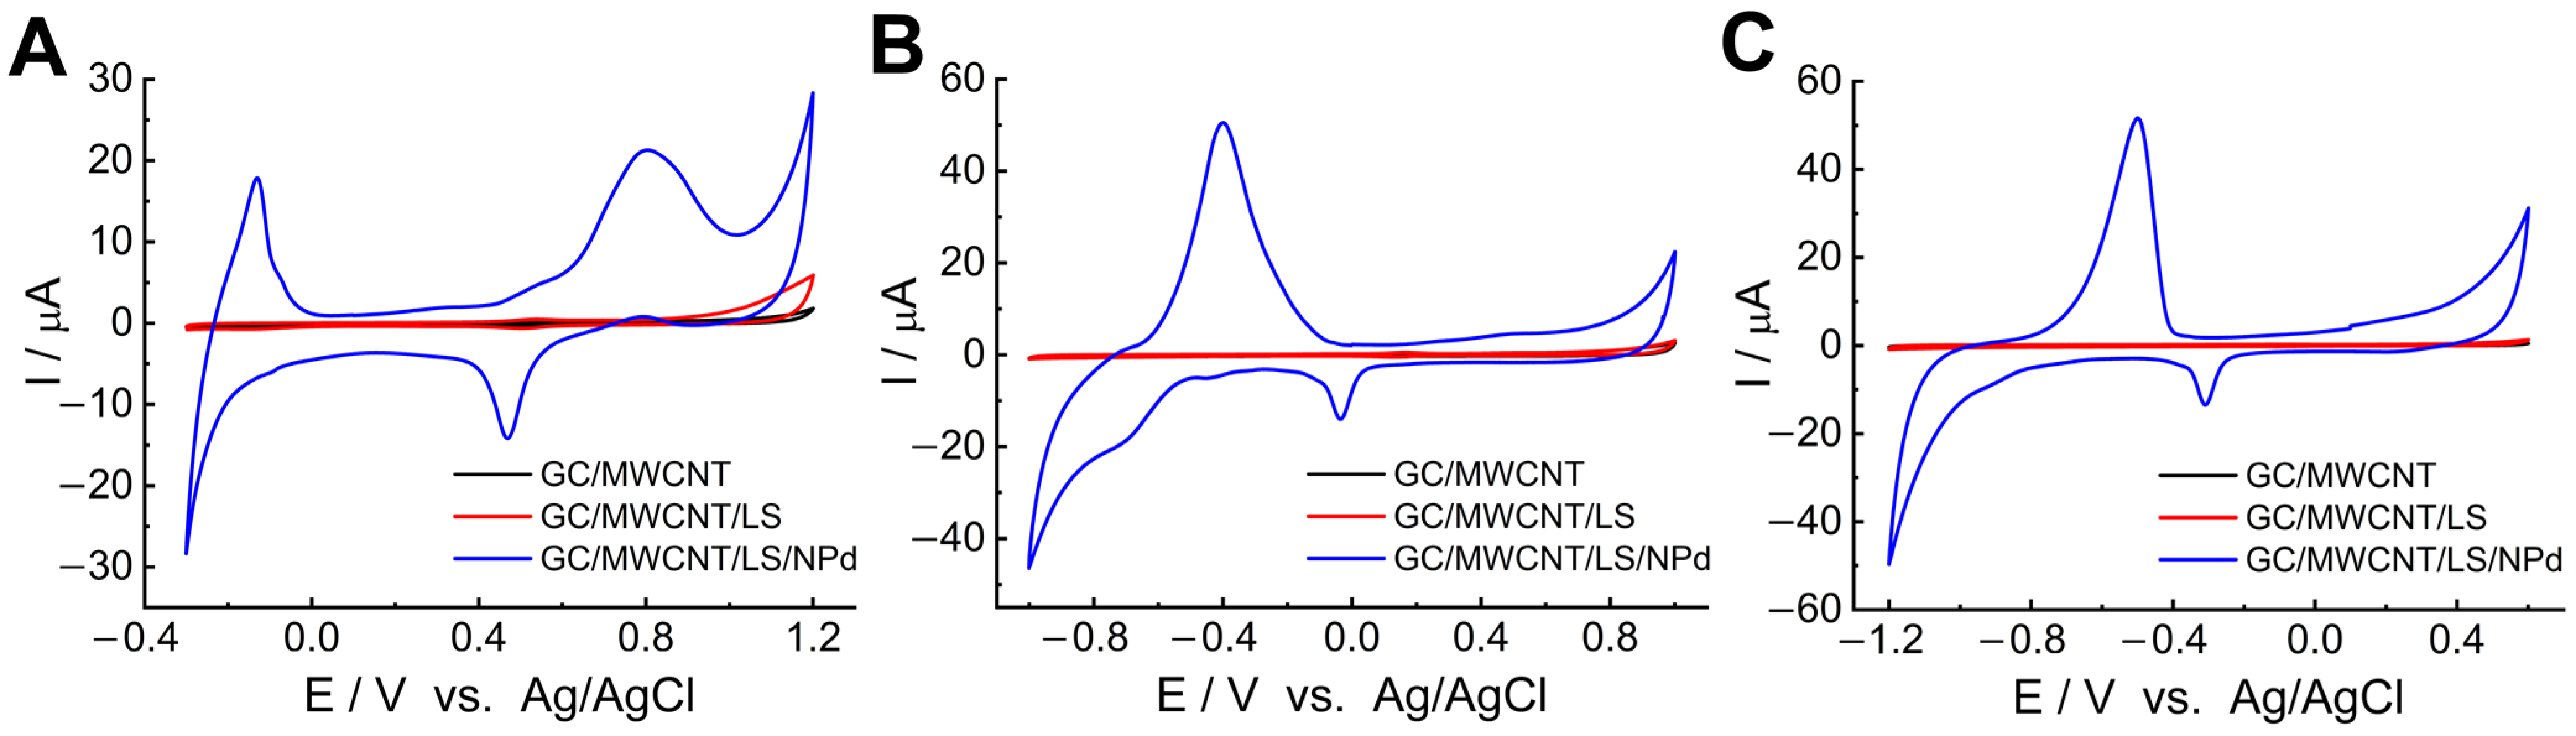
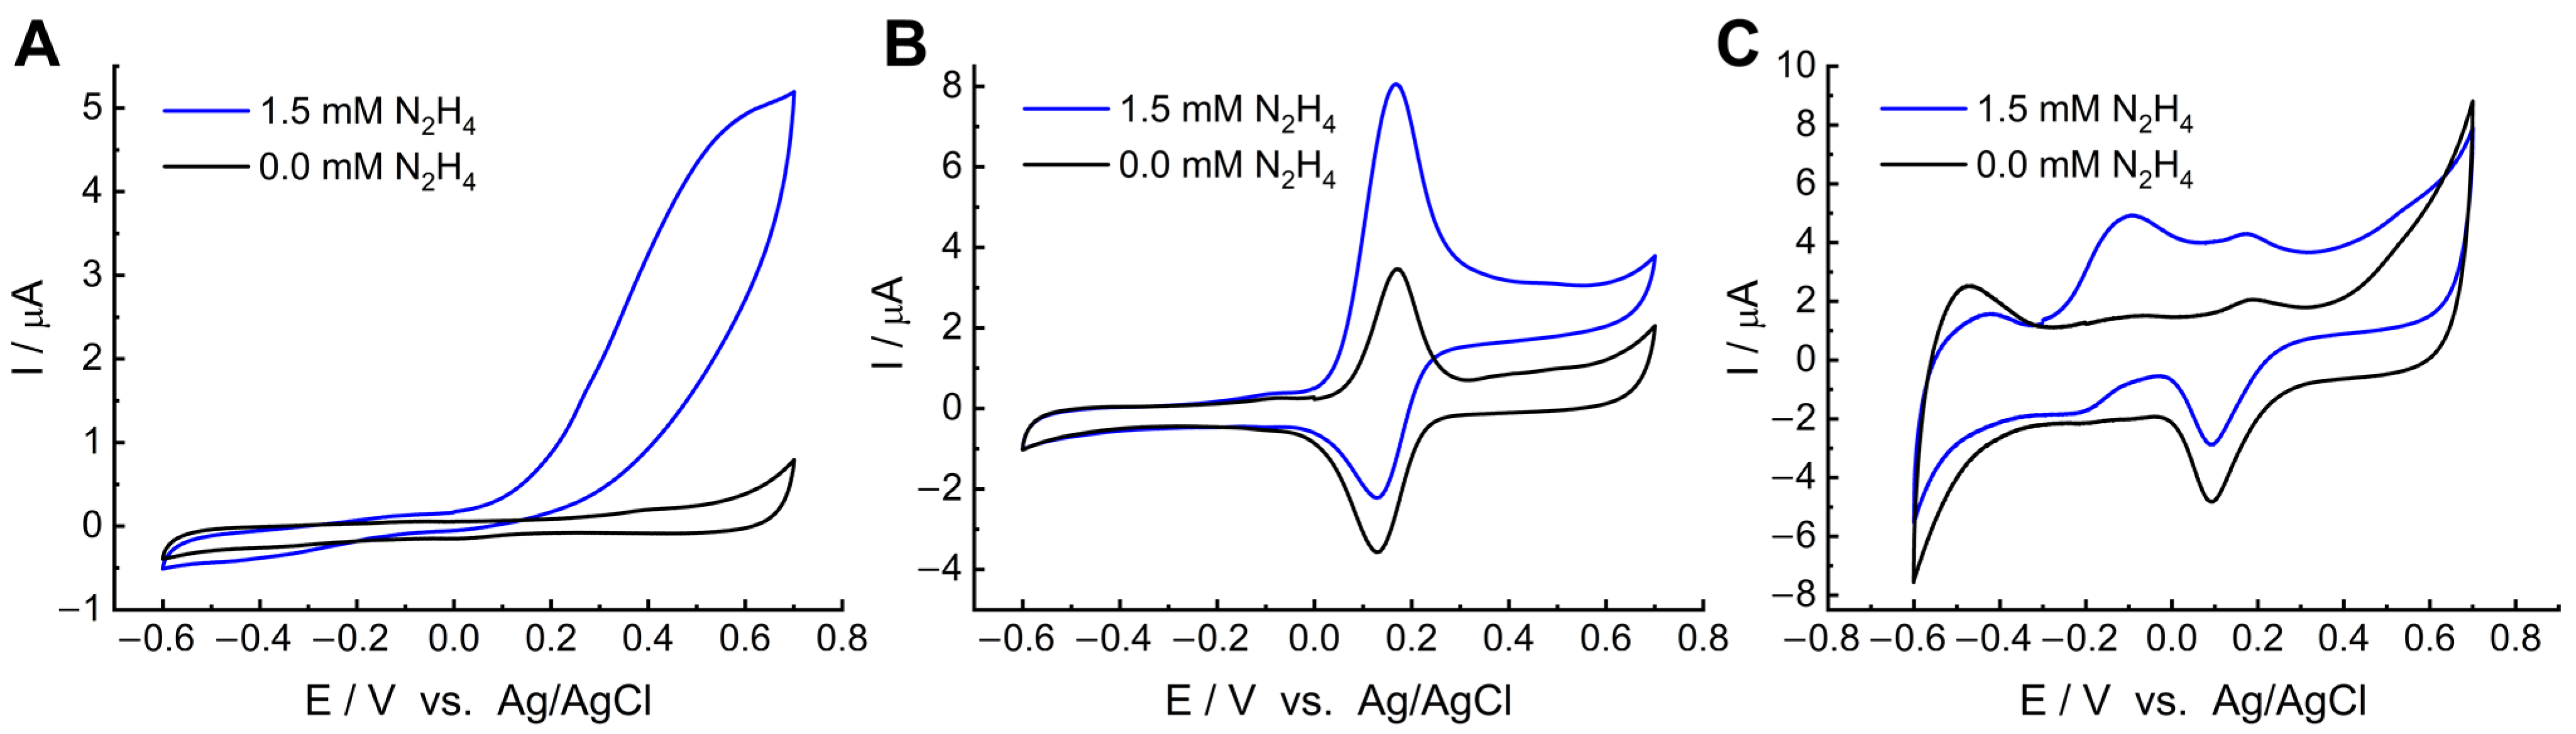
The electrocatalytic activity of MWCNT/LS/NPd towards hydrazine oxidation was first assessed with cyclic voltammetry in 0.05 M PB with and without 1.5 mM hydrazine in a potential range from −0.6 V to 0.7 V. For comparison, CVs were recorded for bare GC (
Figure S3), GC/MWCNT, GC/MWCNT/LS, and GC/MWCNT/LS/NPd (
Figure 7). It can be seen that the background current of the bare GC electrode (
Figure S3) and the electrode modified with pristine MWCNTs (
Figure 7A) is significantly lower and increases when the material is further modified with LS (
Figure 7B) and Pd nanoparticles (
Figure 7C). This behaviour can be ascribed to the higher hydrophilicity of both MWCNT/LS and MWCNT/LS/NPd as compared to pristine MWCNTs or bare GC electrodes. At the GC and GC/MWCNT electrodes, the hydrazine oxidation process generates an anodic wave growth without a characteristic peak current. Such CV curves are due to the hindered kinetics of hydrazine oxidation on the studied electrodes.
Figure 7B shows the CV response of the GC/MWCNT/LS electrode. Its characteristics were typical for LS-modified electrodes. A representative reversible quinone/hydroquinone redox couple was observed at E
0′ = 0.17 V. In the presence of 1.5 mM hydrazine, the oxidation signal of quinone groups recorded at 0.167 V was enhanced by hydrazine-mediated charge exchange. The well-defined sharp symmetrical peak indicates good sensitivity, selectivity, and high precision for hydrazine detection. The slight negative shift of the anodic peak is due to the presence of quinone/hydroquinone groups from LS, which can accelerate the oxidation of hydrazine [
85,
86]. Therefore, GC/MWCNT/LS exhibits electrocatalytic properties towards hydrazine oxidation.
Further, at the GC/MWCNT/LS/NPd electrode (
Figure 7C), the oxidation peak and one reduction peak were recorded in the presence of hydrazine. The peaks’ potentials are ca. −0.09 V and −0.20 V, respectively. It was found that the oxidation peak at −0.09 V corresponds to the process of hydrazine oxidation in PB buffer electrolyte (pH = 7.4) [
36,
87]. Based on the results of Miao and Compton [
87,
88], we attributed the anodic peak to the oxidation of N
2H
4 in a four-electron transfer reaction, according to the following Equation (2):
Miao and Compton [
81] found that hydrazine undergoes oxidation at pH 7.4 through multiple stages. One of the intermediates is the radical dication N
2H
5•2+, which is created through the first electron loss from N
2H
5+. The reduction signal of the radical dication is closely linked to the pH of the electrolyte. In the assays carried out in a PB buffer (0.05 M) with a pH of 7.4, N
2H
5•2+ remains stable, which allows the peak to be recorded at −0.20 V. A higher pH reduces the formation of the radical dication, whereas a lower pH strongly decreases the amount of protons on the electrode and produces hydrogen, masking the reduction signal of N
2H
5•2+ [
87].
Summarising the juxtaposition of the three electrodes presented, we concluded that modifying the GC surface with the MWCNT/LS/NPd hybrid material gives the best results for hydrazine determination. Although both GC/MWCNT/LS and GC/MWCNT/LS/NPd show electrocatalytic properties towards the oxidation of hydrazine, the presence of NPds allows the detection of the analyte at a more negative potential, starting from −0.09 V, which is a clear advantage of the electrode over other modified electrodes proposed so far.
Next, we performed a control experiment for the MWCNT/NPd material to determine the effect of lignosulfonate on the electrocatalytic activity in hydrazine oxidation. For this purpose, NPds were deposited on the surface of pristine, unmodified MWCNTs, and the electrode was then prepared in the same way as MWCNT/LS-NPd. Cyclic voltammograms of GC/MWCNT/NPd and GC/MWCNT/LS/NPd were recorded in the absence and presence of hydrazine (
Figure S4). Hydrogen sorption occurred at the GC/MWCNT/NPd electrode, indicating the presence of palladium in the material, but the addition of hydrazine caused only a slight increase in the oxidation current. None of the three characteristic peaks of hydrazine were recorded. The use of LS significantly affects the electrocatalytic properties of MWCNT/LS-NPd in the oxidation of hydrazine. The activity of MWCNT/LS-NPd is ensured by the porous and diversified structure, which facilitates the diffusion of hydrazine molecules to the active surface.
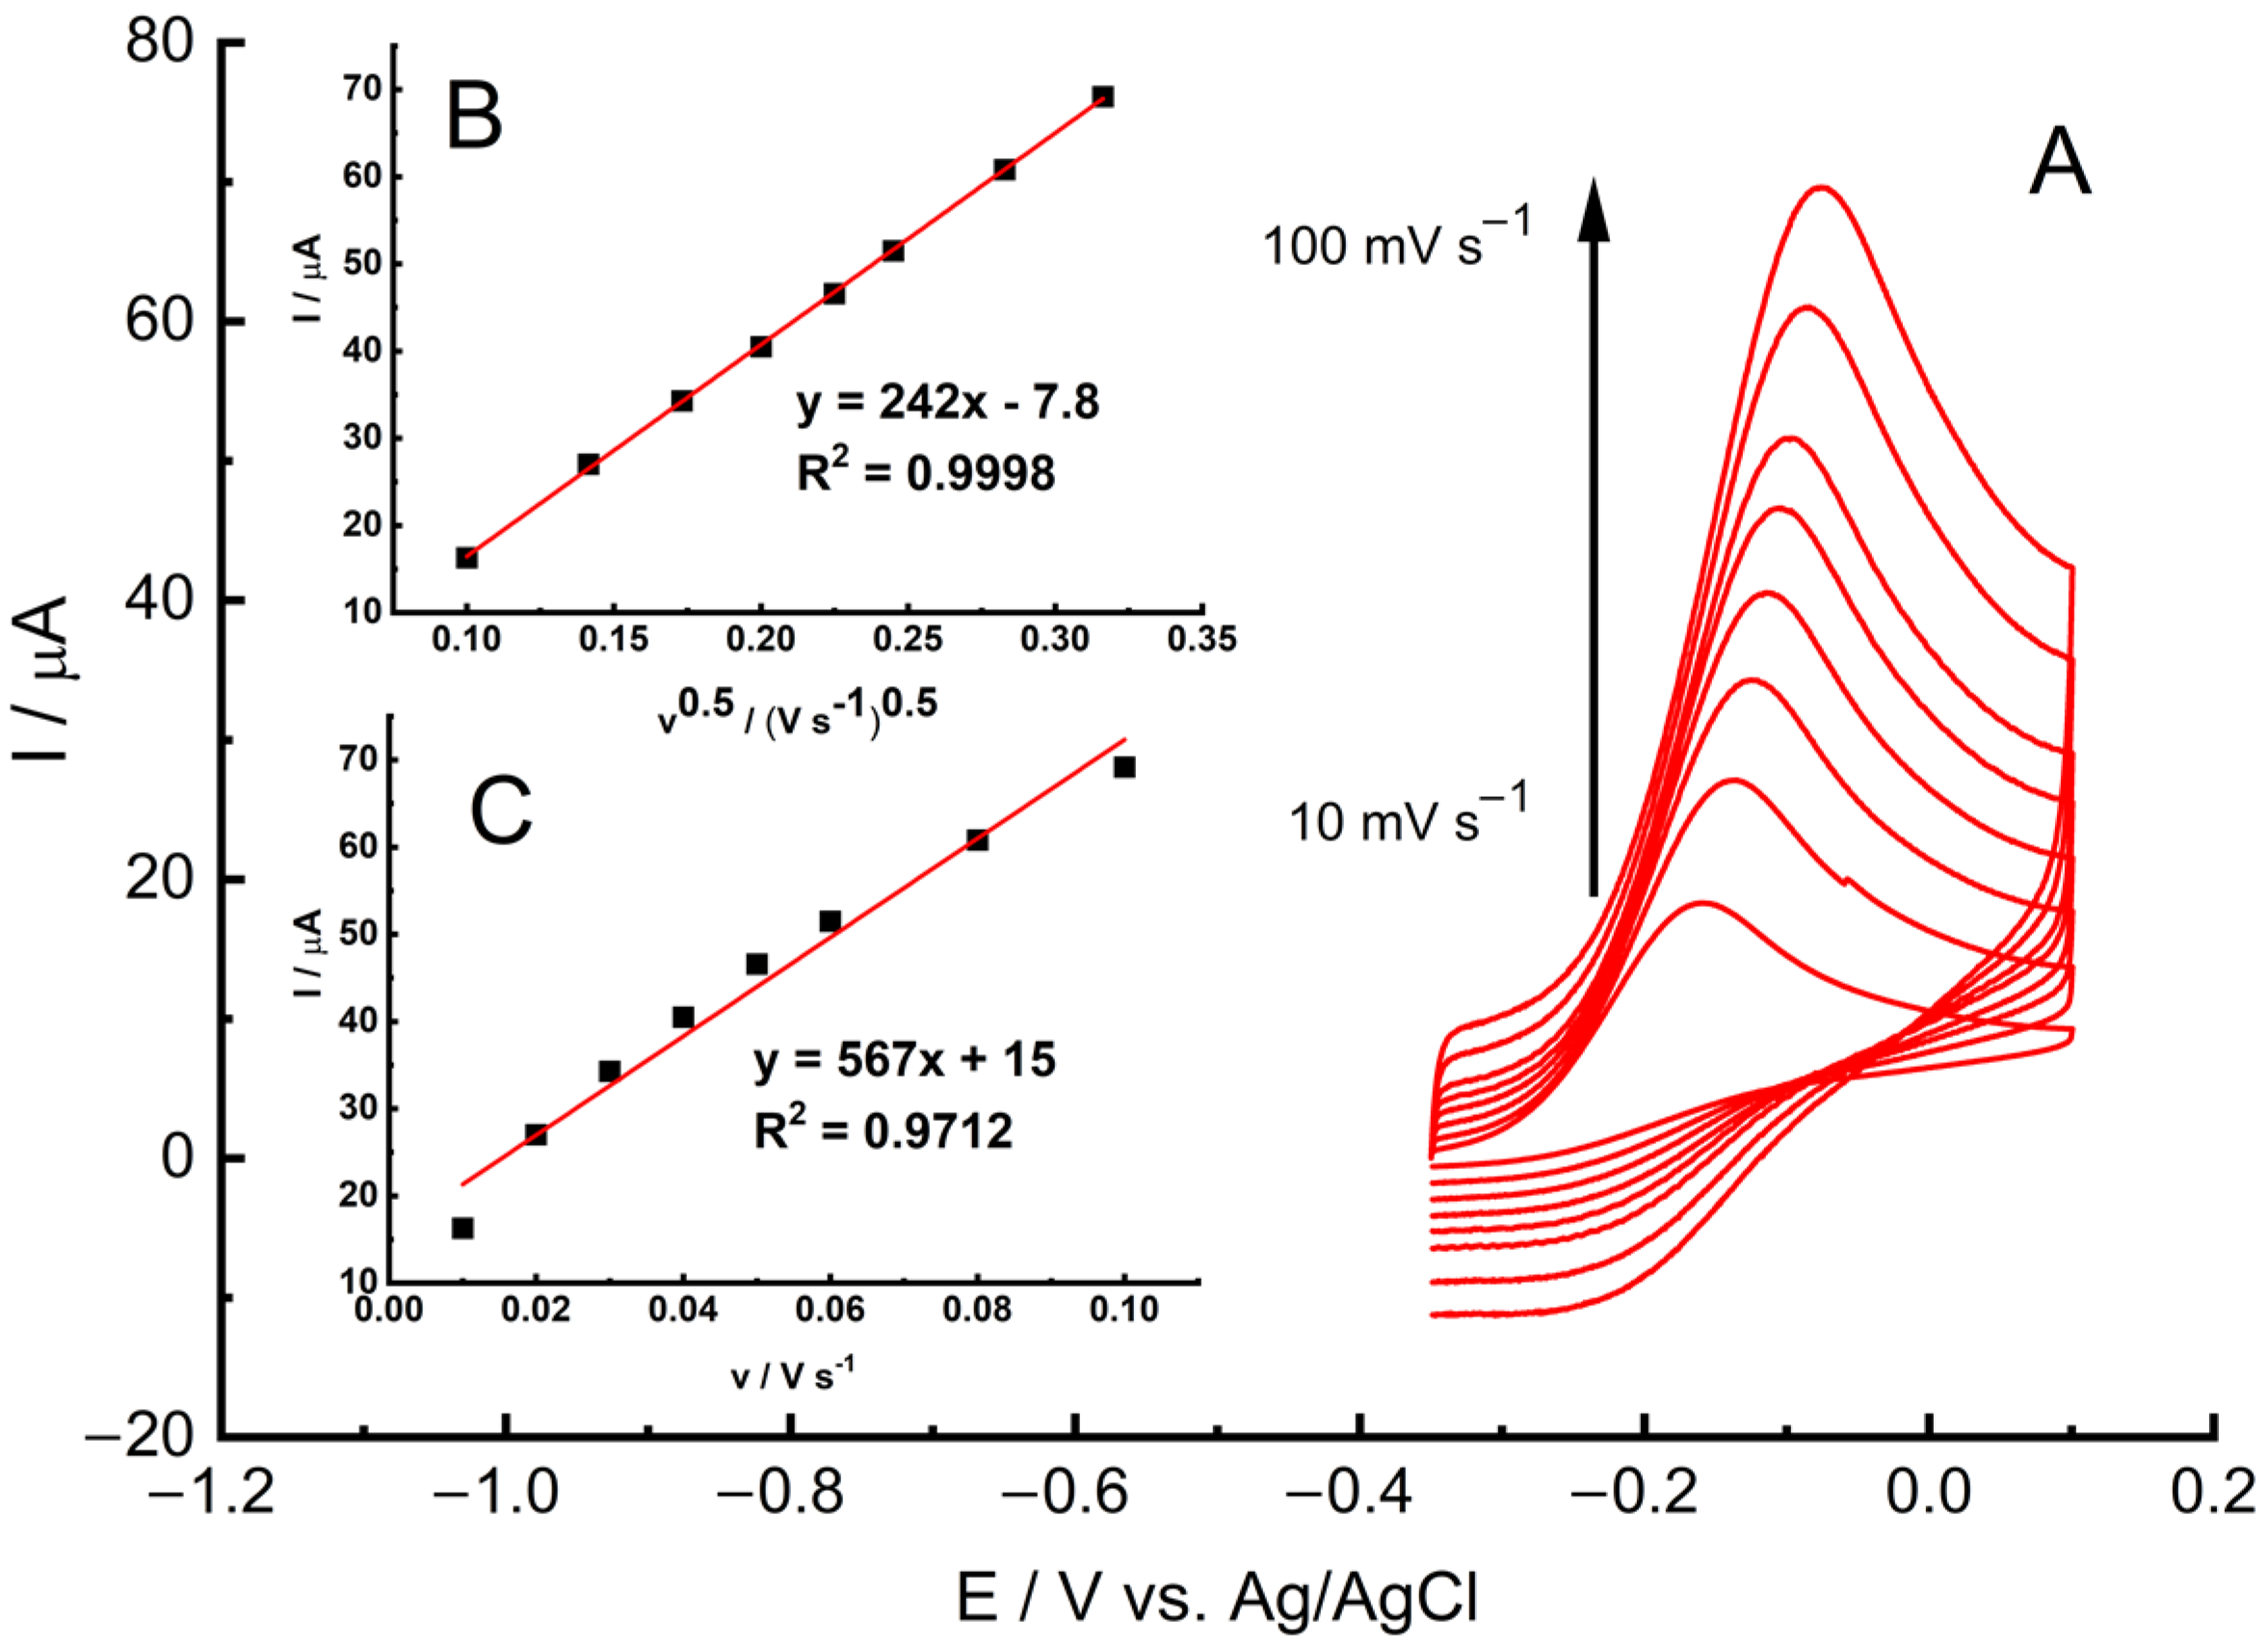
A study on scan rates was conducted using the GC/MWCNT/LS/NPd electrode in a PB buffer (0.05 M) with a 10 mM hydrazine solution within the range of 10 to 100 mV s
−1. As illustrated in
Figure 8, the oxidation peak current exhibited an increase with higher scan rates. Remarkably improved linearity (R
2 = 0.9998) was achieved when plotting the catalytic current against the square root of the scan rate, denoted as I vs. ν
1/2 (
Figure 8B), in contrast to the relationship between I and v (R
2 = 0.9712) (
Figure 8C). This electrode response strongly indicates that the process is limited by diffusion. It is worth noting that this diffusion-controlled response is the preferred behaviour for the accurate application of the modified electrode in quantitative analysis.
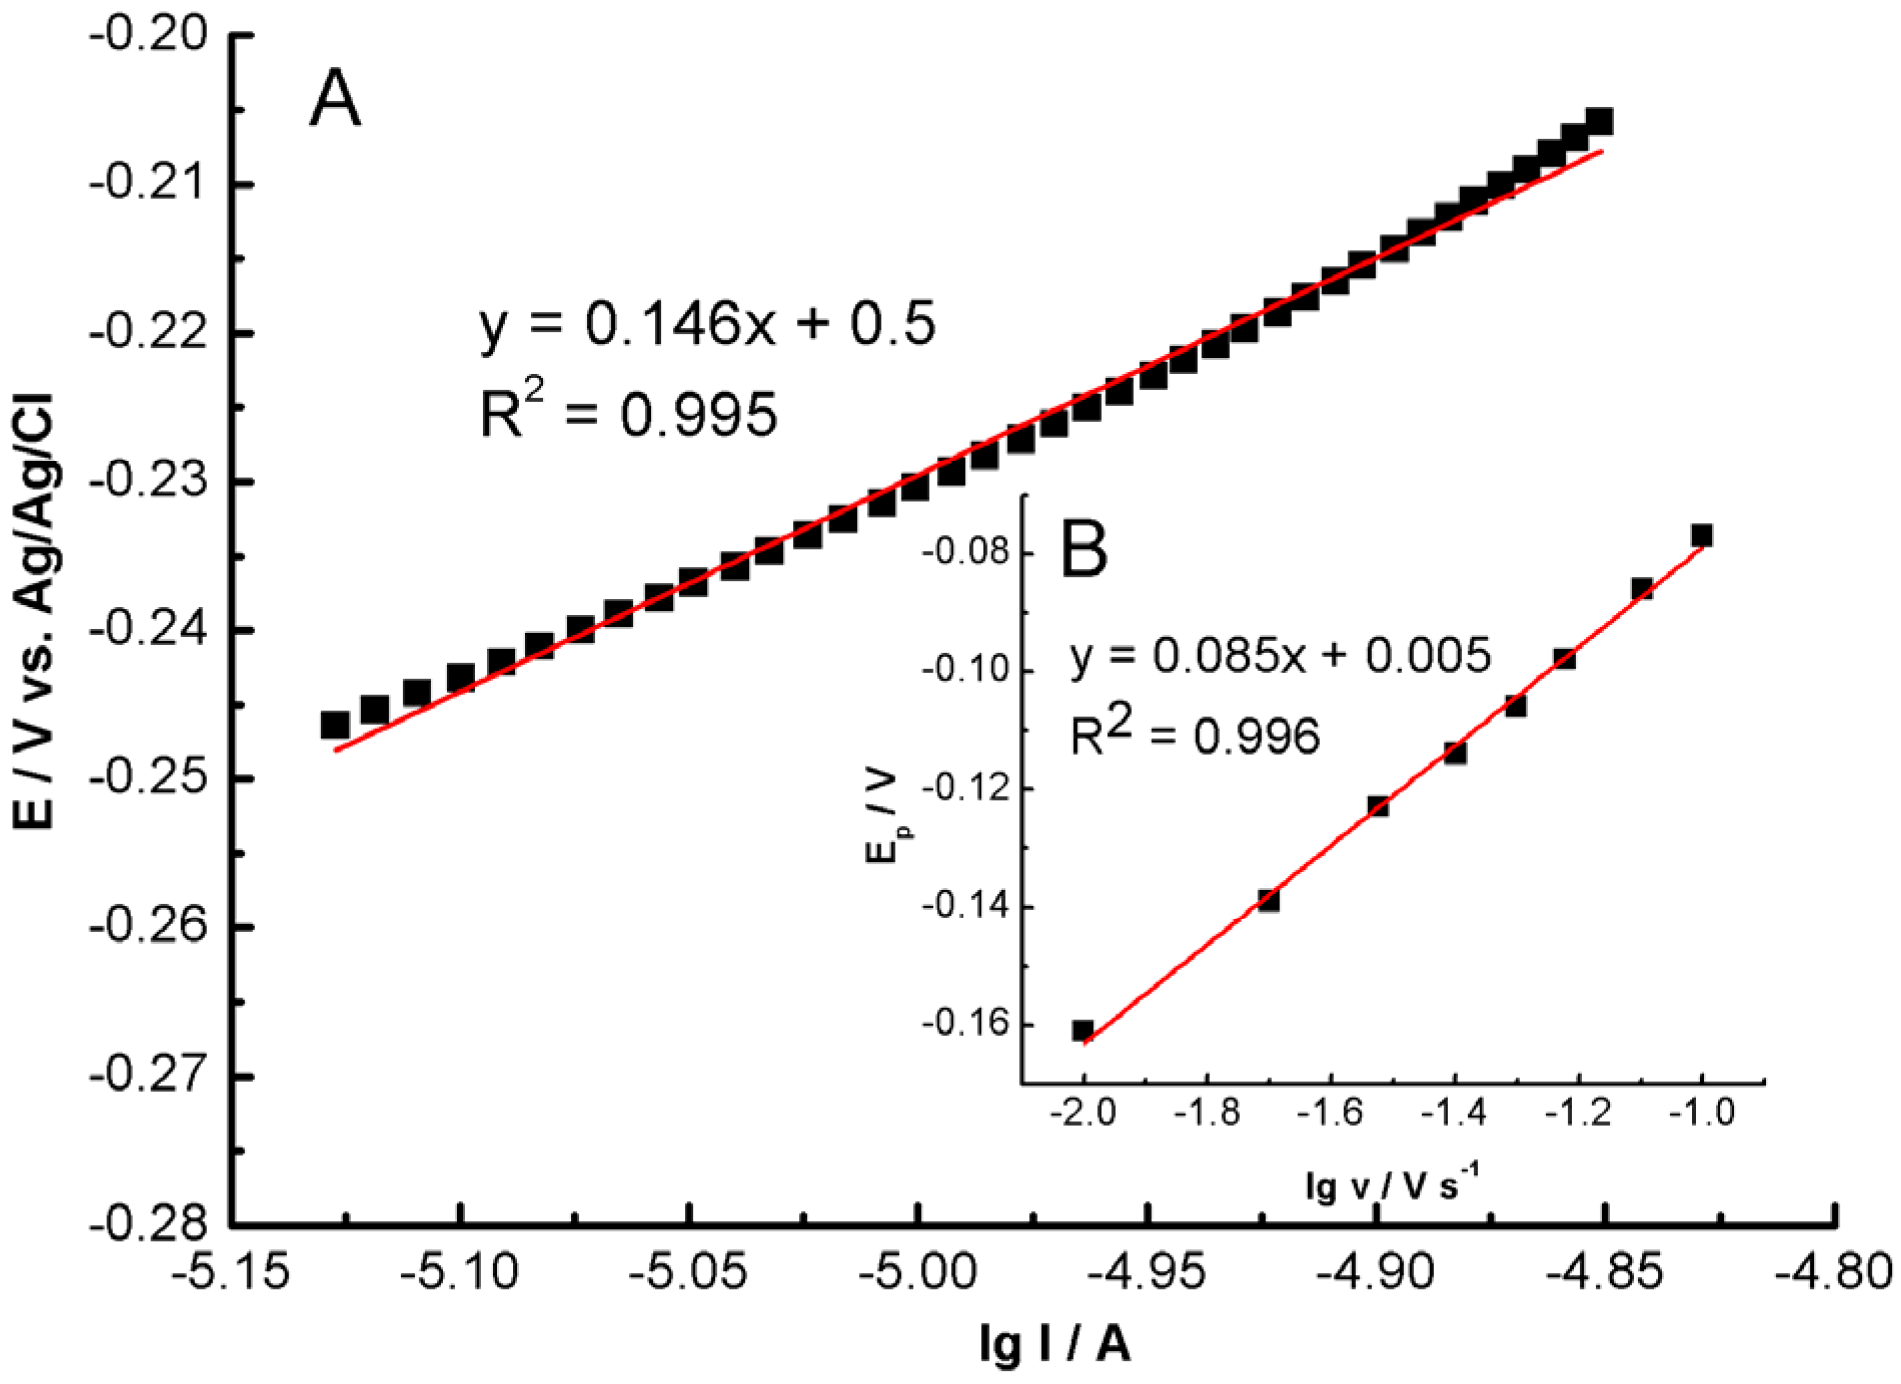
A Tafel plot generated from the ascending section of the current–voltage curve at a scan rate of 1 mV s
−1 is depicted in
Figure 9. The Tafel plot derived from this data exhibited a linear relationship with a slope (dlg I/dE) of 146 mV. The anodic transfer coefficient (α) was calculated to be 0.40 using Equation (3) [
89]:
where R (8.314 J K
−1 mol) represents the gas constant, T is the temperature (298 K), and F corresponds to the Faraday constant (96,500 C mol
−1). The observed slope of 146 mV closely aligns with the theoretical value of 120 mV, indicative of a reaction involving a one-electron transfer in the rate-determining step, when α = 0.5 [
89].
The peak potential for the catalytic oxidation of hydrazine shifts towards more positive values as the scan rate increases, implying kinetic limitations. A linear regression equation correlating potential (E
pa/mV) and the logarithm of the scan rate (log(ν/mV s
−1)) was established, as demonstrated in
Figure 9B. The number of electron transfers in the rate-determining step can be calculated from the Tafel slope (b) using Equation (4) [
90,
91,
92,
93]:
where b represents the Tafel slope. The plot of E
p against log (ν) exhibits a slope of 85 mV, thereby indicating a Tafel slope of 170 mV. This outcome is consistent with the results obtained from the ascending segment of the voltammogram recorded at 1 mV s
−1, reinforcing the notion that a one-electron transfer governs the rate-determining step.
Previous research has widely supported the idea that hydrazine oxidation is a four-electron transfer reaction, with the first electron transfer considered to be the rate-determining step [
90,
91,
92,
93,
94,
95]. In light of these findings, a plausible mechanism for the oxidation of hydrazine can be proposed (Equations (5) and (6)):
The cyclic voltammetry technique was used to examine how the GC/MWCNT/LS/NPd electrode responded to varying concentrations of hydrazine (
Figure S5). As the hydrazine concentration increased, there was a gradual rise in the peak current at −0.09 V. The oxidation current is linearly dependent on the hydrazine concentration in the electrolyte and has an R
2 value of 0.998, indicating high sensitivity of the electrode to the electrocatalytic oxidation of hydrazine. However, at higher concentrations of hydrazine, the oxidised products can gradually adsorb onto the electrode surface. To precisely investigate the oxidation of hydrazine in upcoming experiments, the chronoamperometric approach was employed. This method entails using a rotating electrode which ejects the oxidised products from the electrode surface, allowing for the further reaction of analyte molecules.
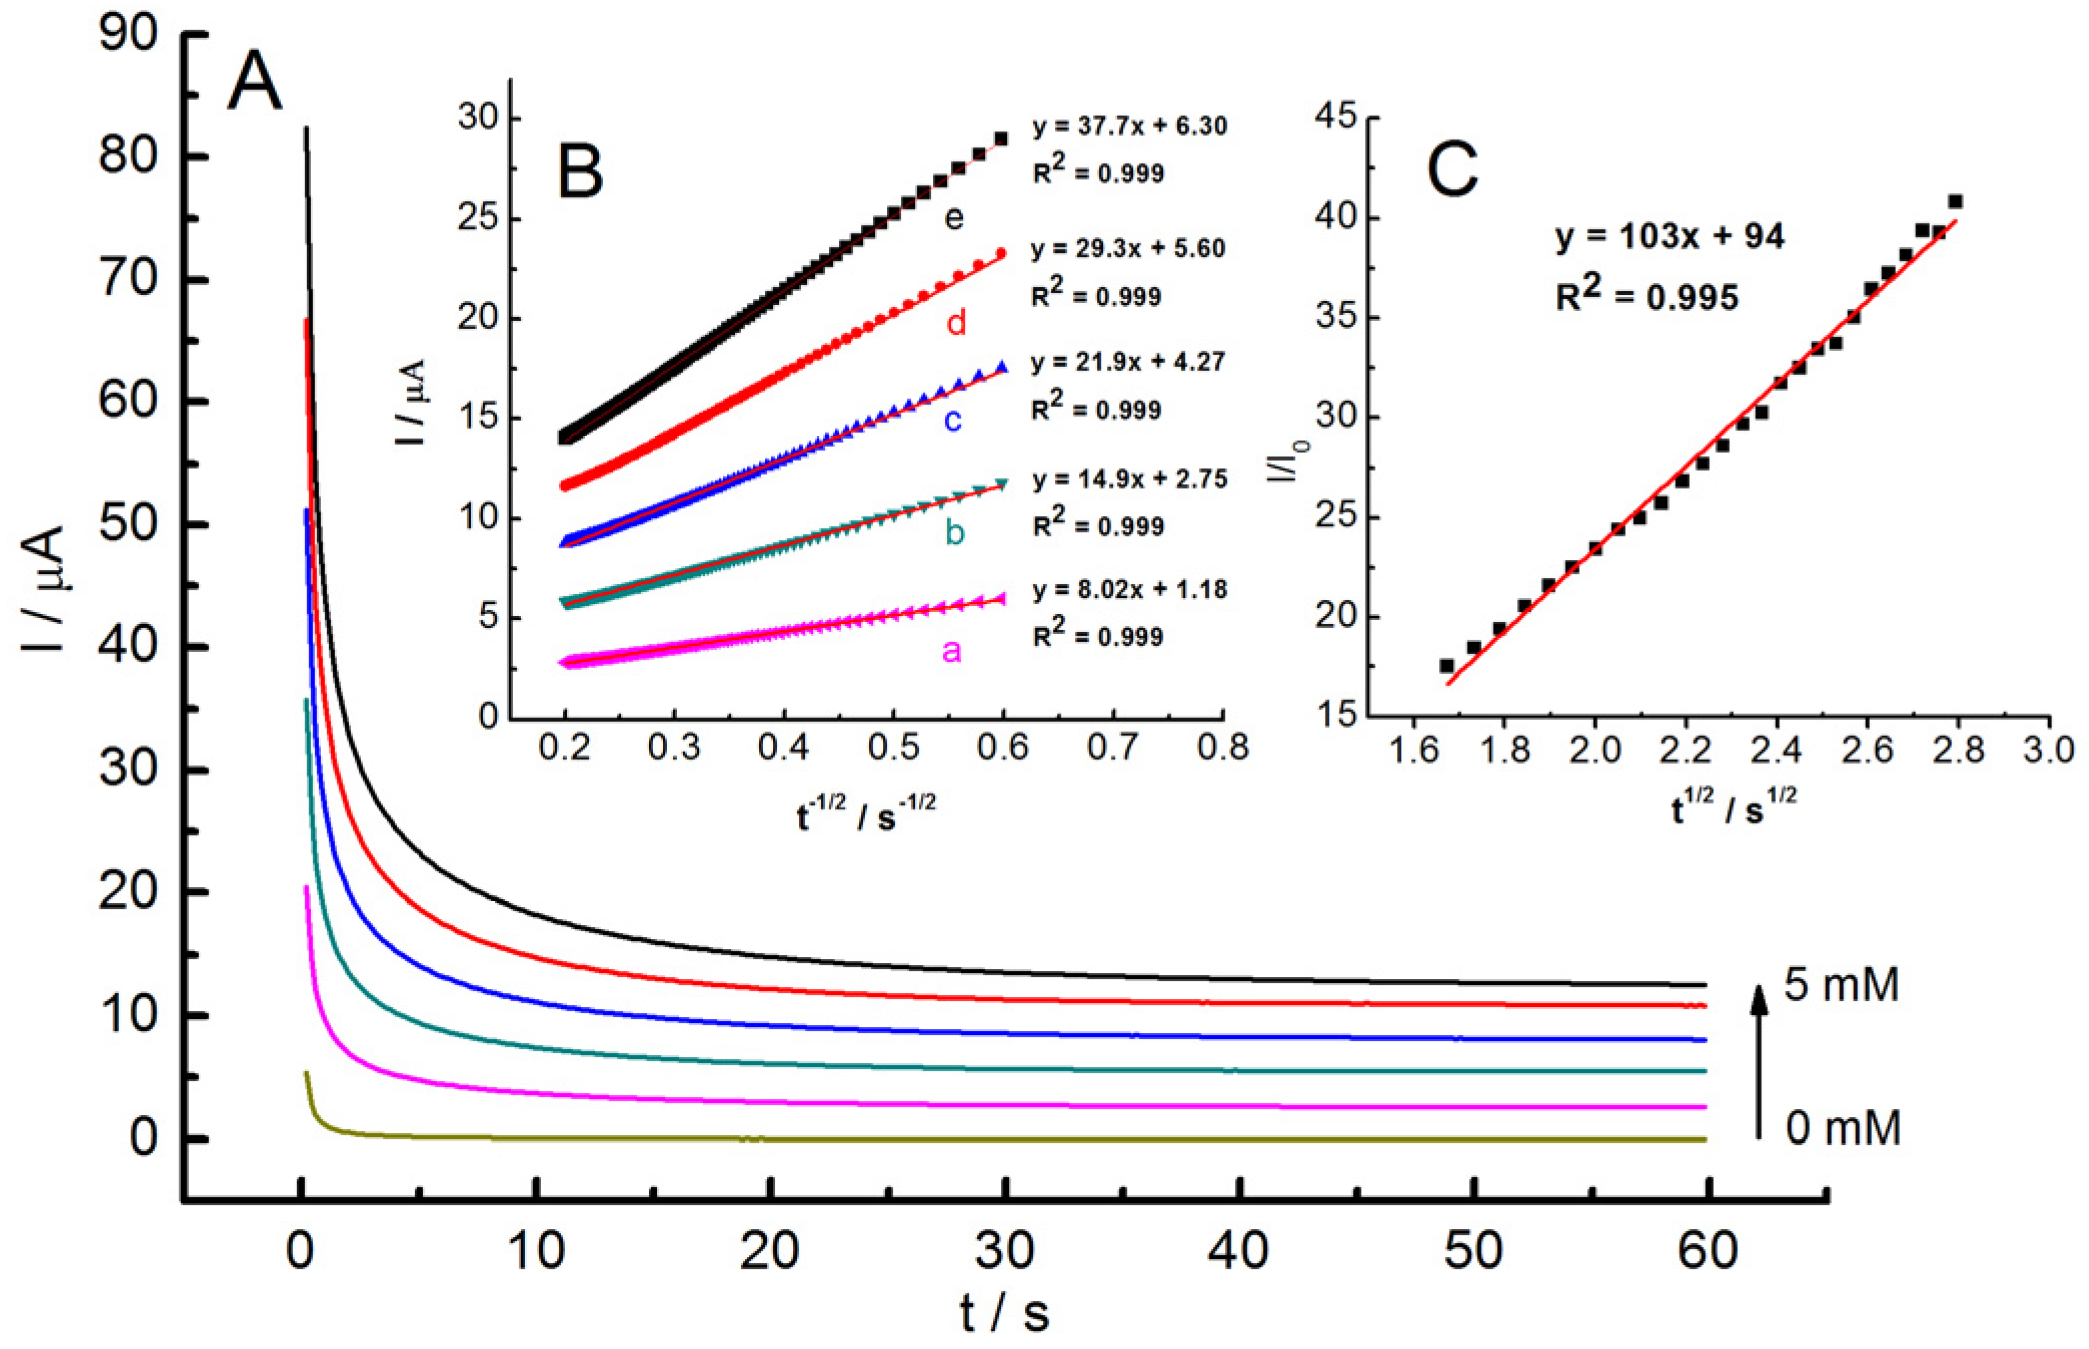
Next, chronoamperometric investigations were conducted to determine the diffusion coefficient (D) and electrocatalytic rate constant (k
cat). As illustrated in
Figure 10A, a series of distinct chronoamperograms were recorded at 0.1 V, both in the absence and presence of hydrazine at concentrations ranging from 1 to 5 mM. In the presence of hydrazine, the recorded currents are regulated by diffusion and can be described by the Cottrell equation (Equation (7)) [
90,
91,
92,
93,
94,
95]:
where D and c
0 represent the diffusion coefficient (cm
2 s
−1) and bulk concentration (mol cm
−3) of hydrazine, respectively. A corresponds to the electroactive electrode area (0.069 cm
2, estimated from the CV in the presence of [Fe(CN)
6]
3− (please refer to the
supporting material, Figure S6). I signifies the diffusion-controlled current of hydrazine oxidation.
The I vs. t
−1/2 plots at varying hydrazine concentrations exhibit linearity within specific time intervals, indicating that the oxidation process conforms to the conditions outlined by the Cottrell equation (
Figure 10B). The slopes of these plots were used to calculate an average value of D, which was determined to be 2.50 × 10
−7 cm
2 s
−1.
Electrochemical impedance spectroscopy (EIS) measurements were conducted on the electrode surface to gain a deeper insight into the interfacial processes.
Figure S7 displays customary Nyquist graphs of the unmodified GC, GC/MWCNT, and GC/MWCNT/LS/NPd with 1 mM [Fe(CN)
6]
3−/4− (molar ratio of 1:1) present. The obtained data validate earlier CV findings and indicate an amplified peak differentiation with each progressive modification stage. Specifically, for GC, the value is 96 mV, for GC/MWCNT, it is 83 mV, and for GC/MWCNT/LS/NPd, the value is 76 mV (refer to
Figure S6). The Nyquist diagram depicting the bare GC demonstrates a significant semicircle in the high-frequency region and a linear trend in the low-frequency zone. The high-frequency segment corresponds to the electron transfer resistance, while the linear section in the medium–low-frequency range is linked to capacitance and diffusion resistance. The EIS curves for the GC/MWCNT and GC/MWCNT/LS/NPd electrodes imply the occurrence of rapid electron conveyance and changing character to capacitive. This is connected with the highly conductive and porous character of MWCNTs. It can be deduced from both the CV (
Figure S6) and EIS (
Figure S7) analyses that GC/MWCNT/LS/NPd can be employed to improve the GC electrode surface with high conductivity and electroactivity [
90,
91,
92,
93,
94].
Next, the chronoamperometry data were used to estimate the kcat of the oxidation of hydrazine. At halftime, the diffusion-controlled current is dominated by the rate of the electrocatalytic oxidation of hydrazine; hence, the kcat for the chemical reaction between hydrazine and the catalyst on the electrode’s surface can be determined according to Equation (8) [
49]:
where I
0 and I
cat are the currents recorded in the absence and in the presence of hydrazine, respectively, k
cat (M
−1 s
−1) is the second-order catalytic rate constant, c
0 (M) is the concentration of hydrazine, and t (s) is time elapsed. The plot of I/I
0 vs. t
1/2 for 5 mM of hydrazine was linear (
Figure 10C). From this slope, the k
cat was estimated to be 6.76 × 10
5 M
−1 s
−1.
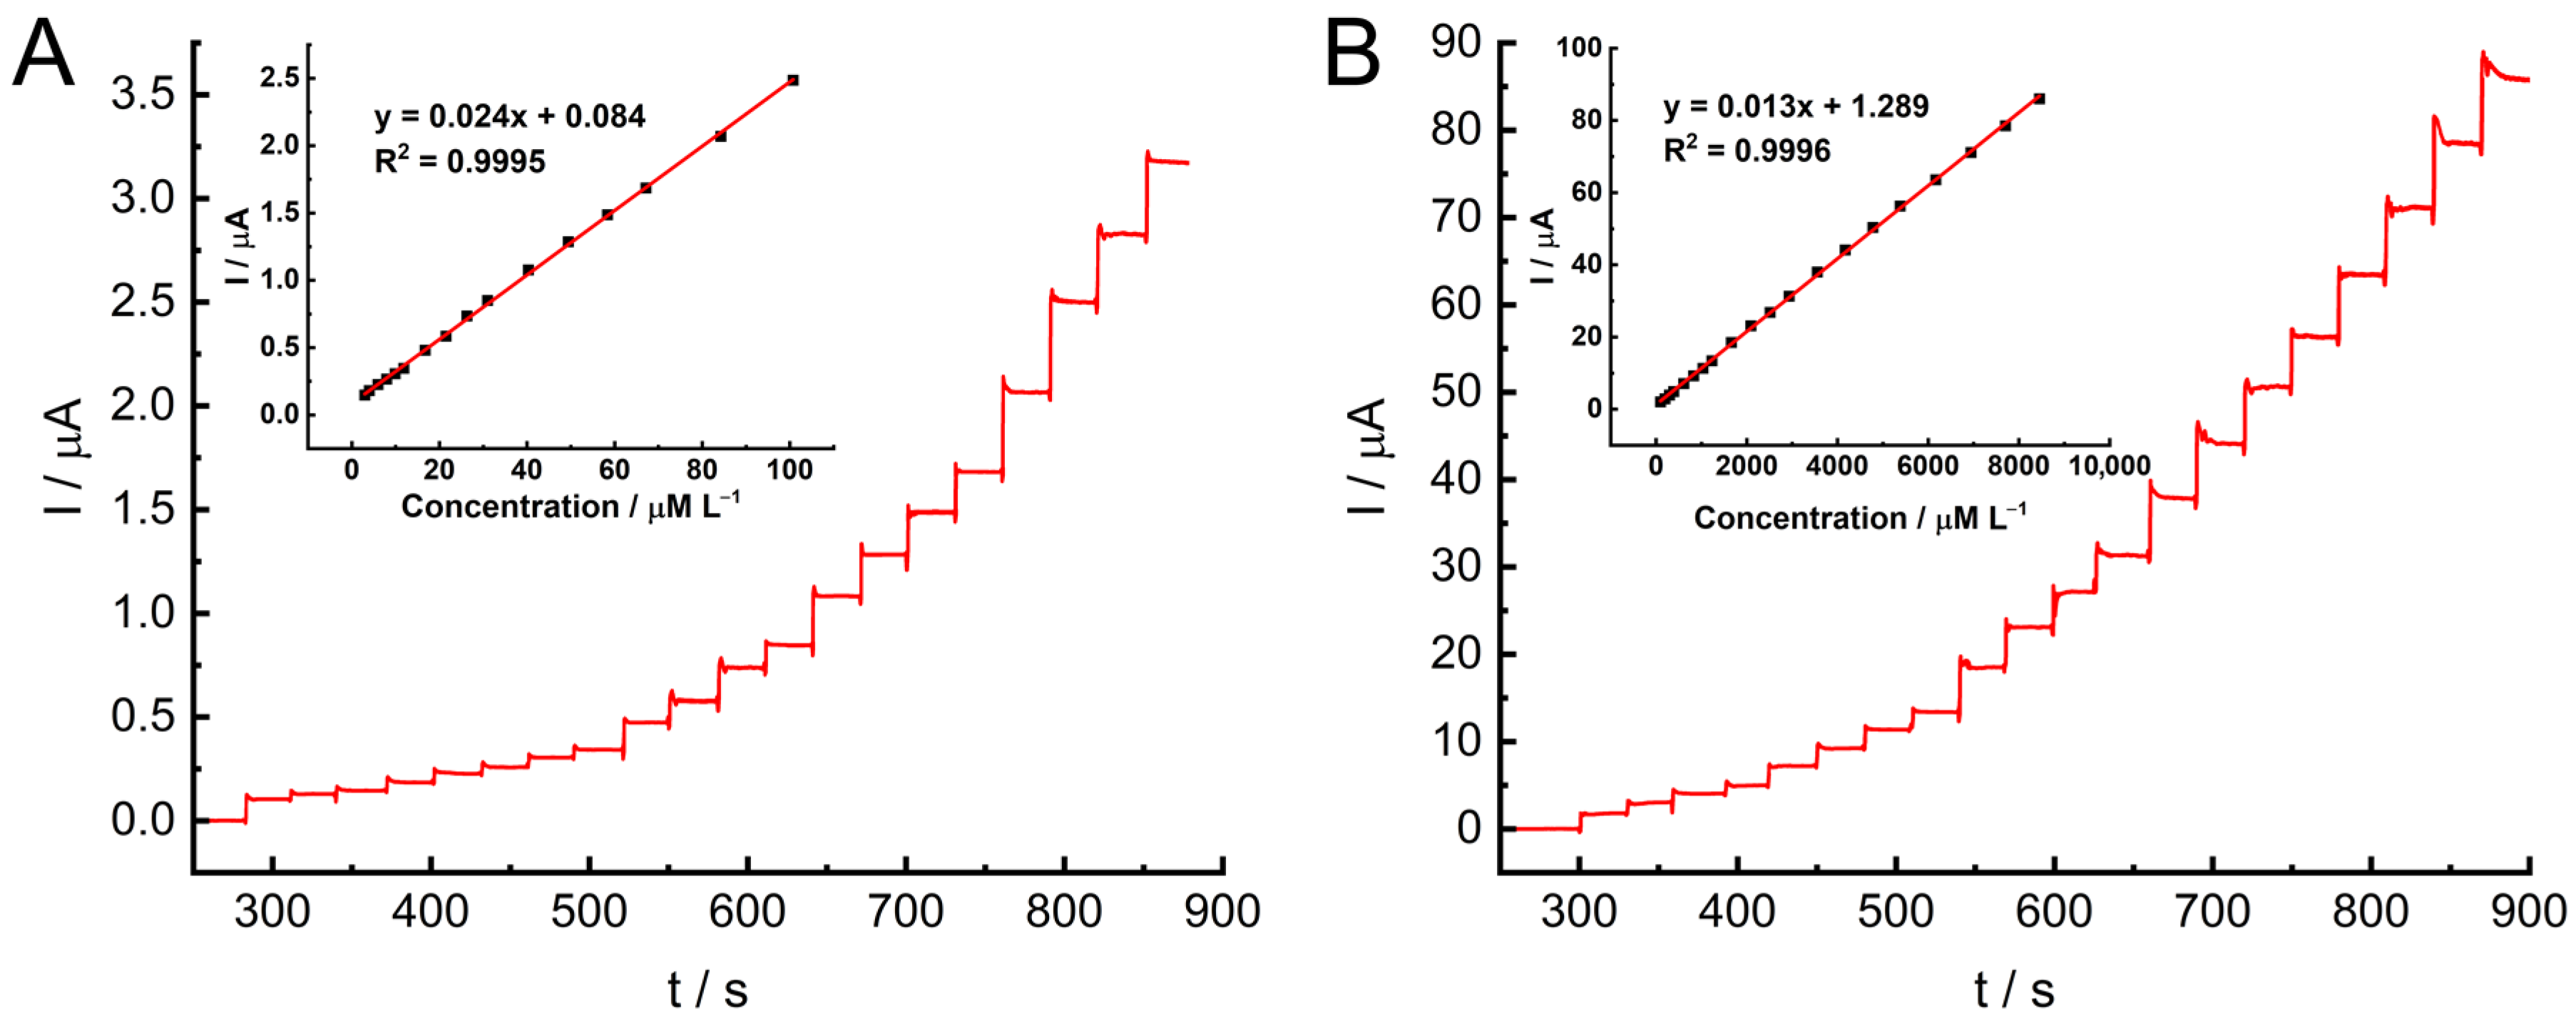
The chronoamperometric test was then performed at the GC electrode under optimized conditions in PB buffer at a constant stirring rate of 1000 rpm (
Figure 11). To ensure the precise determination of hydrazine during its electro-oxidization process, measurements were recorded at 0.0 V. For the experiments, two hydrazine injection ranges were used, i.e., 1–100 µM (
Figure 11A) and 100–10,000 µM (
Figure 11B). Four injections were consecutively applied at each concentration. In both ranges, the recorded response changed at different hydrazine concentrations and was almost linearly proportional to the hydrazine concentration in the electrolyte across the entire region. For concentrations ranging from 3.00 to 100 µM L
−1, the linear regression equation was determined as I (μA) = (0.024 ± 0.0001) C + (0.084 ± 0.0067), with an R
2 value of 0.9995. The limit of detection (LOD) was calculated to be 0.80 µM L
−1 using the formula LOD = (K × SD
a)/b, where K = 3.3 and b is the slope. The limit of quantification (LOQ) was found to be 2.42 µM L
−1 based on the equation LOQ = 3 × LOD. For the second linear range, 100–10,000 µM L
−1, the equation was I (μA) = (0.013 ± 0.00004) C + (1.289 ± 0.18057), with R
2 = 0.9996.
The existence of two linear ranges is presumably due to the adsorption of the hydrazine oxidation product on the electrode surface with increasing hydrazine concentration, which prevents further hydrazine diffusion [
1,
49,
96].
Table 1 presents noteworthy outcomes for the GC/MWCNT/LS/NPd electrode in comparison to other modified electrodes utilised for hydrazine detection. The electrode presented in this study exhibits a broader linear range and a significantly lower limit of detection than that of electrodes previously reported. Furthermore, our electrode demonstrates superior electrocatalytic performance in the detection of hydrazine at a lower working potential in the PB electrolyte. Previous studies have reported hydrazine detection at potentials ranging from 0.1 V to 0.5 V [
3,
7,
11,
30,
33,
49,
86,
97,
98,
99,
100,
101]. A significant advantage of the electrode design lies in its high level of sensitivity, equal to 0.166 µA µM
−1 cm
−2 according to the equation sensitivity = slope/active surface area.
We performed a repeatability and reproducibility study of the modified electrode for the determination of N
2H
4 through the use of chronoamperometry at a constant stirring rate of 1000 rpm. The electrolyte used was PB buffer, and the working potential was 0.0 V. In order to determine the repeatability on a single GC/MWCNT/LS/NPd electrode, five equal analyte determinations were conducted, each with a concentration of 50 μM N
2H
4 (
Figure S8). The relative standard deviation (RSD) was 3.8%, which did not significantly affect the analytical validity of hydrazine determination using the proposed electrode. The reproducibility of N
2H
4 determination was evaluated with five successive GC/MWCNT/LS/NPd electrodes that were prepared in an identical manner (
Figure S9). The recorded currents and the calculated RSD value of 6.5% indicate that the produced electrode exhibits excellent reproducibility.
Additionally, an investigation into the stability of the MWCNT/LS/NPd hybrid material was conducted in 0.05 M PB buffer (
Figure S10). A GC/MWCNT/LS/NPd electrode was prepared using a drop-casting method when the hybrid material was freshly synthesized. Subsequently, cyclic voltammetry was employed to record the electrode’s performance. The hybrid material was stored for two years in a dark glass vial filled with DMF. Then, the electrode was prepared and tested in the same way as before, recording the CV in 0.05 M PB buffer.
Figure S10 displays the cyclic voltammetry (CV) results of both electrodes, which demonstrate corresponding characteristics. Analogous mechanisms of palladium oxidation/reduction and hydrogen sorption/accumulation were observed correspondingly. The electrode material remained unchanged with no indication of degradation.
The next step was to investigate the interfering effect during hydrazine detection due to the presence of common interfering biological compounds and diverse ions that may be present in tap water samples, i.e., SO
42−, NO
2−, GLU, Na
+, NO
3−, and K
+ (
Figure S11). The GC/MWCNT/LS/NPd electrode was evaluated with the standard addition method, spiking 100 μM L
−1 of hydrazine into 1.0 mM L
−1 of each interfering substance. The recorded currents were compared with the current value recorded for 100 µM L
−1 of pure hydrazine. Based on the results, it was found that in the presence of 10 times higher concentrations of interfering substances, the detectability of hydrazine ranges from 98.9% to 100.5%. The anti-interference properties of the developed GC/MWCNT/LS/NPd modified electrode were found to be very satisfactory for detecting and determining hydrazine.
We also carried out a standard addition test to confirm the usefulness of the proposed electrode. Measurements was carried out in a 0.1 M KCl (pH ~ 7) electrolyte at an operating potential of 0.0 V. A concentration of 100 µM L
−1 of N
2H
4 was injected into the electrolyte, followed by an injection of 500 µM L
−1 of tap water. Then, five different concentrations of hydrazine (100, 200, 300, 400, and 500 µM L
−1) were injected into the electrolyte, and the current response was recorded. The results are summarised in
Table 2. The concentration of hydrazine detected was averaged from five repeated measurements and calculated using the regression equation I (μA) = (0.013 ± 0.00004) C + (1.289 ± 0.18057). The obtained recoveries range from 99.3 ± 1% to 100.5 ± 0.6%, indicating the high accuracy of the developed electrode.


