2.1. Structure and Morphology of MoS2/Graphite Composites with Different Ratios
The X-ray diffractograms of the anode materials with different composite ratios of MoS
2/graphite are shown in
Figure 1a, and it can be seen that all four composite anode materials show a crystal structure similar to the intrinsic MoS
2; the diffraction peaks shown in the figure (14.4° (002), 32.7° (100), 39.3° (103), 49.8° (105), and 58.3° (110)) all correspond to the diffraction peaks of the hexagonal crystal structure of molybdenum disulfide [
20]; and the peaks appear in perfect agreement when compared with the standard card PDF # 37-1492. Moreover, the peak positions and peak shapes of all diffraction peaks are clear, indicating that the composite anode material has high crystallinity and purity. In addition, a diffraction peak of varying intensity was observed at 26.5° in the diffractograms of the four MoS
2/graphite composites with different ratios, which proved the presence of graphite and coincided with the expected results that the intensity of this peak was decreasing as the percentage of graphite material in the composites decreased. In contrast, the intensity of the MoS
2 characteristic peak does not increase as its percentage increases, because the change in the intensity of the MoS
2 characteristic peak reflects the change in the number of layers of the two-dimensional material, which indicates that the number of layers of the MoS
2 material does not change after ball-milling [
21]. No other obvious spurious peaks were detected, indicating that no impurities were generated and the original structure of the composite was not destroyed during the ball-milling process. In addition, it can be seen in
Figure 1b that the characteristic peak of the MoS
2 material at 14.6° (2θ) has significantly shifted to the left after ball-milling, which further indicates that the ball-milling process may have made the crystallite size of the MoS
2 material larger. In contrast, the characteristic peak at 26.6° (2θ) of the graphite material after ball-milling has slightly shifted to the right, which indicates that the ball-milling process has no significant effect on the crystallite size of the graphite material.
The SEM images of graphite, intrinsic MoS
2 and MoS
2/graphite composite anode materials are shown in
Figure 2. The morphology of the intrinsic graphite material is a flattened sphere with a particle size of 9 μm (
Figure 2a), and the morphology of the intrinsic molybdenum disulfide material is a monodisperse nanolayer (
Figure 2b), which has the advantages of uniform particle size, high activity, a large specific-surface area, and a high sample-adsorption capacity [
22,
23]. By comparison, the morphology of the MoS
2/graphite composites was found to be significantly different from that of the intrinsic graphite material (
Figure 2a) and the intrinsic molybdenum disulfide material (
Figure 2b) [
24]. The graphite in its original flattened spherical form is dispersed into thin flake layers by a ball-milling process [
25], and the molybdenum disulfide is simultaneously ball-milled into flake structures. The lamellar graphite effectively enters between the MoS
2 flakes and mixes uniformly to form compacted aggregates. By comparing
Figure 2c–f, it can be found that with the increasing percentage of MoS
2, it can be observed that the lumpy particles are reduced and MoS
2 is uniformly dispersed. When the particle size of the graphite material is significantly reduced and the percentage of molybdenum disulfide reaches 80%, the particle size of the composite is mostly between 1–2 μm. By observation,
Figure 2f shows mostly flaky MoS
2 material, whose discharge capacity is expected to be enhanced by a large amount of molybdenum disulfide. Overall, the compounded MoS
2/graphite aggregates can effectively increase the contact area between the material and electrolyte, alleviate the agglomeration phenomenon, and improve the discharge capacity, but the excessive MoS
2 will reduce the cycling stability.
To further characterize the dispersion of MoS
2 material in MoS
2/graphite composites, EDS tests were conducted on four MoS
2/graphite composites with different ratios, and the test results are shown in
Figure 3. It is easy to see that with the increasing percentage of MoS
2, the Mo elements and S elements in the composites become more and more obvious, and in addition, it is obvious through the four graphs in
Figure 3 that the elements such as Mo, S, and C in the composites are uniformly distributed without any abnormal phenomena such as agglomeration, which indicates that the MoS
2 materials are very uniformly compounded with graphite materials and play a positive role in improving the electrochemical performance of the anode materials [
26].
2.2. Electrochemical Properties of MoS2/Graphite Composites with Different Proportions
Initial charge–discharge curves, various current-capacity tests, and cycling tests (0.05 C/1 C) were conducted on the prepared coin-cell in the voltage range of 0.05–3.00 V to study the electrochemical performance of MoS
2/graphite anode materials with different composite ratios. The test results with the contrast of graphite anode are shown in
Figure 4.
Figure 4a shows the activation performance of the MoS
2/graphite composite anode materials under the same test conditions, and the first discharge capacities of the MoS
2/graphite (20%:80%, 40%:60%, 60%:40%, and 80%:20%) composites were 542.127 mAh/g, 615.768 mAh/g, 787.463 mAh/g, and 832.699 mAh/g, respectively. The first discharge capacity of MoS
2/graphite composite increases as the percentage of molybdenum disulfide increases, with the highest discharge capacity, achieved when the percentage of molybdenum disulfide was 80%, which is approximately twice that of the intrinsic graphite material. Therefore, it can be concluded that the increase in the capacity of MoS
2/graphite composites is attributed to the presence of elemental sulfur in molybdenum disulfide [
27]. Graphite plays an important role in making up the difference in the conductivity of molybdenum disulfide in composites. The first Coulomb efficiencies of the MoS
2/graphite (20%:80%, 40%:60%, 60%:40%, and 80%:20%) composites with different ratios were 97.50%, 93.84%, 86.23%, and 87.84%, showing a decreasing trend due to the higher percentage of molybdenum disulfide in the composite; the more obvious is its volume expansion and structural collapse [
28].
Cycle performance is an important indicator to measure the electrochemical performance of lithium-ion batteries [
29].
Figure 4b shows that MoS
2:graphite = 20%:80% and MoS
2:graphite = 40%:60%, MoS
2:graphite = 60%:40%, MoS
2:graphite = 80%:20% in the voltage range of 0.05–3.00 V, the performance curve of 300 cycles of constant current charge/discharge under the condition of 1 C high rate. The results show that, with the increase in the proportion of MoS
2, the cycle performance of the composite material shows a trend of first increasing and then decreasing. After 300 cycles, when MoS
2:graphite = 40%:60%, the cycle-capacity retention rate is the best, and the cycle capacity is the highest at 58.328 mAh/g with 99.89% coulombic efficiency, showing that this composite ratio of electrodes has excellent reversibility. When MoS
2:graphite = 80%:20%, the initial capacity of the composite material is the lowest at 19.936 mAh/g, and the cycle capacity retention rate is also the worst (only 21.12%), which is far lower than the discharge capacity of the intrinsic graphite anode material. The reason is that when charging and discharging under high-rate conditions, due to the excessive proportion of molybdenum disulfide in the MoS
2/graphite composite material, the structure of the composite material is destroyed along with the intercalation and deintercalation of Li
+ [
30].
Figure 4c depicts the performance curves of the four composite materials under constant current charge and discharge conditions at 0.05 C. It can be concluded that the cycle capacity retention rate of MoS
2/graphite (20%:80%, 40%:60%, 60%:40%, and 80%:20%) composites shows a downward trend with the increase of the proportion of MoS
2 (99.80%, 85.67%, 79.97%, and 36.83%), and when MoS
2:graphite = 80%:20%, the capacity of the composite material is already much lower than that of the intrinsic graphite anode material. When MoS
2:graphite = 20%:80%, the discharge-specific capacity does not seem to change after cycling, and the cycle-capacity retention rate is as high as 99.80%, with 99.93% coulombic efficiency, which shows that a large number of graphite sheets are evenly distributed between the molybdenum disulfide sheets, which stabilizes the MoS
2/graphite composite structure and enabling the electrode to obtain excellent reversibility. When MoS
2:graphite = 80%:20%, the cycle performance is the worst, and the capacity retention rate is only 36.83%. Along with the decreasing percentage of C elements in MoS
2/graphite materials, the electrical conductivity and structural stability of the composites will continue to deteriorate, which is the reason for the decreasing trend of the cyclic capacity retention of the composites [
31].
For the practical application of lithium batteries, electrodes must have excellent reversible rate performance. The rate capability of both graphite and MoS
2/graphite electrodes was measured, ranging from low to high charge/discharge rates, i.e., 0.05, 0.1, 0.2, 0.5, and 1 C (Rated current capacity, and 1C charging or discharging means that the battery is fully charged or fully discharged within 1 h.), as illustrated in
Figure 4d. It can be found that when the charge and discharge test is performed under low-rate conditions, the composite material with a small proportion of molybdenum disulfide has a higher discharge capacity. When the charge/discharge rate increases, the MoS
2/graphite composite material shows poor stability, and its cycling capacity also shows a downward trend, which shows that the MoS
2/graphite composite material has poor adaptability to the change of charge/discharge current. The reason for this problem is inseparable from the characteristics of the molybdenum disulfide material itself, such as poor conductivity and an unstable structure during cycling. Solving this problem will be our next research project.
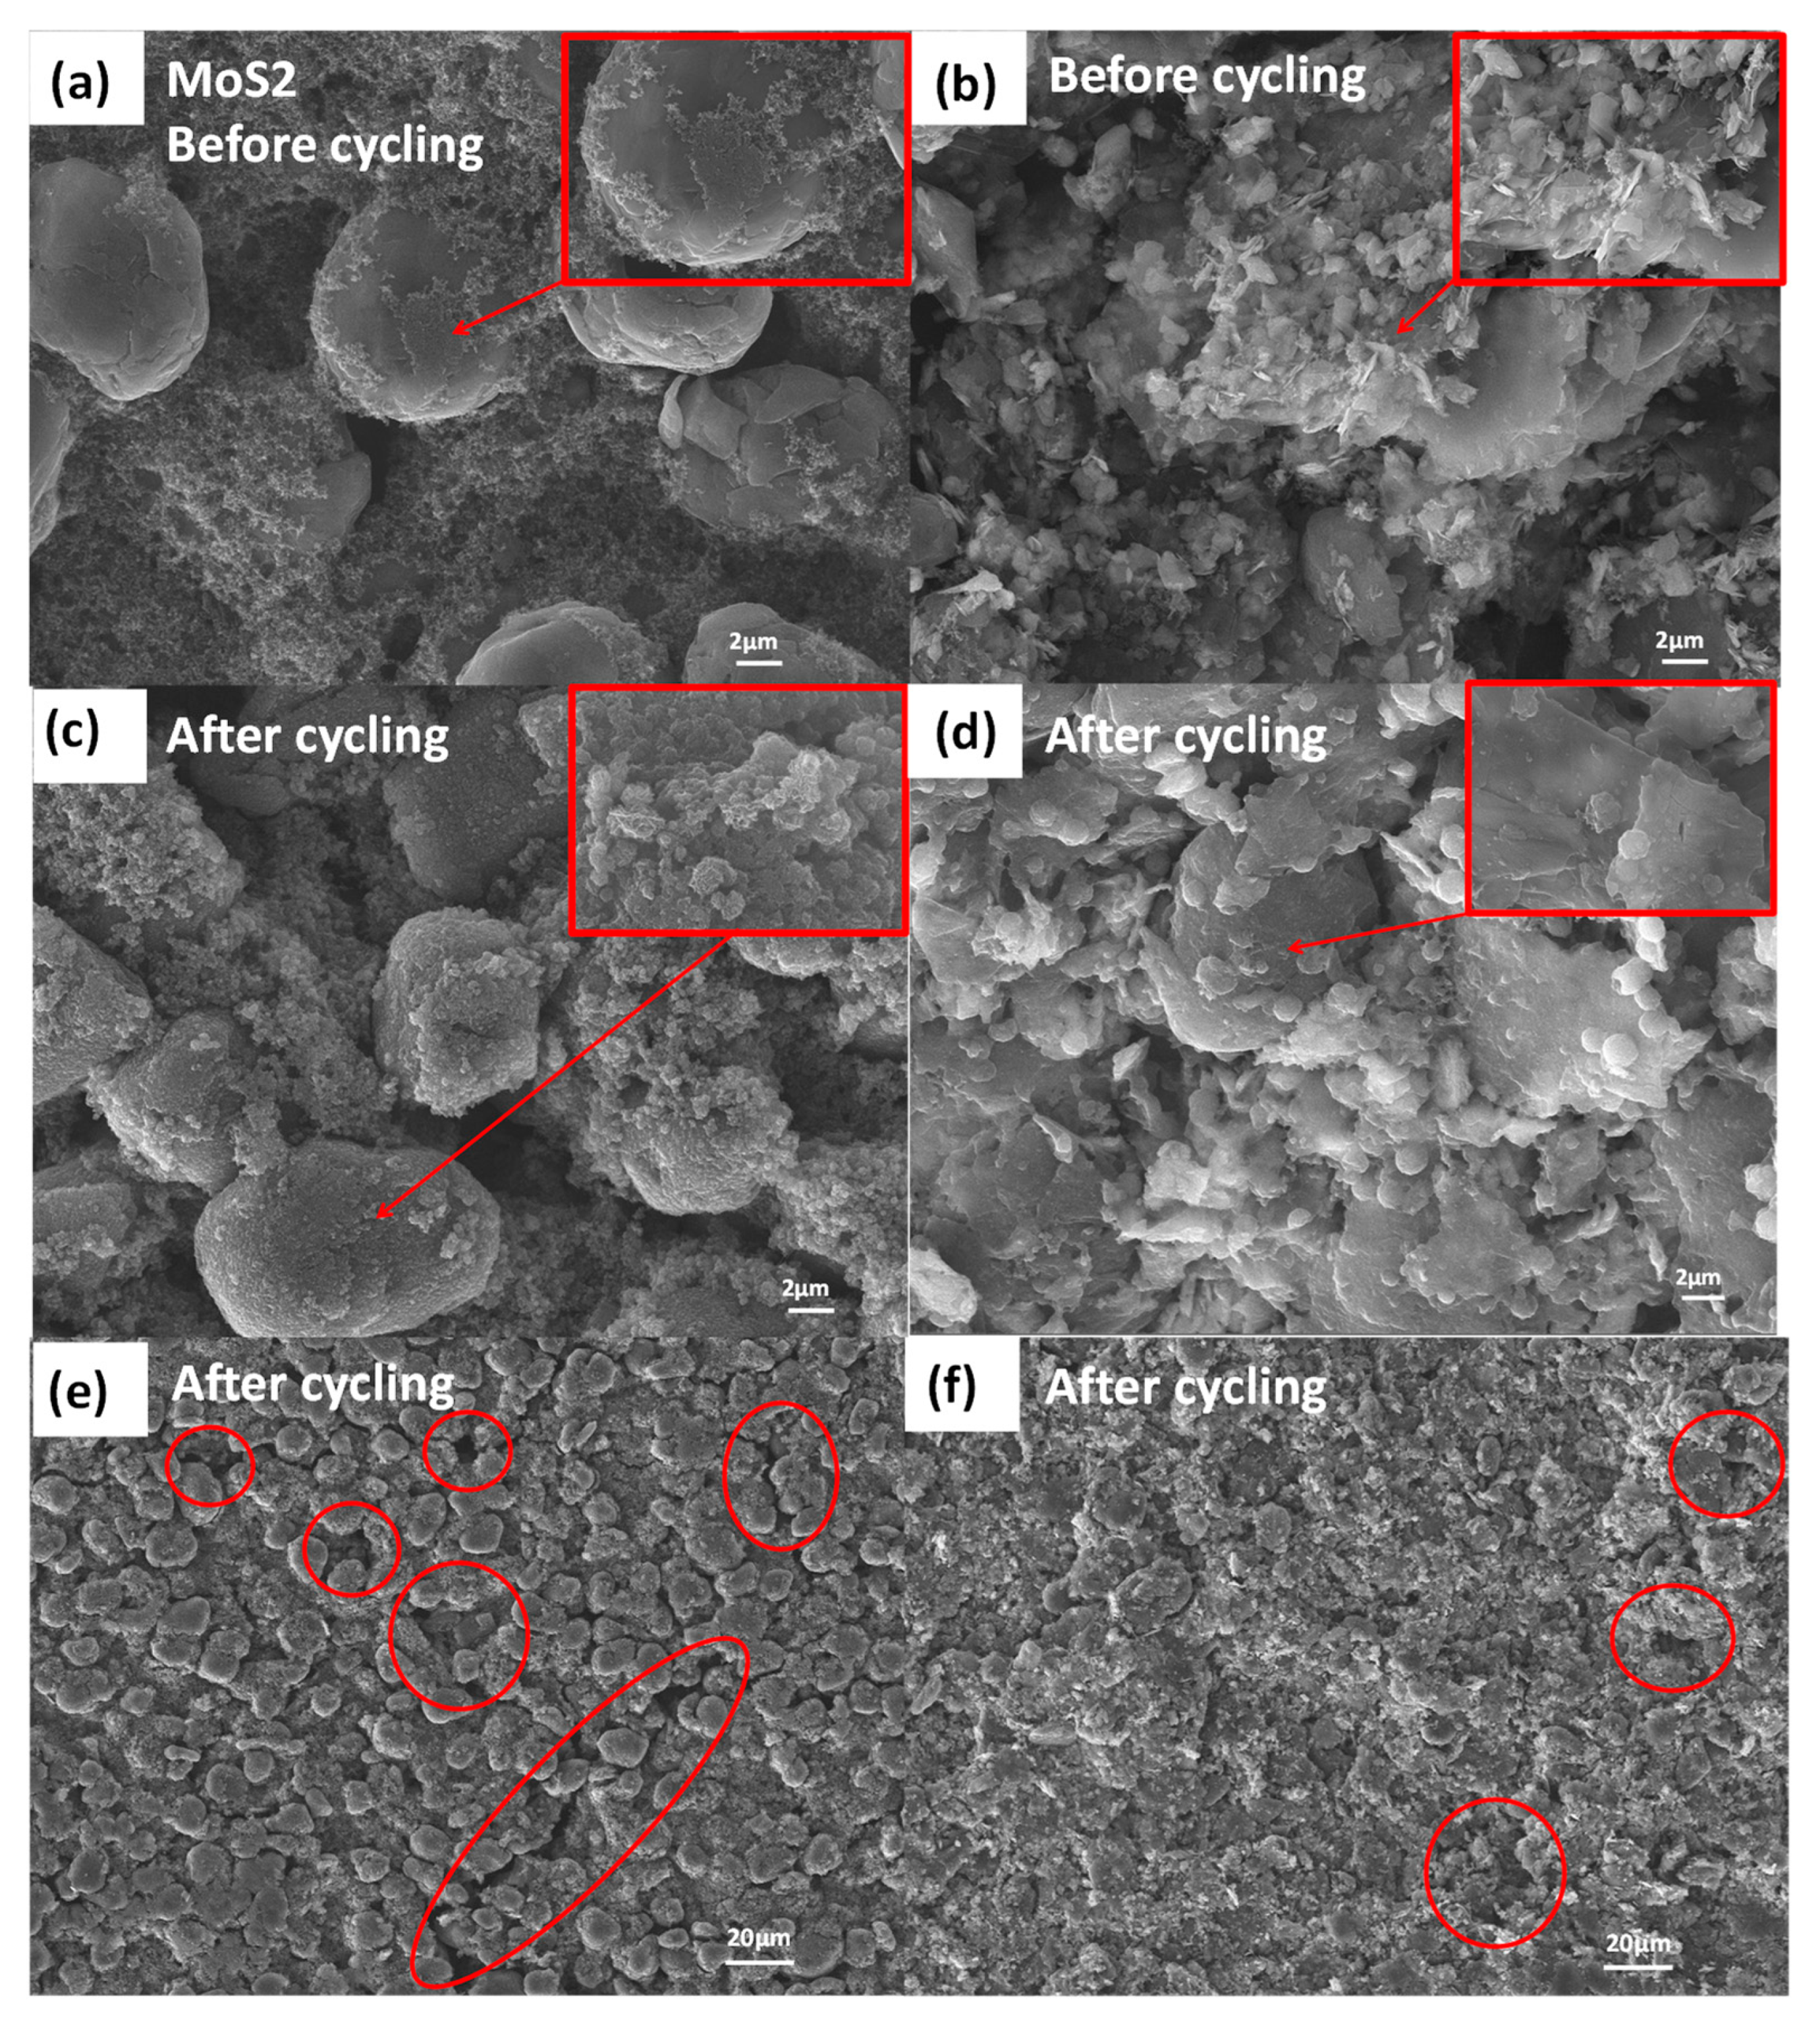
In order to explore the reasons for the decrease in the specific capacity of the graphite electrode and MoS
2/graphite composite electrode, SEM tests were conducted on the pole pieces before and after 300 cycles at 1 C rate, and the test results are shown in
Figure 5. We further analyzed that the graphite electrode flakes exhibit the morphological characteristics that the conductive agent uniformly adheres to the graphite material surface before cycling and the contact between them is excellent (
Figure 5a); the MoS
2/graphite composite electrode flakes exhibit a clear two-dimensional lamellar monodisperse structure, and this structure also allows the close contact between the active material and the conductive agent (
Figure 5b) [
32]. The decrease in the specific capacity of graphite electrode sheet after cycling can be attributed to the formation of a thick and rough SEI layer covering the surface of electrode material by the side reaction with electrolyte (
Figure 5c) [
33,
34]; meanwhile, along with the cyclic charging and discharging, more obvious cracks appear on the surface of graphite electrode (
Figure 5e), which will be very unfavorable to the contact between the active material and conductive agent [
35]. For the MoS
2/graphite composite electrode, the irreversibly grown SEI layer that forms is thinner and more stable (
Figure 5d), but the formation process also consumes a large amount of electrolyte, which leads to the electrolyte drying phenomenon and further decreases the specific capacity of the MoS
2/graphite composite electrode [
36,
37]. In addition, some cracks were also observed on the surface of the MoS
2/graphite composite electrode after cycling (
Figure 5f), and these cracks would deteriorate the contact between the active substance and the conducting agent, thus causing a sharp decrease in the specific capacity of the MoS
2/graphite composite electrode.
Figure 6a shows the cyclic voltammetry test curves of intrinsic graphite materials and MoS
2/graphite composites with four different ratios in the voltage range of 0.05–3.00 V. For the first cathodic process, the MoS
2/graphite electrode depicts cathodic peaks between 0.75–1.25 V and 1.50–2.00 V. The reduction peaks between 1.50 and 2.00 V can be attributed to the intercalation of Li
+ into the layered structure of MoS
2 to form Li
xMoS
2. The peak between 0.75 and 1.25 V is attributed to the conversion of Li
xMoS
2 [
38] into metallic Mo and Li
2S, respectively. The reaction process is shown in reaction Equation (1) and reaction Equation (2) [
39].
In the reverse anodic process, the MoS2/graphite composite material has an obvious oxidation peak in the voltage range of 2.25–3.00 V, which may be related to the oxidation of Li2S to S; the reaction process is shown in reaction Equation (3). In addition, a series of redox peak pairs between 0.05 and 0.27 V is related to the intercalation and exportation of Li+ on graphite interlayer carbon atoms.
The electrochemical impedance spectra (EIS) of graphite and MoS
2/graphite are shown in
Figure 6b. The intercept of the curve at high frequency with the axis corresponds to electrolyte resistance and contact resistance. The inset of
Figure 6b is the equivalent circuit of an EIS fitting; R
1 is the ohmic resistance of the electrode, and R
2 is the charge transfer resistance. CPE is an abbreviation for the constant phase elements. W
1 is the Warburg impedance [
40]. The R
1 value of the graphite and MoS
2:graphite = 20%:80%, 40%:60%, 60%:40%, and 80%:20% electrodes is calculated to be 4.73 Ω, 4.09 Ω, 5.39 Ω, 3.84 Ω, and 4.16 Ω, respectively, indicating that the ohmic resistance of the above electrodes in this study were very close and the errors in the preparation process were relatively small. According to the inserted equivalent circuit [
41], the R
2 value of the graphite and MoS
2:graphite = 20%:80%, 40%:60%, 60%:40%, and 80%:20% electrodes is calculated to be 19.57 Ω, 16.04 Ω, 106.89 Ω, 74.97 Ω, and 428.64 Ω. When MoS
2:graphite = 20%:80%, the charge-transfer impedance is the smallest, and its slope in the low-frequency region is the largest, indicating that the diffusion resistance of Li
+ in the electrode at this time is the smallest. It can be concluded that an appropriate amount of MoS
2 combined with a graphite material with better conductivity can have a synergistic effect to reduce the charge transfer resistance of the composite material and improve the diffusion efficiency of Li
+ [
42].


 ,
, 


