2.1. Seedling Morphological Responses to Drought in Selected Maize Genotypes
To examine the responses of selected maize genotypes to drought stress, the morphological responses of the tolerant lines A638, Grace-E5, Lo964, and Va35 along with the sensitive lines B73 and Lo1016 (
Table 1) to drought stress were measured every 3 days after induction (DAI) until 12 DAI for the drought treated and irrigated control samples at the V3-V4 growth stage. The drought stress was applied up to 9 DAI in the treated samples with a watered recovery period from 9 to 12 DAI. As expected, drought stress resulted in a visible loss of turgor with curling and wilting symptoms apparent in seedling leaves during the period of drought, and this phenotype gradually worsened with continuing decreases in soil water content (SWC) over time. The SWC was held consistent in the pots of all six maize lines at each time point throughout the drought treatments (
Figure S1). The sensitive lines exhibited more visible symptoms in response to drought treatments with increased flaccidity in seedling leaves from 3 to 9 DAI with the most obvious symptoms observed by 9 DAI, and with some seedlings dying during the course of the study. The tolerant lines, however, exhibited wilting symptoms later than the sensitive lines during the drought treatment.
Table 1.
Maize genotypes selected in this study.
Table 1.
Maize genotypes selected in this study.
| Genotypes | Pedigree | Origin | Tolerance to Drought | Reference |
|---|
| B73 | Recurrent selection population (C5) of Iowa Stiff Stalk Synthetic | Iowa, USA | Susceptible | [40,41,42] |
| Lo1016 | P3369A × Lo876o2 | Italy | Susceptible | [37,43,44] |
| A638 | (V3 × Wf9) × Wf9 | Minnesota, USA | Moderate | [45] |
| Lo964 | P3183 | Italy | Tolerant | [37,43,44] |
| Va35 | (C103 × T8) × T8 | Virginia, USA | Tolerant | [46,47] |
| Grace-E5 | – | CIMMYT, Mexico | Tolerant | [48] |
Following the irrigated recovery period from 9 to 12 DAI, the tolerant lines displayed relatively stronger growth recovery from drought stress with only about half of the sensitive line plants survived. The growth rates of the seedlings were also measured during the course of the experiment. The growth rates up to 3 DAI were higher than those observed at 6 and 9 DAI under drought treatment conditions in all the lines (
Figure S2). Although the growth rates of the six maize lines showed the same decreasing trend during the progressive water deficit treatment, the growth rates of sensitive lines B73 and Lo1016 reached 0 at 6 DAI, but the other lines stopped growing at 9 DAI (
Figure S2). After 3 days of recovery from water deficit stress, the growth rate of all lines remained unchanged. Leaf relative water content (LRWC) was also examined in samples at 2 days prior to drought treatment (noted as “−2 DAI”). The LRWC decreased at 3 DAI, and continued to decrease at 6 and 9 DAI, with the LRWC of the tolerant lines Va35 and Grace E-5 being significantly higher than that of the sensitive lines B73 and Lo1016, especially at 9 DAI (
Figure S3).
2.2. Changes of Chlorophyll Content and Photosynthesis Parameters in Response to Progressive Drought Stress and Recovery
To determine the influence of drought stress on photosynthetic capacity, leaf chlorophyll content and photosynthetic parameters were investigated. The chlorophyll content of B73 and Lo1016 was significantly lower than that observed in the other four lines under the non-stressed condition (
Figure S4). Although chlorophyll content was decreased following the drought treatments for the six maize lines, the chlorophyll content of stressed B73 and Lo1016 leaves was significantly lower than that of moderately tolerant and tolerant lines at 3 and 6 DAI. The tolerant lines and A638 have higher chlorophyll content under drought stress than the susceptible lines under drought or irrigated conditions at 9 DAI, and stress recovery for 3 additional days did not result in an obvious increase in chlorophyll content (
Figure S4).
Four maize lines, including sensitive lines B73 and Lo1016 and tolerant lines Lo964 and Va35, were selected to investigate their photosynthesis parameters in leaves, soil water deficit decreased the leaf photosynthesis rate (P
n) (
Figure 1A). The influence of drought stress on P
n in B73 and Lo1016 was more rapid than that of Lo964 and Va35. In B73 and Lo1016, P
n decreased by 85.3% and 88.4%, respectively, by 9 DAI relative to the well-watered controls while P
n had decreased by 74.9% and 76.0% in Lo964 and Va35, respectively. After 3 days of stress recovery (12 DAI), P
n was restored to only 49.0% and 40.3% of the level of the non-stressed controls for B73 and Lo1016, respectively, compared to 69.4% and 65.2% in Lo964 and Va35.
A similar pattern occurred in the stomatal conductance (G
s) of the sensitive and tolerant lines in response to drought stress (
Figure 1B). The P
n and G
s for Lo964 and Va35 were higher than those observed in B73 and Lo1016 throughout the water deficit treatment and stress recovery periods. Intercellular CO
2 concentration (C
i) increased with drought treatment, and the highest C
i was observed for drought-treated Lo1016 and B73 at 9 DAI, which had a larger increase in C
i in the drought treatment in comparison to their respective well-watered controls in contrast to Lo964 and Va35 which showed a slight increase during the progressive drought treatment (
Figure 1C). However, all the selected lines did not show a marked difference in C
i following stress recovery. In addition, the drought stress treatment significantly decreased the transpiration rate (T
r) in all the six lines during progressive water deficit stress (
Figure 1D). However, B73 and Lo1016 showed a rapid initial decrease in T
r while Lo964 and Va35 showed a gradual, progressive decrease in T
r during the process of water deficit treatment.
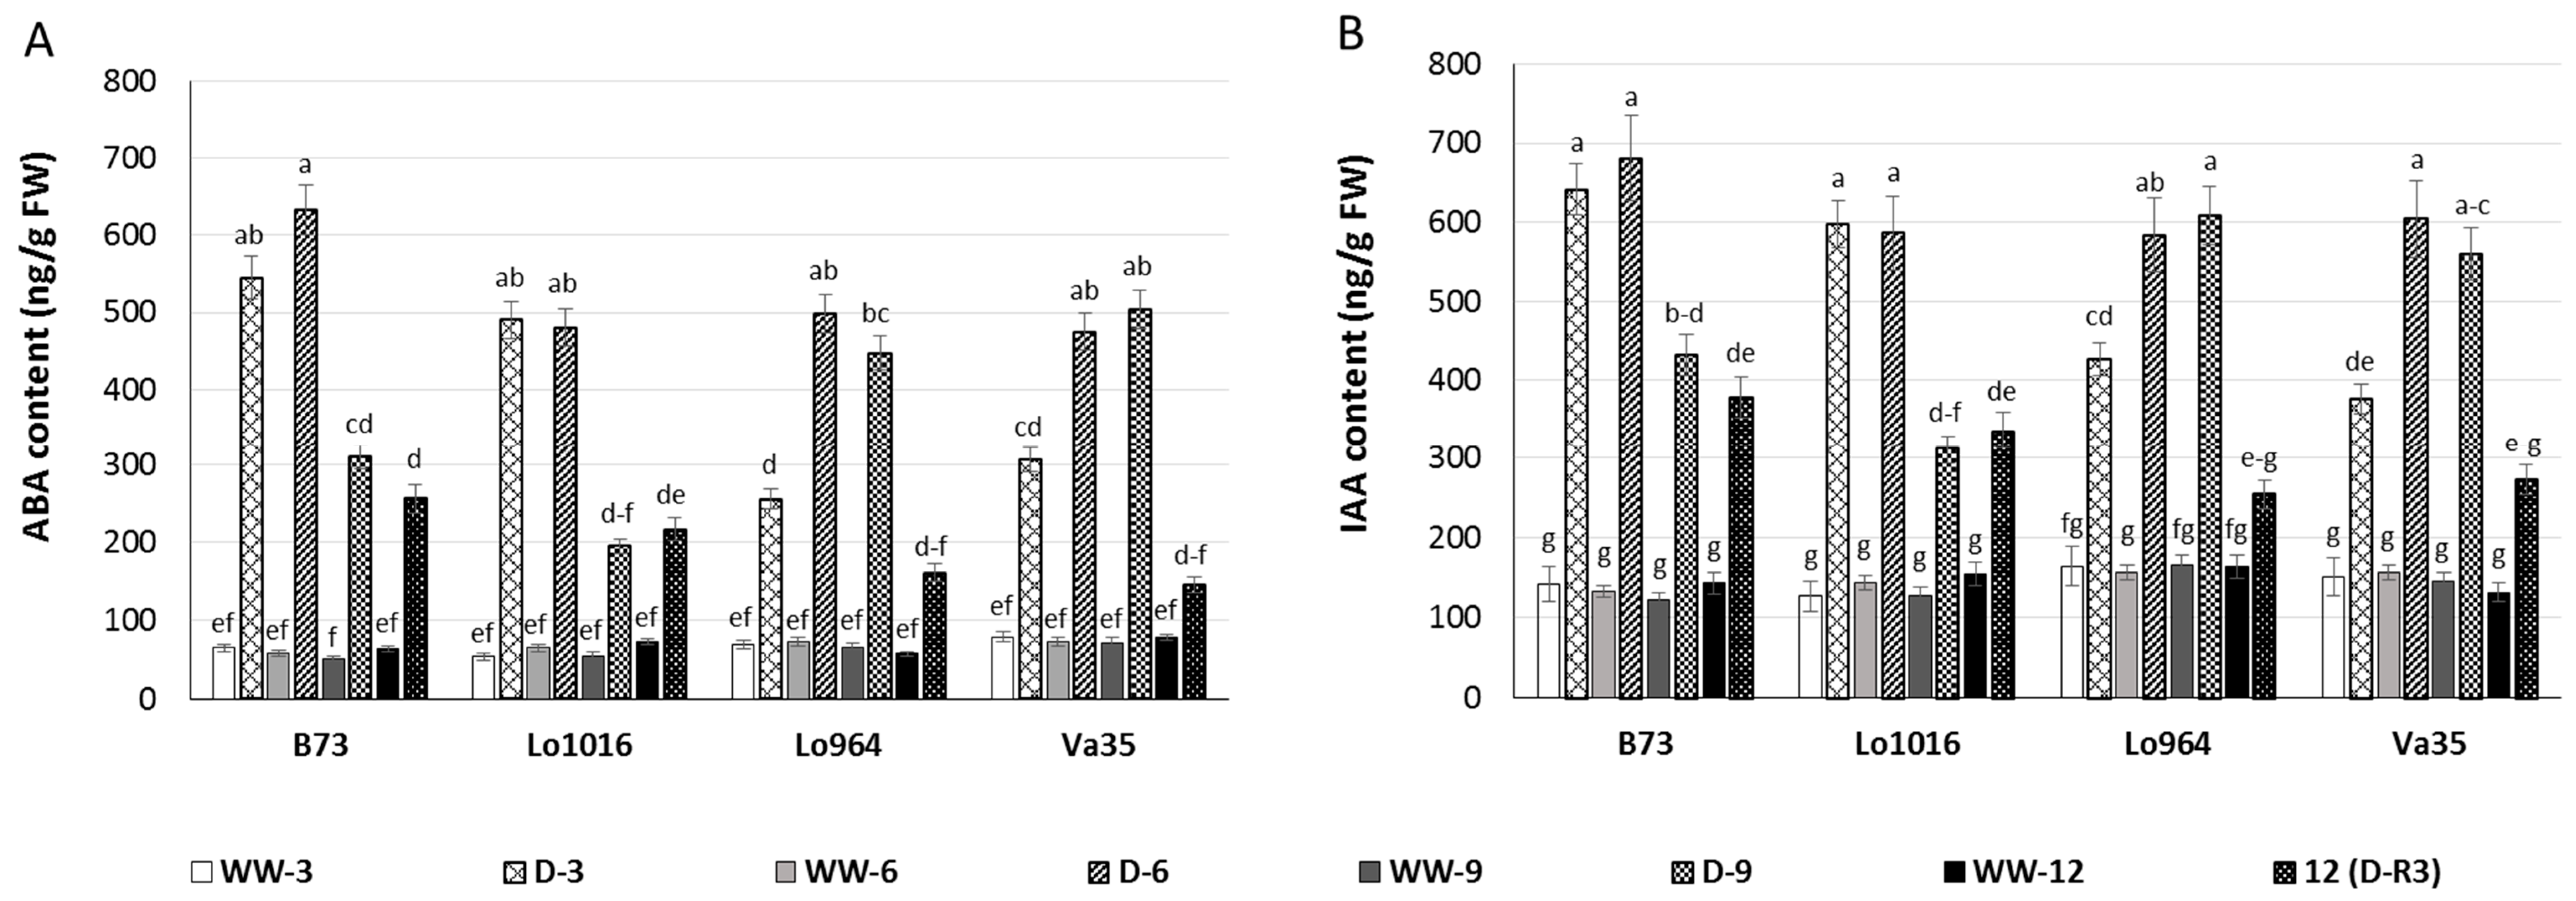
2.3. Drought Responses of Abscisic Acid (ABA) and Indole-3-Acetic Acid (IAA) Contents
Abscisic acid (ABA) and indole-3-acetic acid (IAA) are important phytohormones in plant responses during drought stress and development [
49,
50], therefore, subsequent changes of ABA and IAA contents in maize seedling leaves under drought stress were determined. Drought-stressed maize leaves exhibited higher ABA content than ones under well-watered conditions. At 3 and 6 DAI, drought-stressed B73 and Lo1016 presented a sharp rise in ABA contents, then a significant decrease with ongoing stress compared to the well-watered controls (
Figure 2A). However, the ABA contents displayed a progressively increasing trend for Lo964 and Va35 during continued drought induction, and recovery did not reduce ABA contents to the level of well-watered controls (
Figure 2A). Drought stress induced an increase of IAA content in maize seedling leaves. IAA contents gradually increased at 3 to 9 DAI of drought stress, and drought recovery decreased the IAA contents close to the level of well-watered plants in the tolerant lines (
Figure 2B). For B73 and Lo1016, IAA contents increased dramatically at 3 to 6 DAI, and then decreased at 9 DAI, but IAA levels did not recover to the level of well-watered plants (
Figure 2B).
Figure 1.
Photosynthetic parameters of seedling leaves from the sensitive genotypes, B73 and Lo1016, and the tolerant ones, Lo964 and Va35, under well-watered (WW) and drought stressed (D) conditions. Photosynthetic metrics were measured in sensitive and tolerant genotypes during drought stress and post-recovery including Pn (A), Gs (B), Ci (C), and Tr (D) measured from 9:00 to 11:00 in the morning for every collection time, at day zero (0), 3, 6, 9 or 12, on young leaves. Different letters indicate significant differences (p < 0.05) based on Tukey’s test between control and treatments and between different treatment times. Data represent the mean ± SD of three or more replicates.
Figure 2.
ABA and IAA content in maize seedling leaves under well-watered (WW) and drought (D) conditions. Phytohormone levels were measured in sensitive and tolerant genotypes over drought stress and recovery including ABA (A); and IAA (B). Different letters indicate significant differences (p < 0.05) based on Tukey’s test between control and treatments and between different treatment times. Data represent the mean ± SD of three or more replicates.
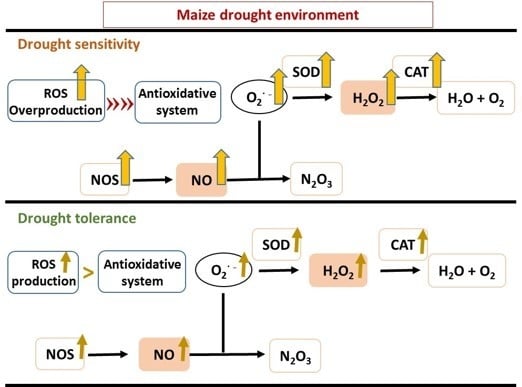
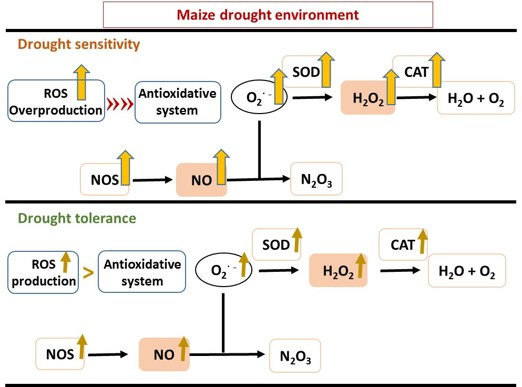
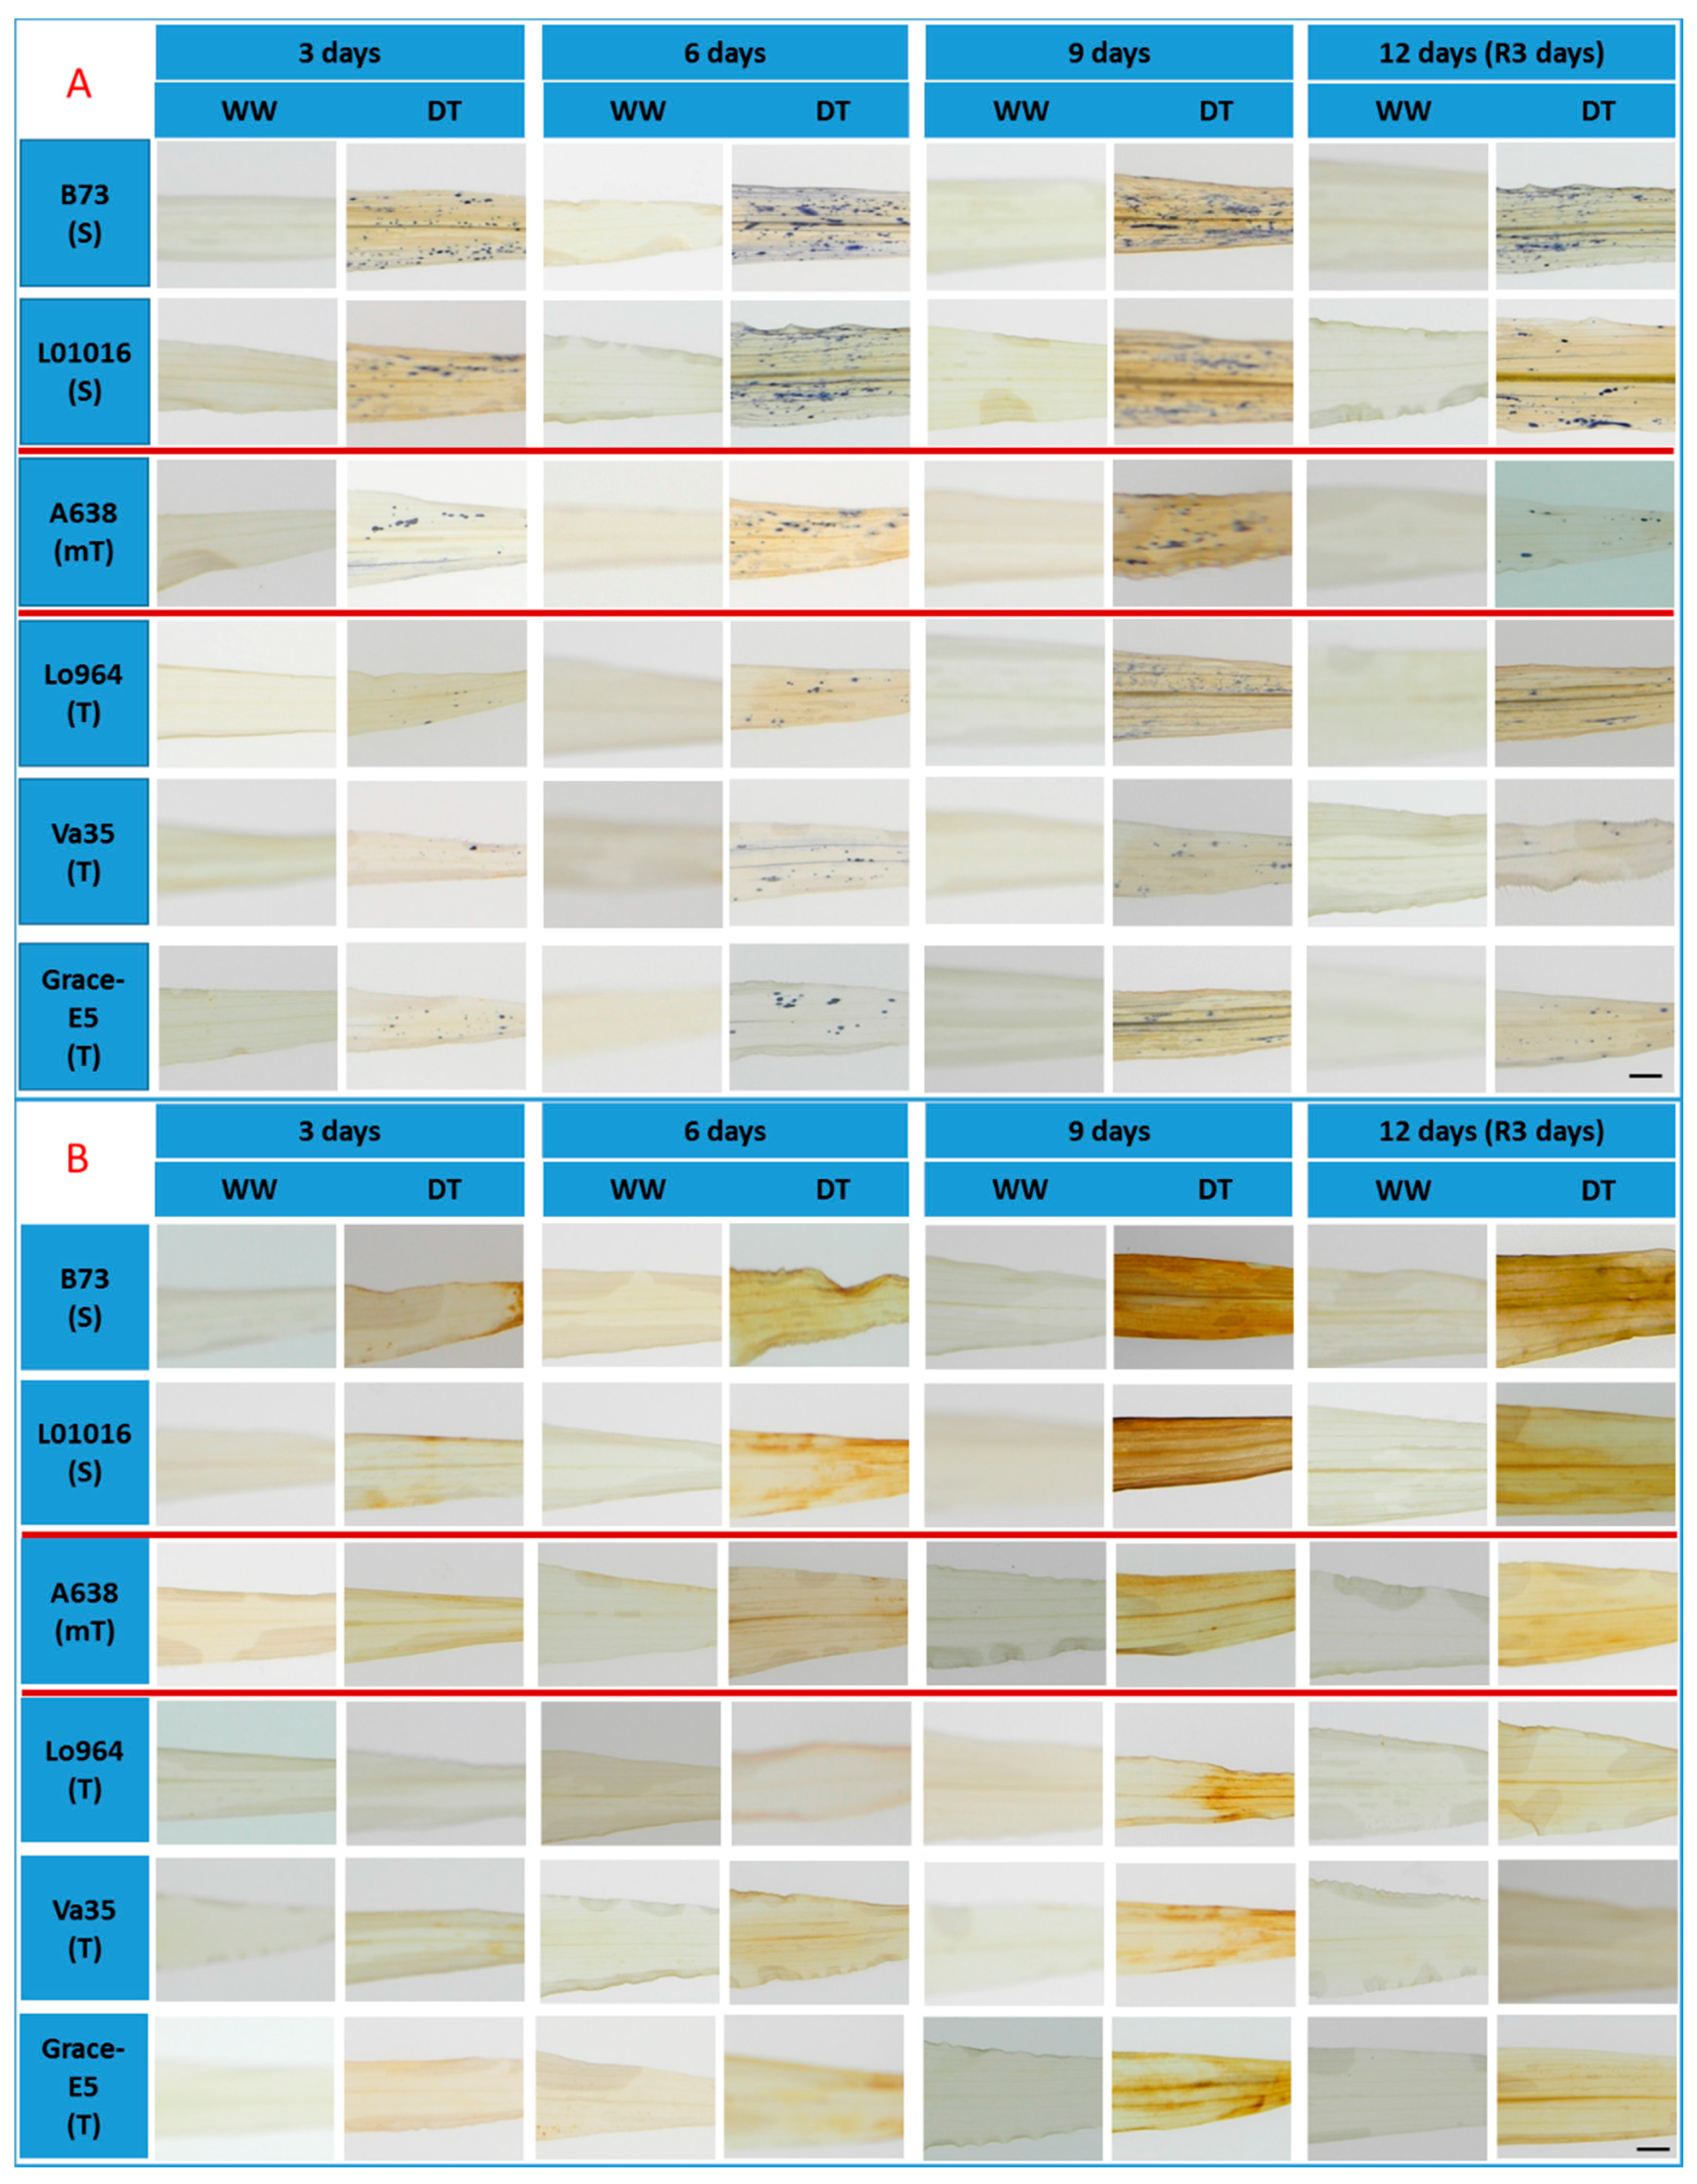
2.4. Effect of Drought Stress on ROS Metabolism
Detection of O
2·− through the use of Nitroblue Tetrazolium Chloride (NBT) staining indicated that B73 and Lo1016 accumulated much more O
2·− than A638, Lo964, Va35, and Grace E-5 over time in response to drought stress (
Figure 3A). Although recovery decreased the content of O
2·− in the leaves of B73 and Lo1016, the O
2·− quantities were still higher than that of A638, Lo964, Va35, and Grace E-5 (
Figure S5A). Specifically, B73 and Lo1016 accumulated approximately 2.5 times more O
2·− in their leaves in comparison to Lo964 and Va35 (
Figure S5A). Time-course detection of H
2O
2 accumulation using 3,3′-diaminobenzadine (DAB) staining in the leaves revealed that no obvious changes in well-watered controls, whereas H
2O
2 content increased progressively in drought-induced leaves over time with B73 and Lo1016 accumulating more H
2O
2 than Lo964, Va35 and Grace E5 which is consistent with microscopy observations. Also, the moderately resistant line A638 showed more H
2O
2 accumulation than Lo964, Va35 and Grace E5, but less than B73 and Lo1016 (
Figure 3B and
Figure S5B). These results showed that stress occurred in the leaves of maize seedlings under drought treatment conditions causing severer oxidative stress for sensitive and moderate lines than for tolerant ones.
The activities of two key antioxidant enzymes, superoxide dismutase (SOD) and catalase (CAT) were measured to determine their roles in defense during drought treatments. It was found that the antioxidant enzyme activities were enhanced in response to oxidative stress in the examined drought stressed maize lines (
Figure 4A,B). Specifically, SOD activity in the leaves of B73 and Lo1016 increased by 2-fold immediately after drought treatment for 3 days then decreased gradually at 6 and 9 DAI. However, SOD activity increased by 1.3, 1.6, and 1.6 folds in Lo964 and Va35 at 3, 6 and 9 DAI, respectively, displaying a progressive increasing trend. But, SOD activities in A638 and Grace E-5 were induced at a high level at 3 and 6 DAI, and then decreased at 9 DAI (
Figure 4A). The CAT activities displayed a rapid increase and then a slight drop after drought treatment for 3, 6 and 9 DAI by 3.4, 3.6 and 2.7 folds in B73 and Lo1016. The remaining lines displayed a gradually increasing pattern in CAT activities (
Figure 4B). Although drought recovery reduced the activities of SOD and CAT, they remained higher in the drought stressed plants than in the well-watered controls.
2.5. NO Production and RNS-Related Enzyme Activities during Drought Stress
An NO-specific fluorescent probe, 4-amino-5-methylamino-2ʹ,7ʹ-difluorofluorescein diacetate (DAF-FM DA), was used to monitor the endogenous NO production in the leaves of the six maize lines. Significant changes in NO content were observed between lines with contrasting drought sensitivity at 3 and 9 DAI and 3-day recovery (
Figure 5). Normal irrigated plants had the weak NO fluorescence during 12-day period, but drought stress resulted in an increase of NO fluorescence intensity. Significant increases in NO accumulation were observed at 3 and 6 DAI with the most significant NO accumulation observed at 6 DAI. Slight decreases were also observed at 9 DAI in the leaves of B73 and Lo1016 and moderately tolerant A638. However, drought stress induced a gradual increase in NO accumulation from 3 to 9 DAI in Lo964, Va35 and Grace E-5 (
Figure 5).
Figure 3.
Visualization of superoxide radical and hydrogen peroxide in the leaves of maize plants under well-watered (WW) and drought stressed (DT) conditions. Endogenous O2·− levels were monitored by staining O2·− using a Nitro blue tetrazolium (NBT) staining method (A); and the endogenous H2O2 level was monitored by staining H2O2 using 3,3′-diaminobenzidine tetrahydrochloride hydrate (DAB) (B). Scale bar in (A,B), 5 mm.
Figure 4.
Effects of drought treatments on SOD and CAT activities in maize seedling leaves. The activities of ROS-remediating enzymes were measured in sensitive and tolerant genotypes over drought stress and recovery including SOD (A) and CAT (B). Different letters indicate significant differences (p < 0.05) based on Tukey’s test between control and treatments and between different treatment times. Data represent the mean ± SD of three or more replicates.
Figure 5.
Visualization of nitric oxide (NO) in maize leaf tissues subjected to drought stress. Endogenous NO levels was monitored in maize leaves by staining NO using DAF-FM diacetate, and displayed by green fluorescence; the red fluorescence represents the chlorophyll intensity. WW refers to well-watered leaves; DT refers to drought treated leaves of all tested maize genotypes. Scale bar, 5 mm.
Quantitative analyses showed that the intensity of NO accumulation in the leaves of well-watered control maize plants were relatively constant during the 12-day period. An early burst of NO at 3 DAI was around 1.5-fold higher in the sensitive lines B73 and Lo1016 and moderately tolerant A638 than in the tolerant lines Lo964, Va35 and Grace E-5, and then reached to about 2.1-fold higher at 6 DAI. The NO content displayed a gradually increased trend in the tolerant lines Lo964, Va35 and Grace E-5 in response to drought, though not as much as determined in the sensitive lines B73 and Lo1016 and moderately tolerant A638 (
Figure S6). This increasing trend of NO accumulation is consistent with that of O
2·− and H
2O
2 in B73 and Lo1016 under drought stress. Lo964, Va35 and Grace E-5 illustrated the same response profiles in NO, O
2·− and H
2O
2 accumulation under drought treatment conditions. For the moderately tolerant line A638, the response pattern of gradual increasing at 3–6 DAI and slight decreasing at 9 DAI for NO accumulation is different from the gradually increasing trend at 3–9 DAI for O
2·− and H
2O
2 under drought stress conditions (
Figure 3 and
Figure 5).
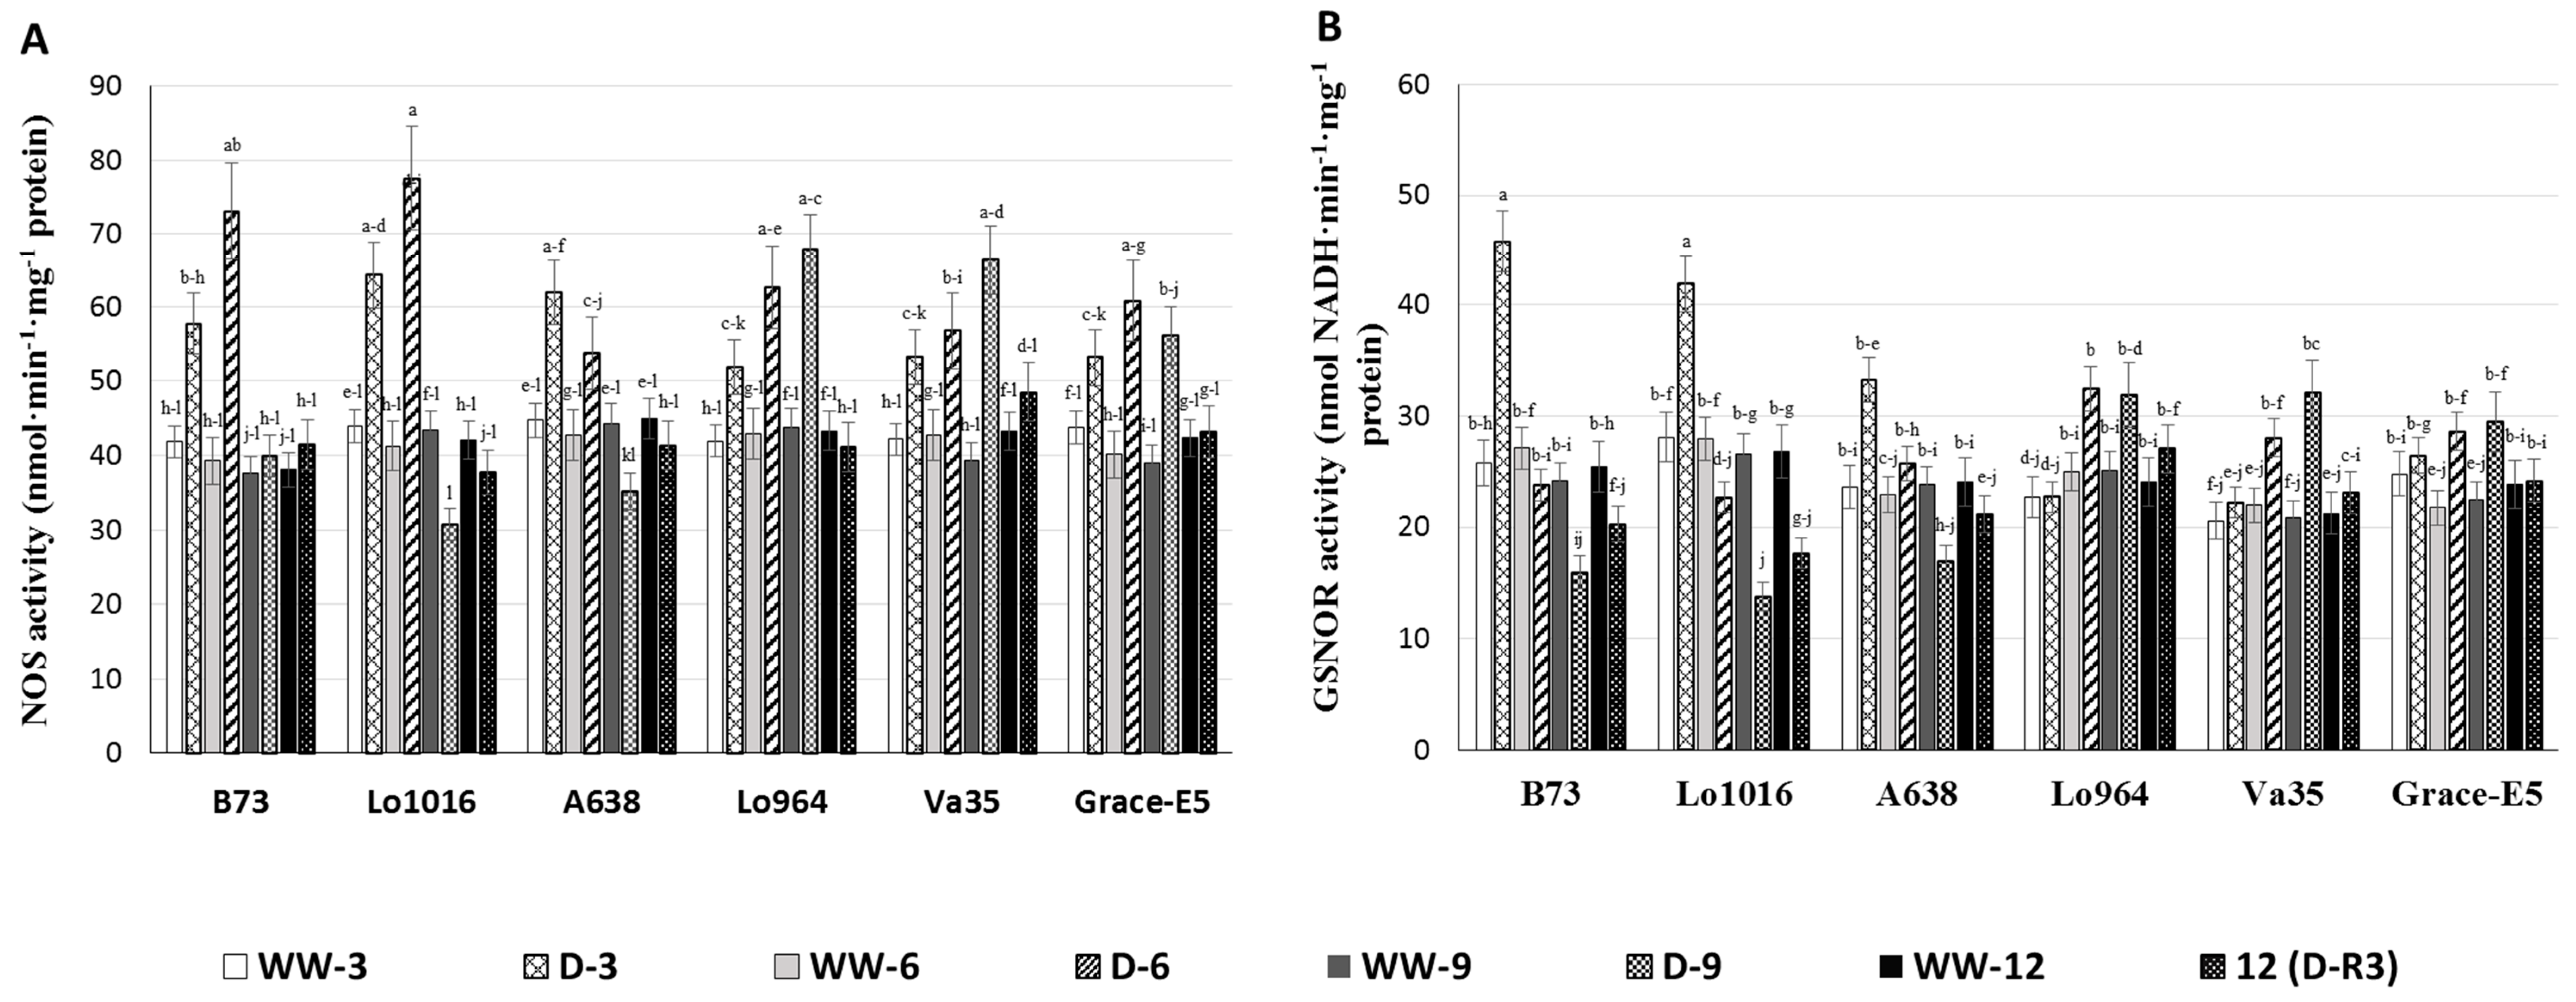
Nitric oxide synthase (NOS) serves as a key enzyme for NO biosynthesis [
51,
52]. To examine the contribution of NOS to the drought-induced NO burst previously observed in the maize seedling leaves, we measured NOS activity in the lines during drought stress. NOS activities were found to vary significantly among the lines under drought stress (
Figure 6A). The lines B73 and Lo1016 had significantly higher NOS activities than Lo964, Va35 and Grace E-5 at 3 and 6 DAI. Drought treatment triggered significantly elevated NOS activity at 3 and 6 DAI in B73 and Lo1016, 1.5- and 2.0-fold, respectively, which then reduced to levels similar to the well-watered controls at 9 DAI. In contrast, the NOS activities in Lo964, Va35 and Grace E-5 exhibited a slight increasing trend after drought treatment. After stress recovery, NOS activities declined to levels similar to those of the well-watered controls (
Figure 6A).
Figure 6.
The NOS and GSNOR activities in maize seedling leaves under well-watered (WW) and drought (D) conditions. Nitrosative stress-related enzyme activities were measured in sensitive and tolerant genotypes over drought stress and recovery including NOS (A); and GSNOR (B). Different letters indicate significant differences (p < 0.05) based on Tukey’s test between control and treatments and between different treatment times. Data represent the mean ± SD of three or more replicates.
S-nitrosoglutathione reductase (GSNOR), as a RNS-scavenging enzyme, can control NO levels, regulate
S-nitrosylation of proteins by modifying cysteine residues using NO, and reduce the content of
S-nitrosoglutathione (GSNO) [
22,
53]. The GSNOR activity in drought treated B73, Lo1016, and A638 increased rapidly up to 1.9, 1.5 and 1.3 folds higher than that of the well-watered controls at 3 DAI, respectively, then dropped to below the levels of the well-watered controls at 6 and 9 DAI. Three days after a recovery irrigation, GSNOR activities were not restored to normal levels found in the controls (
Figure 6B). Conversely, GSNOR activities in Lo964, Va35, and Grace E-5 did not display significant changes at 3 DAI, then exhibited slight and gradual increasing profiles at 6–9 DAI compared to the controls, and 3-day recovery decreased the GSNOR activities to the same level as that of well-watered plants.
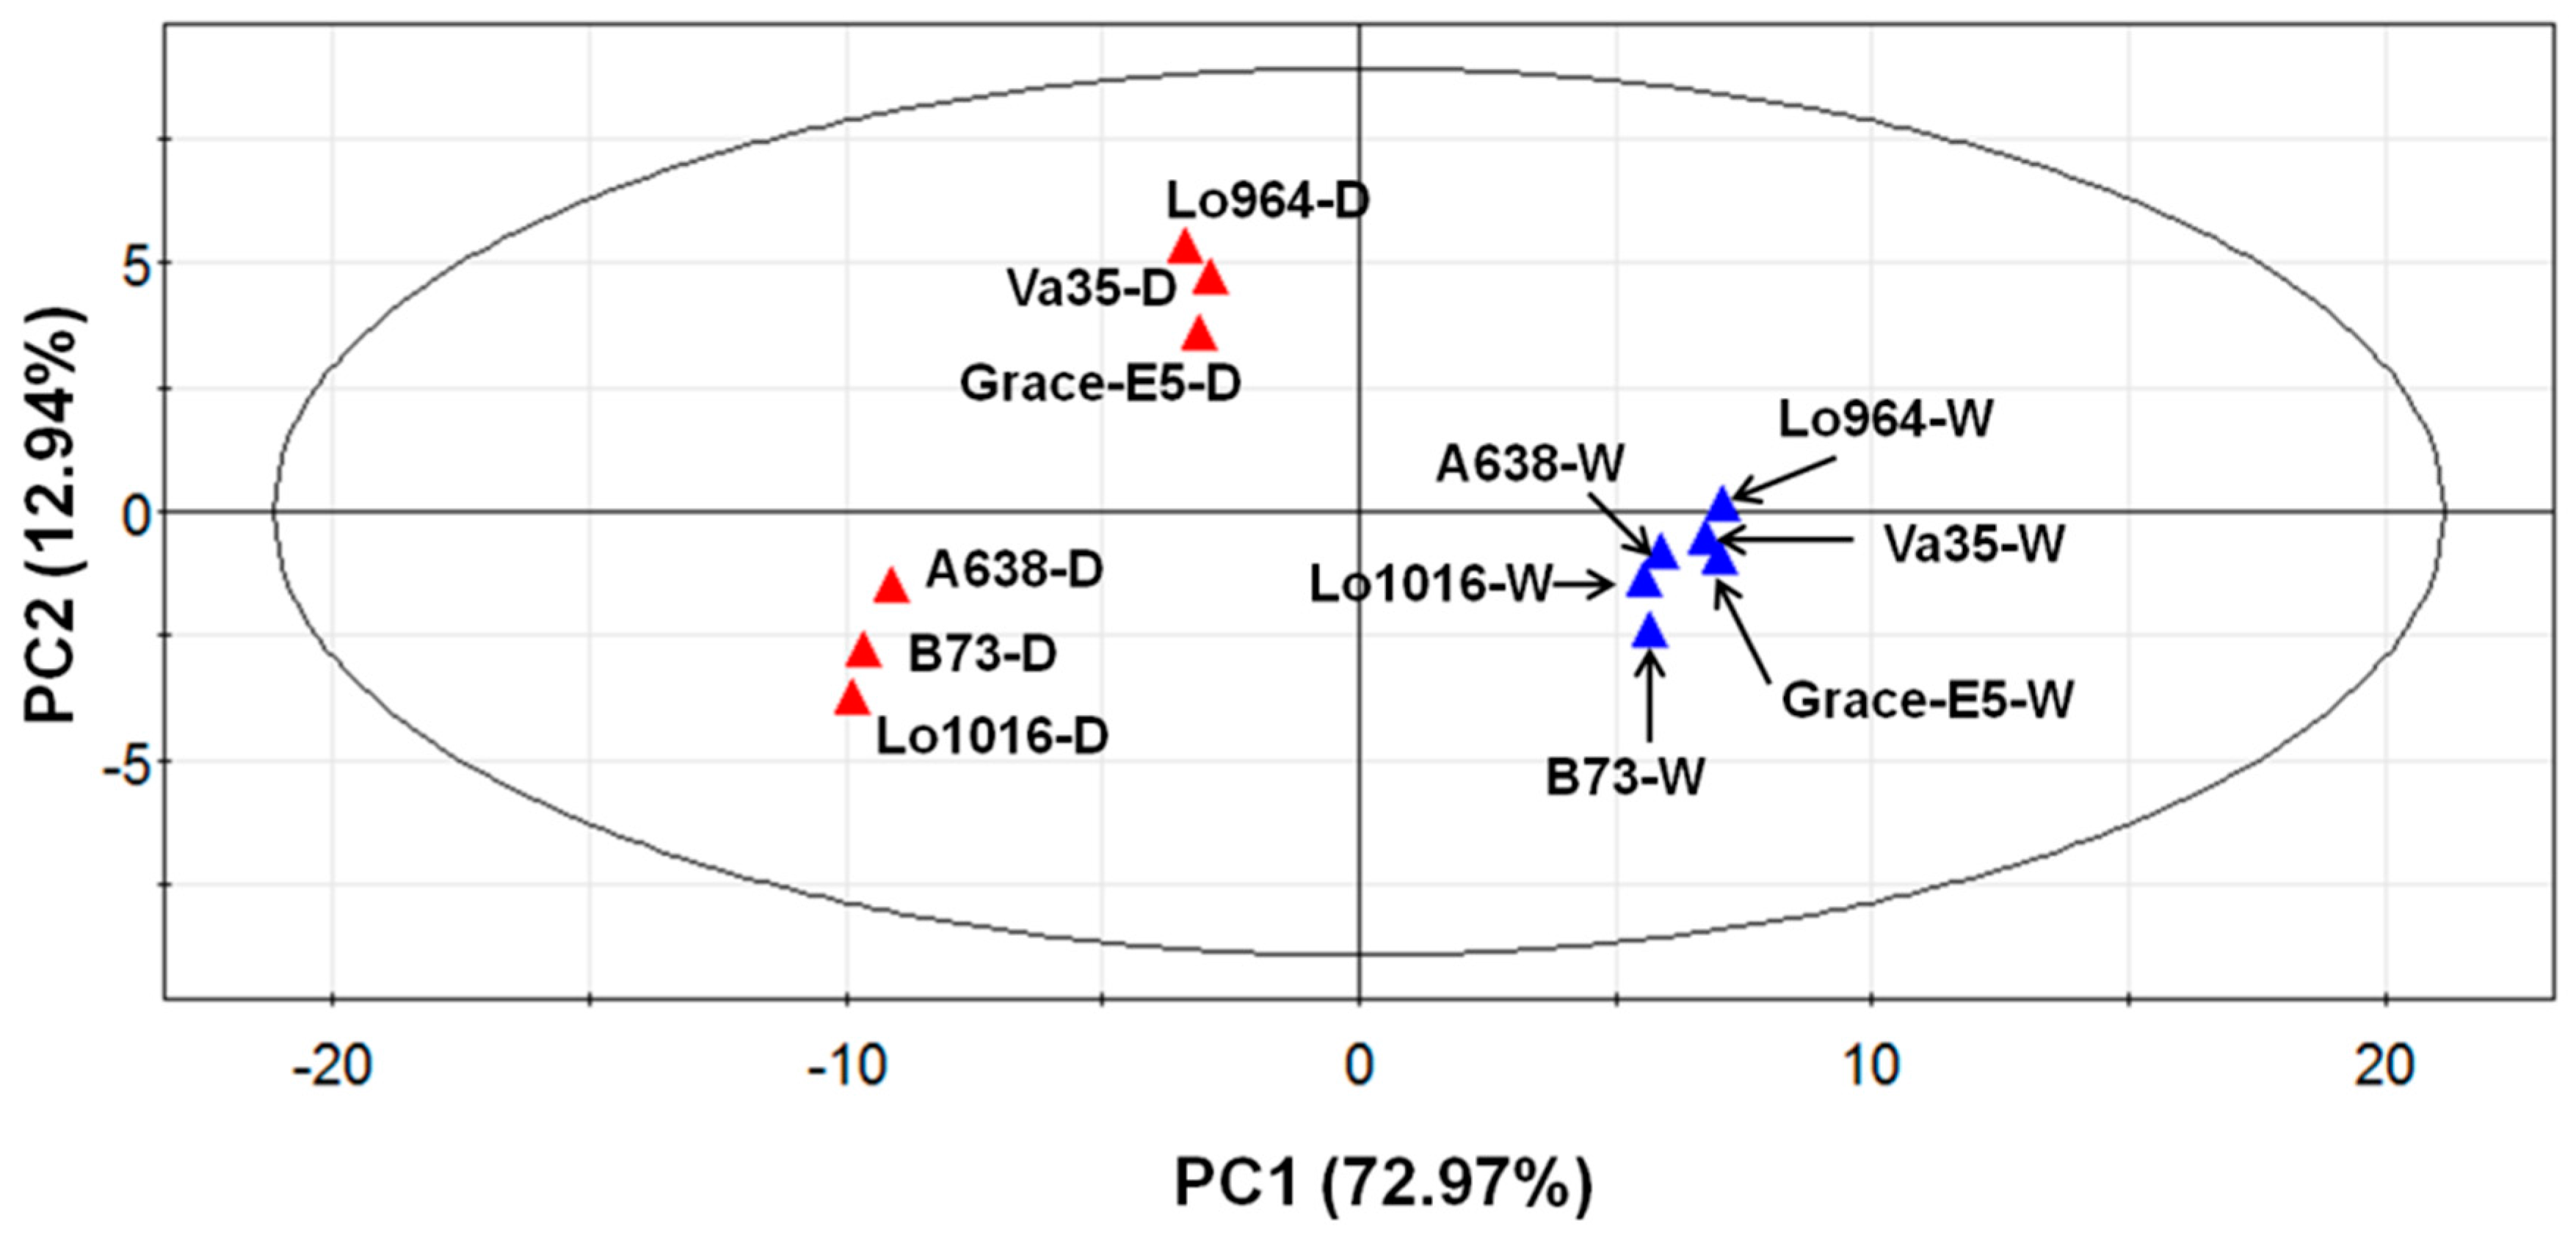
2.6. Physiological and Biochemical Patterns Allow Clear Separation of Drought Tolerance Characterization between Different Maize Lines
Subjecting the physiological and biochemical data to a principal component analysis (PCA) separated the lines relative to all indices, independent from genotype or treatment influences (
Figure 7), indicating significant differences exist within the physiological and biochemical indices between the different lines. PC1 (73% variance) separates the different treatments (well-watered and drought stress conditions), and shows that drought-treated lines display obviously different stress response patterns in comparison to well-watered ones with the lines divided into two groups. The first group includes Lo964, Va35, and Grace E5; and the second group includes B73, Lo1016, and A638. PC2 (13% variance) separates the different reactions of all lines responding to drought stress, and shows that Lo964, Va35, and Grace E5 have contrasting drought tolerance levels in comparison with B73, Lo1016, and A638.
Figure 7.
Principal component analysis (PCA) of all physiological and biochemical data in six different lines under well-watered and drought treated conditions. The blue points represent the well-watered (W) plants, while the red points represent the drought-stressed (D) plants.
Figure 7.
Principal component analysis (PCA) of all physiological and biochemical data in six different lines under well-watered and drought treated conditions. The blue points represent the well-watered (W) plants, while the red points represent the drought-stressed (D) plants.
Under well-watered conditions, all the lines show very similar responsive patterns, while under drought-treatment conditions the lines exhibited more diverse physiological and biochemical changes with regard to their genetic background (
Figure 7 and
Figure S7). The PCA analysis also separated lines predicted to be drought-sensitive or tolerant, and indicated that the factor that influenced the measured traits most was stress treatment, followed by genotype. In addition, the separation due to drought treatment was most profound at 6 and 9 DAI compared to 3 DAI (
Figure S7).
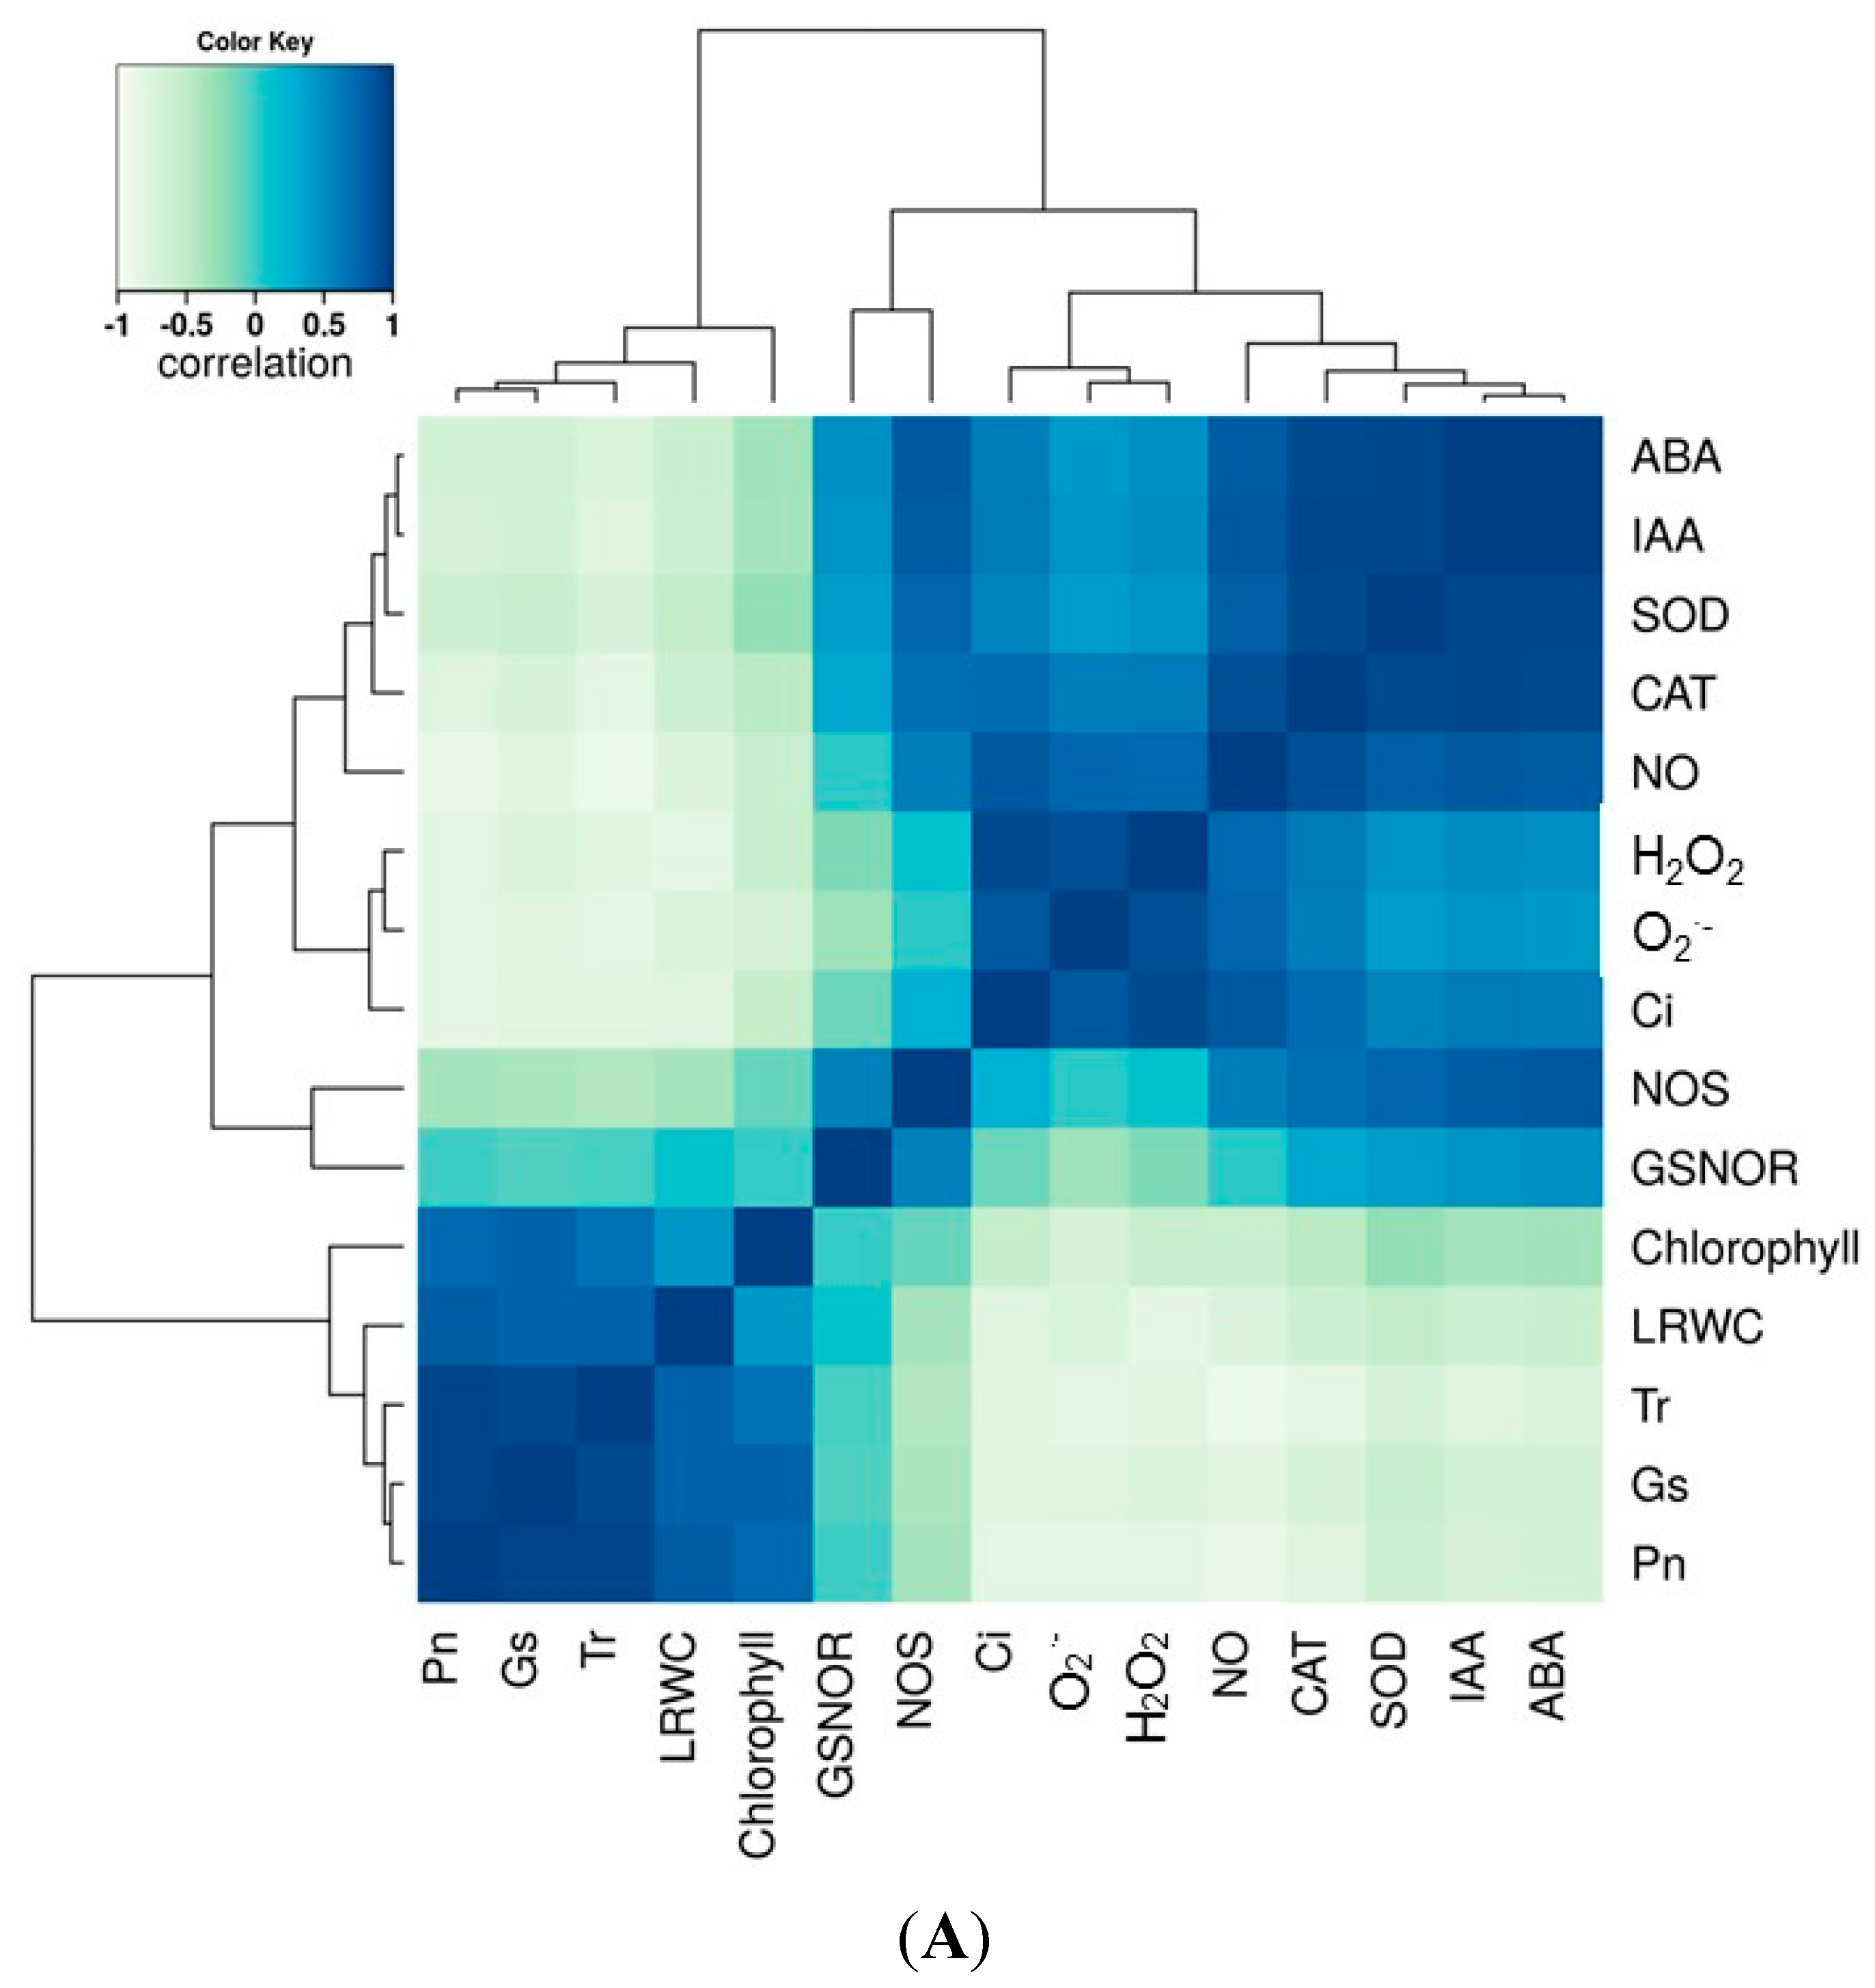
2.7. Correlation and Variance Analysis of All Tested Traits in All Lines
In this study, we sought to correlate the physiological responses of the maize lines during drought stress with hormone content and biochemical processes involved in ROS and RNS metabolism. Therefore, a correlation analysis of all the tested parameters was performed and as shown in
Figure 8. From the correlation matrix heat map, a positive correlation between hormone accumulation and RNS metabolism and ROS-scavenging enzyme activities was observed (
Figure 8A). A positive correlation between G
s, NO, and ROS was also observed. Photosynthesis parameters P
n, G
s, and T
r also positively correlated with chlorophyll content and LRWC. A strong negative correlation for the photosynthesis parameters P
n, G
s, and T
r with the ROS and RNS systems was observed, and GSNOR negatively correlated with the ROS components O
2·
− and H
2O
2 (
Figure 8A). Analysis of the variance showed that drought treatment and variety significantly contributed to the variance observed in the physiological and biochemical traits (
Figure 8B). The variation in ROS content and activities of ROS-scavenging enzymes were highly significant among maize genotypes under drought stress conditions and water recovery; however, less variation was recorded in chlorophyll content and GSNOR activity.
Figure 8.
Correlation and variance analysis of all tested dataset in six tested lines under well-watered and drought treated conditions. (A) shows the correlation among each parameter determined; and (B) shows the variance among each trait and each sample during the period of drought treatments.
Figure 8.
Correlation and variance analysis of all tested dataset in six tested lines under well-watered and drought treated conditions. (A) shows the correlation among each parameter determined; and (B) shows the variance among each trait and each sample during the period of drought treatments.
Time-series hierarchical clustering analysis of each tested trait separates all six lines into two main clusters which is consistent with the lines’ corresponding sensitivity to drought stress. Cluster one includes drought-sensitive lines B73 and Lo1016, and moderate A638; the second cluster contains the drought-tolerant lines Lo964, Va35 and Grace E5, with the exception of chlorophyll content and LRWC (
Figure S8). This result is supported by the PCA analysis as shown in
Figure 7, and consistent with the analysis of variance shown in
Figure 8B. As expected, NO and its synthetic enzyme NOS exhibit the same clustering patterns to all lines, showing their close correlation in NO metabolism.


