2.1. Profiling of Pyrrolizidine Alkaloids from Foliage
High-speed, automated extraction of foliar tissue yielded high quality, uniform extracts that were further purified using solid phase extraction (SPE) to reduce sample matrix complexity for profiling alkaloids of interest. Concentrated samples contained alkaloids, specifically 20 more abundant compounds along with trace quantities of additional constituents. The UHPLC-QTOF MS method coupled to bioinformatics and statistical analysis along with the integration of published data on similar pyrrolizidine alkaloids allowed for annotation of 17 PAs and PANOs (
Table 1;
Figure 2) detected in extracts of foliar tissues of
E. plantagineum. Earlier reports indicated the presence of five [
37], twelve [
20,
28] or fourteen PAs in foliar tissues of this species [
29]. The automated extraction process reduced leaf extraction time from 48 h [
29] to 27 min. The use of ultra-high pressure liquid chromatography, coupled to sensitive and accurate LC/MS QTOF detection, allowed for improved separation of pyrrolizidine alkaloids, particularly stereoisomers or other closely related compounds (putative stereoisomers were referred to as compound A and B;
Table 1;
Figure 2). Seventeen PAs and PANOs (
Table 1) were identified, mainly based on retention time (RT) and accurate mass (AM) as reported by Colegate and co-authors [
29] who identified 14 related structures in 2005 (
Table 1) in
E. plantagineum. These authors also analysed PAs with HPLC/MS using authenticated standards in positive ionization mode.
Detection of PAs was performed in the past in different matrices, including honey, which required the use of advanced clean up procedures in addition to SPE. Several techniques were successfully used for analysis and identification of PAs including UV-Vis, NMR, HPLC [
38], TLC, UHPLC-MS, and GC-MS [
17,
38]. Griffin
et al. [
39] developed a UHPLC ion trap MS method for analysis based on commercial standards available that allowed for identification of 11 PAs during a 30-min run. The constituents analysed by the present authors in plant extracts were less polar as they were not in the oxidized (PANO) form and typically eluted with higher concentrations of organic solvent (>20%) later in the gradient. In contrast, the method developed in this study allowed the annotation of 17 related PAs and PANOs of relatively high polarity during 18-min runs. Metabolic profiling of alkaloids using UHPLC-QTOF MS was also reported by Jaiswal
et al. [
5], who successfully identified 48 compounds including diterpene alkaloids in three separate plant species, and Zhu
et al. [
23], who developed the UHPLC-QTOF MS methodology for profiling of retronencine-type PAs in herbaceous plant extracts without corresponding standards.
In addition to 17 known PAs and PANOs, 18 additional PAs were characterized in
E. vulgare in a previously reported study (
Table S1) [
20]. In our study, masses corresponding to several of the same PAs identified previously in
E. vulgare were present in trace quantities or were completely absent in analysed extracts. Structural similarity and the presence of related compounds with identical masses (
Table S1) made identification of all PAs relatively difficult. Structural confirmation of related PAs has previously required the use of other techniques for identification including NMR or GC-MS [
20]. Although this study focused mainly on separation and profiling of compounds previously identified in
E. plantagineum, structurally similar alkaloids were indeed present in both species, suggesting similarity in biosynthetic pathways among related
Echium species. Interestingly, we detected ions of low abundance corresponding to the presence of intermedine, lycopsamine, acetyllycopsamine/intermedine, echiumine and 3’-acetylechiumine
N-oxides in
E. vulgare samples. These PANOs were not previously reported in
E. vulgare (
Table S1). The structural similarity of less well-described PAs observed in extracts of both
Echium species further suggests that the LC/MS QTOF system we employed was highly sensitive, but this sensitivity does not negate the need for use of NMR for final structural confirmation of those alkaloids present in trace quantities.
When honey from Paterson’s curse was analysed, two additional PAs were reported using GC-MS analysis following the derivatization of purified honey extracts [
40,
41]. Constituents included 3’-acetyl derivatives of intermedine and lycopsamine [
40,
41]. Recently, the use of LC-MS plus targeted analysis with authenticated standards has resulted in identification of numerous compounds at trace levels; however, not all of these compounds were present in extracts of foliar tissues of
E. plantagineum [
28,
29]. Non-targeted analysis of purified extracts of
E. plantagineum resulted in the detection of acetylintermedine in leaf extracts. This method successfully allowed for rapid and simultaneous profiling of PAs of known origin but also allowed for additional data mining through untargeted analysis associated with the metabolism of PAs using a short run time of approximately 20 min.
Figure 1.
Structure of echimidine (image modified from [
42]), the most abundant pyrrolizidine alkaloid (PA) in its
N-oxide form in
Echium plantagineum and
E. vulgare. The unsaturated bond between positions 1 and 2 induces toxicity. Reversible oxidation of nitrogen at position four alters chemical properties. Side chains at positions 1 and 7 vary between analyzed alkaloids. A thorough review of PAs was published previously and is referred to for additional information [
20].
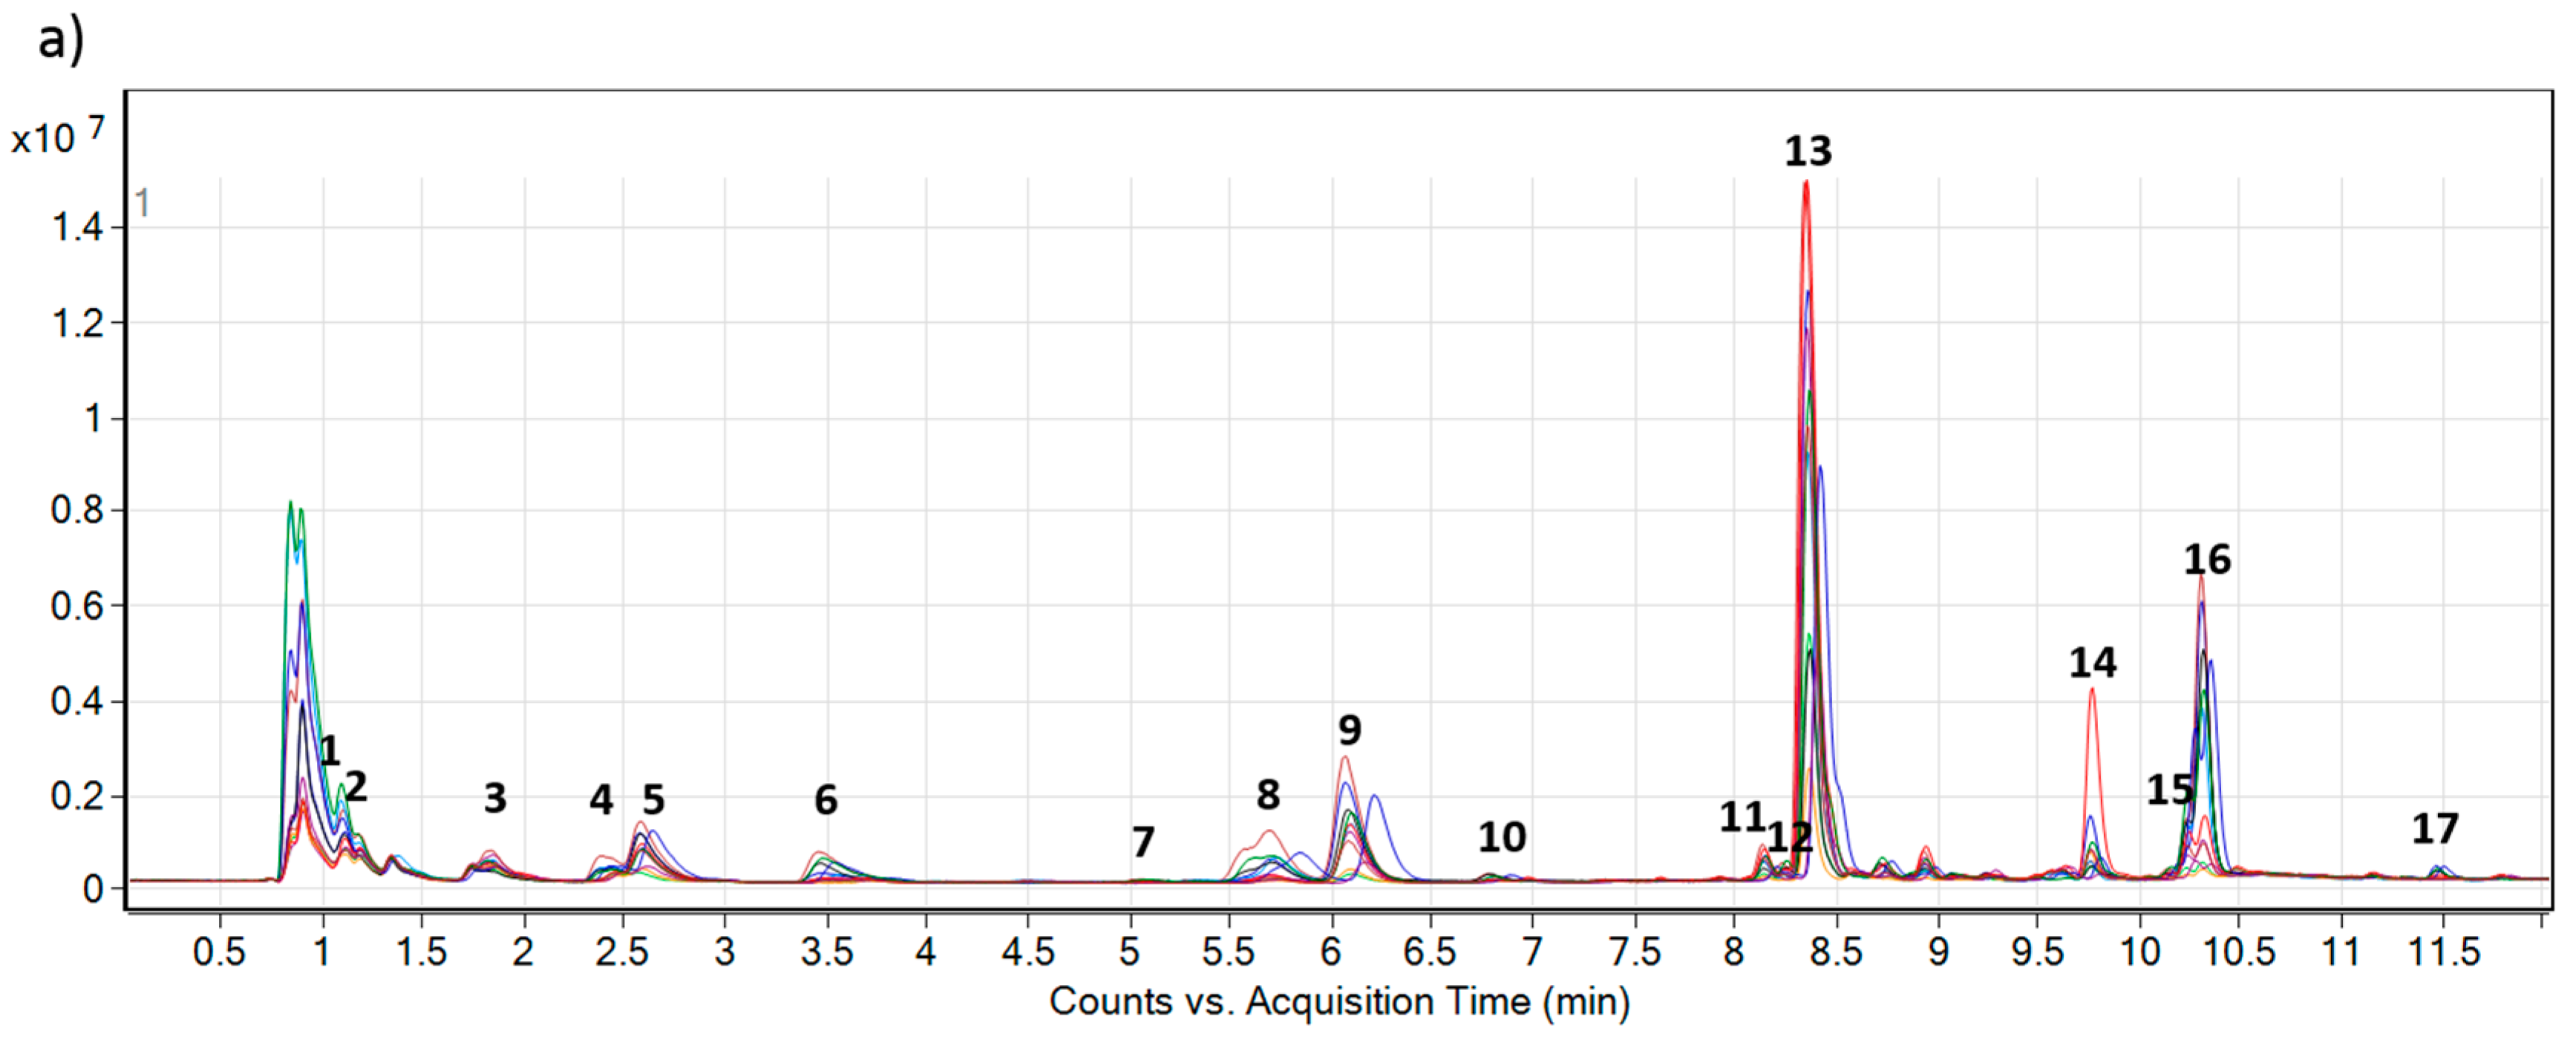
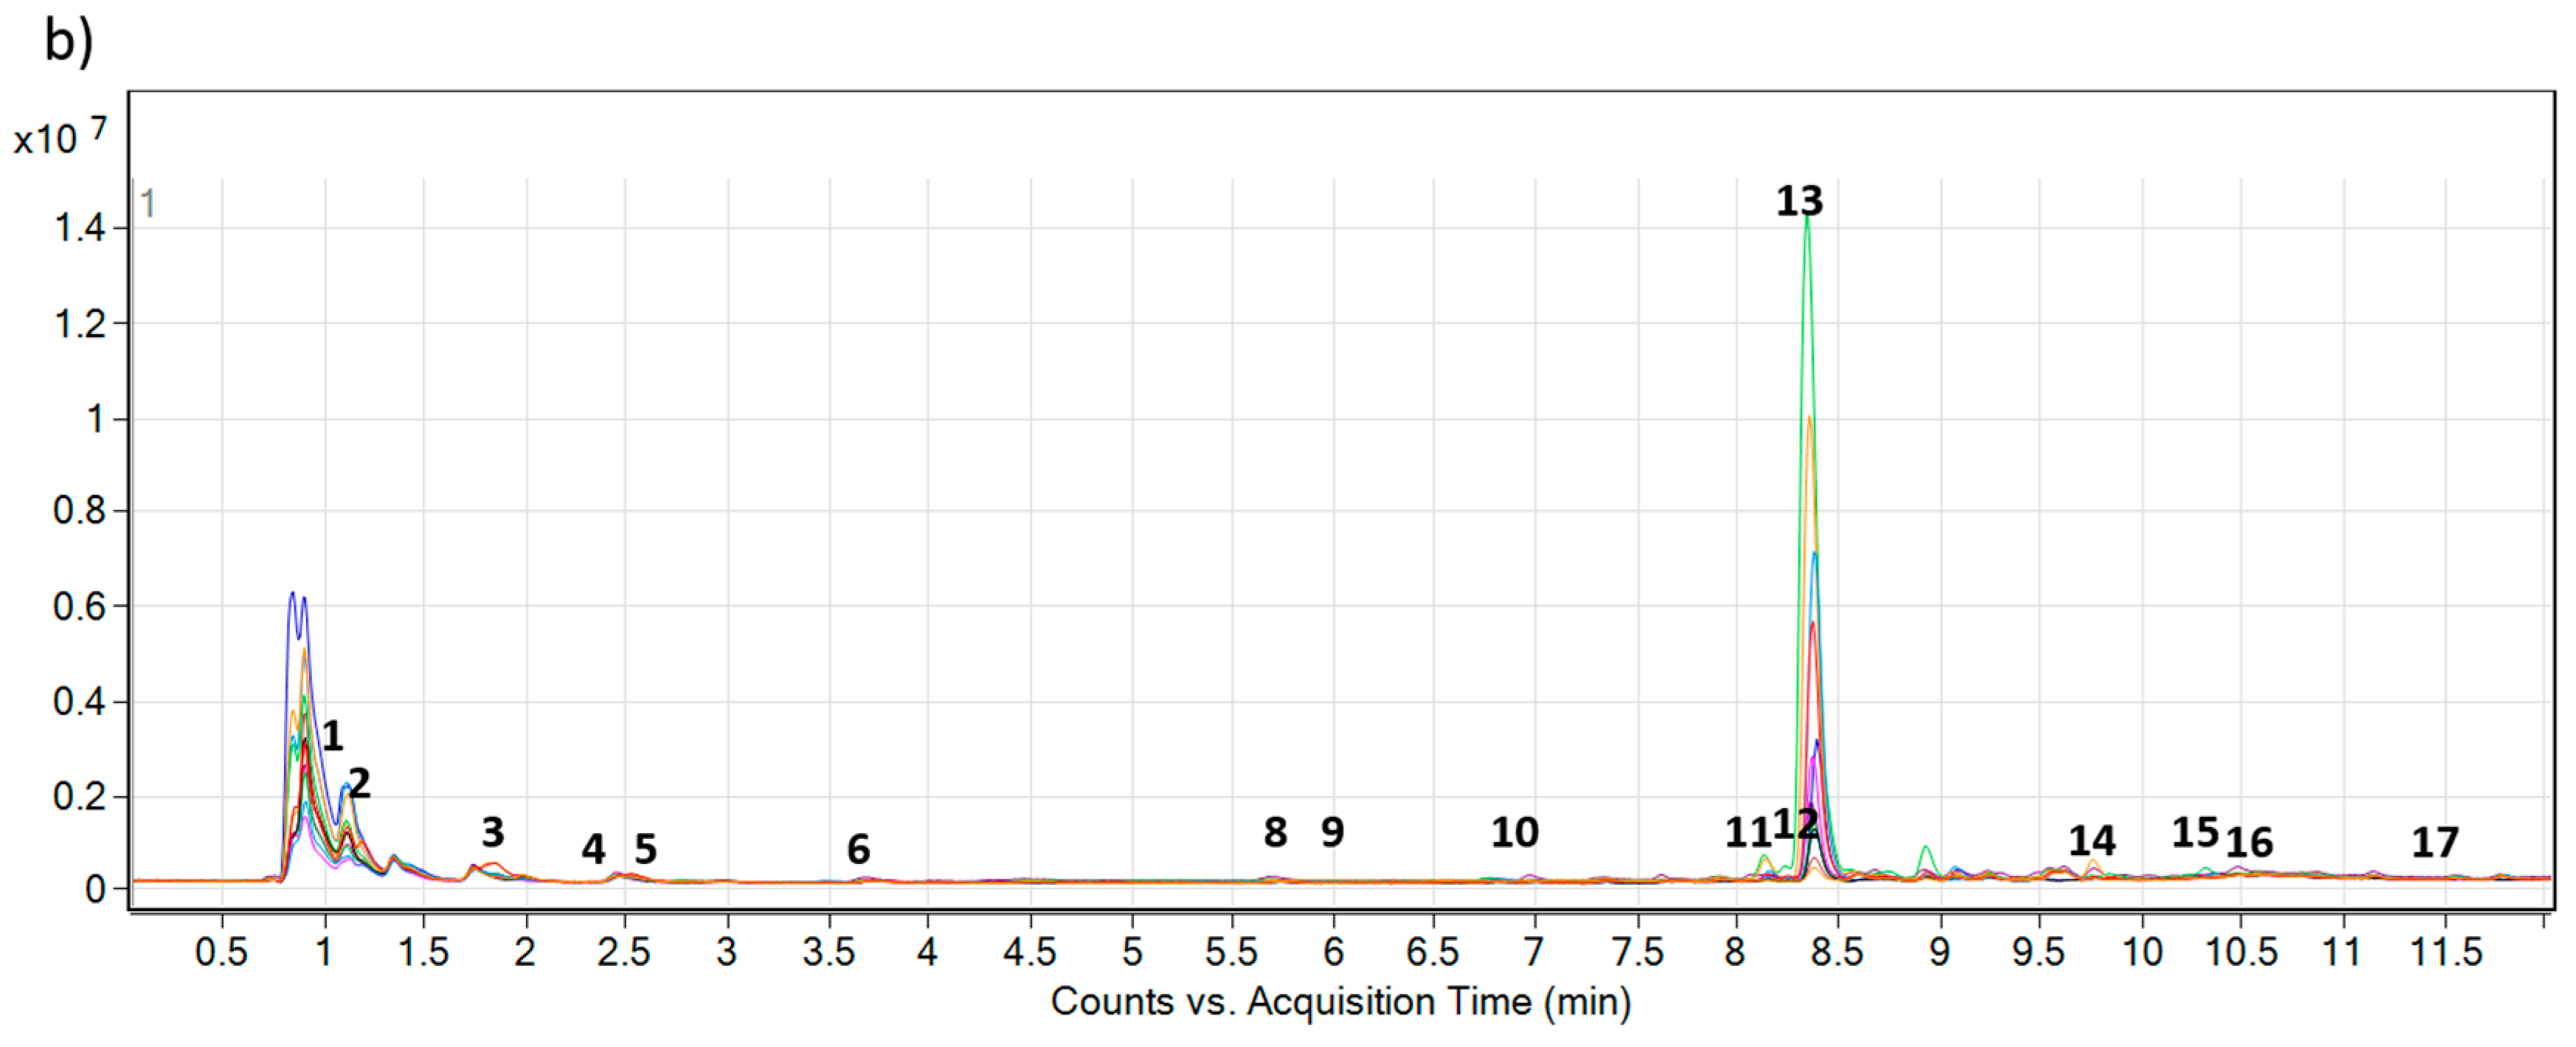
Figure 2.
Overlaid total ion chromatograms (TIC) of 12 composite extracts (each represented by different color) of (
a)
Echium plantagineum and (
b)
E. vulgare, grown under identical controlled glasshouse conditions. Numbers 1–17 denote PAs and PANOs profiled in the study (
Table 1).
Figure 2.
Overlaid total ion chromatograms (TIC) of 12 composite extracts (each represented by different color) of (
a)
Echium plantagineum and (
b)
E. vulgare, grown under identical controlled glasshouse conditions. Numbers 1–17 denote PAs and PANOs profiled in the study (
Table 1).
2.2. Accumulation of PAs and PANOs in the Field Conditions
The PAs and PANOs of geographically distinct populations of
E. plantaginuem and
E. vulgare surveyed and sampled across NSW indicated relatively little variation in production of PAs (
Figure 3) among populations of
E. plantagineum despite their collection from diverse climatic zones; in addition, some variation in plant morphology was observed among plant populations (
i.e., plant height, leaf number, flower color). A longitudinal survey performed across the states of New South Wales, Victoria and Australian Capital Territory in Australia by Weston
et al. [
28] found significant positive correlation between latitude and production of PANOs. However, the correlation was not significant for elevation or longitude. In addition to 20 sampled populations of
E. plantagineum in this experiment, we also included samples of
E. vulgare that were collected from areas of higher elevation (
Table S2). A survey of field sites in 2013–2014 showed considerable differences, with field samples separated into clusters by species (
Figure 3). Profiling showed considerable variation in PAs and PANOs in
E. vulgare, and leptanthine-
N-oxide and 7-
O-acetyllycopsamine/intermedine detected in
E. plantagineum were not detected in
E. vulgare samples. Only four field sites of
E. vulgare infestation were identified and collected across New South Wales and Australian Capital Territory due to limited and/or sporadic establishment of this species in Australia [
33]. Foliar extracts of both species were rich in echimidine and echiumine
N-oxides, known for their potent toxicity to grazing herbivores. Least abundant compounds in both species included leptanthine-
N-oxide and 7-
O-acetyllycopsamine/intermedine, which were not detected in
E. vulgare. Overall,
E. vulgare produced up to four-fold lower total concentrations of PAs and PANOs than
E. plantagineum (
Figure 3).
Table 1.
Chromatographic and spectrometric properties of related pyrrolizidine alkaloids (PAs) and their
N-oxides (PANOs) profiled by ultra high pressure liquid chromatography quadrupole time-of-flight (UHPLC-QTOF) mass speS. Compounds were annotated based on
m/z of molecular ions and retention time (RT) in relation to results published previously [
29]. “A” and “B”—Denote potential isomers; AM—Accurate mass; * Denotes compounds which could be intermedine derivatives.
Table 1.
Chromatographic and spectrometric properties of related pyrrolizidine alkaloids (PAs) and their N-oxides (PANOs) profiled by ultra high pressure liquid chromatography quadrupole time-of-flight (UHPLC-QTOF) mass speS. Compounds were annotated based on m/z of molecular ions and retention time (RT) in relation to results published previously [29]. “A” and “B”—Denote potential isomers; AM—Accurate mass; * Denotes compounds which could be intermedine derivatives.
| No. | Name | AM | Calculated [M + H] | Measured [M + H] | ∆ppm | Approx. RT | Formula |
|---|
| 1 | Leptanthine-N-oxide | 331.1631 | 332.1704 | 332.1701 | 0.90 | 1.08 | C15H25NO7 |
| 2 | Echimiplatine-N-oxide | 331.1631 | 332.1704 | 332.1701 | 0.90 | 1.27 | C15H25NO7 |
| 3 | Uplandicine-N-oxide | 373.1737 | 374.1809 | 374.1808 | 0.27 | 1.91 | C17H27NO8 |
| 4 | Intermedine-N-oxide | 315.1682 | 316.1755 | 316.1754 | 0.32 | 2.35 | C15H25NO6 |
| 5 | Lycopsamine-N-oxide | 315.1682 | 316.1755 | 316.1753 | 0.63 | 2.54 | C15H25NO6 |
| 6 | 7-Angeloylretronencine-N-oxide | 253.1314 | 254.1387 | 254.1384 | 1.18 | 3.42 | C13H19NO4 |
| 7 | 7-O-Acetyllycopsamine * | 341.1838 | 342.1911 | 342.1907 | 1.16 | 5.30 | C17H27NO6 |
| 8 | 7-O-Acetyllycopsamine-N-oxide A * | 357.1788 | 358.1860 | 358.1858 | 0.56 | 5.59 | C17H27NO7 |
| 9 | 7-O-Acetyllycopsamine-N-oxide B * | 357.1788 | 358.1860 | 358.1854 | 1.67 | 5.95 | C17H27NO7 |
| 10 | 9-O-Angelylretronencine-N-oxide | 253.1314 | 254.1387 | 254.1384 | 1.18 | 6.70 | C13H19NO4 |
| 11 | Echimidine-N-oxide A | 413.2050 | 414.2122 | 414.2121 | 0.24 | 8.12 | C20H31NO8 |
| 12 | Echiuplatine-N-oxide | 397.2101 | 398.2173 | 398.2170 | 0.75 | 8.18 | C20H31NO7 |
| 13 | Echimidine-N-oxide B | 413.2050 | 414.2122 | 414.2120 | 0.48 | 8.32 | C20H31NO8 |
| 14 | 3’-O-Acetylechimidine-N-oxide | 455.2155 | 456.2228 | 456.2228 | 0.00 | 9.77 | C22H33NO9 |
| 15 | Echiumine-N-oxide A | 397.2101 | 398.2173 | 398.2172 | 0.25 | 10.20 | C20H31NO7 |
| 16 | Echiumine-N-oxide B | 397.2101 | 398.2173 | 398.2173 | 0.00 | 10.32 | C20H31NO7 |
| 17 | 3’-O-Acetylechiumine-N-oxide | 439.2206 | 440.2279 | 440.2276 | 0.68 | 11.53 | C22H33NO8 |
A focused evaluation of leaf surface chemistry of these two species also showed similar results.
Echium plantaginuem leaf dips typically contained more PAs and PANOs in greater abundance than did
E. vulgare; leaf surface dips differed quantitatively and qualitatively, with echimidine being the most abundant PA detected in extracts of both species [
43]. In our recent survey, field-collected plants of both species had low concentrations of lepthantine-
N-oxide, which was previously found to be one of the most abundant alkaloids detected in field surveys across Australia [
28]. Differences could be associated with variable weather conditions in the weeks prior to collection.
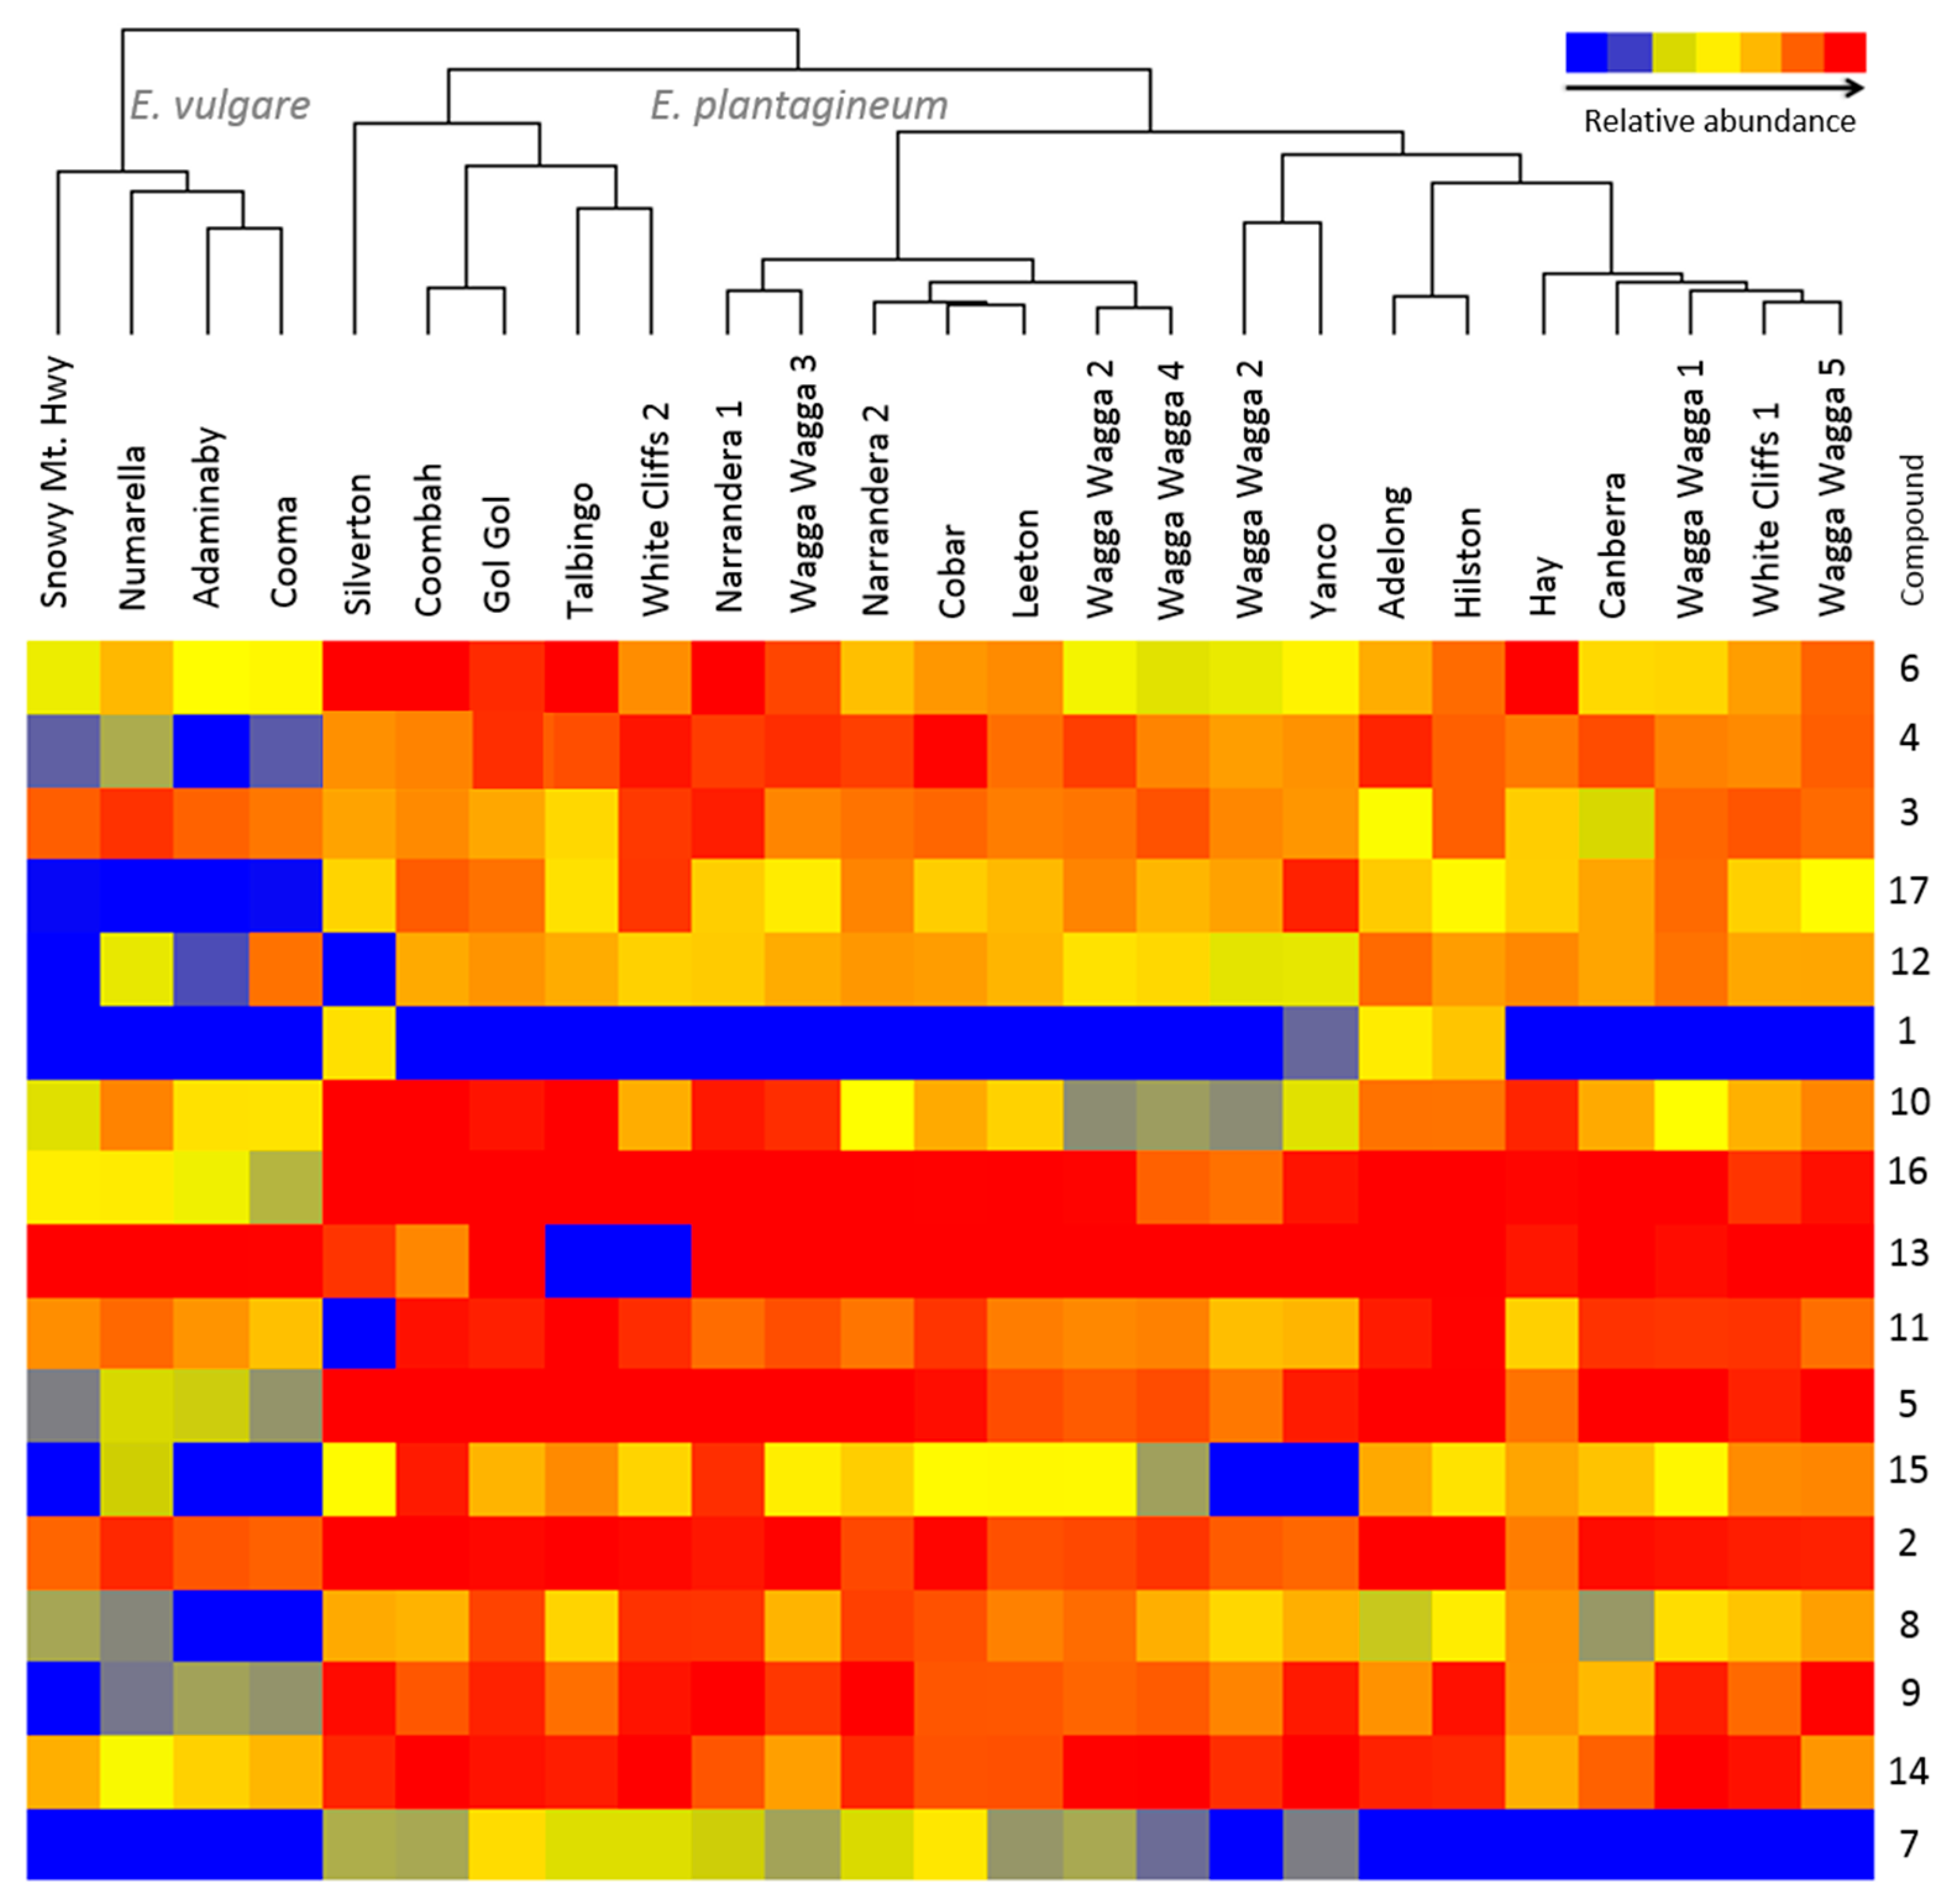
Figure 3.
Variation in abundance of 17 pyrrolizidine alkaloids and their
N-oxides (
Table 1) in composite, field-collected samples of
Echium plantagineum and
E. vulgare. Hierarchical clustering algorithm and Euclidean distance metric were used on normalized abundance values. Dendrogram was generated using Mass Profiler Professional software (Agilent, Santa Clara, CA, USA).
2.3. Growth Stage and Genotype-Dependent Accumulation of PAs and PANOs
Phenological stage often impacts the expression of complex biosynthetic pathways for PSPs. Increased production of phenolic compounds has been reported at the reproductive stage in multiple plant genera, and higher PSP abundance was often correlated with attraction of pollinators, an important ecological function [
44]. The production of PAs and PANOs varies seasonally in
Senecio [
45] and also in
Echium, with greater levels of naphthoquinones observed with increasing plant maturity [
28]. In
E. plantagineum and
E. vulgare, root-produced naphthoquinones were produced within 48 hours following germination and were also significantly more abundant at plant maturity [
31].
After sampling at three different growth stages, PANOs were observed to be present in all investigated populations of
E. plantagineum and limited variation between population and growth stage extracts was observed (
Figure 4). The most abundant compounds at rosette and flowering stages were echimidine-
N-oxide B (
13) and echiumine-
N-oxide B (
16) while 3′-
O-acetylechiumine-
N-oxide (
17) and 7-
O-acetyllycopsamine/intermedine (
7) were least abundant. Echiumine-related PAs and PANOs were significantly downregulated with increasing maturity in all studied populations. Similarly, 7-
O-acetyllycopsamine/intermedine B (
9), 3′-
O-acetylechimidine (
14) and lepthantine (
1)
N-oxides were significantly downregulated (
p < 0.05) over time. However, the opposite trend was observed for retronencine-related PANOs, which were likely readily interconverted to other structures such as retronencine, the structural backbone of multiple PANOs in
Echium plantaginuem [
29]. Echimidine-
N-oxide B (
13) [
40] was also significantly (
p < 0.05) upregulated over time with plant maturation and was most abundant at rosette and flowering stage compared to the seedling stage in the majority of populations (
Figure 4). Nine out of seventeen compounds varied with growth stage, and population × growth stage differences were clearly observed (
Figure 5). Biosynthesis of PAs and PANOs was associated with phenological stage, with significant differences in chemical profiles observed between plants of flowering and seedling stage, with rosette stage intermediate. Although plant populations were generally similar in abundance of PAs, several individual compounds (
1,
2,
3,
9 and
13) responded differently over time with respect to population differences (
Figure 4;
Table S3).
A previous report on PAs in
Senecio jacobaea (syn.
Jacobaea vulgaris) showed elevated levels of PAs in the leaves at the flowering stage in comparison to the rosette stage, and floral extracts possessed the highest concentrations [
17].
Senecio species biosynthesize PAs in their roots [
12], and therefore PA foliar content may increase during transport to newly opened flowers. The location of biosynthesis of PAs in
E. plantagineum has not been studied in great detail, but it has been suggested that site of production varies among species [
46]. We have detected significant PA content in stem and leaf extracts, with considerable concentrations noted on leaf surfaces. We also detected relatively low concentrations of the three main alkaloids in root extracts as well, suggesting production or later translocation to living roots over time.
Figure 4.
Relative abundance of 1–17 PANOs (
Table 1) in extracts of five populations of
Echium plantagineum harvested at three growth stages in controlled conditions experiment. Hierarchical clustering was performed using MPP Software on normalized values and Euclidean distance metric. *–denotes significance of population, growth stage and their interaction (repeated measures ANOVA;
p < 0.05). Key to populations: B–Bendigo, CM—Coombah, CR—Cobar, GG—Gol Gol, WW—Wagga Wagga (numbers indicate block of replication).
Echium plantagineum accumulated moderately high levels of PANOs within a week after germination. Accumulation of PAs of low abundance at the seedling stage, such as leptanthine-
N-oxide (
1) and 7-
O-angeloylretronencine (
6), increased over time (
Figure 4). The biosynthesis of PAs occurred rapidly post germination, likely as a means to protect the plant and deter generalist herbivores [
27]. PAs and PANOs potentially contribute to active plant defense by suppressing the feeding of insects and other herbivores as well as suppressing certain plants; together with antimicrobial naphthoquinones produced in the root periderm [
31], they form a successful barrier and enhance plant resilience to pathogens and predators both above and below the ground.
Figure 5.
Principal component analysis (PCA) of controlled condition experiment, evaluated over five populations of E. plantagineum. (a) PCA of 17 PAs and PANOs and growth stage as independent variable. Component 1, 2 and 3 contribute separation by 23.39%, 21.04% and 12.45%, respectively. Discriminating metabolites for component 1 (PCA loadings > 0.3): 6, 11, 13 and for component 2 (PCA loadings > 0.3): 5, 8, 16, 17. Key to plant stages: seedling, brown; flowering plants, red and rosette, blue; (b) PCA of 17 PAs and PANOs with population as an independent variable. Component 1, 2 and 3 contribute to separation by 23.39%, 21.04% and 12.45%, respectively. Key to populations: Bendigo, red; Coombah, brown; Cobar, blue; Gol Gol, grey and Wagga Wagga, green.
Under a controlled glasshouse environment, variation in accumulation of PAs and PANOs was occasionally observed between populations (
Figure 5). Six compounds were differentially expressed among populations. These included uplandicine-
N-oxide (
3), lycopsamine-
N-oxide (
5) and 7-
O-acetyllycopsamine/intermedine-
N-oxide B (
9) which were significantly downregulated (
p < 0.05) in the Coombah population (
Figure 4;
Table S3). Interestingly, the Coombah population also exhibited reduced shikonin biosynthesis in its roots in a separate study and these differences were attributed to possible genetic differences in PSP biosynthesis [
31]. Leptanthine-
N-oxide (
1) was significantly downregulated in seedlings of the Wagga Wagga population.
2.4. Comparative Profiling of Echium Plantagineum and E. Vulgare
Metabolic profiles of both
Echium species in Australia were recently compared with respect to production of PSPs, specifically quinone-containing shikonins in the roots. These studies revealed that shikonin biosynthesis is highly conserved across species, with limited differences in metabolic profiles [
31]. Five populations of each species were used in this evaluation of PAs and PANOs. Plants were harvested and extracted after 6–8 weeks at the rosette stage and at 27–29 weeks when
E. plantagineum was fully flowering; interestingly, we observed in this study that
E. vulgare did not flower and remained in the vegetative growth stage, likely due to its perennial growth habit and lack of exposure to vernalizing conditions in the greenhouse [
33].
Metabolic profiling revealed that 15 out of 17 PAs or PANOs were significantly downregulated in
E. vulgare (
p < 0.05) (
Figure 6;
Table S4); however, 7-
Oacetyllycopsamine/intermedine (
7) and uplandicine (
3), lycopsamine (
5), 7-angeloylretronencine (
6), 9-
O-angelylretronencine (
10), echimidine A (
11) and 3’-
O-acetylechimidine (
14)
N-oxides were expressed differentially in both species over time. Echimidine-
N-oxide B (
13) was the most abundant PANO in both species, and has been described as responsible for acute alkaloid toxicity in rats [
40]. Echimidine was previously found in high quantities in
E. vulgare and
E. setosum [
47]. Rare or less common PAs observed included 7-
O-acetyllycopsamine/intermedine (
7) > leptanthine-
N-oxide (
1) > echiuplatine-
N-oxide (
12). 7-
O-acetyllycopsamine/intermedine (
7) was absent in
E. vulgare while lepthantine-
N-oxide (
1) was found in only one sample of this species. Echiuplatine-
N-oxide (
12) was uncommon and was identified in one sample of each species of plants grown in controlled conditions (
Figure 6). Variation in in phenology associated with growth habit may be important in regulating PA expression.
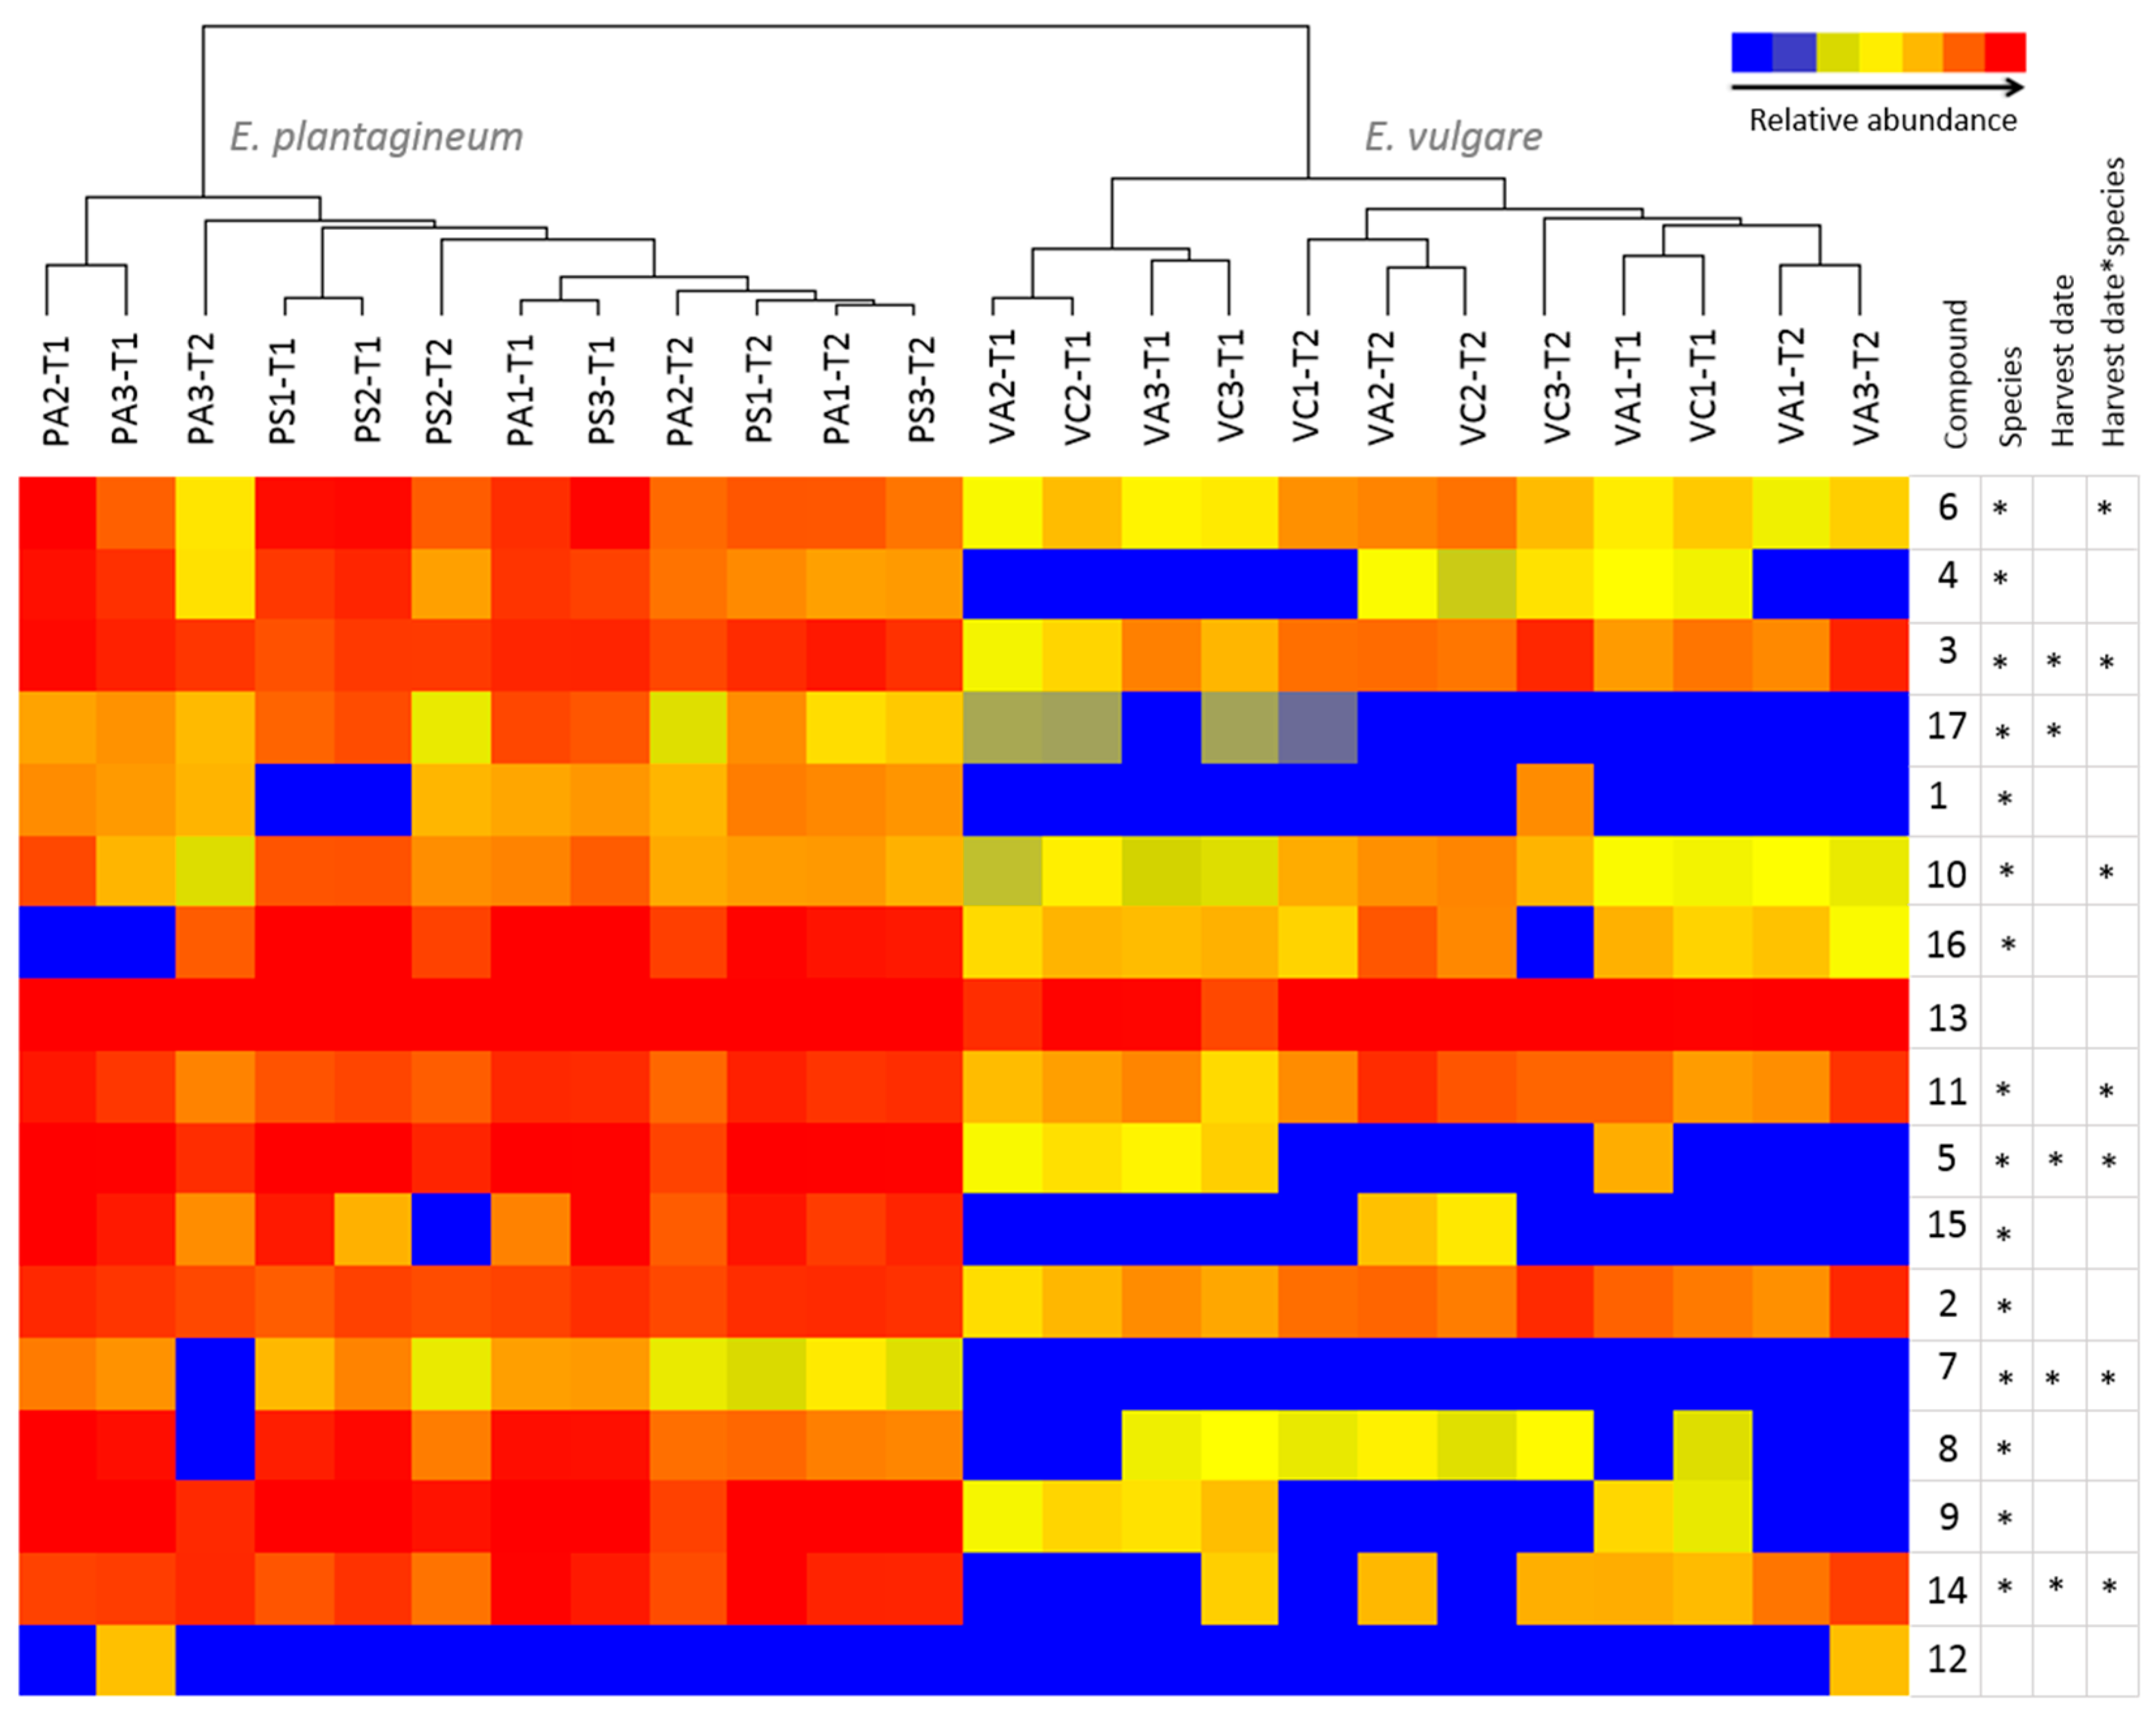
Figure 6.
Comparison of abundance of selected pyrrolizidine alkaloids and their N-oxides in Echium plantagineum and E. vulgare plants grown in uniform conditions in the glasshouse. Hierarchical clustering algorithm and Euclidean distance metric were used on normalized abundance values. Dendrogram was generated using MPP software. *-denotes significance of population, harvest date and their interaction (repeated measures ANOVA, p < 0.05). Key to populations (at top of diagram): PA, E. plantagineum from Adaminaby; PS, E. plantagineum from Silverton; VA, E. vulgare from Adelong; VC, E. vulgare from Cooma. Key to plant stages: T1, first harvest; T2, second harvest.
Metabolic profiles of both species were compared using a comprehensive personal compound database (
Table 1) based on accurate mass (AM) and retention time (RT) of compounds earlier reported in
E. plantagineum. Several compounds profiled in this study were found with high mass accuracy in both species and were not previously reported in
E. vulgare extracts. However, as previously mentioned, the complexity and structural similarity of many PAs and PANOs renders positive identification of metabolites a complex task, particularly for those present in trace quantities. The concentration of PANOs and PAs in
E. vulgare was significantly lower in glasshouse-grown plants when both species were produced under uniform conditions (
Figure 2 and
Figure 6).
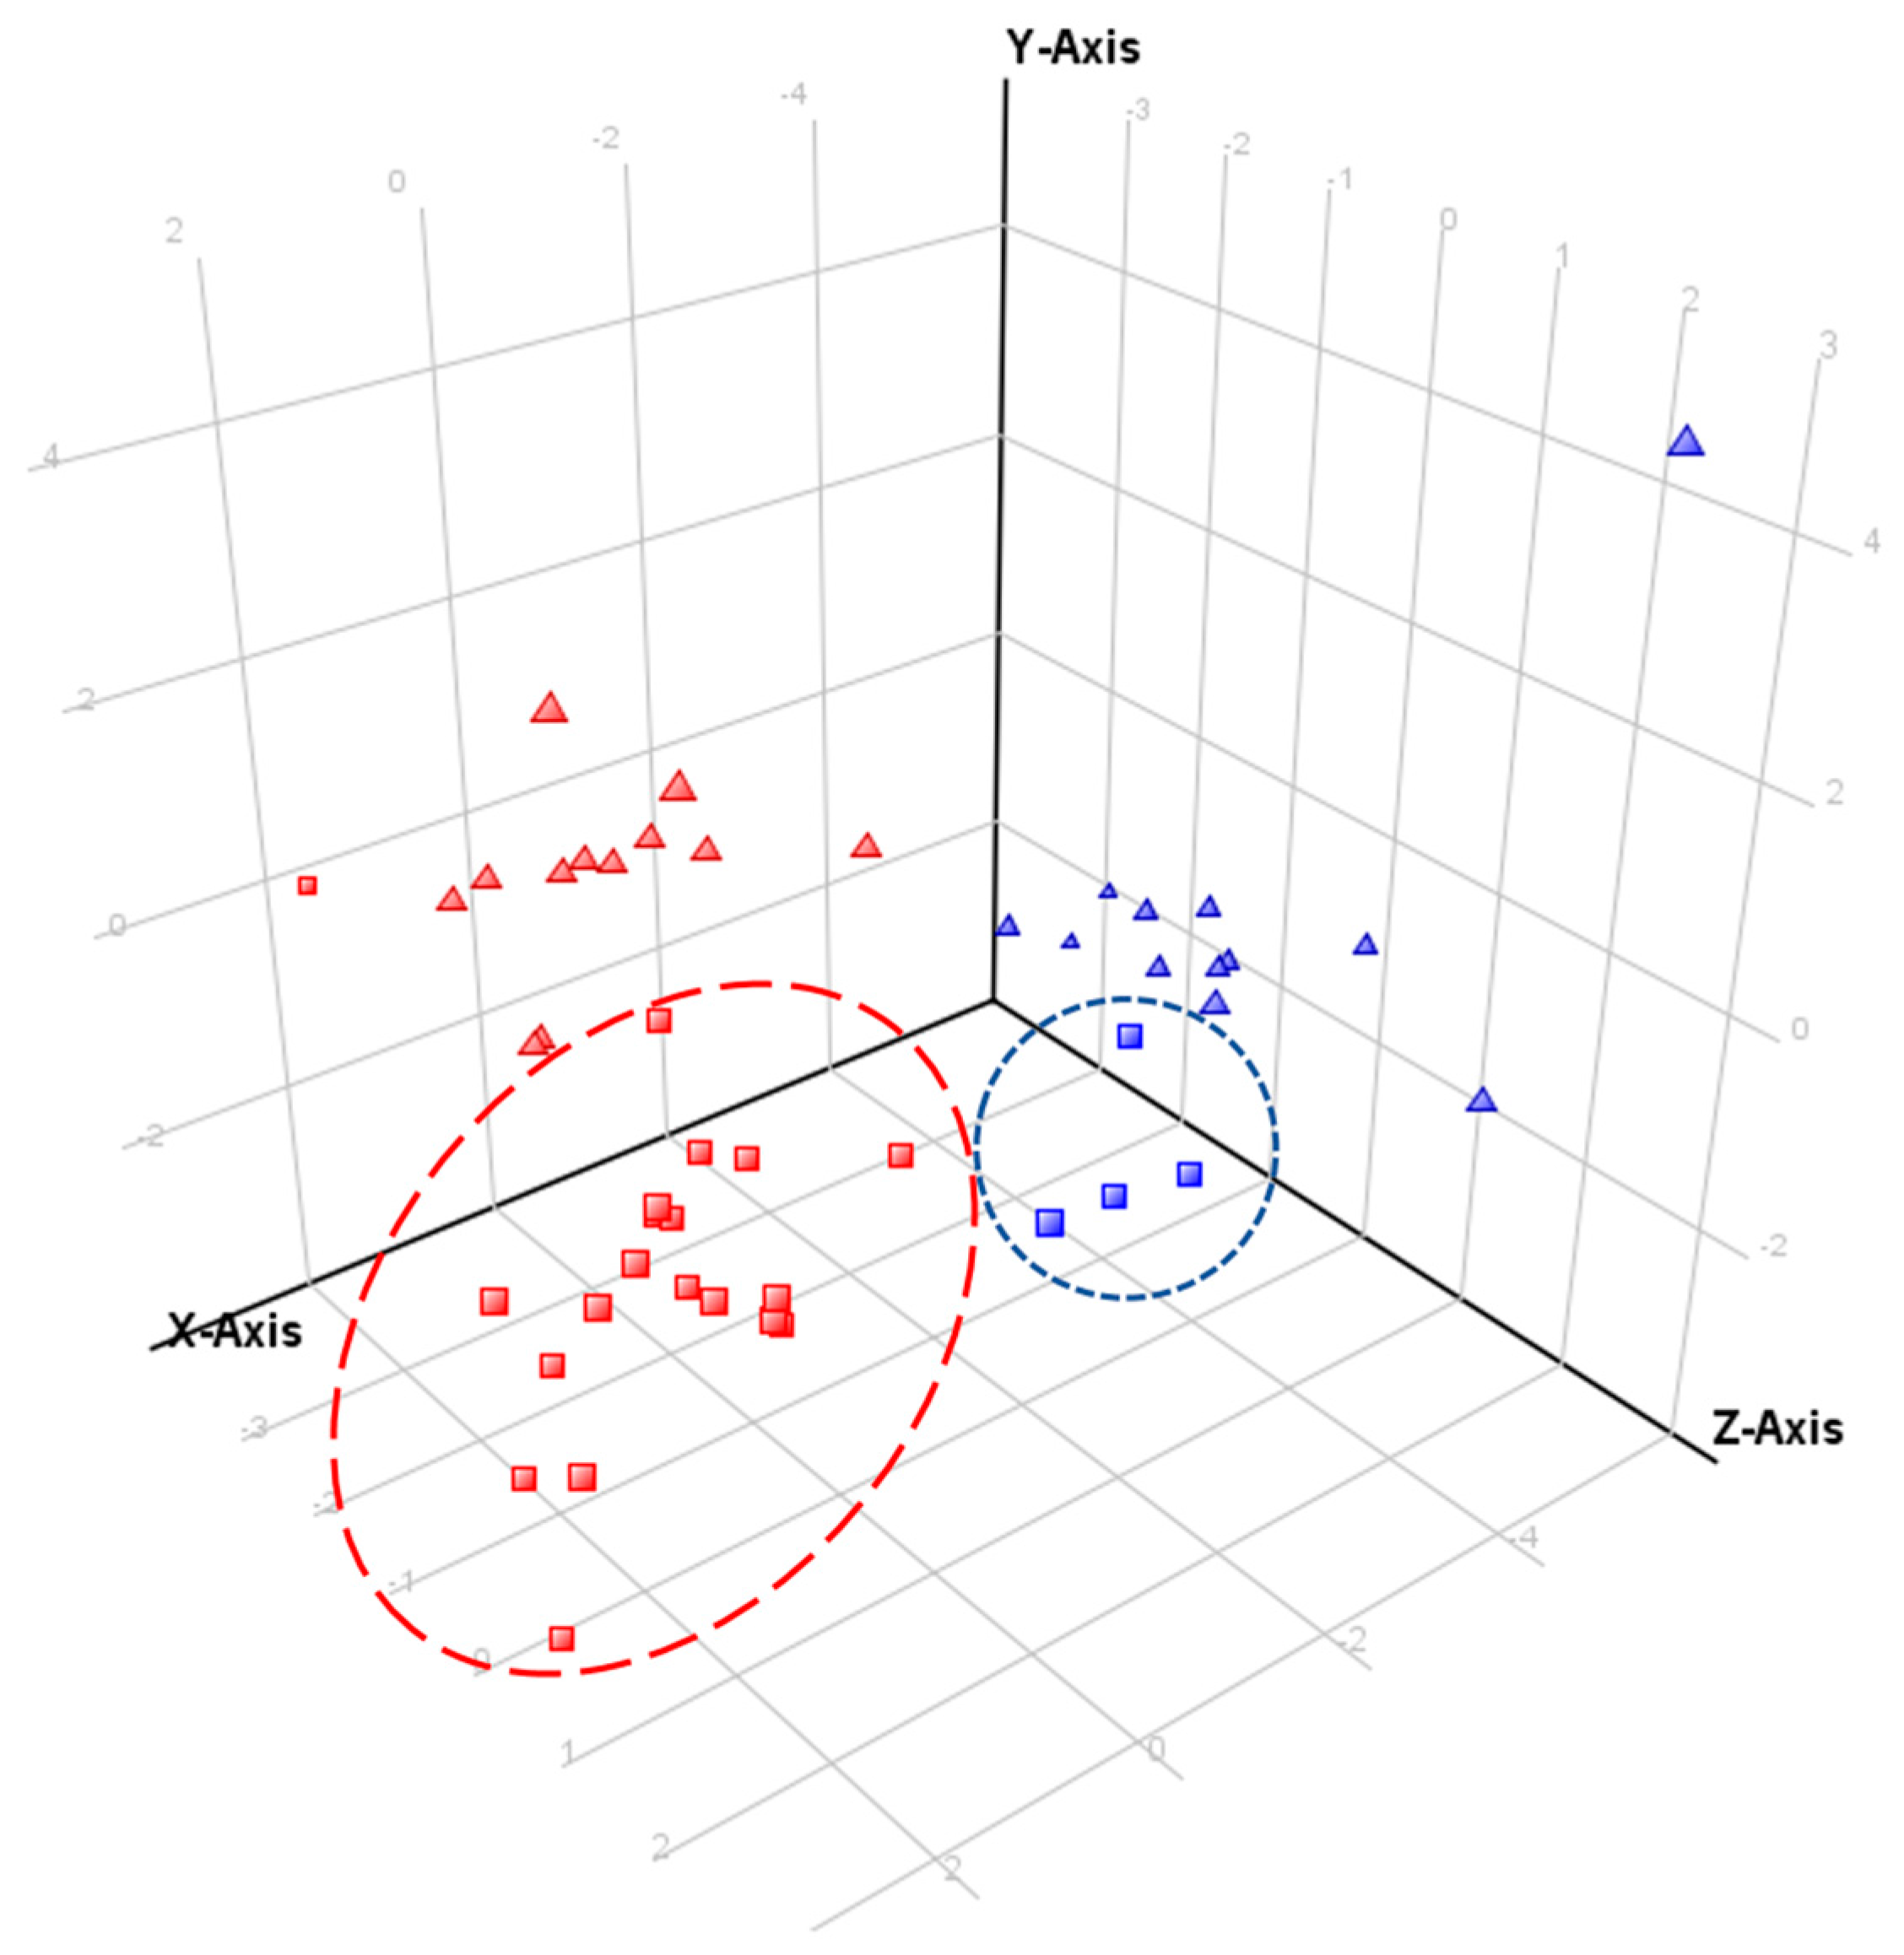
Echium vulgare produced more PANOs under field conditions, but their abundance was lower than in
E. plantagineum (
Figure 7).
The three most abundant PANOs in
E. vulgare under field and glasshouse conditions were: echimidine-
N-oxide B (
13) > echimiplatine-
N-oxide (
2) > uplandicine-
N-oxide (
3). In contrast,
E. plantagineum field-collected plants produced lycopsamine-
N-oxide (
5) > echimidine-
N-oxide B (
13) > echiumine-
N-oxide B (
16) whereas glasshouse-grown plants produced echimidine-
N-oxide B (
13) > echiumine-
N-oxide B (
16) > 7-
O-acetyllycopsamine/intermedine-
N-oxide B (
9). Molecular ions of PAs and PANOs previously reported in
E. vulgare [
20] were also investigated (
Table S1) in field and glasshouse plant extracts. Ions of 31 listed PAs and PANOs were identified with high accuracy; however, previously reported molecular ions of 7-angeloyl-9-(2-methylbutryl)-retronecine, 7-tigloyl-9-(2-methylbutryl)-retronecine, 7-
O-acetyllycopsamine/intermedine, asperumine and vulgarine [
20] were not observed.
Additionally, the peak of
m/z 416.2276 at 8.7 min (
Figure 2) found in
E. plantaginuem samples (generated formulae: C
20H
33NO
8) had a similar accurate mass to the
N-oxide of canescine/canescenine (
m/z 399.2257). In addition to abundant
N-oxides, untargeted analysis and comparison to Metlin database (Agilent, Santa Clara, CA, USA) allowed for putative annotation of several PAs. Annotated compounds included acetylintermedine (
m/z 342.1901; 5.67 min) found in
E. plantaginuem samples only and reported in literature previously [
20], less abundant symlandine (
m/z 382.2224; 10.27 min) in
E. vulgare and also petasitenin (
m/z 382.186; 8.85 min) in
E. plantagineum.
Results suggested that qualitative and quantitative differences between the Echium species in terms of alkaloid production may be of biological importance with respect to their invasion success. Consistently elevated levels of PAs and PANOs observed in E. plantagineum may potentially deter generalist herbivores more successfully and thereby impact invasion success of this species in its non-native range.
Figure 7.
Principal component analysis (PCA) of samples of both species from the field experiment and controlled conditions experiment. PCA included 17 PANOs and growth stage as independent variable. Component 1, 2 and 3 contribute to separation by 41.83%, 11.58% and 9.75%, respectively. Discriminating metabolites for component 1 (PCA loadings ≥ 0.3): 5, 6, 17 and for component 2 (PCA loadings > 0.4): 1. Key to symbols:
Echium plantagineum, red;
E. vulgare, blue; field survey samples, squares; glasshouse samples, triangles. Outlying field sample of
E. plantagineum was collected in Silverton (
Table S2).


 ,
, 


