2.1. Phlox subulata (P. subulata) Transcriptome Sequencing and de Novo Assembly
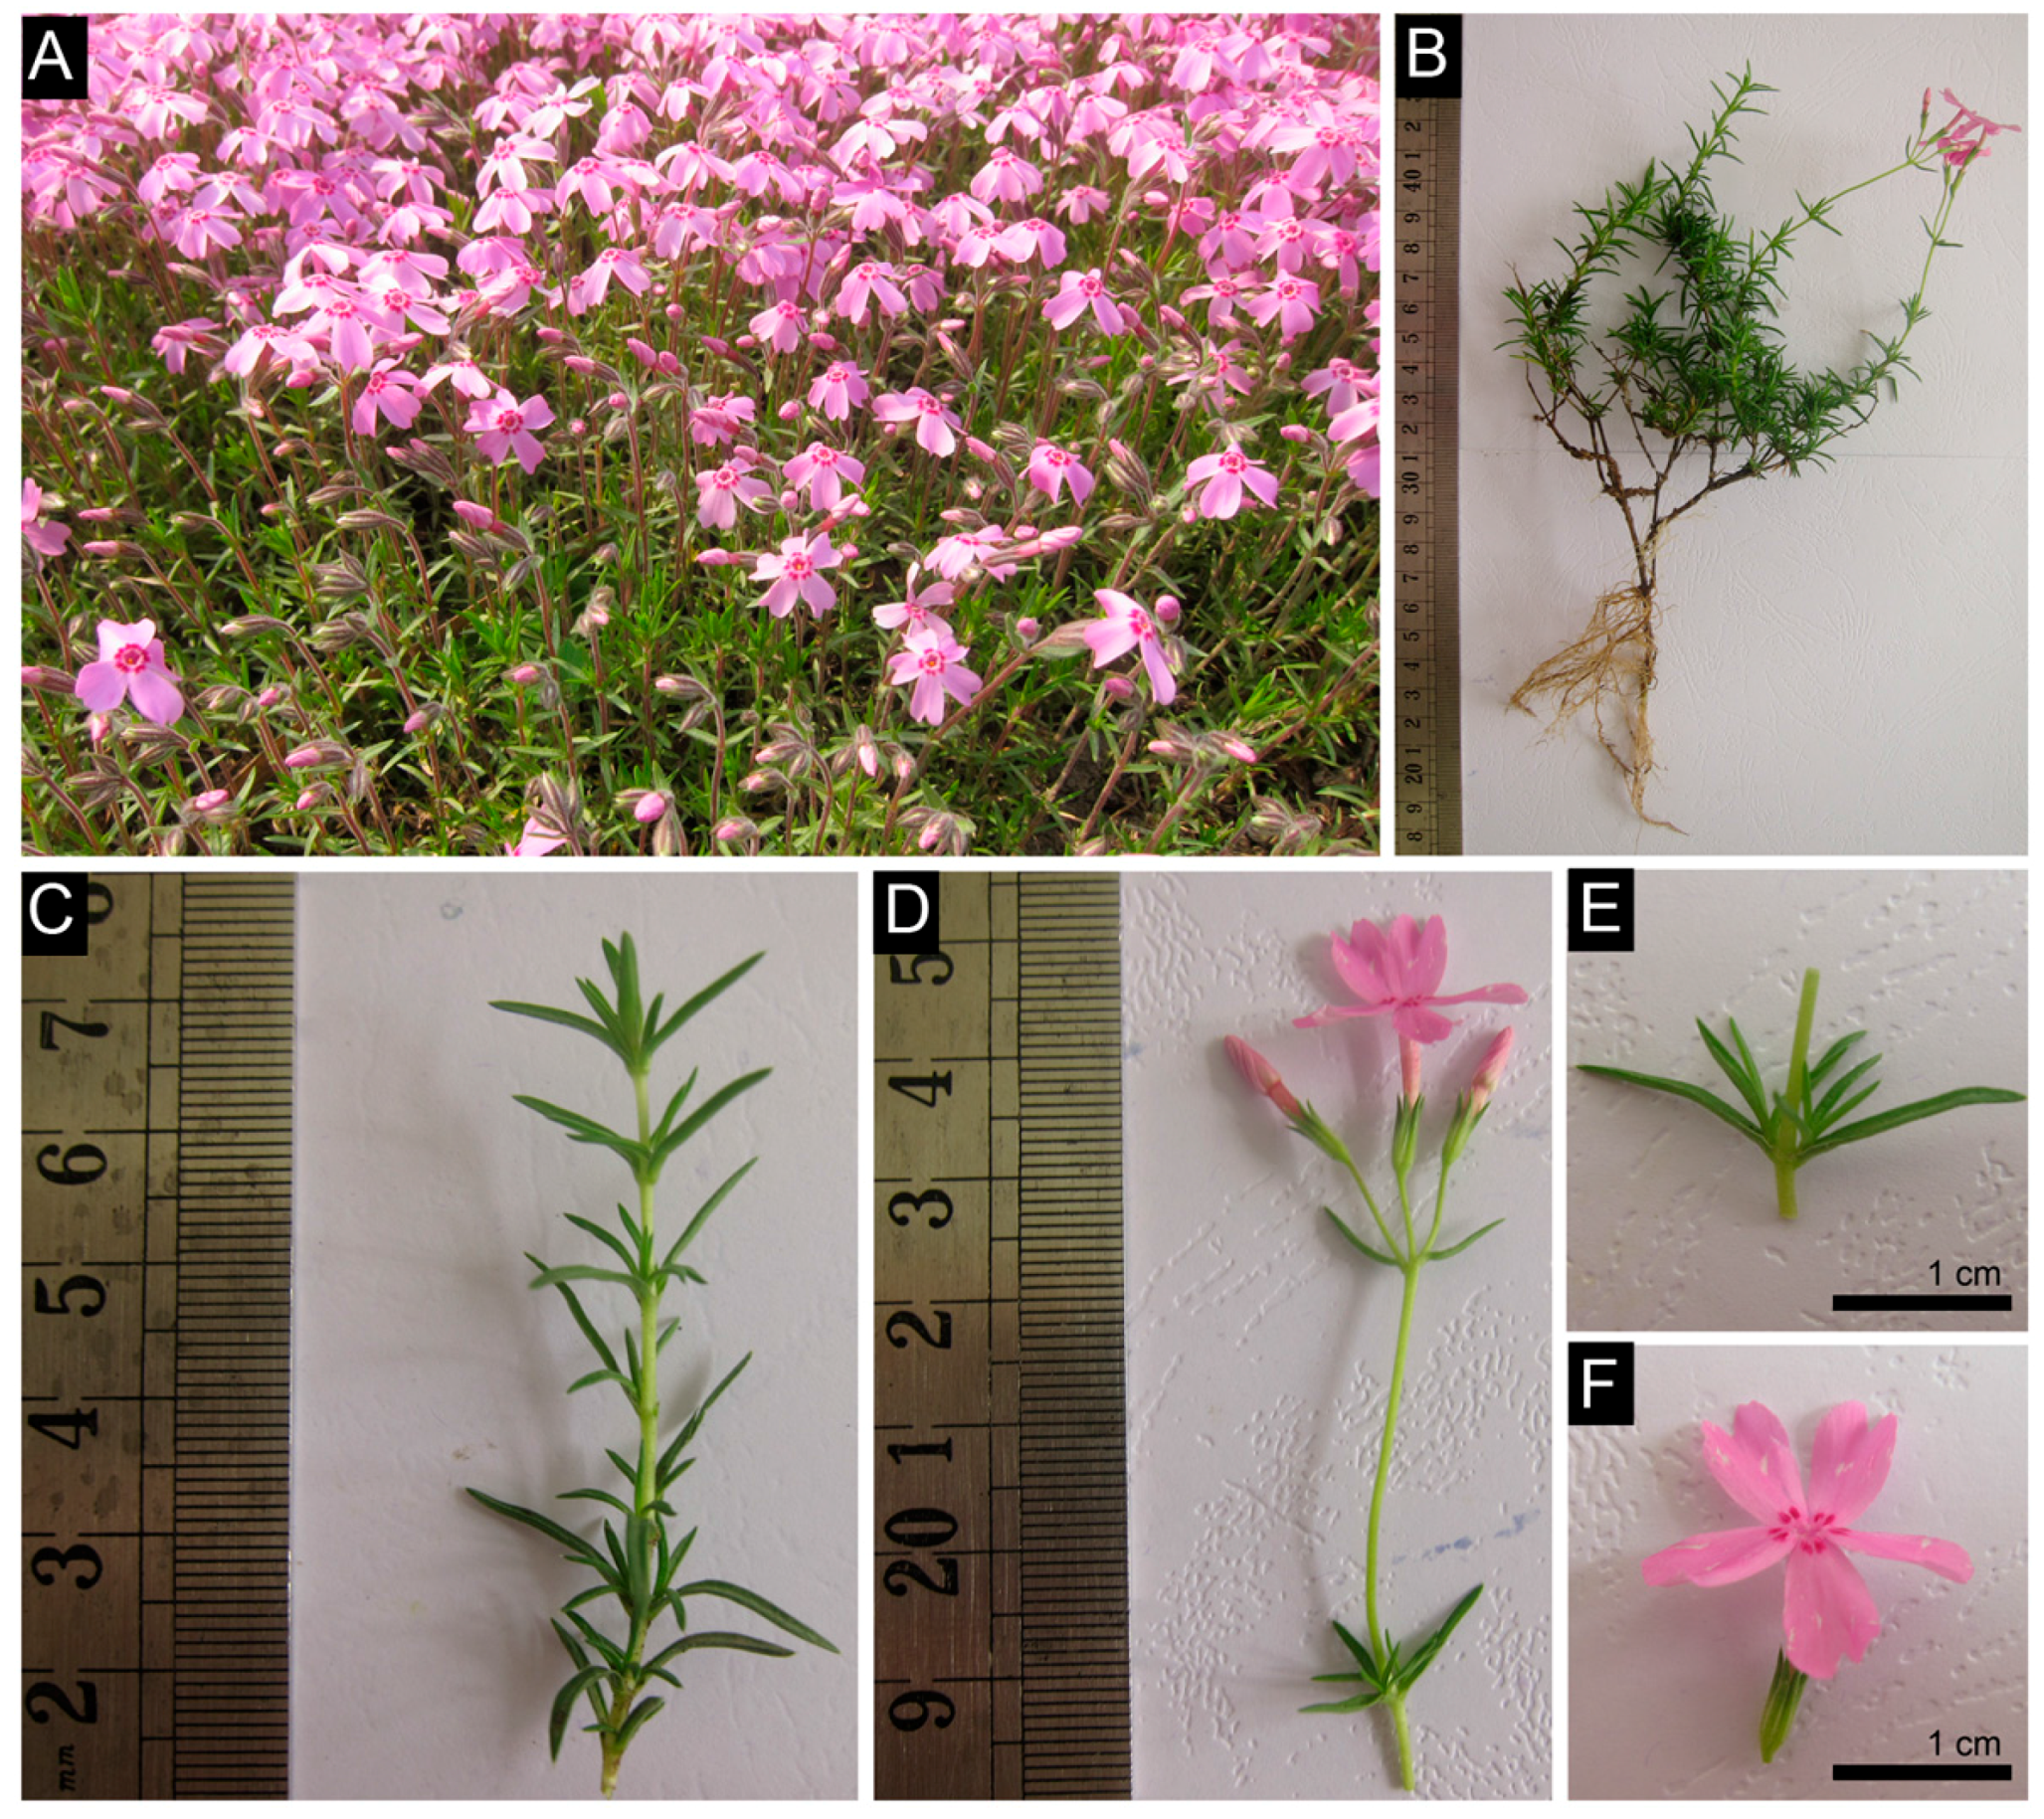
P. subulata plants grew and blossomed in the spring and autumn (
Figure 1A), producing a 10–15 cm high plant with old stem half-lignification (
Figure 1B), needle-like and leathery leaves, and 2 cm pink flowers (
Figure 1C–F). Sequence analysis and assembly were performed to investigate the transcriptome and gene expression profiles of
P. subulata under normal and cold stress. Four cDNA samples from seedlings of CT (4, 0 and −10 °C, subsequently referred to as CT1, CT2 and CT3, respectively) and CK (20 °C) plants were sequenced using an Illumina HiSeq 2000 platform. In total, we obtained approximately 55–59 million raw reads for CT and CK samples. After removing the low-quality reads and reads containing adaptors, 21.3 × 10
7 clean reads consisting of 19.2 × 10
9 nucleotides (nt) were obtained with a Q20 percentage (an error probability of 0.01) of more than 97% for four samples (
Table 1). All clean reads were deposited in the NCBI Sequence Read Archive (SRA,
http://www.ncbi.nlm.nih.gov/Traces/sra) database with accession number SRP055942.
Figure 1.
Phenotype characteristics of Phlox subulata. (A) Natural populations of P. subulata plants distribution in northeast China; (B−F) Phenotypes of the P. subulata plant, and its roots, stems (B); leaves (C,E); and flowers (D,F); Scale bars = 1 cm (E,F).
Figure 1.
Phenotype characteristics of Phlox subulata. (A) Natural populations of P. subulata plants distribution in northeast China; (B−F) Phenotypes of the P. subulata plant, and its roots, stems (B); leaves (C,E); and flowers (D,F); Scale bars = 1 cm (E,F).
Table 1.
Statistics of the sequencing and assembly of cold-treated (CT) and control (CK) Phlox subulata plants.
Table 1.
Statistics of the sequencing and assembly of cold-treated (CT) and control (CK) Phlox subulata plants.
| Samples | CK (20 °C) | CT1 (4 °C) | CT2 (0 °C) | CT3 (−10 °C) | Total |
|---|
| Total Raw Reads | 59,580,728 | 59,263,032 | 55,328,170 | 55,583,970 | – |
| Total Clean Reads | 55,528,592 | 55,319,076 | 51,409,114 | 51,736,252 | – |
| Total Clean Nucleotides (nt) | 4,997,573,280 | 4,978,716,840 | 4,626,820,260 | 4,656,262,680 | – |
| Q20 percentage | 97.50% | 97.53% | 97.41% | 97.51% | – |
| N percentage | 0.01% | 0.01% | 0.01% | 0.01% | – |
| GC percentage | 46.40% | 46.32% | 46.85% | 46.95% | – |
| Contig | | | | | |
| Total Number | 126,166 | 125,583 | 120,123 | 140,329 | – |
| Total Length (nt) | 48,095,639 | 47,695,976 | 42,622,577 | 48,874,606 | – |
| Mean Length (nt) | 381 | 380 | 355 | 348 | – |
| N50 | 820 | 857 | 714 | 705 | – |
| Unigene | | | | | |
| Total Number | 82,948 | 81,059 | 75,181 | 85,491 | 99,174 |
| Total Length (nt) | 67,146,823 | 63,741,994 | 54,402,959 | 60,415,665 | 98,892,318 |
| Mean Length (nt) | 810 | 786 | 724 | 707 | 997 |
| N50 | 1470 | 1434 | 1369 | 1322 | 1622 |
| Total Consensus Sequences | 82,948 | 81,059 | 75,181 | 85,491 | 99,174 |
| Distinct Clusters | 30,546 | 29,615 | 23,876 | 27,448 | 42,007 |
| Distinct Singletons | 52,402 | 51,444 | 51,305 | 58,043 | 57,167 |
Transcriptome
de novo assembly was performed using Trinity program [
15]. All high-quality clean reads of each sample were assembled into 125,583 (CT1), 120,123 (CT2), 140,329 (CT3) and 126,166 (CK) contigs, respectively (
Table 1). In four samples, the average contig length exceeded 340 nt (length distributions of these contigs are shown in
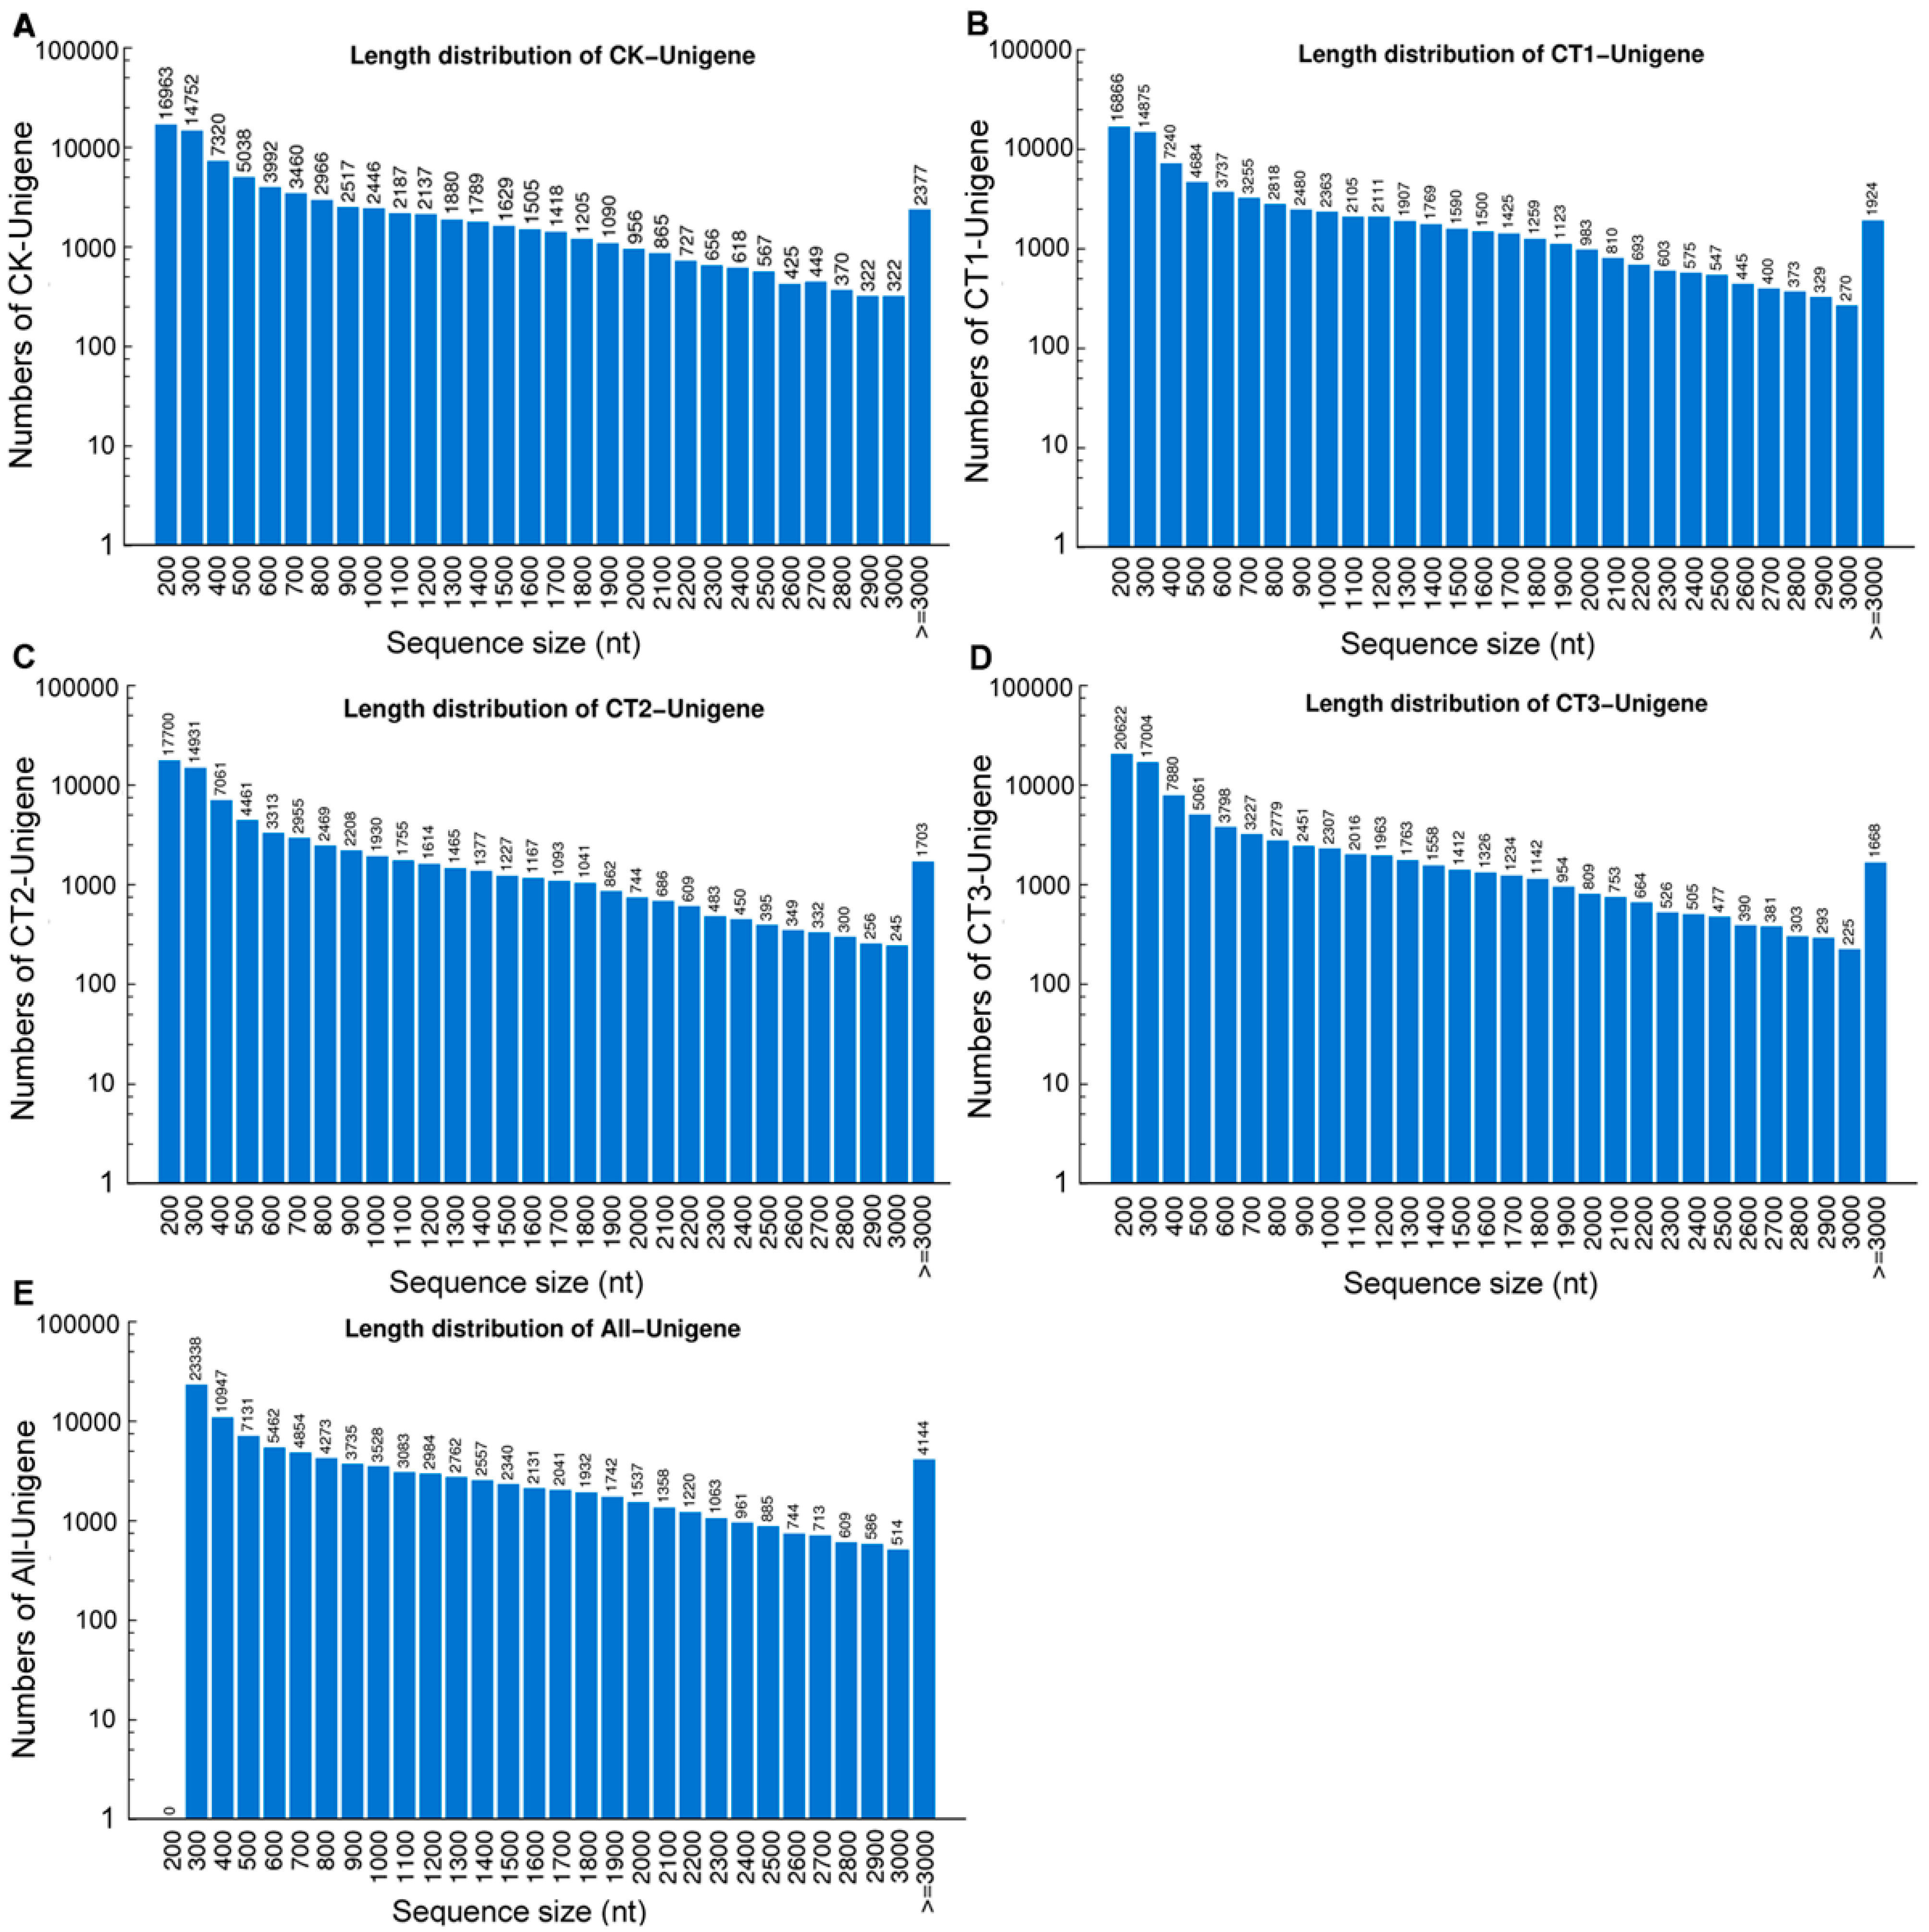
Figure S1). The contigs of each sample were then joined into unigenes, generating 81,059 (CT1), 75,181 (CT2), 85,491 (CT3) and 82,948 (CK) unigenes, respectively. After long-sequence clustering of four samples, a total of 99,174 unigenes were obtained for all samples. The total length was 98,892,318 nt, with a mean length of 997 nt and an N50 of 1622 nt (
Table 1). The length distributions of unigenes of each sample are given in
Figure 2.
2.2. Functional Annotation and Classification of the Assembled Unigenes
To validate and annotate the assembled unigenes, sequence similarity searches were conducted using sequence- and domain-based alignments. In total, 99,174 unigenes from all groups significantly matched a sequence in at least one of the public databases, including NCBI non-redundant protein (NR), Swiss-Prot protein, Kyoto Encyclopedia of Genes and Genomes (KEGG), Clusters of Orthologous Groups (COG), and Gene Ontology (GO) databases. There were 59,994 unigenes (60.49% of all unigenes) with homologous sequences in at least one of the aforementioned databases (
Table 2). Among them, 55,996 (56.5%), 39,519 (39.8%), 36,150 (36.5%), 24,872 (25.1%) and 41,688 (42.0%) unigenes were found in NR, SwissProt, KEGG, COG, and GO databases, respectively. The remaining 39,180 (39.5%) unmapped unigenes were not identified (
Table 2). After searching all unigene sequences against four protein databases (NR, SwissProt, KEGG, and COG) using BLASTx (
E-value < 0.00001), we identified 57,044 coding sequences (CDSs) and predicted proteins. For unigenes with no BLAST hits, we used ESTScan to predict 6834 CDSs and predicted proteins. The distributions of the CDSs and predicted proteins are shown in
Figure 3.
Figure 2.
Length distributions of the unigenes from cold-treated (CT) and control (CK) samples. (A−E) The length distributions of unigenes from CK (A); CT1 (B); CT2 (C); CT3 (D); and all samples (E).
Figure 2.
Length distributions of the unigenes from cold-treated (CT) and control (CK) samples. (A−E) The length distributions of unigenes from CK (A); CT1 (B); CT2 (C); CT3 (D); and all samples (E).
Table 2.
Number of functional annotations for all unigenes in public databases.
Table 2.
Number of functional annotations for all unigenes in public databases.
| Public Protein Database | Number of Unigenes | Percentage (%) |
|---|
| NR | 55,996 | 56.5 |
| Swiss-Prot | 39,519 | 39.8 |
| KEGG | 36,150 | 36.5 |
| COG | 24,872 | 25.1 |
| GO | 41,668 | 42.0 |
| All | 59,994 | 60.5 |
| Unmapped | 39,180 | 39.5 |
Figure 3.
Length distributions of the protein-coding region predictions (CDSs) (A−D). The length distributions of CDSs using BLASTx (A); the length distributions of proteins using BLASTx (B); the length distributions of CDSs using ESTscan (C); the length distributions of proteins using ESTscan (D).
Figure 3.
Length distributions of the protein-coding region predictions (CDSs) (A−D). The length distributions of CDSs using BLASTx (A); the length distributions of proteins using BLASTx (B); the length distributions of CDSs using ESTscan (C); the length distributions of proteins using ESTscan (D).
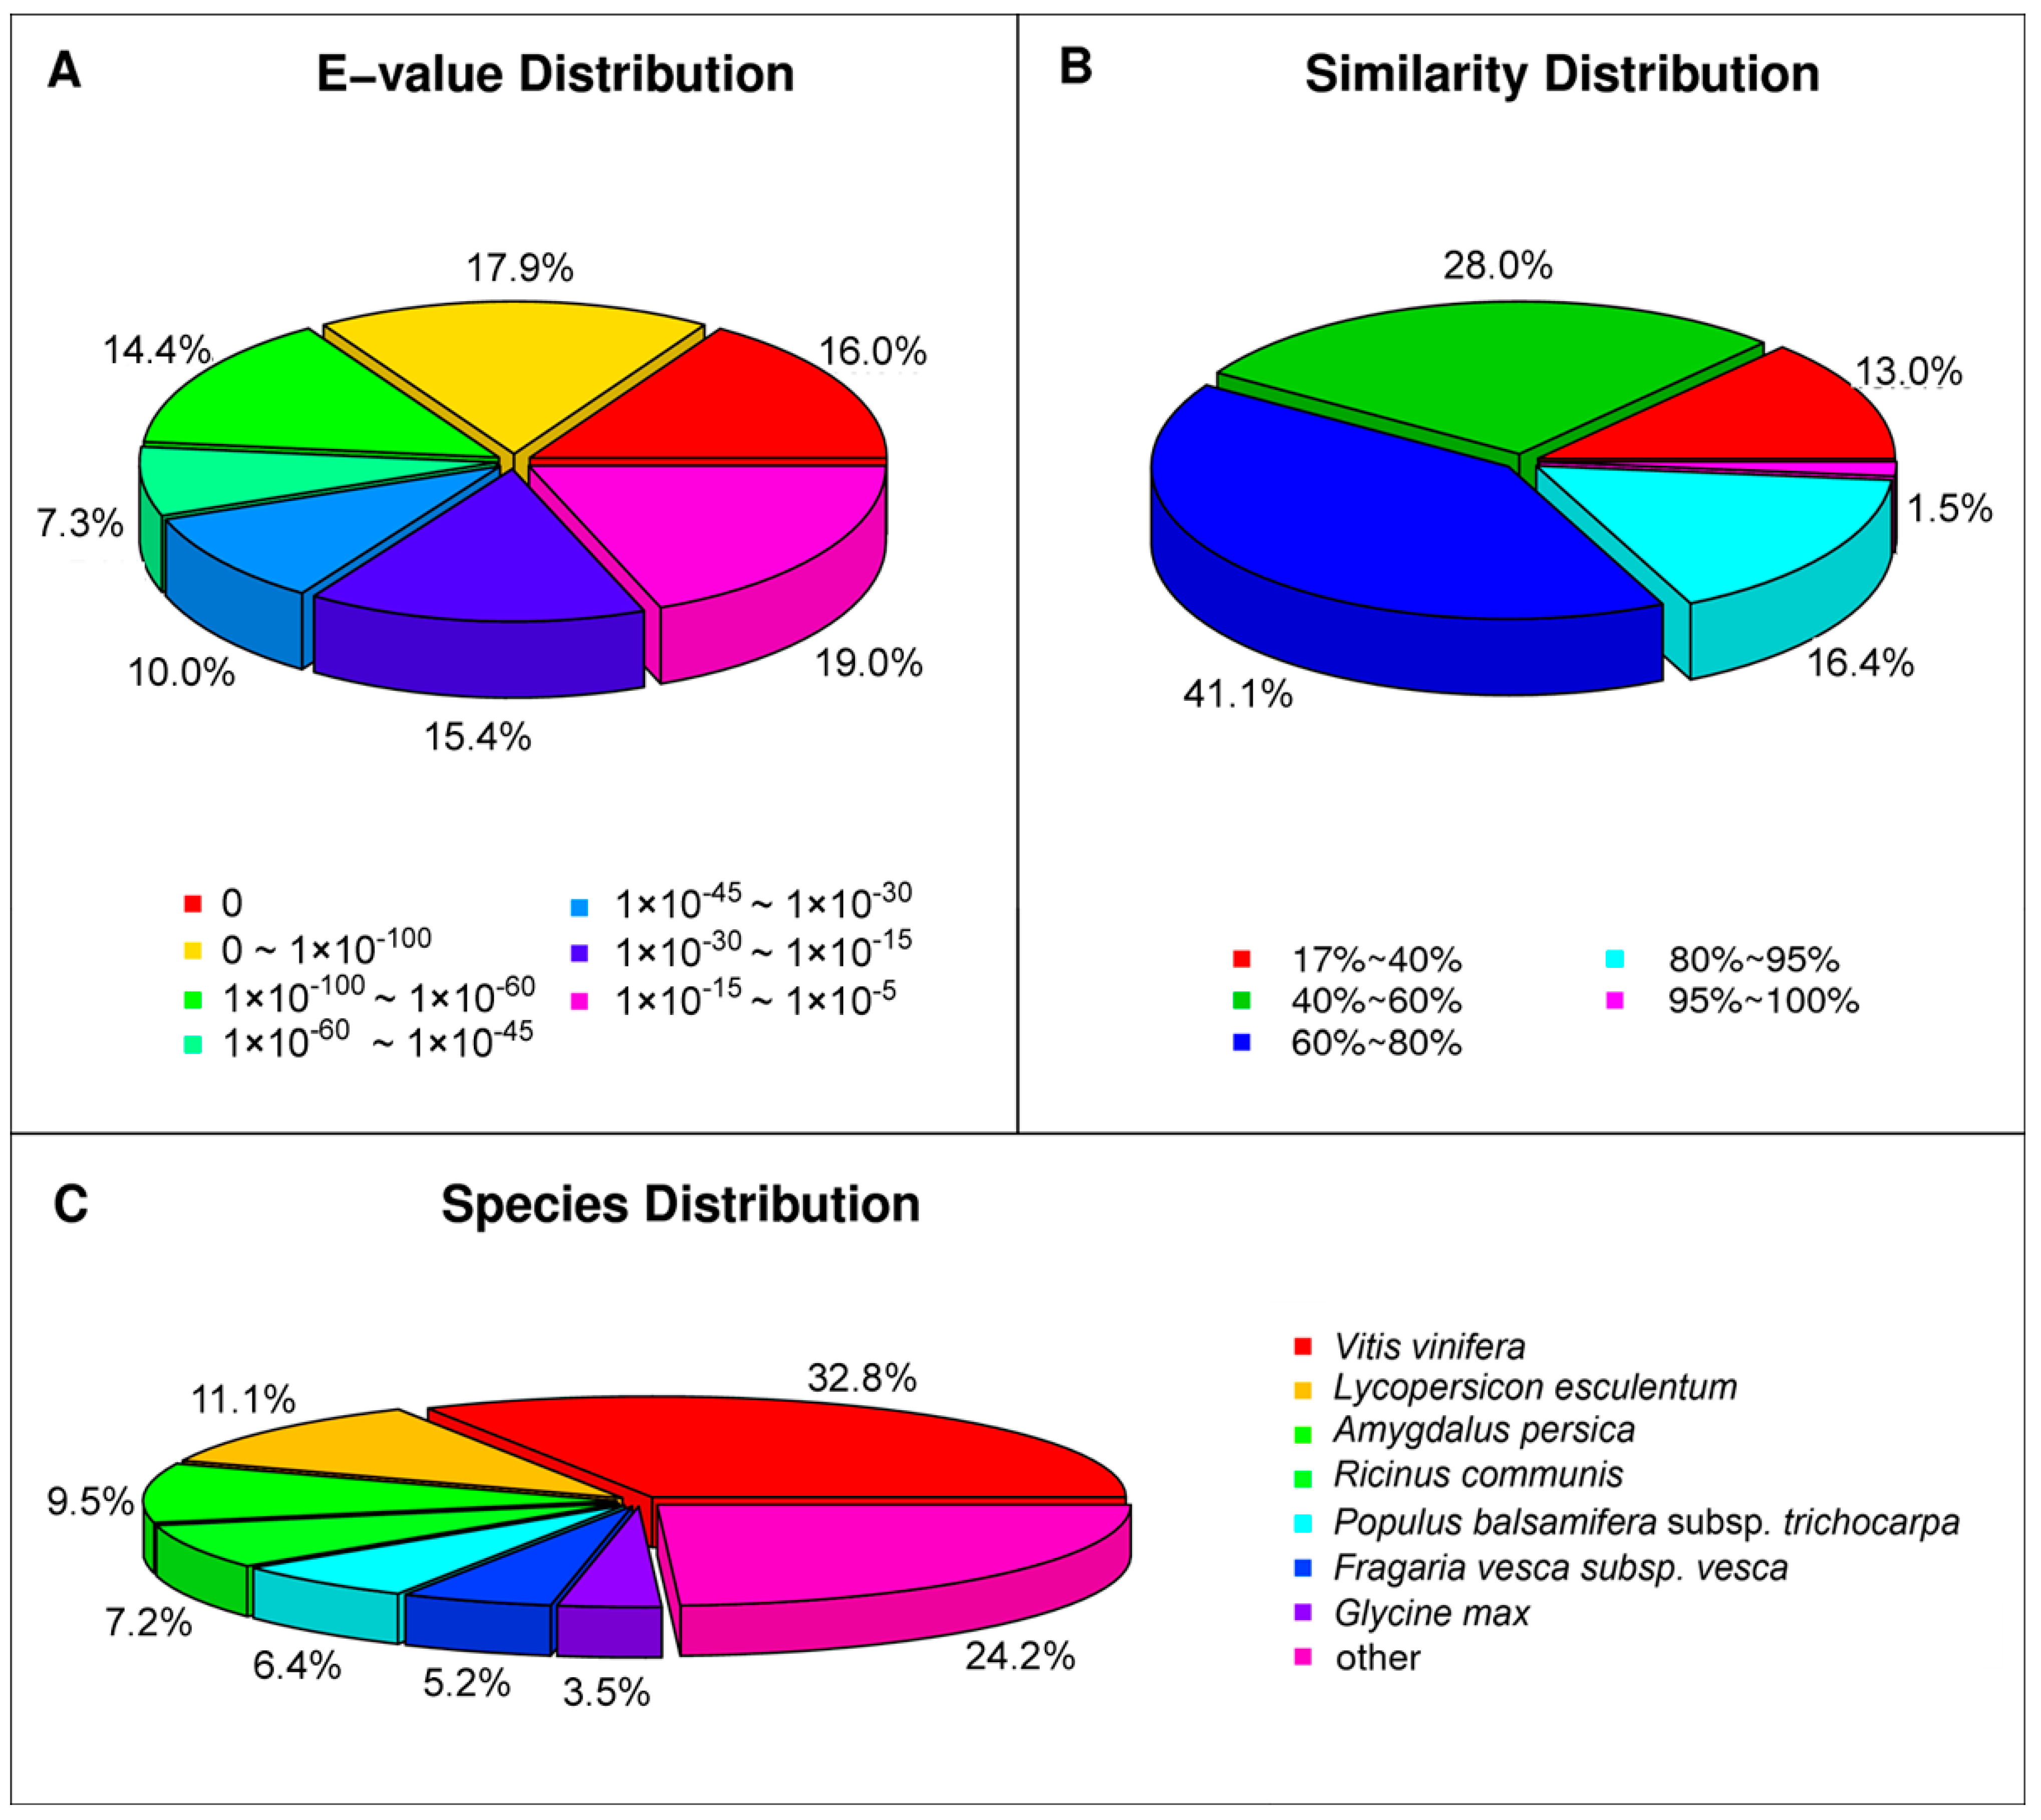
For the NR annotations, 55,996 of the unigenes were found to be matched in the database. For the
E-value distribution, 44.4% of moderate homolog sequences ranged from 1.0 × 10
−5 to 1.0 × 10
−45, while 55.6% of sequences had a threshold
E-value less than 1.0 × 10
−45, showing strong homology (
Figure 4A). The identity distribution pattern showed that 59% of the sequences had a similarity higher than 60%, while 41% showed similarity between 17% and 60% (
Figure 4B). The majority of the annotated sequences corresponded to the known protein sequences of plant species. However, we found that 32.8% of the unigenes had similar sequences to proteins from
Vitis vinifera, followed by
Lycopersicon esculentum (11.1%),
Amygdalus persica (9.5%),
Ricinus communis (7.2%) and
Populus balsamifera subsp
. Trichocarpa (6.4%;
Figure 4C). In addition, the other 24.2% unigenes had matches with other plant species, such as
Cucumis sativus and
Medicago truncatula. This result suggested that the sequences of the
P. subulata transcripts generated in the present study were assembled and annotated properly.
Figure 4.
Characteristics of homology search of query sequences aligned by BLASTx to the NCBI nonredundant (NR) database. (A) E-value distribution of BLAST hits for matched unigene sequences, using an E-value cutoff of 1.0 × 10⁻⁵; (B) Similarity distribution of top BLAST hits for each unigene; (C) Species distribution of the top BLAST hits.
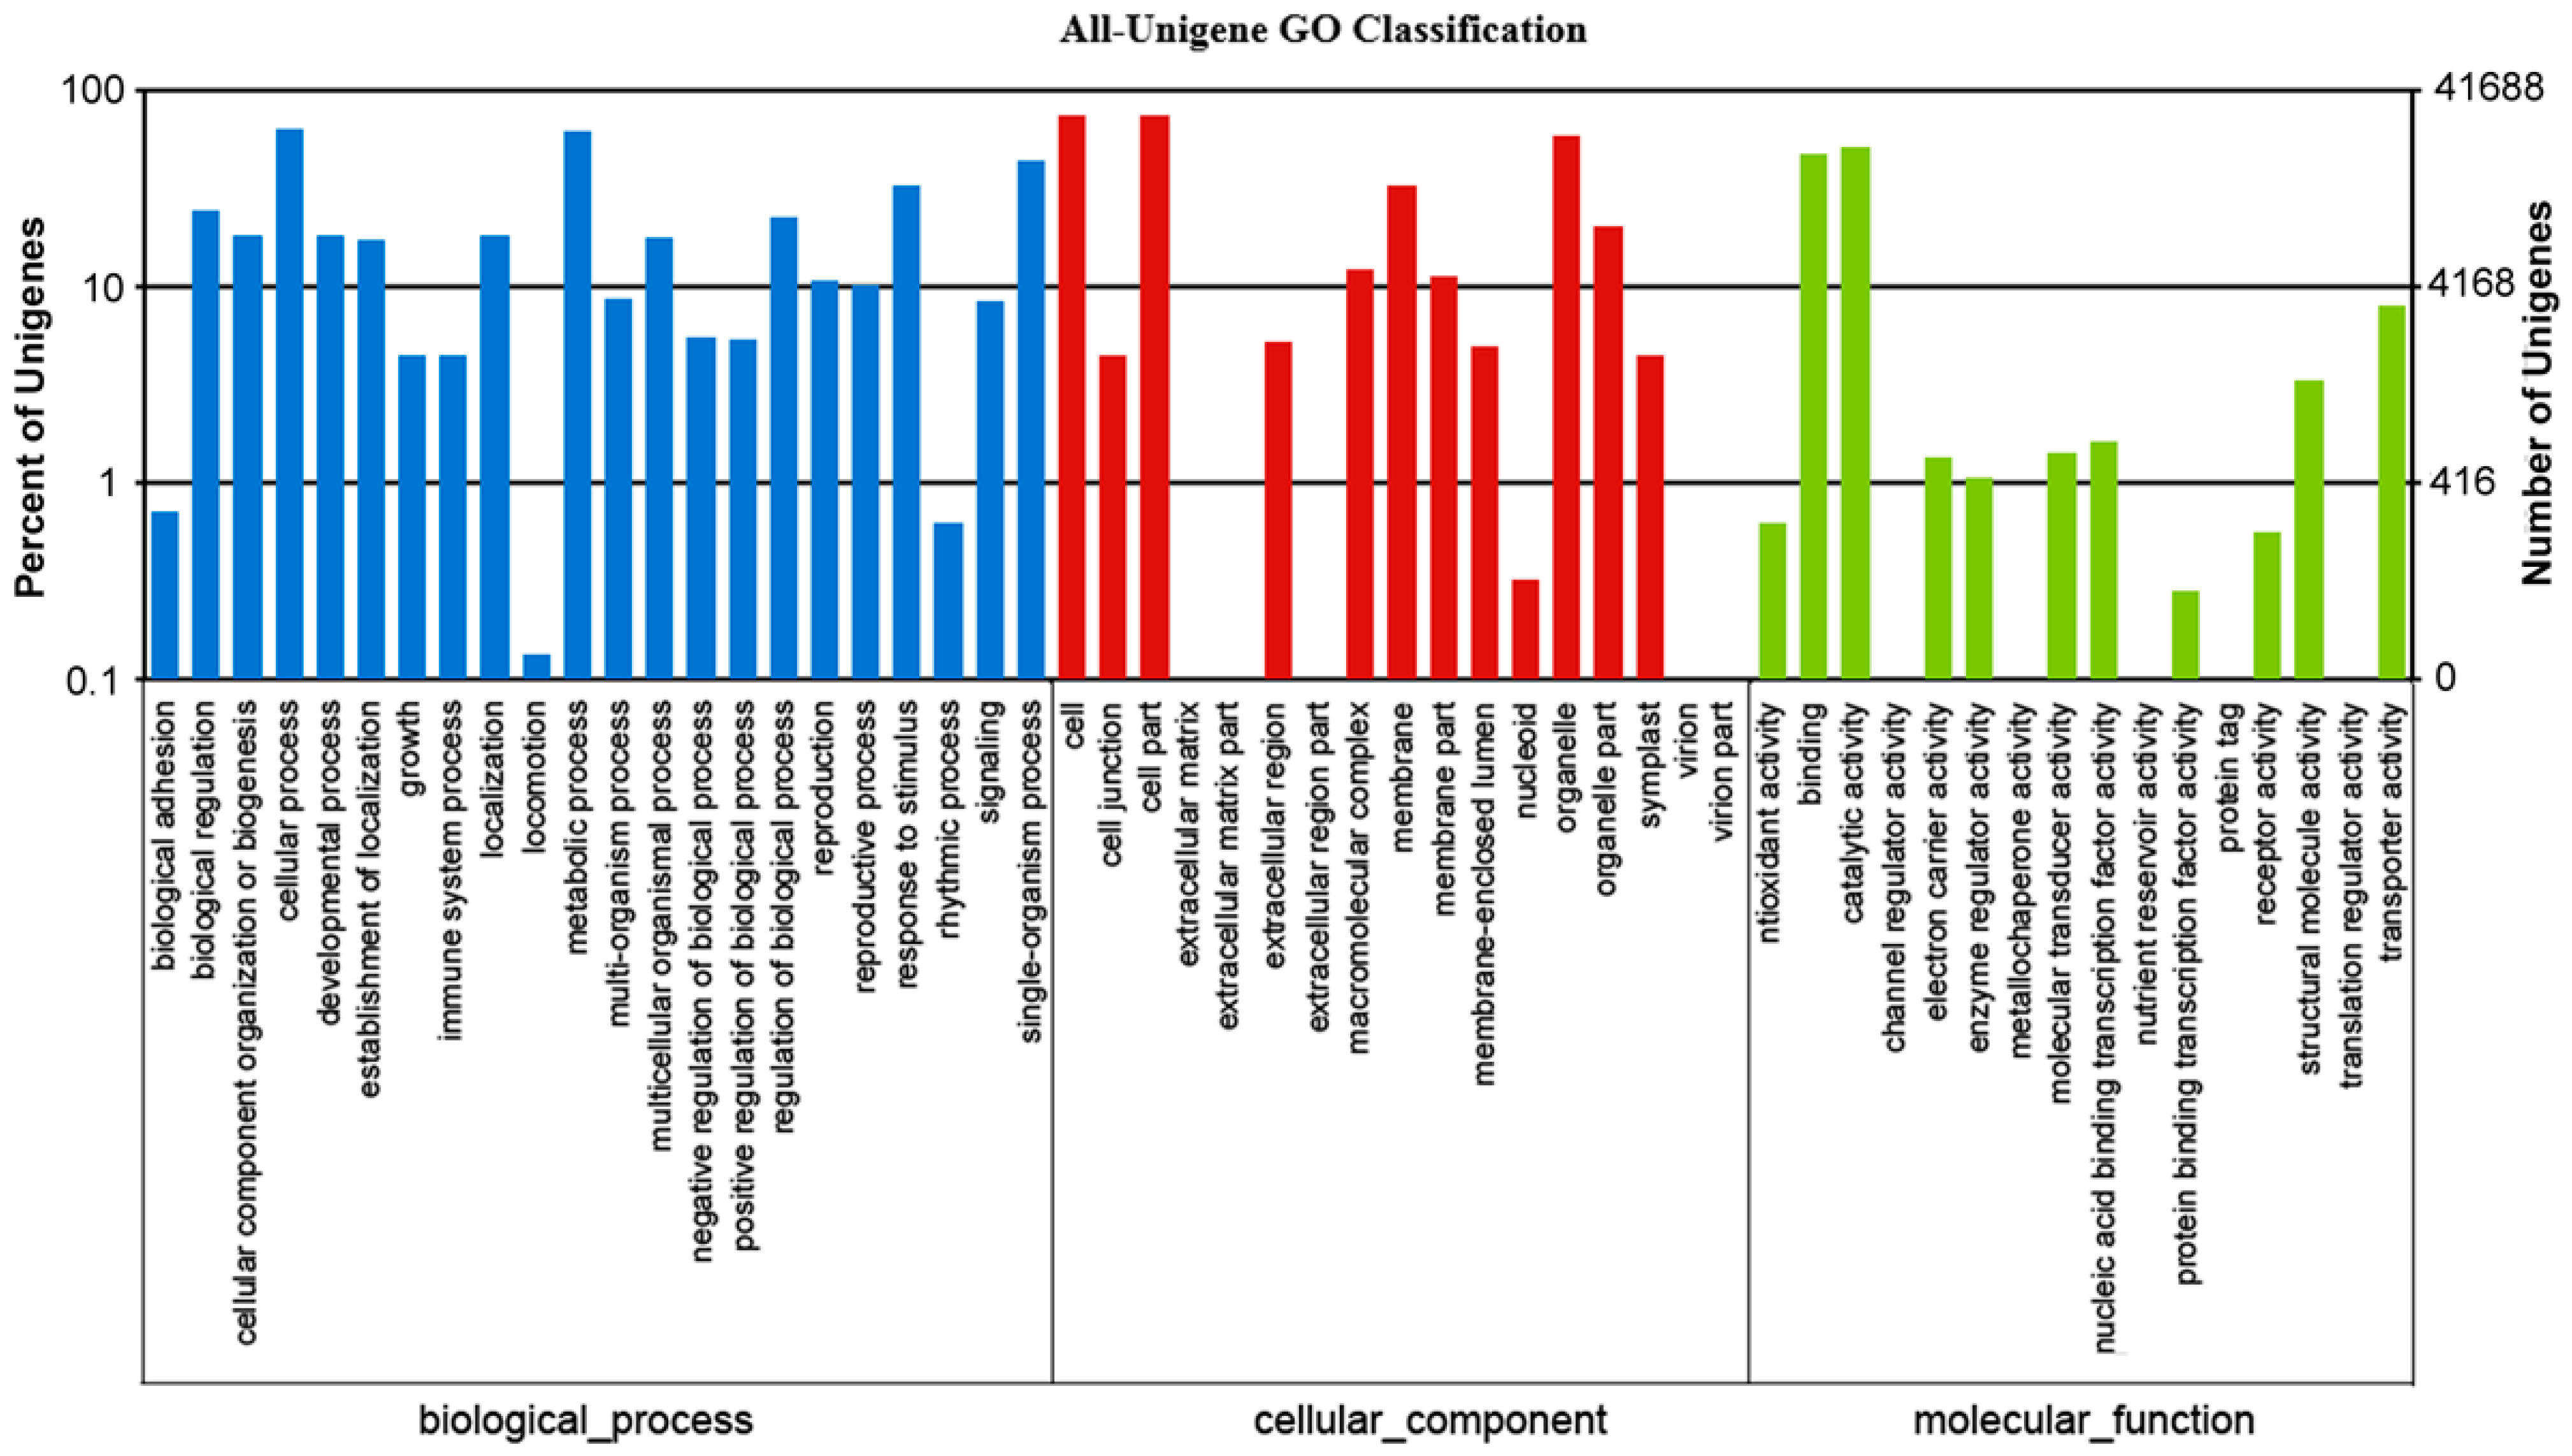
Based on the NR annotation, we used the GO annotation to classify the possible functions of the unigenes. GO annotation is an international classification system that provides controlled vocabulary for descriptions of gene functions [
16]. A total of 41,688 (42.0% of all unigenes) unigenes were successfully assigned to at least one GO term. All the GO terms were classified into 56 functional groups, including three main categories: biological processes, cellular components, and molecular functions (
Figure 5). Among biological processes, transcript sequences assigned to cellular (26,638), metabolic (25,871) and single-organism processes (18,247) were the most abundant. For cellular components, proteins were mostly assigned to cell (31,028), cell part (31,024) and organelle (24,793) categories. Within the molecular function category, the majority of the GO terms were predominantly assigned to binding (19,903), catalytic activity (21,442) and transporter activity (3303) (
Figure 5). Similar results were found in many plant species [
11,
12,
13], suggesting that the DEGs were responsible for fundamental biological metabolism and regulation.
Figure 5.
Histogram of gene ontology (GO) classification. The results are summarized in three main categories: Biological processes (blue), cellular components (brown) and molecular functions (green). The y-axis on the right side indicates the percent of unigenes in a category, and the y-axis on the left side indicates the number of unigenes.
To further predict gene function and to evaluate the integrality of the
P. Subulata transcriptome, all unigenes were searched against the COG database. Overall, 24,872 (25.1% of all unigenes) unigenes were assigned COG classifications (
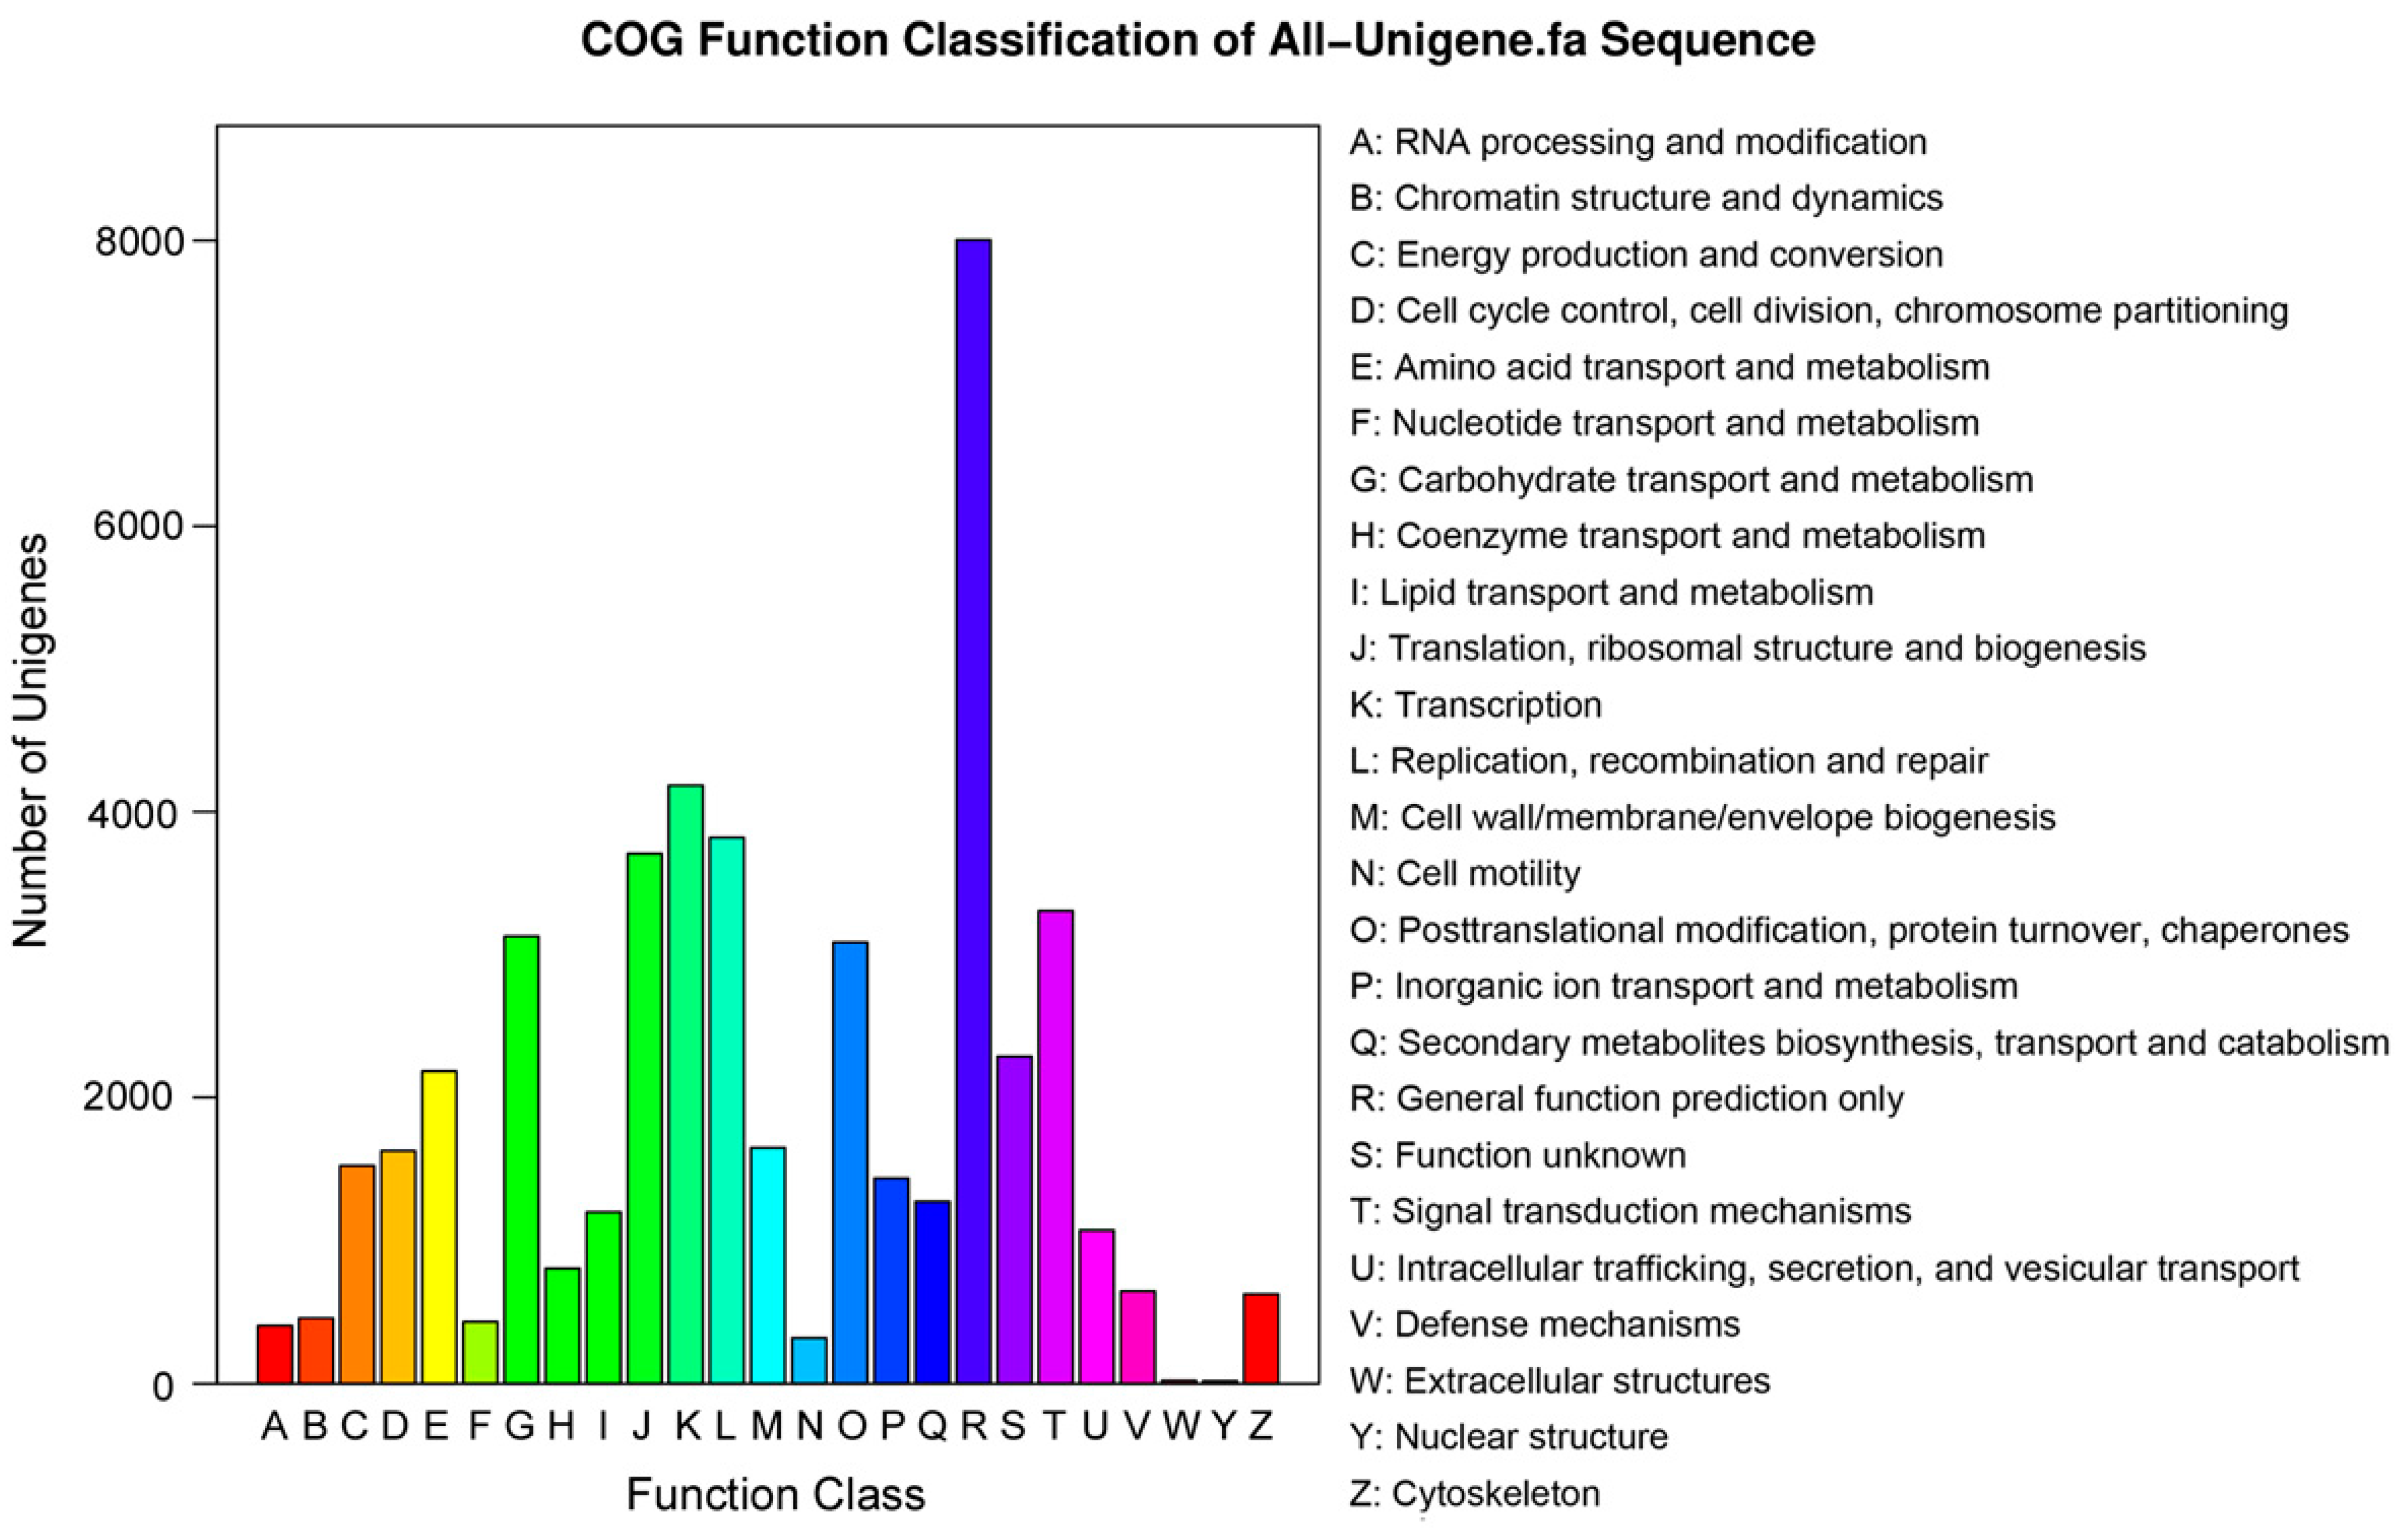
Figure 6). By classifying the possible functions of these unigenes, we grouped the unigenes into 25 functional categories. The largest category was “General function prediction only” (8804 of 24,872 unigenes, about 35.4%), followed by “Transcription” (4186 unigenes, 16.8%), “Replication, recombination and repair” (3820, 15.4%), “Translation, ribosomal structure, and biogenesis”, (3708, 14.9%), and “Signal transduction mechanisms” (3307, 13.3%). The categories of “Nuclear structure” (19, 0.07%), “Extracellular structures” (21, 0.08%) and “Cell motility” (320, 1.29%) had the fewest responding unigenes. Additionally, 2287 (9.10%) unigenes were annotated as “Function unknown” (
Figure 6).
Figure 6.
Clusters of orthologous groups (COG) functional classification. A total of 24,872 unigenes were assigned to 25 classifications. The capital letters along the x-axis indicate the COG categories as listed on the right of the histogram, and the y-axis indicates the number of unigenes.
Figure 6.
Clusters of orthologous groups (COG) functional classification. A total of 24,872 unigenes were assigned to 25 classifications. The capital letters along the x-axis indicate the COG categories as listed on the right of the histogram, and the y-axis indicates the number of unigenes.
2.3. Analysis of Potential Differentially Expressed Genes (DEGs)
To identify different expression levels of unigenes, we used the reads per kb per million reads (RPKM) method to calculate the expression levels of the unigenes from CT and CK samples. Screening of DEGs (FDR ≤ 0.001 and ratios larger than 2), the results showed that the numbers of both up- and down-regulated genes changed with reduction of the temperature. The distribution of transcript changes of unigenes is shown in
Figure S2. Among all DEGs, 8302 were induced by cold, while 9898 were down-regulated after incubation at 4 °C (CT1;
Figure 7 and
Table S1). After incubation at 0 °C (CT2), 10,638 genes were up-regulated and 17,876 were down-regulated (
Figure 7 and
Table S2). After incubation at −10 °C (CT3), 11,021 genes were up-regulated, and 12,358 were down-regulated (
Figure 7 and
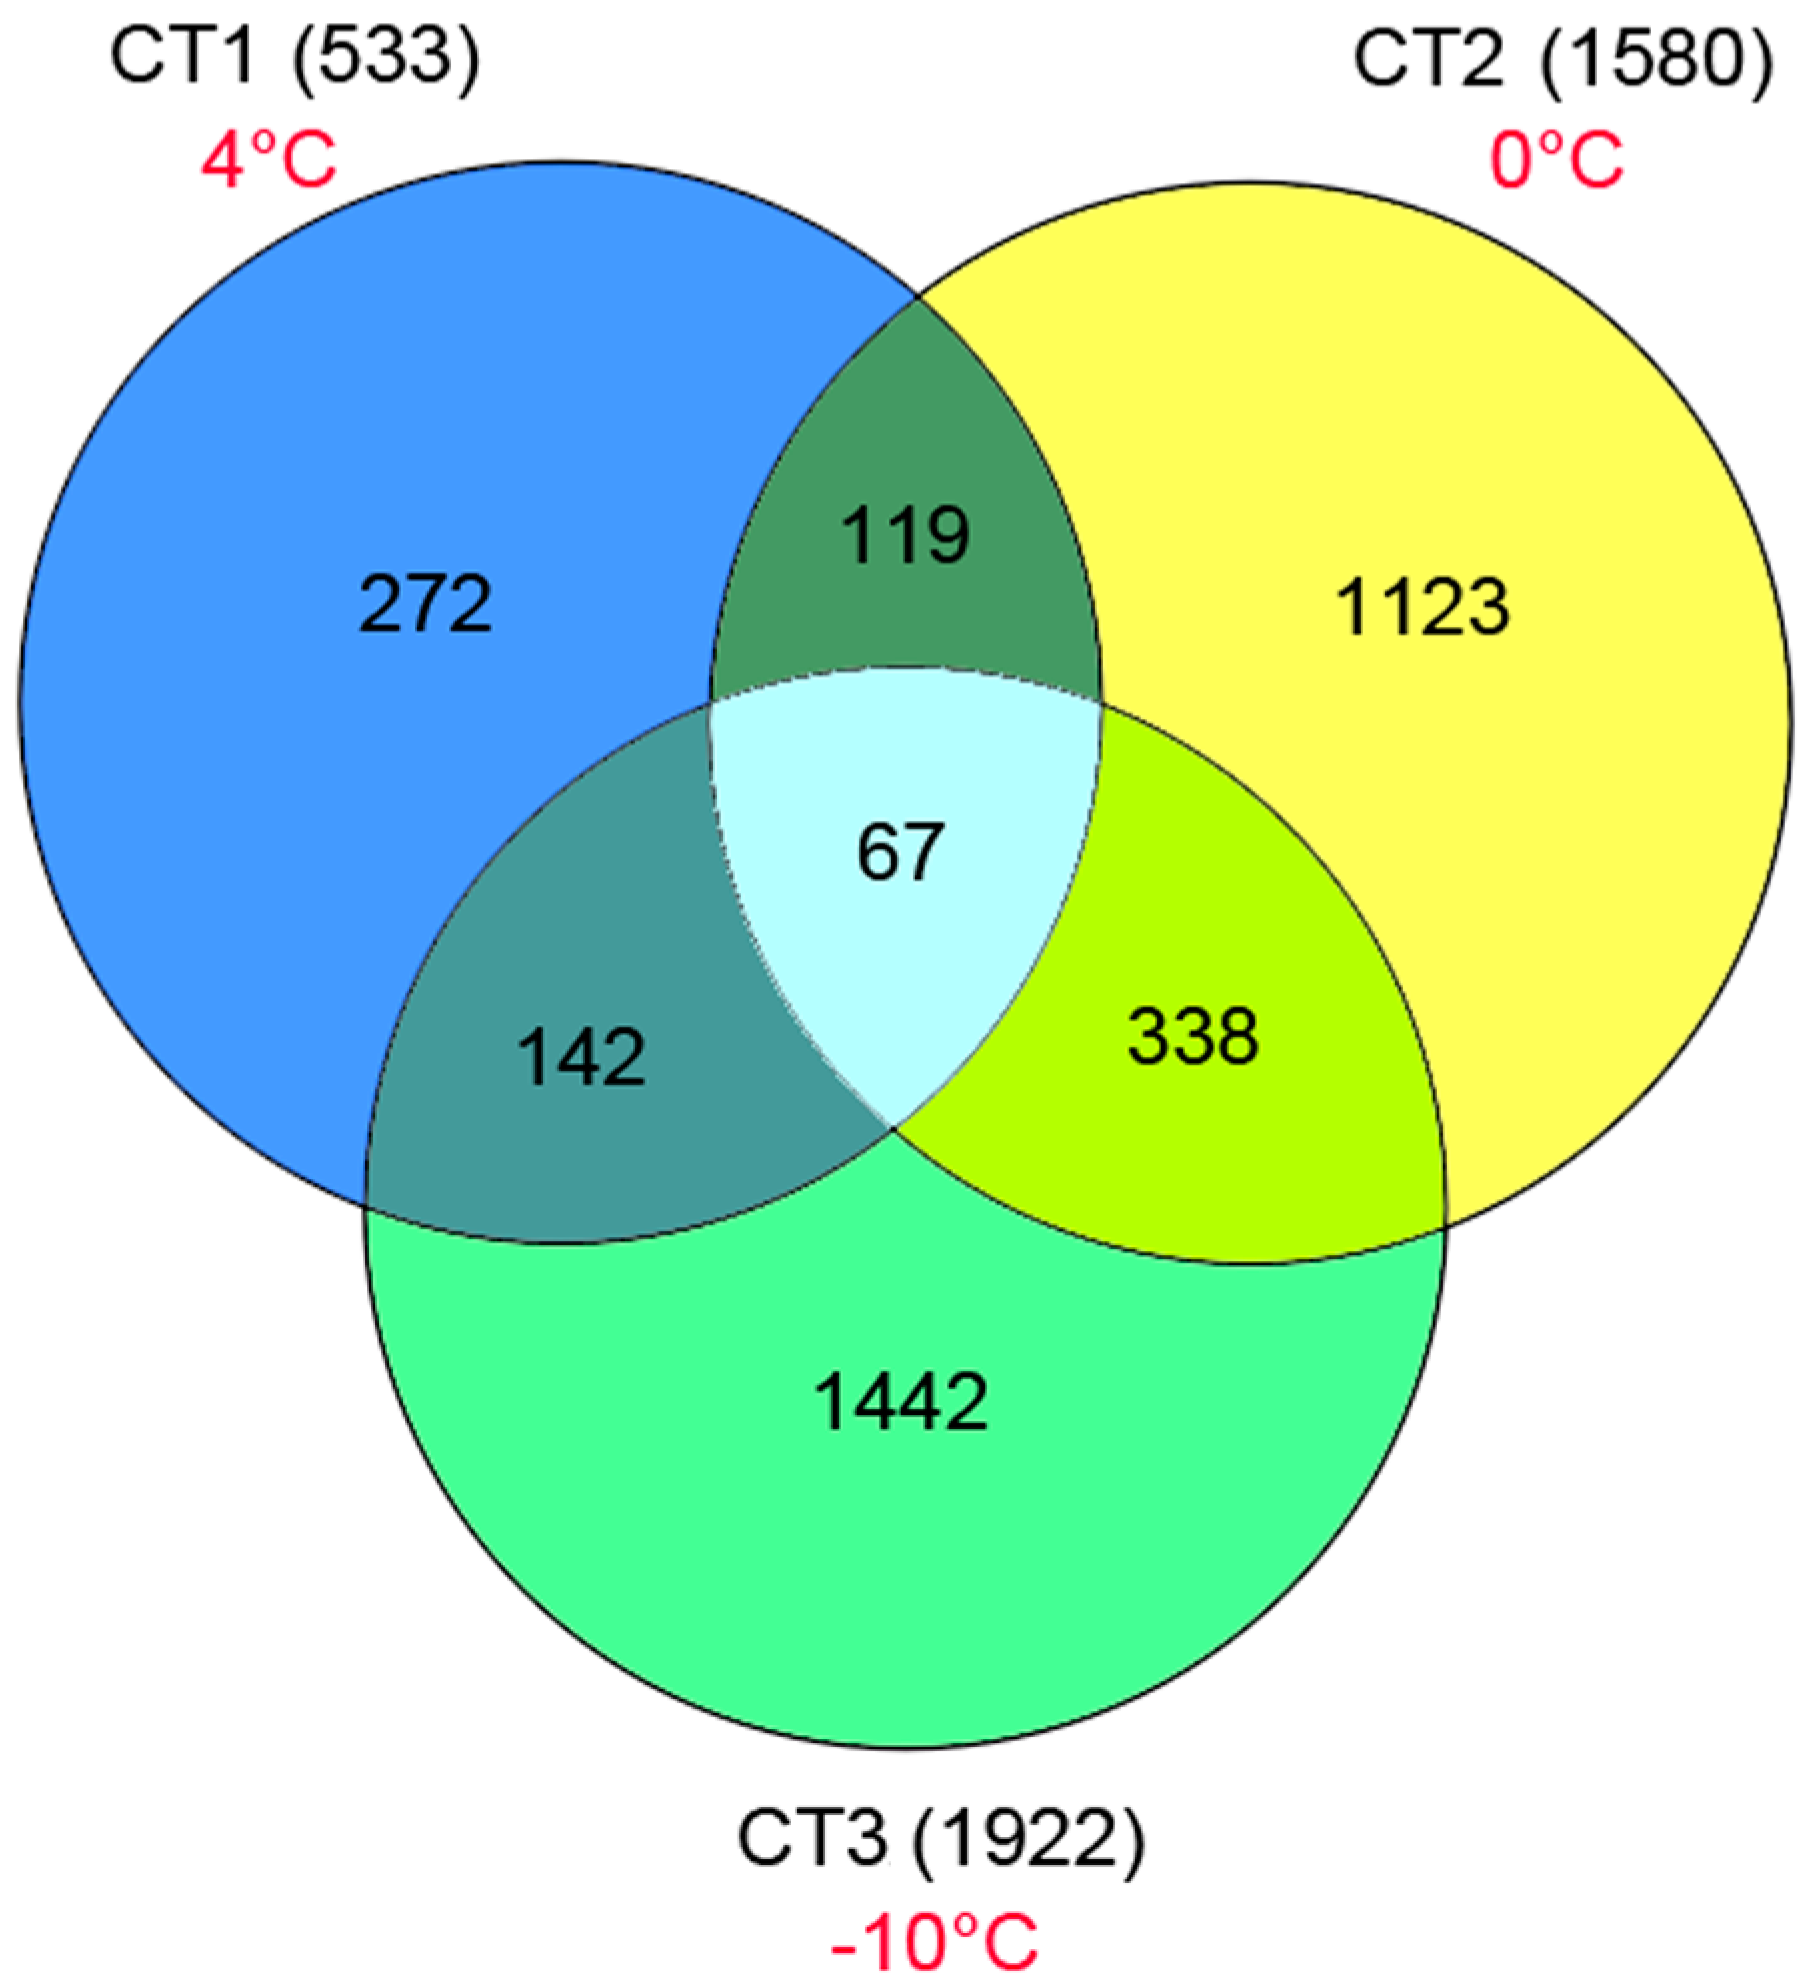
Table S3). We also identified a total of 3417 up-regulated unigenes expressed only in the CT samples (
Table S4). Among them, 533, 1580 and 1922 unigenes were found in CT, CT2 and CT3, respectively (
Figure 8). Some of these unigenes had no homologs in the NCBI database, suggesting that they may represent new cold-related transcripts that have not been reported in model plants.
Figure 7.
Differentially expressed genes in P. subulata under low temperatures. The numbers of up-regulated and down-regulated genes in cold-treated (CT) samples are shown. We used “false discovery rate ≤0.001 and the absolute value of log2Ratio ≥1” as the threshold to judge the significance of differences in gene expression. Control (CK) plants were grown at 20 °C. CT1, CT2 and CT3 plants were incubated at 4, 0 and −10 °C, respectively.
Figure 8.
The numbers of up-regulated genes expressed only in the three CT samples (4, 0, and –10 °C).
Figure 8.
The numbers of up-regulated genes expressed only in the three CT samples (4, 0, and –10 °C).
2.5. Identification of Major Genes Involved in Cold Stress
Next, we concentrated on analysis of genes up-regulated in response to cold stress in
P. subulata. Functional annotations of up-regulated unigenes showed that some unigenes were closely related to cold stress, including cold-inducible transcription factors, cold-induced proteins, antioxidant enzymes, osmoregulation proteins, and proteins related to Ca
2+ and ABA signaling [
12,
13,
17,
18]. We selected 20 cold-related unigenes and estimated their expression levels by the RPKM method (
Table 4). Among these genes, dehydration-responsive element binding protein (DREB), ethylene-responsive element binding factor (AP2/ERF), and the transcription factors MYB (v-myb avian myeloblastosis viral oncogene homolog) and ICE1 (inducer of CBF expression 1) were found to be significantly induced by cold stress in
P. subulata. These transcription factors have been described as major factors involved in plant cold-stress responses [
5,
19,
20]. Small groups of cold-related proteins, including low temperature-regulated (LT), cold-regulated (COR), and shock proteins were involved in responses to cold stimuli. Genes within the LT and COR groups have been previously reported to be involved in the cold stress response process [
21,
22]. Additionally, some antioxidant enzymes and osmoregulation proteins were identified, including superoxide dismutase (SOD), peroxidase (POD), catalase (CAT), glutathione peroxidase (GPX), water stress-induced protein, and sugar transporter. Under cold stress, reactive oxygen species (ROS) accumulate, and water becomes imbalanced in plants. These phenotypes are harmful to both the membrane and related biochemical reactions [
23]. The accumulation of antioxidant enzymes and osmoregulation proteins contributes to the stabilization of membranes as these molecules protect membranes against cold injury [
18,
24]. Moreover, we also found that ABA-hydroxylase and calcium-dependent protein kinase (CDPK) were up-regulated (
Table 4). These genes may be involved in the modification and processing of ABA and Ca
2+ signaling molecules, which play important roles in signal transduction under cold stress [
18,
25]. Finally, many unigenes with no known homologs in the NR were also found. These unigenes may represent novel genes specifically expressed in
P. subulata or may participate in specific regulatory mechanisms associated with cold adaptation in
P. subulata. However, further studies are needed to verify and characterize these unigenes.
Table 4.
Analysis of differences in the expression of genes up-regulated in response to cold stress in Phlox subulata.
Table 4.
Analysis of differences in the expression of genes up-regulated in response to cold stress in Phlox subulata.
| Gene ID | Annotation | Expression Difference Analysis (Log2(CT_RPKM/CK_RPKM)) |
|---|
| CT1/CK | CT2/CK | CT3/CK |
|---|
| Unigene933_All | Dehydration-responsive element-binding protein 1B | 0.49 | 4.23 | 5.12 |
| Unigene30882_All | Dehydration-responsive element-binding protein 1D | 1.49 | 4.22 | 5.23 |
| Unigene13555_All | AP2/ERF domain-containing transcription factor | 1.56 | 3.50 | 4.03 |
| CL11425.Contig1_All | Transcription factor MYB1R1 | 1.91 | 0.47 | 1.49 |
| CL10927.Contig2_All | Transcription factor ICE1 | 0.56 | 1.88 | 2.18 |
| CL12801.Contig1_All | Cold-inducible protein | 3.46 | 7.43 | 4.37 |
| CL3749.Contig3_All | Cold-inducible protein | 5.33 | 10.29 | 9.68 |
| CL10279.Contig1_All | Cold acclimation protein COR413PM2 | 2.55 | 1.36 | 1.03 |
| Unigene18542_All | Cold acclimation protein COR413IM2 | 1.80 | 1.56 | 1.41 |
| CL6095.Contig8_All | Cold regulated COR18 | 2.41 | 4.13 | 2.24 |
| Unigene52767_All | Cold shock protein CS66 | 6.88 | 9.67 | 12.23 |
| CL10842.Contig2_All | Cold-inducible RNA-binding protein | 3.56 | 5.61 | 3.58 |
| CL12984.Contig6_All | Low-temperature-induced 65 kDa protein | 1.56 | 6.35 | 5.07 |
| CL10225.Contig1_All | Heat shock protein | 0.60 | 1.26 | 2.75 |
| Unigene52380_All | Superoxide dismutase | 4.03 | 3.65 | 11.15 |
| Unigene9176_All | Peroxidase 52 | 1.02 | 2.48 | 1.26 |
| Unigene701_All | Peroxidase 57 | 1.53 | 2.51 | 2.75 |
| CL12499.Contig1_All | Catalase isozyme B | 1.47 | 3.21 | 5.69 |
| CL6576.Contig2_All | Glutathione peroxidase GPX6 | 1.52 | 2.68 | 1.68 |
| CL11774.Contig1_All | Water stress-induced protein ER5 | 3.46 | 6.19 | 4.78 |
| Unigene8303_All | Bidirectional sugar transporter N3 | 7.75 | 6.29 | 9.03 |
| CL7748.Contig2_All | Bidirectional sugar transporter SWEET11 | 0.66 | 2.49 | 2.04 |
| CL1443.Contig6_All | Abscisic acid-hydroxylase | 0.80 | 3.33 | 2.93 |
| Unigene58_All | Calcium-dependent protein kinase | 0.46 | 2.05 | 1.26 |


