2.1. Sequencing and de novo Assembly
Next-generation sequencing technology made the transcriptome sequencing lower cost and higher throughput than traditional Sanger sequencing. As one representative of NGS, the Illumina HiSeq™ 2000 sequencing platform has been widely used for transcriptome sequencing in many non-model organisms, including
Liriodendron chinense,
Cucurbita moschata and
Houttuynia cordata [
16,
17,
18].
In this project, we obtained 97,431,176 clean reads, with a mean length of 100 base pairs (bp). The percentage of Q20, N, and GC was 98.31%, 0.00%, and 45.59%, respectively. The clean reads were
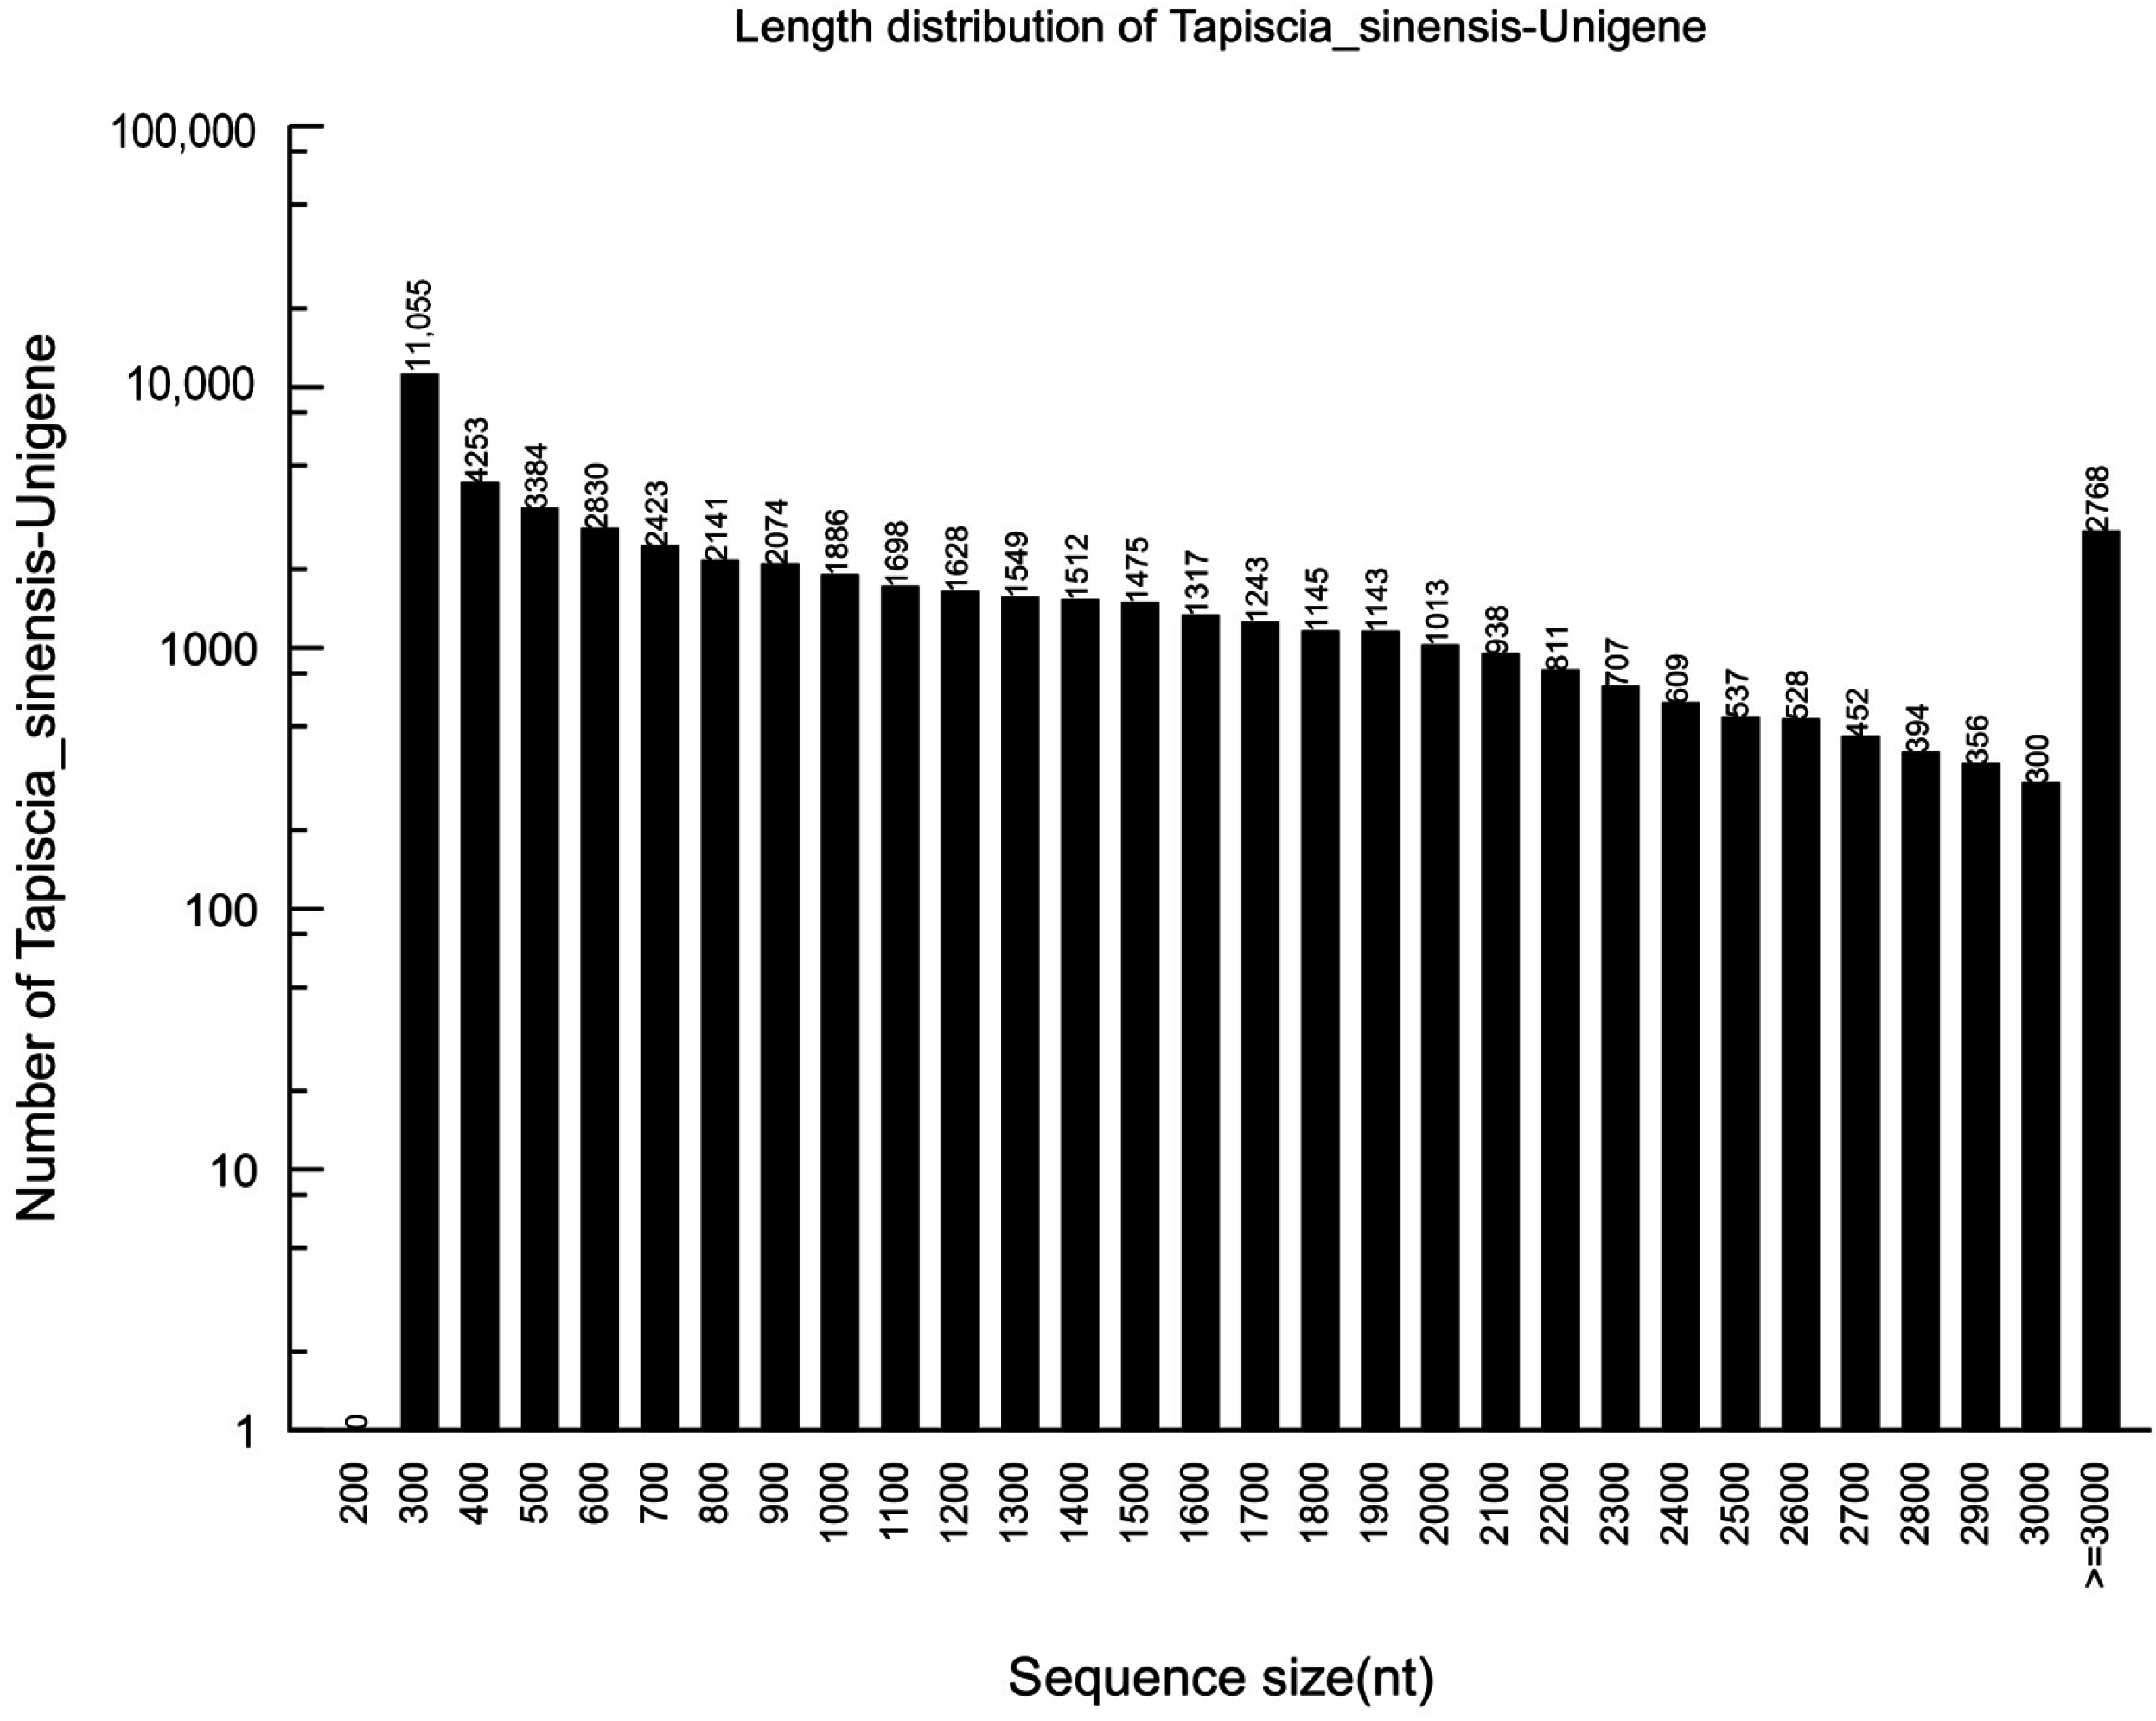
de novo assembled using Trinity into 55,711 contigs, with a mean length of 1133 bp and an N50 of 1768 bp. The total number of unigenes was 52,169, with a mean length of 1116 bp and an N50 of 1768 bp. Of all of the unigenes, the majority (30,046 unigenes) were in the range of 201 to 1000 bp, which accounted for 57.59%. 13,723 of the unigenes (26.3%) ranged from 1001 to 2000 bp in length, while 8400 of the unigenes (16.1%) had lengths of more than 2000 bp (
Figure 1).
The average 1116 bp length of the unigenes was longer than that reported for pumpkin transcriptomes (765 bp) using the Illumina HiSeq™ 2000 sequencing platform [
17]. It was also greater than that of the Chinese jujube (473.4 bp) and Siberian apricot (651.6 bp) transcriptomes, using the 454 GS FLX Titanium genomic sequencer platform [
19,
20].
Figure 1.
Length distributions of the unigenes in the assembled transcriptome.
Figure 1.
Length distributions of the unigenes in the assembled transcriptome.
2.2. Sequence Annotation and Classification
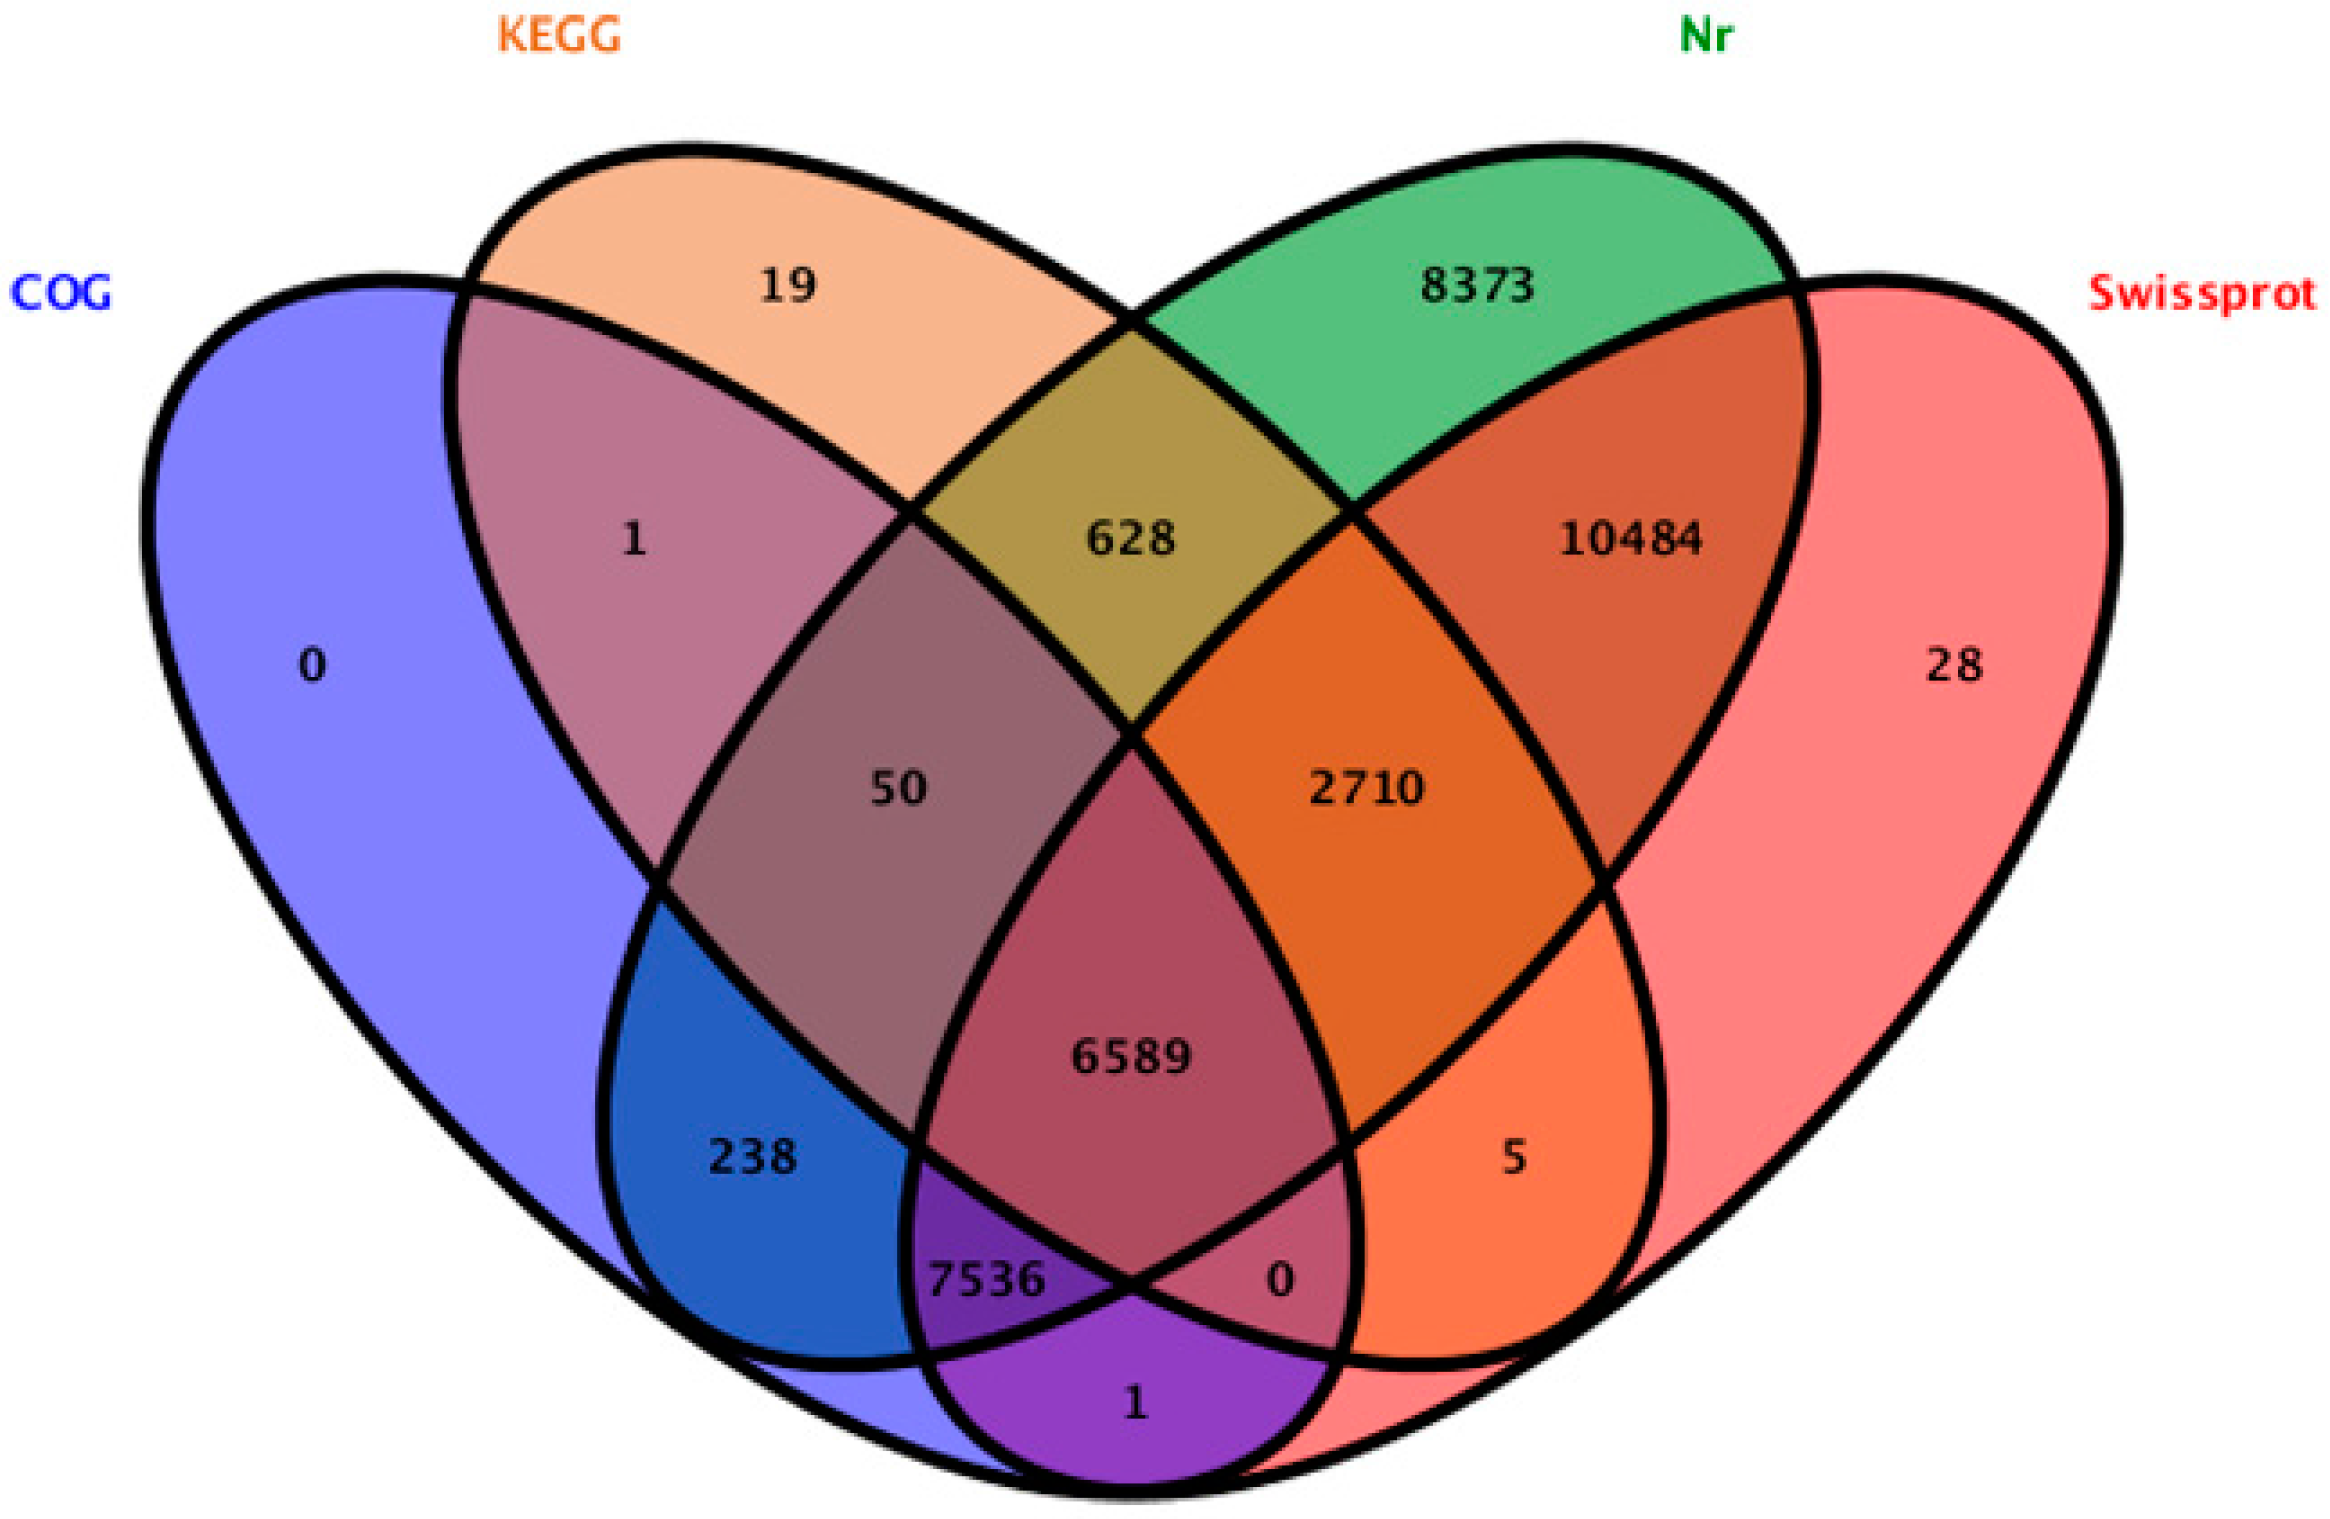
We searched the 52,169 unigenes against the protein databases. 36,662 unigenes (70.27%) were annotated, 15,507 unigenes cannot be aligned to any database remained without annotation. In the annotated unigenes, 36,608 (70.17%), 27,353 (52.43%), 14,415 (27.63%) and 10,002 (19.17%) unigenes showed homology with sequences in the Nr (Non redundant), Swiss-Prot, COG (Clusters of Orthologous Groups of proteins), and KEGG databases, respectively (
Figure 2). In the annotated unigenes in the Nr database, most samples (13,776 unigenes) matched the “theobroma cacao” proteins, followed by “vitis vinifera” (8474 unigenes), “fragaria vesca subsp. Vesca” (2058 unigenes), “cucumis sativus” (1887 unigenes) and “oryza sativa Japonica Group” (1317 unigenes). In the 15,507 un-annotated unigenes, 835 unigenes were established nucleotide sequence direction (5′-3′) and amino sequence of the predicted coding region by using ESTScan [
21].
Figure 2.
The unigenes showed homology with sequences in the Nr, Swiss-Prot, COG (Clusters of Orthologous Groups of proteins) and KEGG (Kyoto Encyclopedia of Genes and Genomes) databases.
Figure 2.
The unigenes showed homology with sequences in the Nr, Swiss-Prot, COG (Clusters of Orthologous Groups of proteins) and KEGG (Kyoto Encyclopedia of Genes and Genomes) databases.
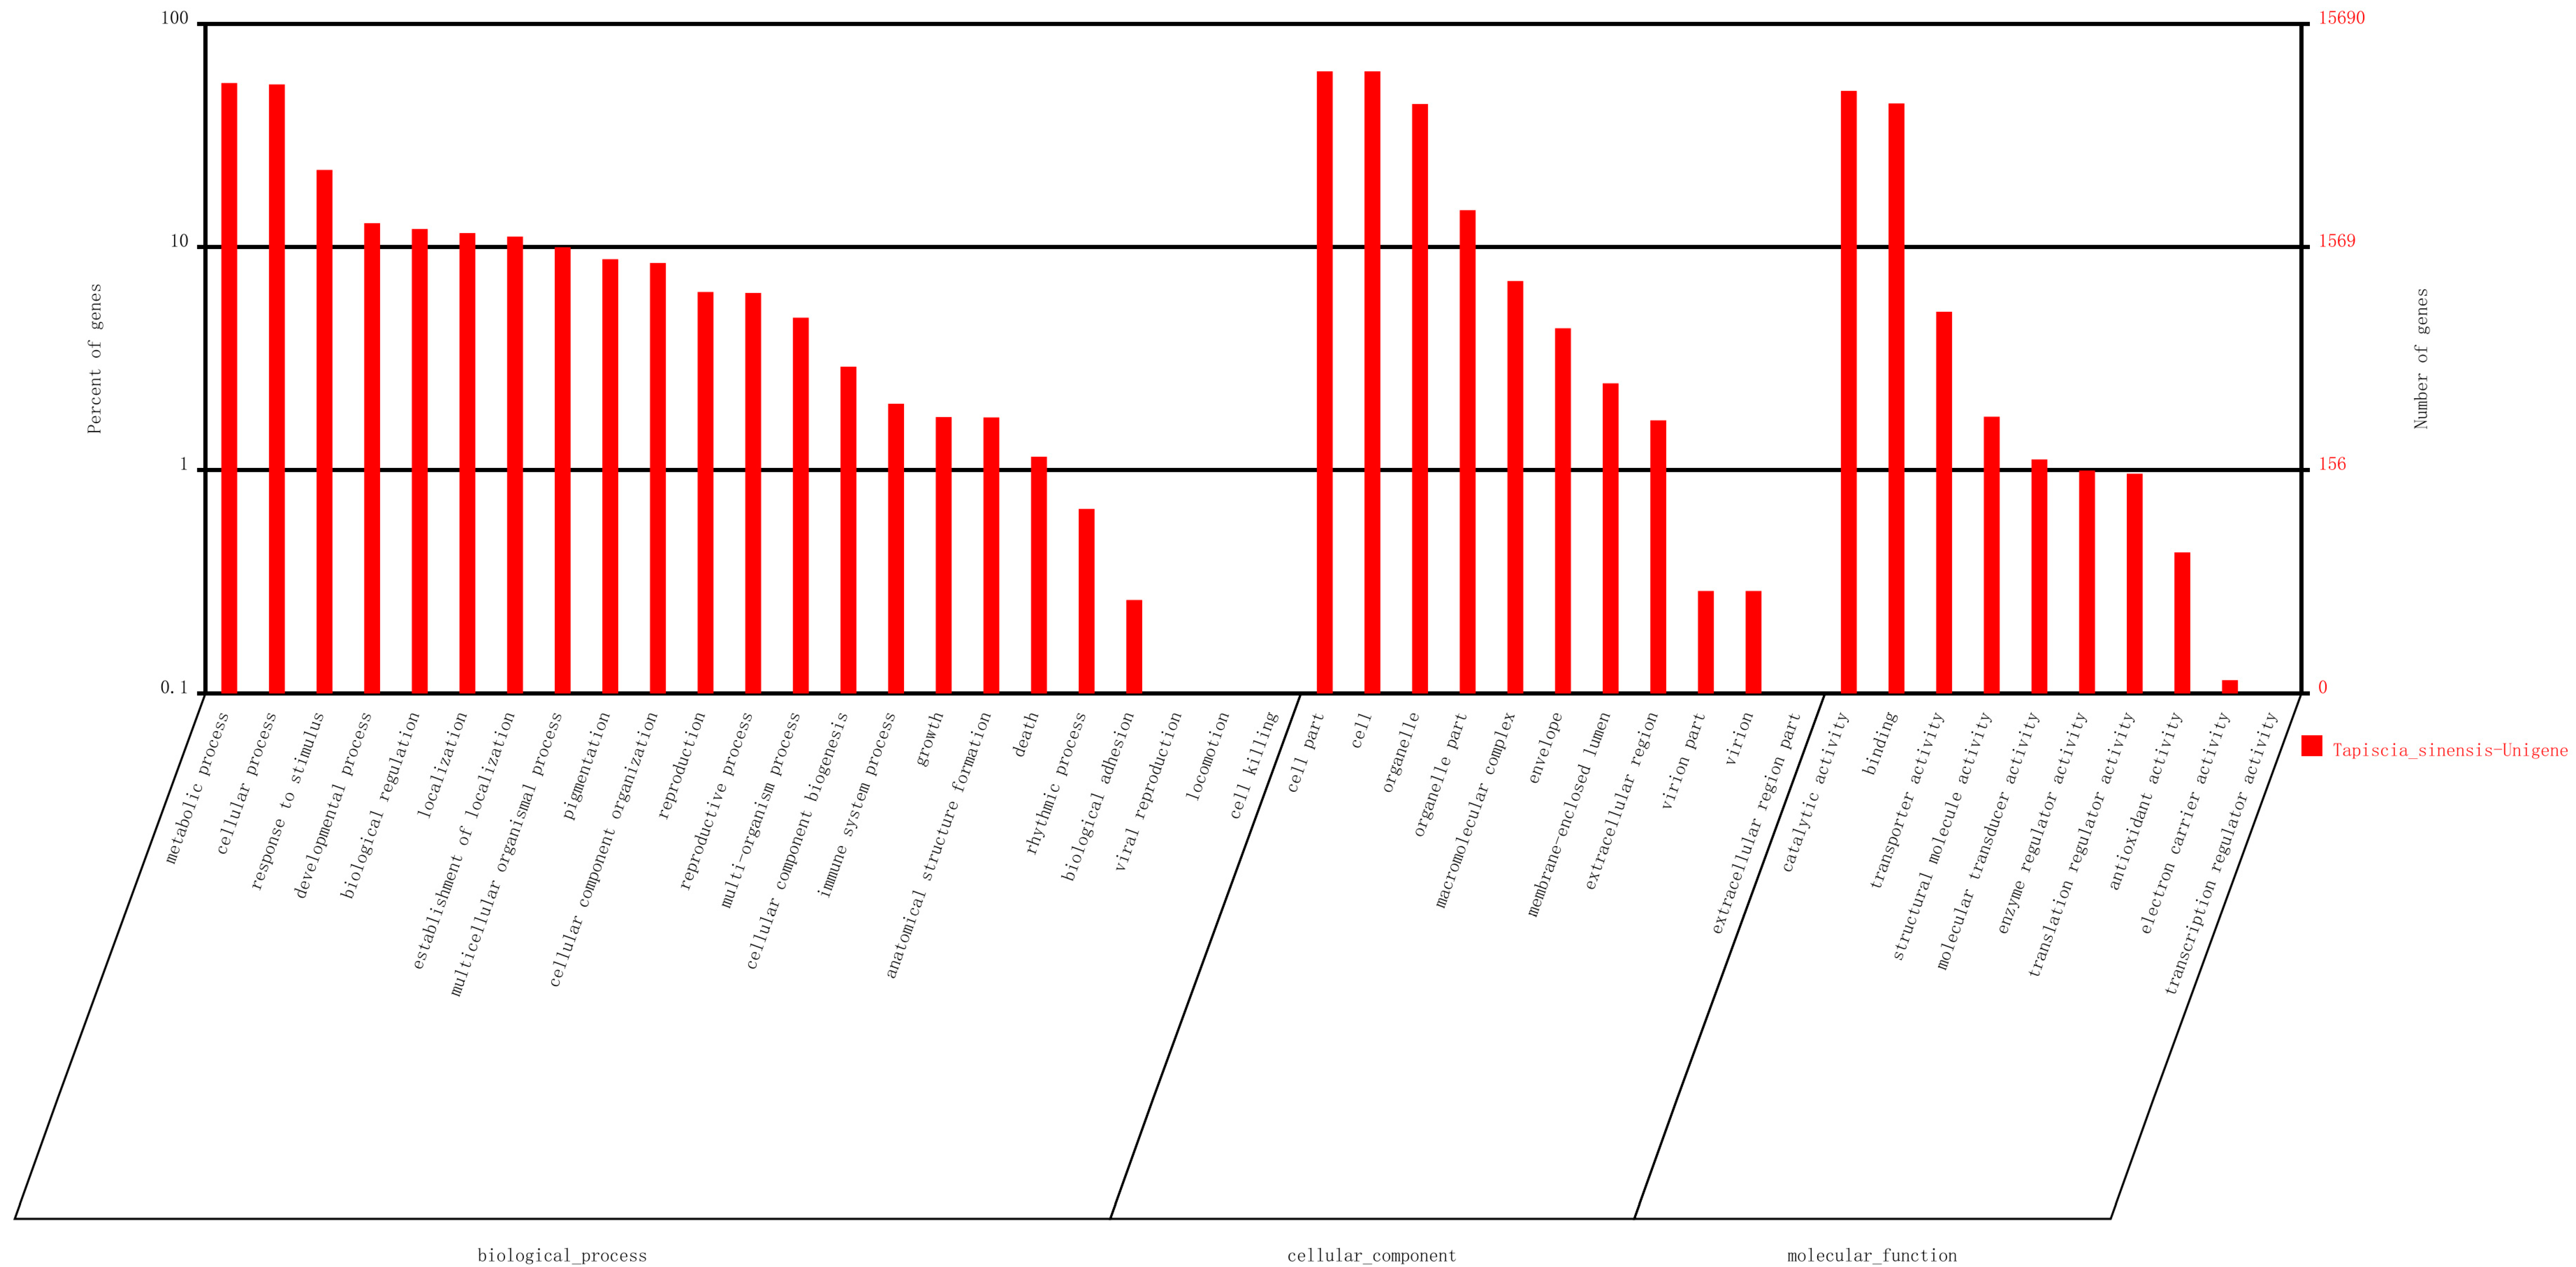
Based on Nr annotation, 15,690 unigenes were assigned gene ontology (GO) with 83,842 functional terms. In total, 36,497 terms were assigned to the biological processes group, 30,925 terms were assigned to the cellular components group and 16,420 terms were assigned to the molecular functions group (
Figure 3). Of the biological process category, metabolic process (8526, 23.36%) and cellular process (8406, 23.03%) were the most frequent terms used. Genes related to response to stimulus (3476 unigenes), anatomical structure formation (270 unigenes), and rhythmic process (105 unigenes) were also identified in this group. In the class of “response to stimulus”, unigene0008775, unigene0005239, and unigene0049385, that were respectively annotated as “Pedicel, carpel, stamen, petal differentiation and expansion stage, group 2-like protein”, “Phytochrome and flowering time regulatory protein isoform 2”, and “Protein early flowering 3”, which putatively related to response to environmental stimulus were discovered. In the class of “rhythmic process”, unigene0044321 and unigene0017817, which were respectively annotated as “circadian clock-associated FKF1” and “Protein EARLY FLOWERING 4 OS”, were found. In the class of “anatomical structure formation”, unigene0011847 was annotated as “Sex determination protein tasselseed-2-like” was found. These unigenes may involve in flower development, differentiation and flowering time determination in
T. sinensis. Regarding the cellular components category, the cell and cell parts were the most prominent terms. In the molecular functions category, catalytic activity (7861 unigenes) and binding (6905 unigenes) were the most highly represented terms.
Figure 3.
Unigenes were assigned to Gene Ontology.
Figure 3.
Unigenes were assigned to Gene Ontology.
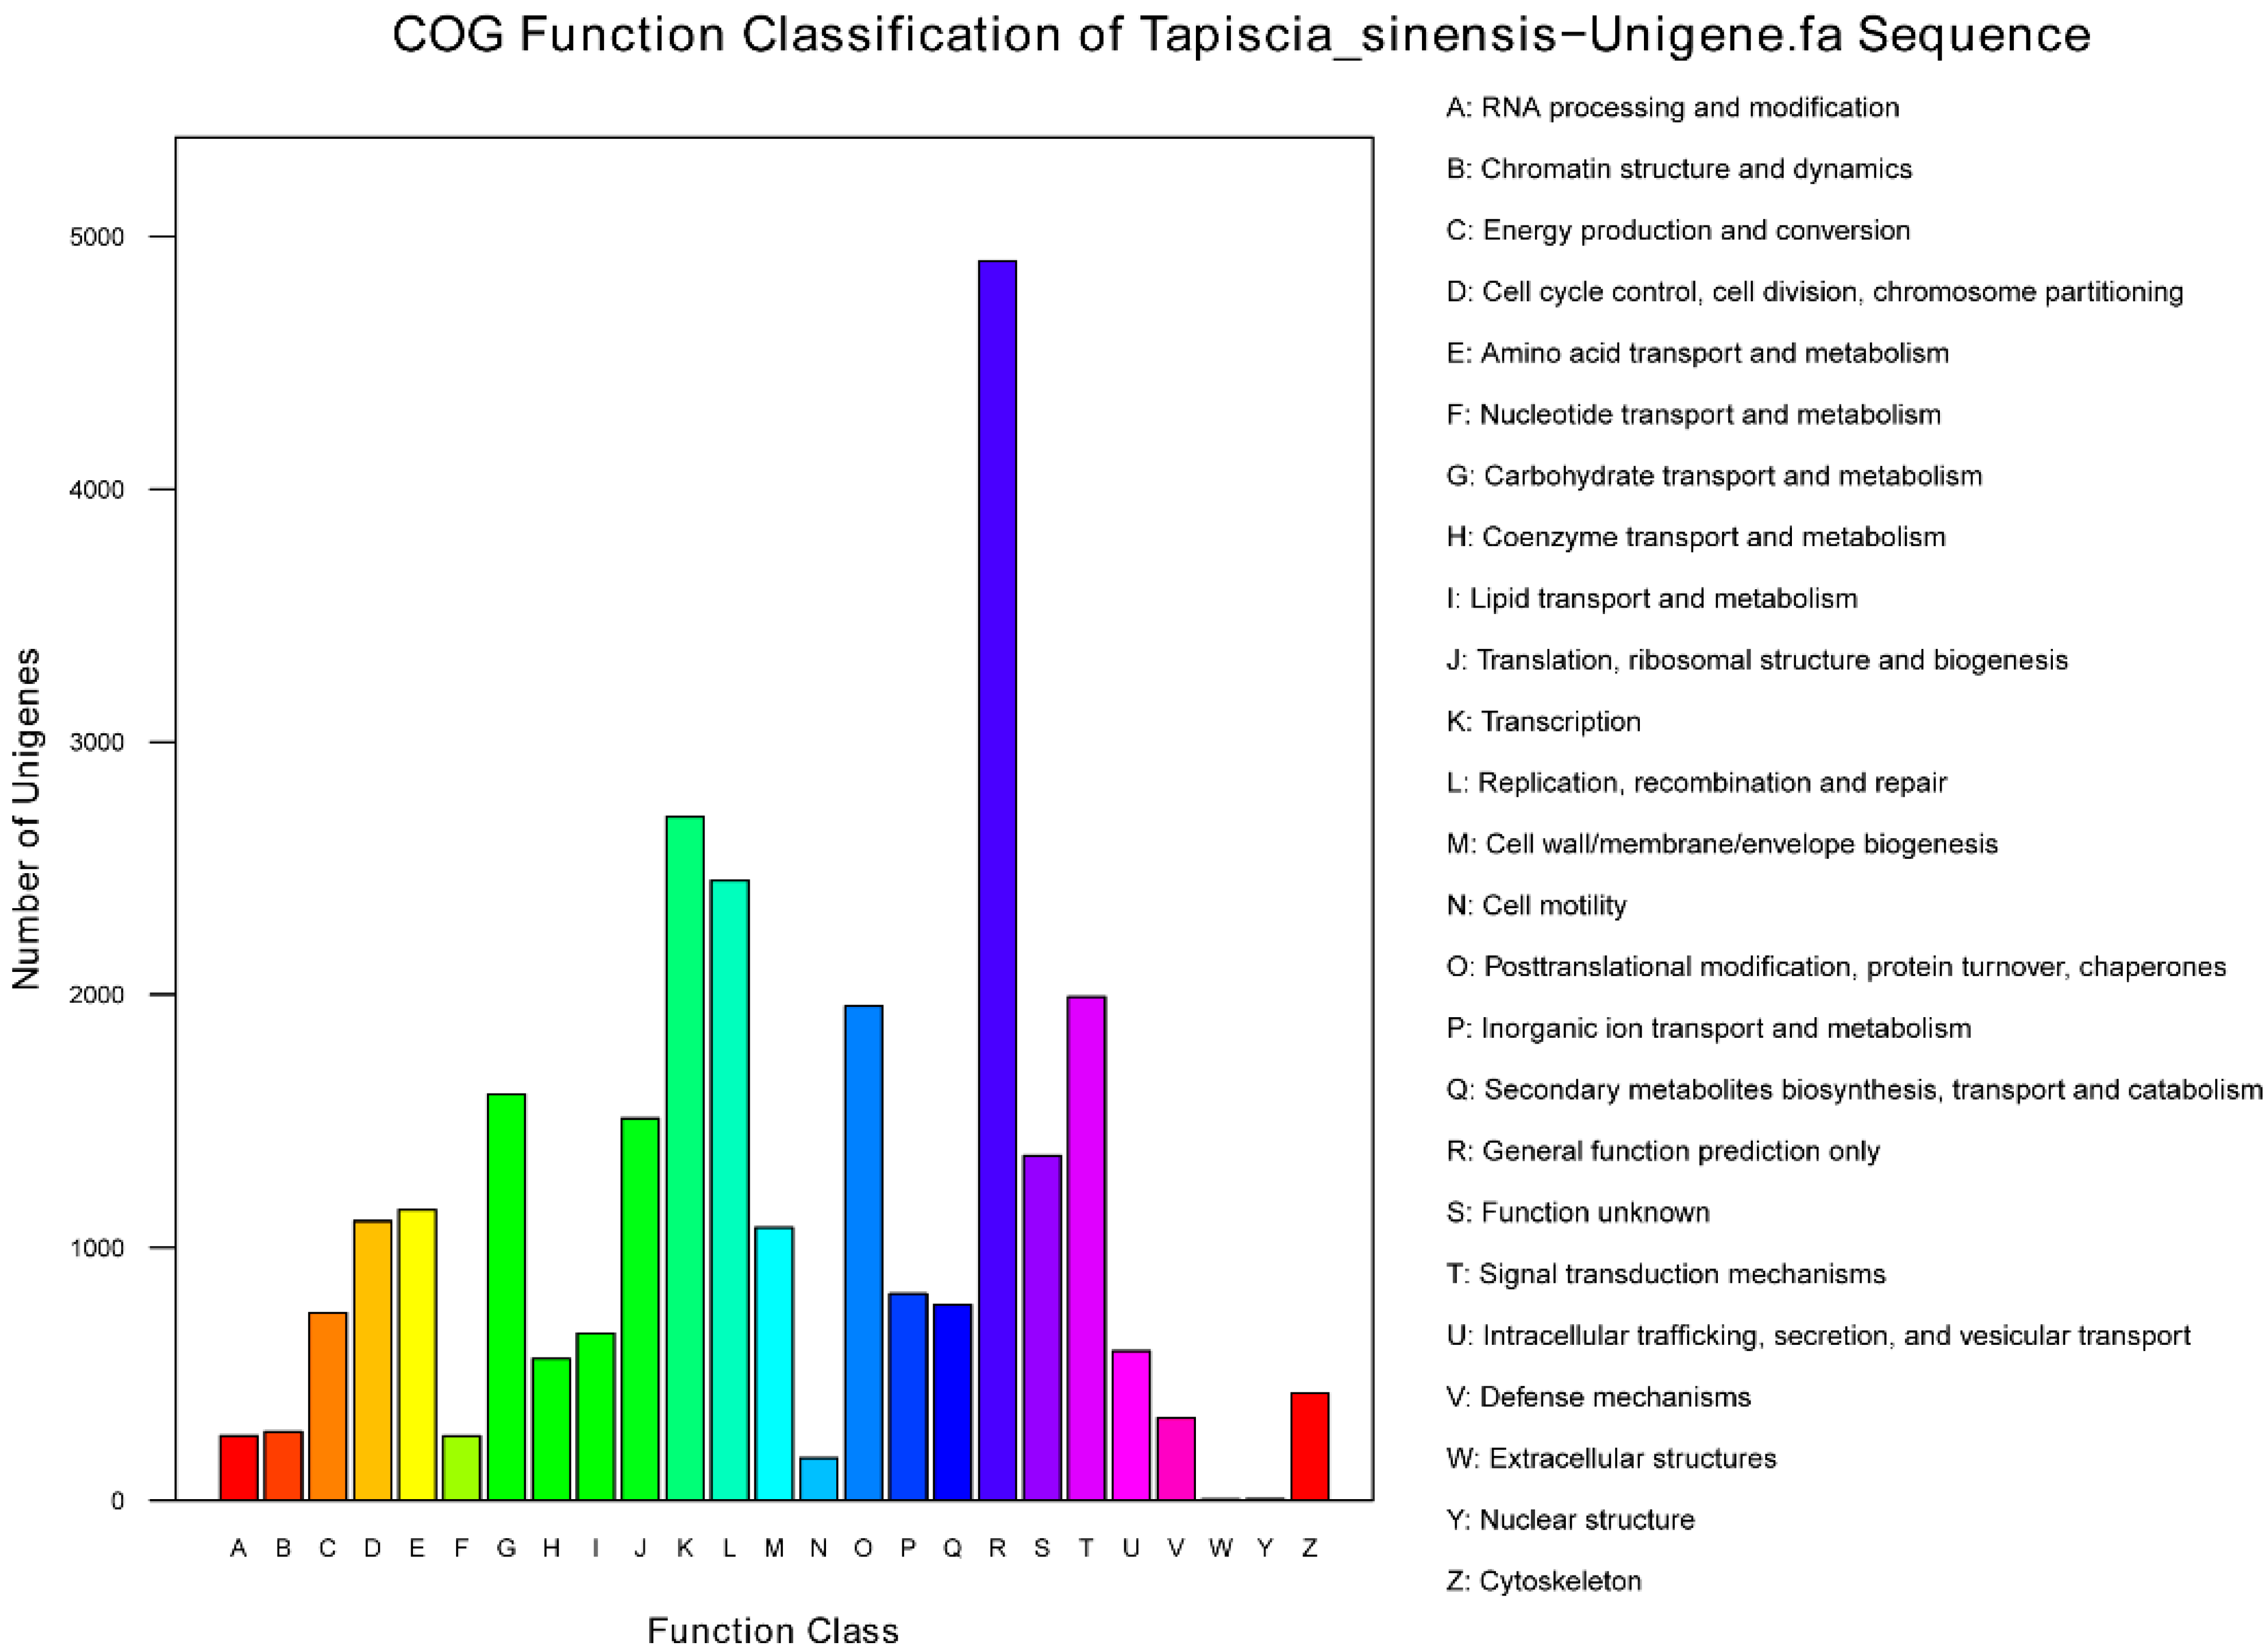
Furthermore, all unigenes were subjected to a search against the Clusters of Orthologous Groups of proteins (COG) database for functional prediction and classification, and 27,672 sequences were assigned to COG classifications (
Figure 4). Of the 25 COG categories, the cluster for “general function prediction only” (4902, 17.71%) was the largest group, followed by “transcription” (2704, 9.77%), “replication, recombination and repair” (2451, 8.86%), “signal transduction mechanisms” (1991, 7.19%) and “posttranslational modification, protein turnover, chaperones” (1955, 7.06%). Additionally, 1605 unigenes were assigned to “carbohydrate transport and metabolism” group, which include unigene0027247 that was annotated as “Glycogen synthase”, unigene0027034 annotated as “6-phosphofructokinase”, and unigene0026072 annotated as “Glyceraldehyde-3-phosphate dehydrogenase/erythrose-4-phosphate dehydrogenase”; 743 unigenes were assigned to “energy production and conversion”, which include unigene0032350 annotated as “Fumarase”, unigene0032531 annotated as “Glycerol-3-phosphate dehydrogenase”, unigene0038751 annotated as “Nicotinamide-adenine dinucleotid dehydrogenase, Flavin adenine dinucleotide containing subunit”, and unigene0039174 annotated as “Phosphoenolpyruvate carboxykinase (ATP)”. These key genes laid the foundation for the study of
T. sinensis.
Figure 4.
Unigenes were assigned to COG classifications.
Figure 4.
Unigenes were assigned to COG classifications.
To identify the biological pathways in
T. sinensis, the annotated unigenes were mapped to the reference of typical pathways in the KEGG database. In this study, 10,002 (19.17%) unigenes were assigned to 124 pathways, which include pathways about “Starch and sucrose metabolism” (224 unigenes), “Terpenoid backbone biosynthesis” (72 unigenes), and “Carbon fixation in photosynthetic organisms” (136 unigenes). The top five pathways in KEGG analysis consist of “Metabolic pathways” (ko01100), “Biosynthesis of secondary metabolites” (ko01110), “Ribosomes” (ko03010), “Spliceosome” (ko03040), and “RNA transport” (ko03013) (
Table S1). It is worth noting that 260 (2.6%) unigenes in the ‘‘Plant hormone signal transduction’’ pathway were found in the pathways of auxin, cytokinine, gibberellins, abscisic acid, ethylene, brassinosteroid, jasmonic acid and salicylic acid, they may be involved in the regulation of “Cell enlargement”, “Plant growth”, “Shoot initiation”, and “Senescence” in
T. sinensis flowers (
Figure S1).
2.4. SSR Mining from the T. sinensis Transcriptome
SSRs are useful as molecular markers for genetics and biology researches. All 52,169 unigenes generated from the transcriptome were used to develop potential SSR loci using MISA (MIcroSAtellite identification) software. A total of 10,371 SSRs were identified in 8608 unigenes, with 5439 sequences suit to designed primers, and 16,317 pairs of primers designed for application. Of all of the SSR containing sequences, 1436 sequences contained more than one SSR, and 733 SSRs were present in compound forms (
Table 1).
Table 1.
Summary of the EST-SSRs identified in the transcriptome sequences.
Table 1.
Summary of the EST-SSRs identified in the transcriptome sequences.
| Item | Number |
|---|
| Total number of sequences examined | 52,169 |
| Total size of examined sequences (bp) | 58,253,075 |
| Total number of identified SSRs | 10,371 |
| Number of SSR containing sequences | 8608 |
| Number of sequences containing more than 1 SSR | 1436 |
| Number of SSRs present in compound formation | 733 |
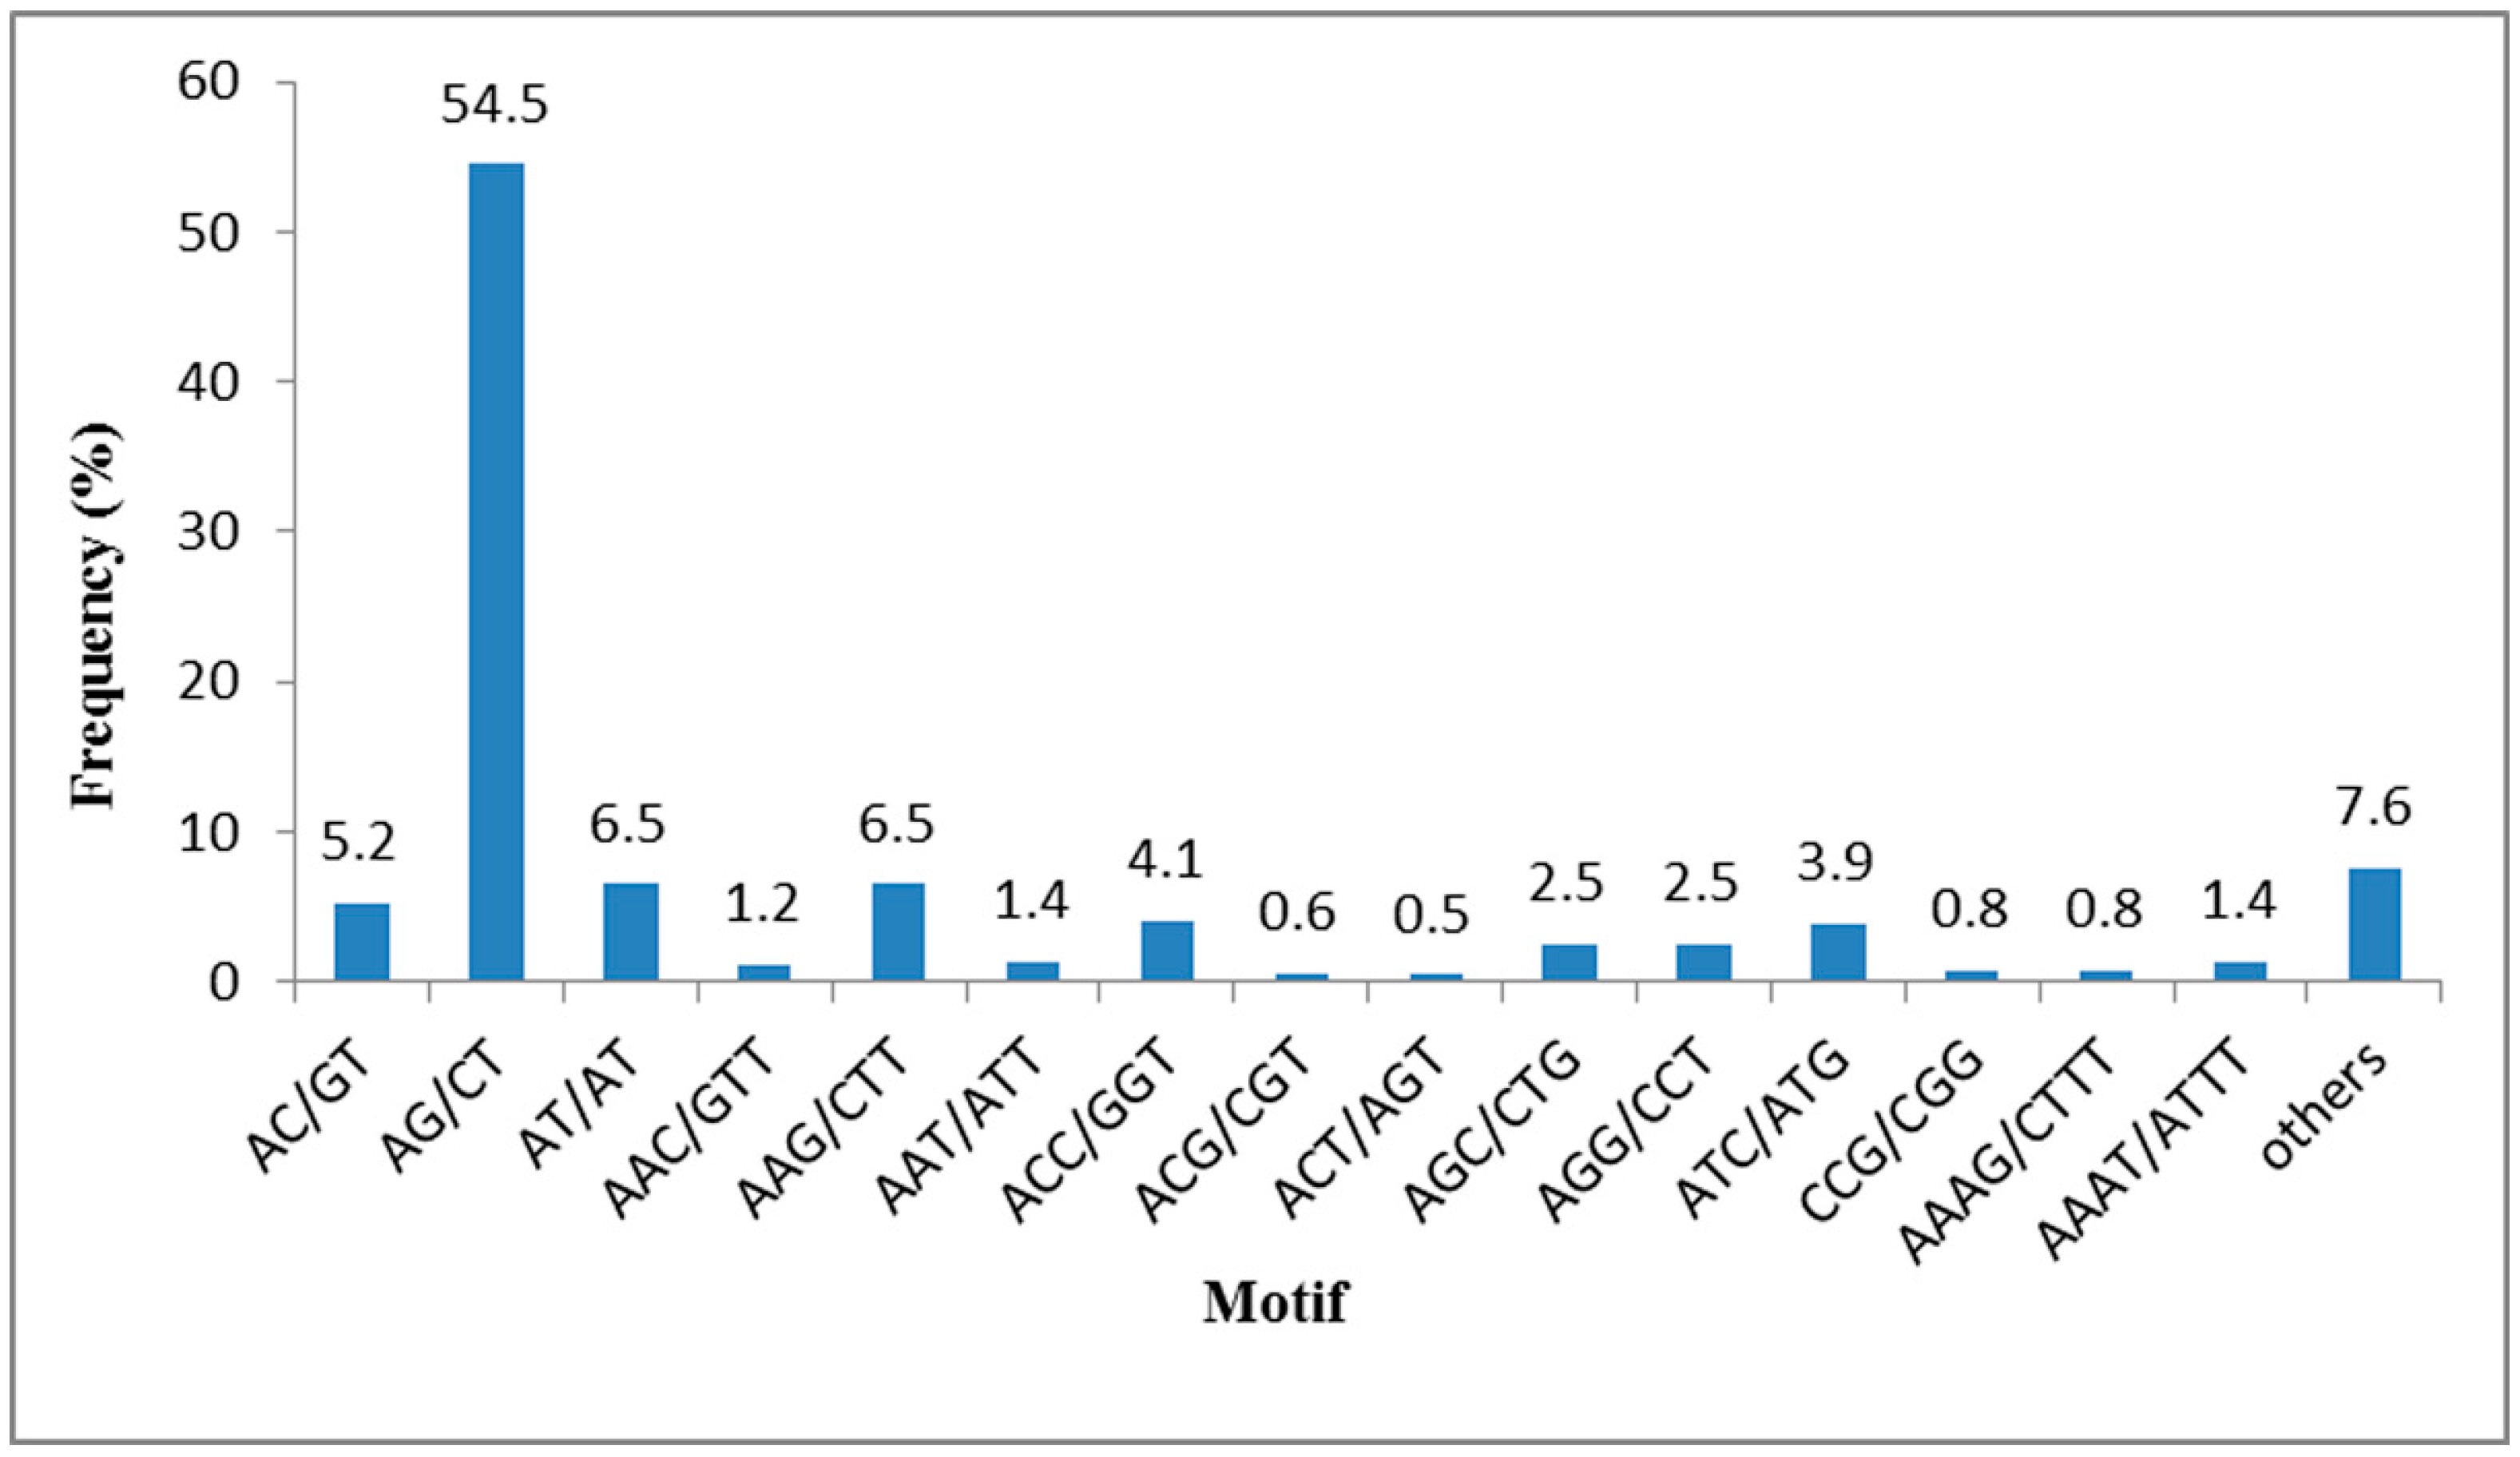
Of the 10,371 identified SSRs, the most abundant repeat motif types were di-nucleotide repeat motifs (6888, 66.42%), followed by tri-nucleotide (2486, 23.97%), tetra-nucleotide (522, 5.03%), hexa-nucleotide (296, 2.85%) and penta-nucleotide (179, 1.73%) repeat motifs. The frequencies of the SSRs with different numbers of tandem repeats are summarized in
Table 2. SSRs with six tandem repeats were the most common (2797, 26.97%), followed by seven tandem repeats (1831, 17.66%), five tandem repeats (1447, 13.95%), and nine tandem repeats (1256, 12.11%). The most common type of SSR motif was AG/CT which accounted for 54.5%, followed by AT/AT and AAG/CTT (6.5%), AC/GT (5.2%), ACC/GGT (4.1%) (
Figure 6). This result is consistent with previous research showing di-nucleotide repeats to be the most abundant type, followed by were tri-nucleotide repeats [
17,
28,
29]. The most abundant di-nucleotide motifs AG/CT and tri-nucleotide motifs AAG/CTT were also coincident with earlier research [
17].
In the 8608 SSR-containing ESTs, the most of them are functional. These ESTs are useful for the SSR identification of related to flower types and some other important phenotypes, such as stress resistance. The detail and functional description of 8608 SSR-containing EST accessions were shown in
Tables S3 and S4.
Figure 6.
Frequency distribution of SSRs based on the motif types.
Figure 6.
Frequency distribution of SSRs based on the motif types.
Table 2.
The distribution of the identified EST-SSRs in sequences using the MISA (MIcroSAtellite identification) software.
Table 2.
The distribution of the identified EST-SSRs in sequences using the MISA (MIcroSAtellite identification) software.
| Repeat Numbers | Motif | Total | Repeat Number (%) |
|---|
| Di- | Tri- | Tetra- | Penta- | Hexa |
|---|
| 4 | 0 | 0 | 368 | 158 | 266 | 792 | 7.64 |
| 5 | 0 | 1319 | 101 | 15 | 12 | 1447 | 13.95 |
| 6 | 2026 | 703 | 52 | 5 | 11 | 2797 | 26.97 |
| 7 | 1416 | 411 | 0 | 0 | 4 | 1831 | 17.66 |
| 8 | 1164 | 49 | 1 | 1 | 2 | 1217 | 11.73 |
| 9 | 1256 | 0 | 0 | 0 | 0 | 1256 | 12.11 |
| 10 | 823 | 1 | 0 | 0 | 0 | 824 | 7.95 |
| 11 | 195 | 1 | 0 | 0 | 0 | 196 | 1.89 |
| ˃11 | 8 | 2 | 0 | 0 | 1 | 11 | 0.11 |
| Total | 6888 | 2486 | 522 | 179 | 296 | 10,371 | 100 |
| Motif (%) | 66.42 | 23.97 | 5.03 | 1.73 | 2.85 | |
2.5. SSR Marker Assessment and Application
A suit of 150 pairs of primers was synthetized and assessed in the 24
T. sinensis individuals. The result shows that, 117 pairs (78%) successfully amplified target fragments for SSR-PCR (Simple Sequence Repeat Polymerase Chain Reaction), including 68 pairs that were able to produce clear polymorphic bands (45.5%) and 49 pairs of primers that were able to produce single bands without polymorphism. The results of the SSR-PCR amplification are shown as examples in
Figure 7. Of 68 polymorphic SSR markers (
N = 24), the detected number of alleles per locus ranged from 2 to 6 with an average of 3.24 alleles per locus, and the observed and expected heterozygosity varied from 0.000 to 1.000 and from 0.042 to 0.782, respectively. Polymorphic information content varied 0.040 to 0.729. Details of the 68 polymorphic SSR markers from
T. sinensis are shown in
Table S5. In addition, the Bayesian clustering analysis of the 51 individuals was constructed based on six polymorphic SSR markers, with the characteristics shown in
Table 3. The analysis indicated that we developed SSR markers can differentiate population genetic differences of different geographic locations, dividing the 51 individuals into two main groups of 29 (fromWuling Mountains) and 22 (from Qinling Mountains) (
Figure S2).
In recent years, EST-SSR has been widely used in the studies of plant at the DNA level. In 2014, Guo
et al. used forty effective EST-SSR to test the genetic diversity of 15 hexaploid oat germplasm resources, and clustering them into three groups according to species. The forty primers showed higher availability on the study of 31 chromosome ploidy unknown oat germplasm resources, and some diploids and tetraploids of oat germplasm resources were found in them [
30]. Wang
et al. used 28 EST-SSR derived from alfalfa and soybean to study the genetic relationship of 26 accessions representing four species of
Crotalaria, and re determined the phylogenetic classification of the 26 accessions [
31]. Recently, nineteen EST-SSR analyses provide insights about genetic relatedness, population structure and gene flow in grass pea of 176 accessions [
32]. In this study, we developed EST-SSR could be used for genetic diversity analysis, identification of Germplasm Resources and the molecular phylogeny and evolution in Tapisciaceae.
Figure 7.
The results of the SSR-PCR that produced clear bands. M refers to DNA markers pBR322 DNA/MspI. Numbers 1 to 24 represent twenty-four individuals of T. sinensis. The products of primer TS061 are single bands without polymorphism, while those of TS062 are clear polymorphic bands.
Figure 7.
The results of the SSR-PCR that produced clear bands. M refers to DNA markers pBR322 DNA/MspI. Numbers 1 to 24 represent twenty-four individuals of T. sinensis. The products of primer TS061 are single bands without polymorphism, while those of TS062 are clear polymorphic bands.
Table 3.
Characteristics of the six primer pairs used for the phylogenetic analysis of the 51 individuals.
Table 3.
Characteristics of the six primer pairs used for the phylogenetic analysis of the 51 individuals.
| Primer | Motif | K | HO | HE | PIC | HW |
|---|
| TS053 | (TCA)6 | 9 | 0.706 | 0.835 | 0.804 | ND |
| TS126 | (TAC)7 | 6 | 0.706 | 0.768 | 0.723 | NS |
| TS103 | (AAGA)5 | 5 | 0.549 | 0.631 | 0.573 | NS |
| TS149 | (TTG)11 | 6 | 0.608 | 0.769 | 0.725 | NS |
| TS060 | (TGT)6 | 6 | 0.529 | 0.501 | 0.464 | NS |
| TS013 | (AGA)8 | 5 | 0.51 | 0.653 | 0.592 | NS |
For comparison with existing databases, functional annotation and SSR identification using PCR amplification, the results indicated that the quality of the T. sinensis transcriptome sequencing and assembly was very high. To date, this is the first research on T. sinensis transcriptome sequencing and analysis. These data will lay the foundations for the future research on functional gene identification, molecular genetics, physiology and biochemistry of T. sinensis.


