2.1. Kinetic Metabolic Pattern of a Develo** Cucumber Fruit
The parthenocarpic cucumber, cultivar **chun 1 (2
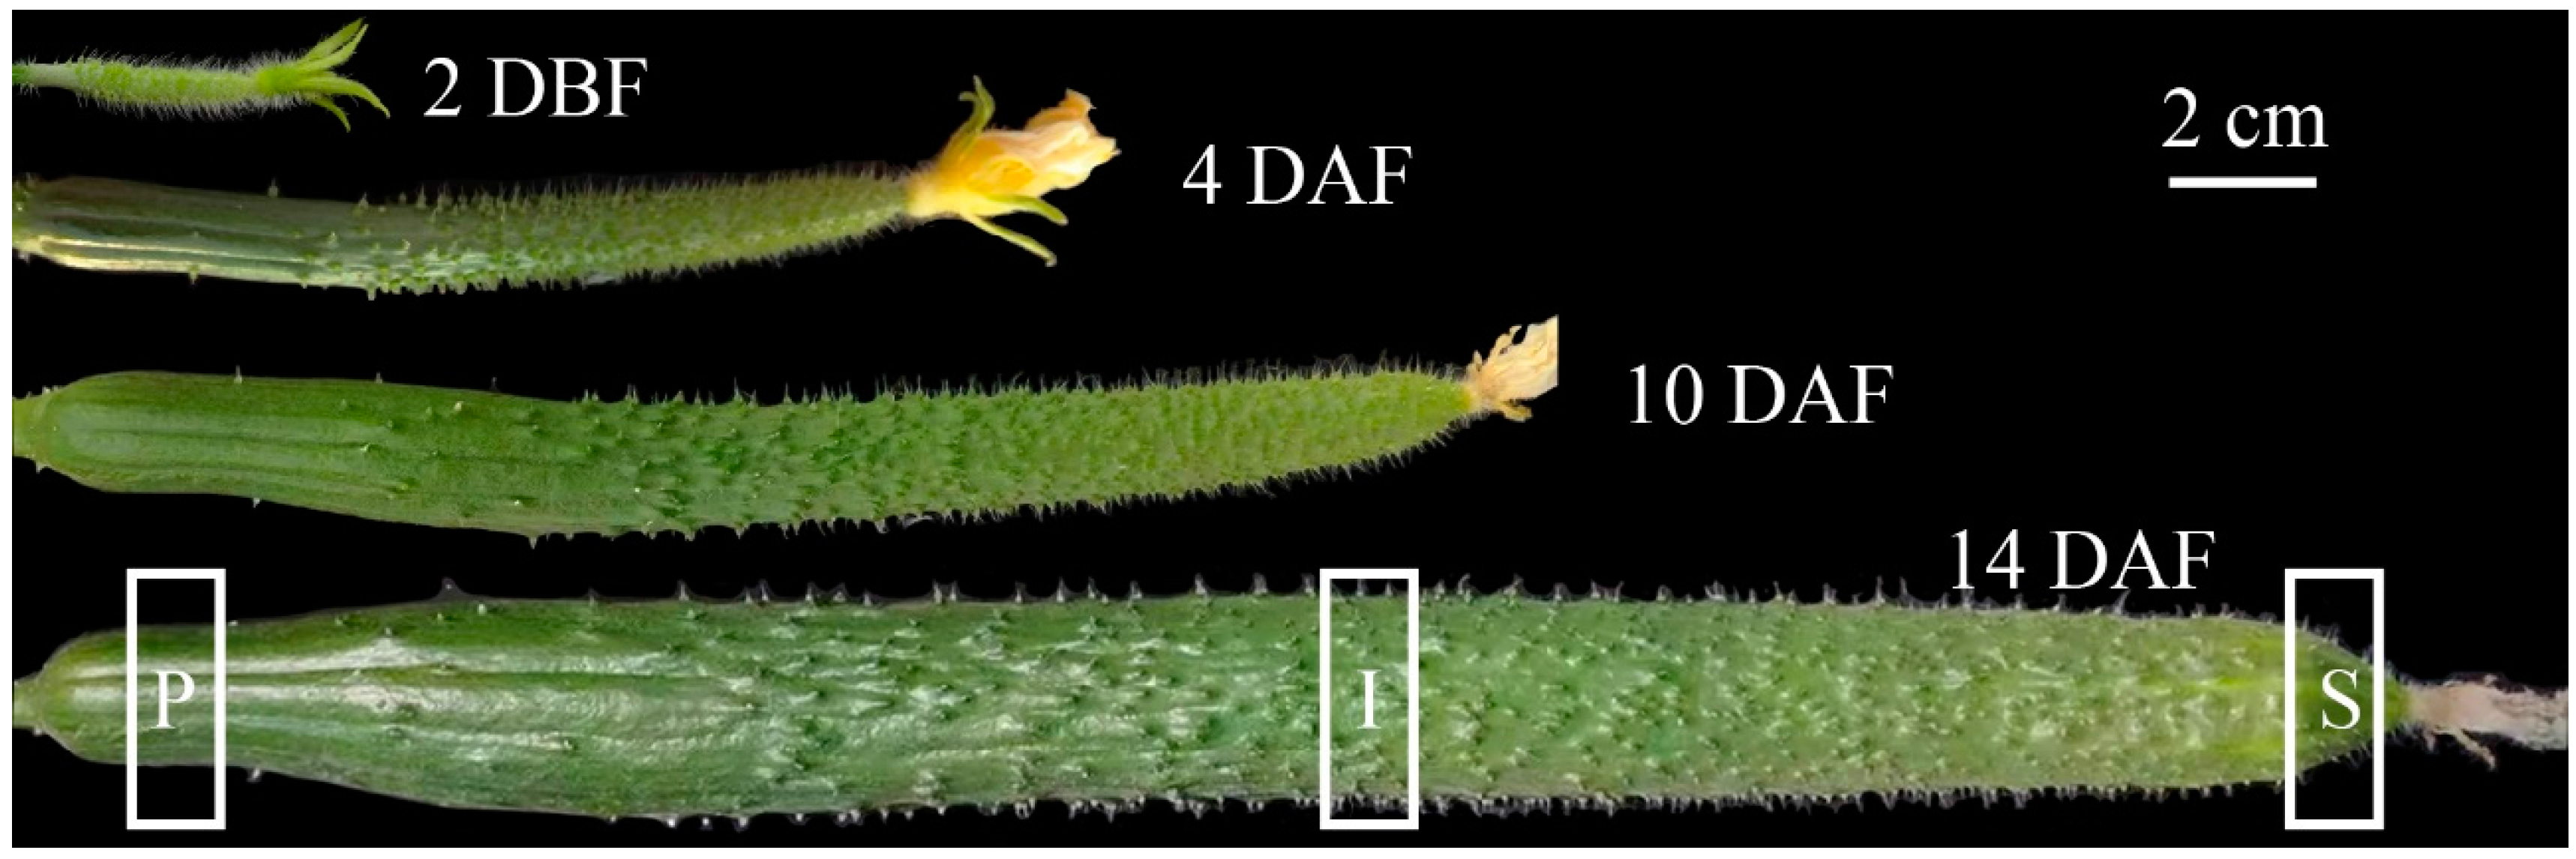
n = 14), was planted in a greenhouse in Hangzhou. Only one cucumber fruit was kept on each plant and the others were removed to avoid their competition for the nutrition. Four biological replications of the stylar ends, the intermediate segments and the peduncular ends of cucumber fruits at 2 days before flowering (2 DBF) and 4, 10, 14 days after flowering (DAF) were collected (
Figure 1). Samples from two cucumber fruits were pooled as one biological replicate. The fine powder of whole fruit was extracted with 80% of methanol solution, which can get a good metabolome coverage [
34]. The whole fruit extract was then subjected to a metabolic profiling analysis based on ultra-high-performance liquid chromatography-quadrupole time of flight mass spectrometry (UHPLC-Q-TOF-MS). A total of 238 metabolites with known structures were identified, including 46 amino acids, 33 carbohydrates, 8 cofactors, 19 nucleotides, 47 lipids, 13 benzene derivatives, 66 secondary metabolites (including 43 flavonoids, 21 hydroxycinnamate derivatives, two monoterpenol glycoconjugates) and six other compounds (
Table S1).
A principle component analysis (PCA) on the 238 metabolites was subsequently performed to obtain a global view of the kinetic metabolic patterns of develo** cucumber fruits. The first principal component (PC 1), accounting for 39.4% of the total variance, reflected time dependent cucumber development and samples from different segments at the same time point grouped together (
Figure 2). This result indicated that developmental time affected cucumber fruit metabolome more than tissue type. Samples of the peduncular ends were separated from the stylar end and the intermediate segments at the same time points in PCA plots (
Figure S1), indicating that the metabolomes of the peduncular ends of cucumber fruit were different from those of the other two tissue types at all developmental times.
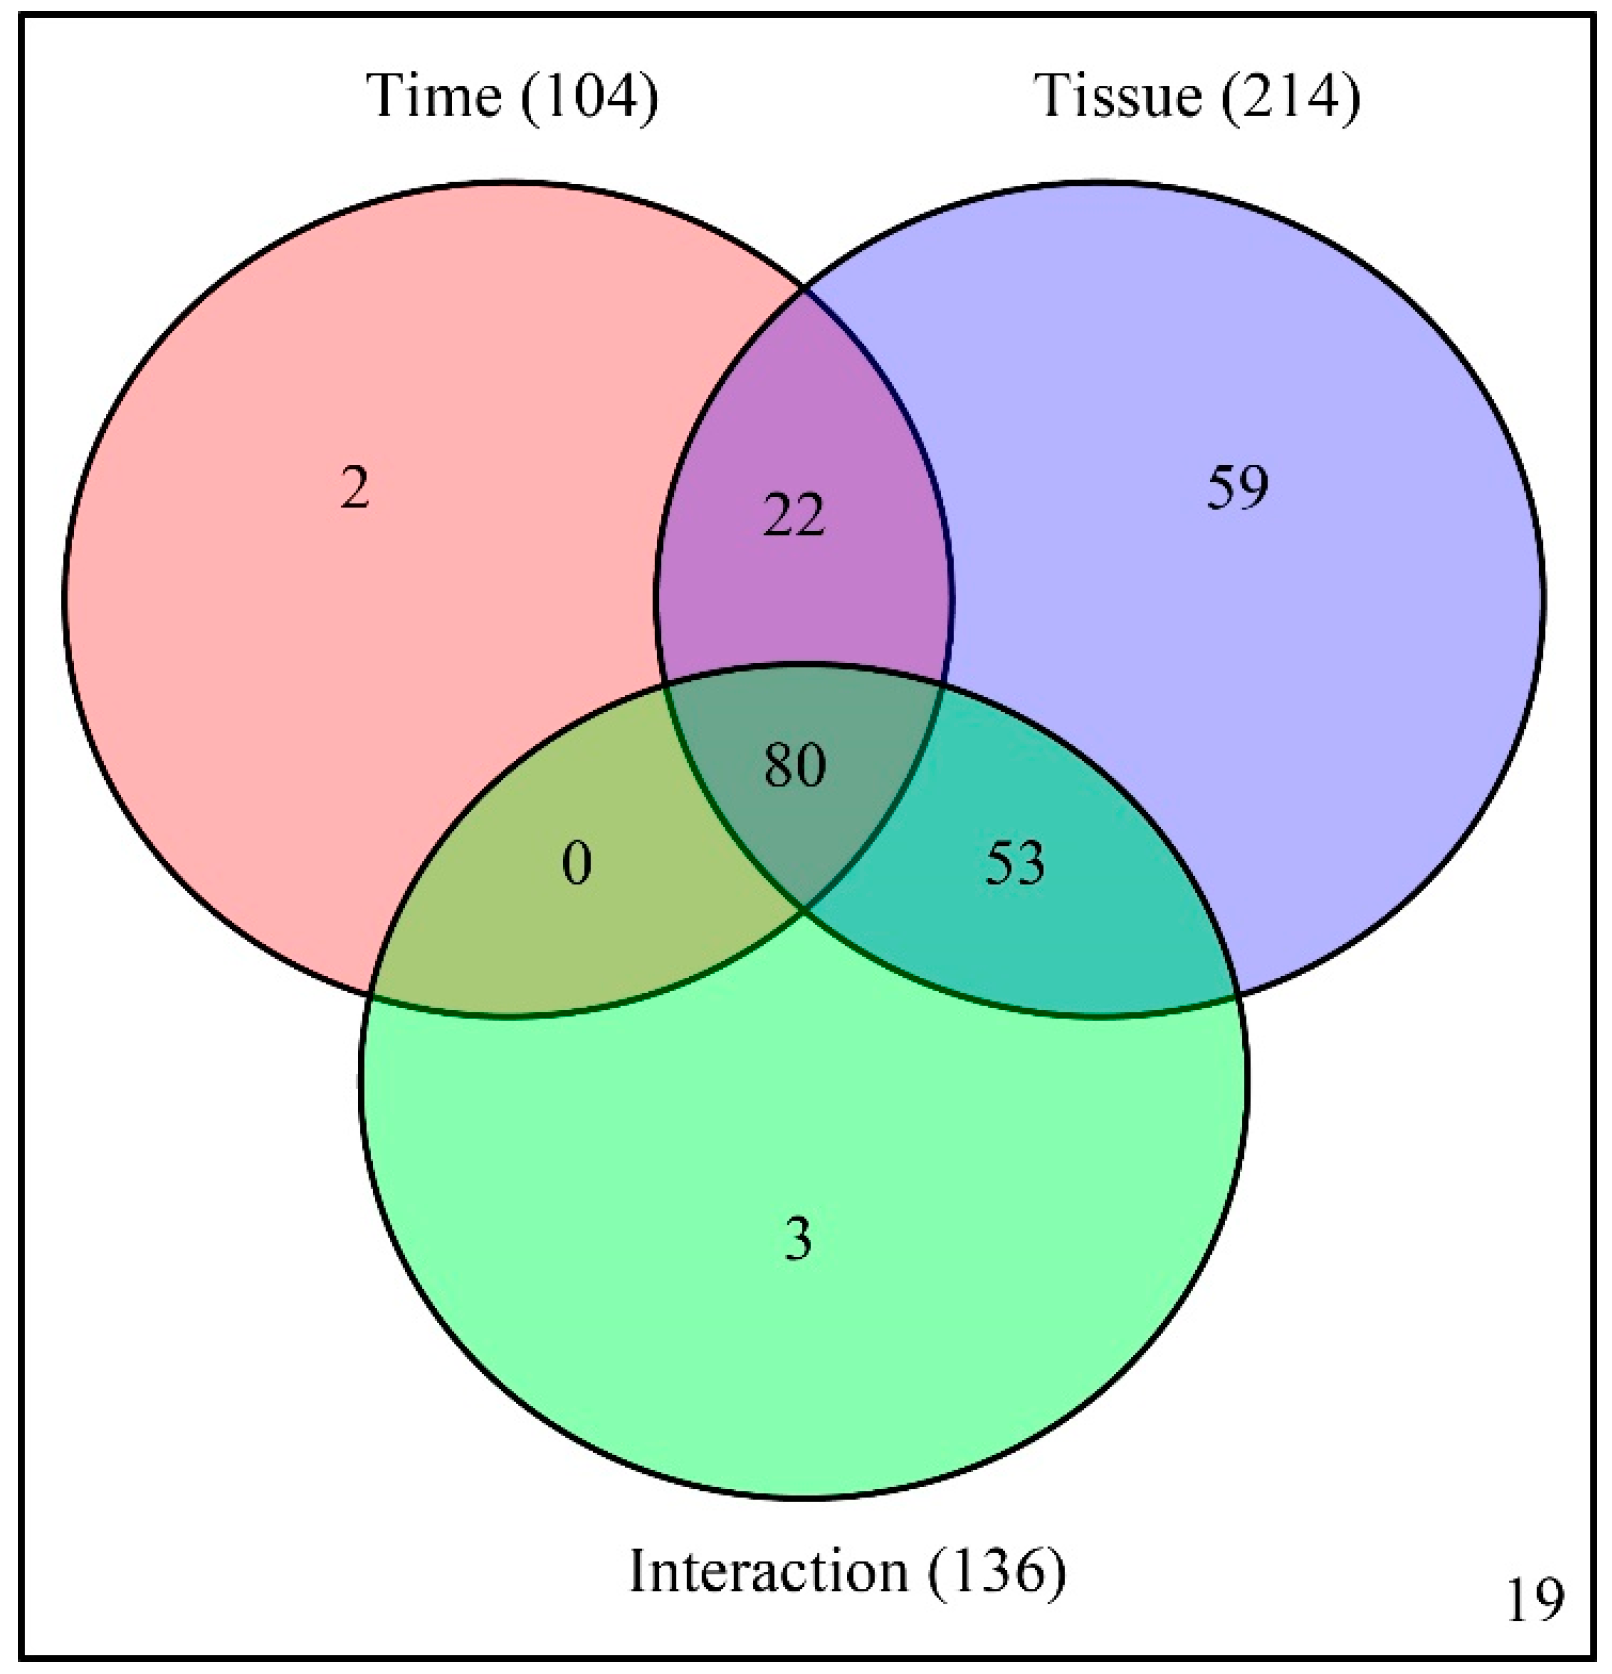
A two-way ANOVA (analysis of variance) was then conducted to determine which factors (developmental time, tissue type, and their interaction) cause the variation of each metabolite. Among the identified 238 metabolites, the abundance of 104, 214, and 136 metabolites were affected by developmental time, tissue type, and their interaction, respectively. Among the metabolites, the abundance of 80 metabolites were simultaneously affected by developmental time, tissue type, and their interactions (
Figure 3 and
Table S2).
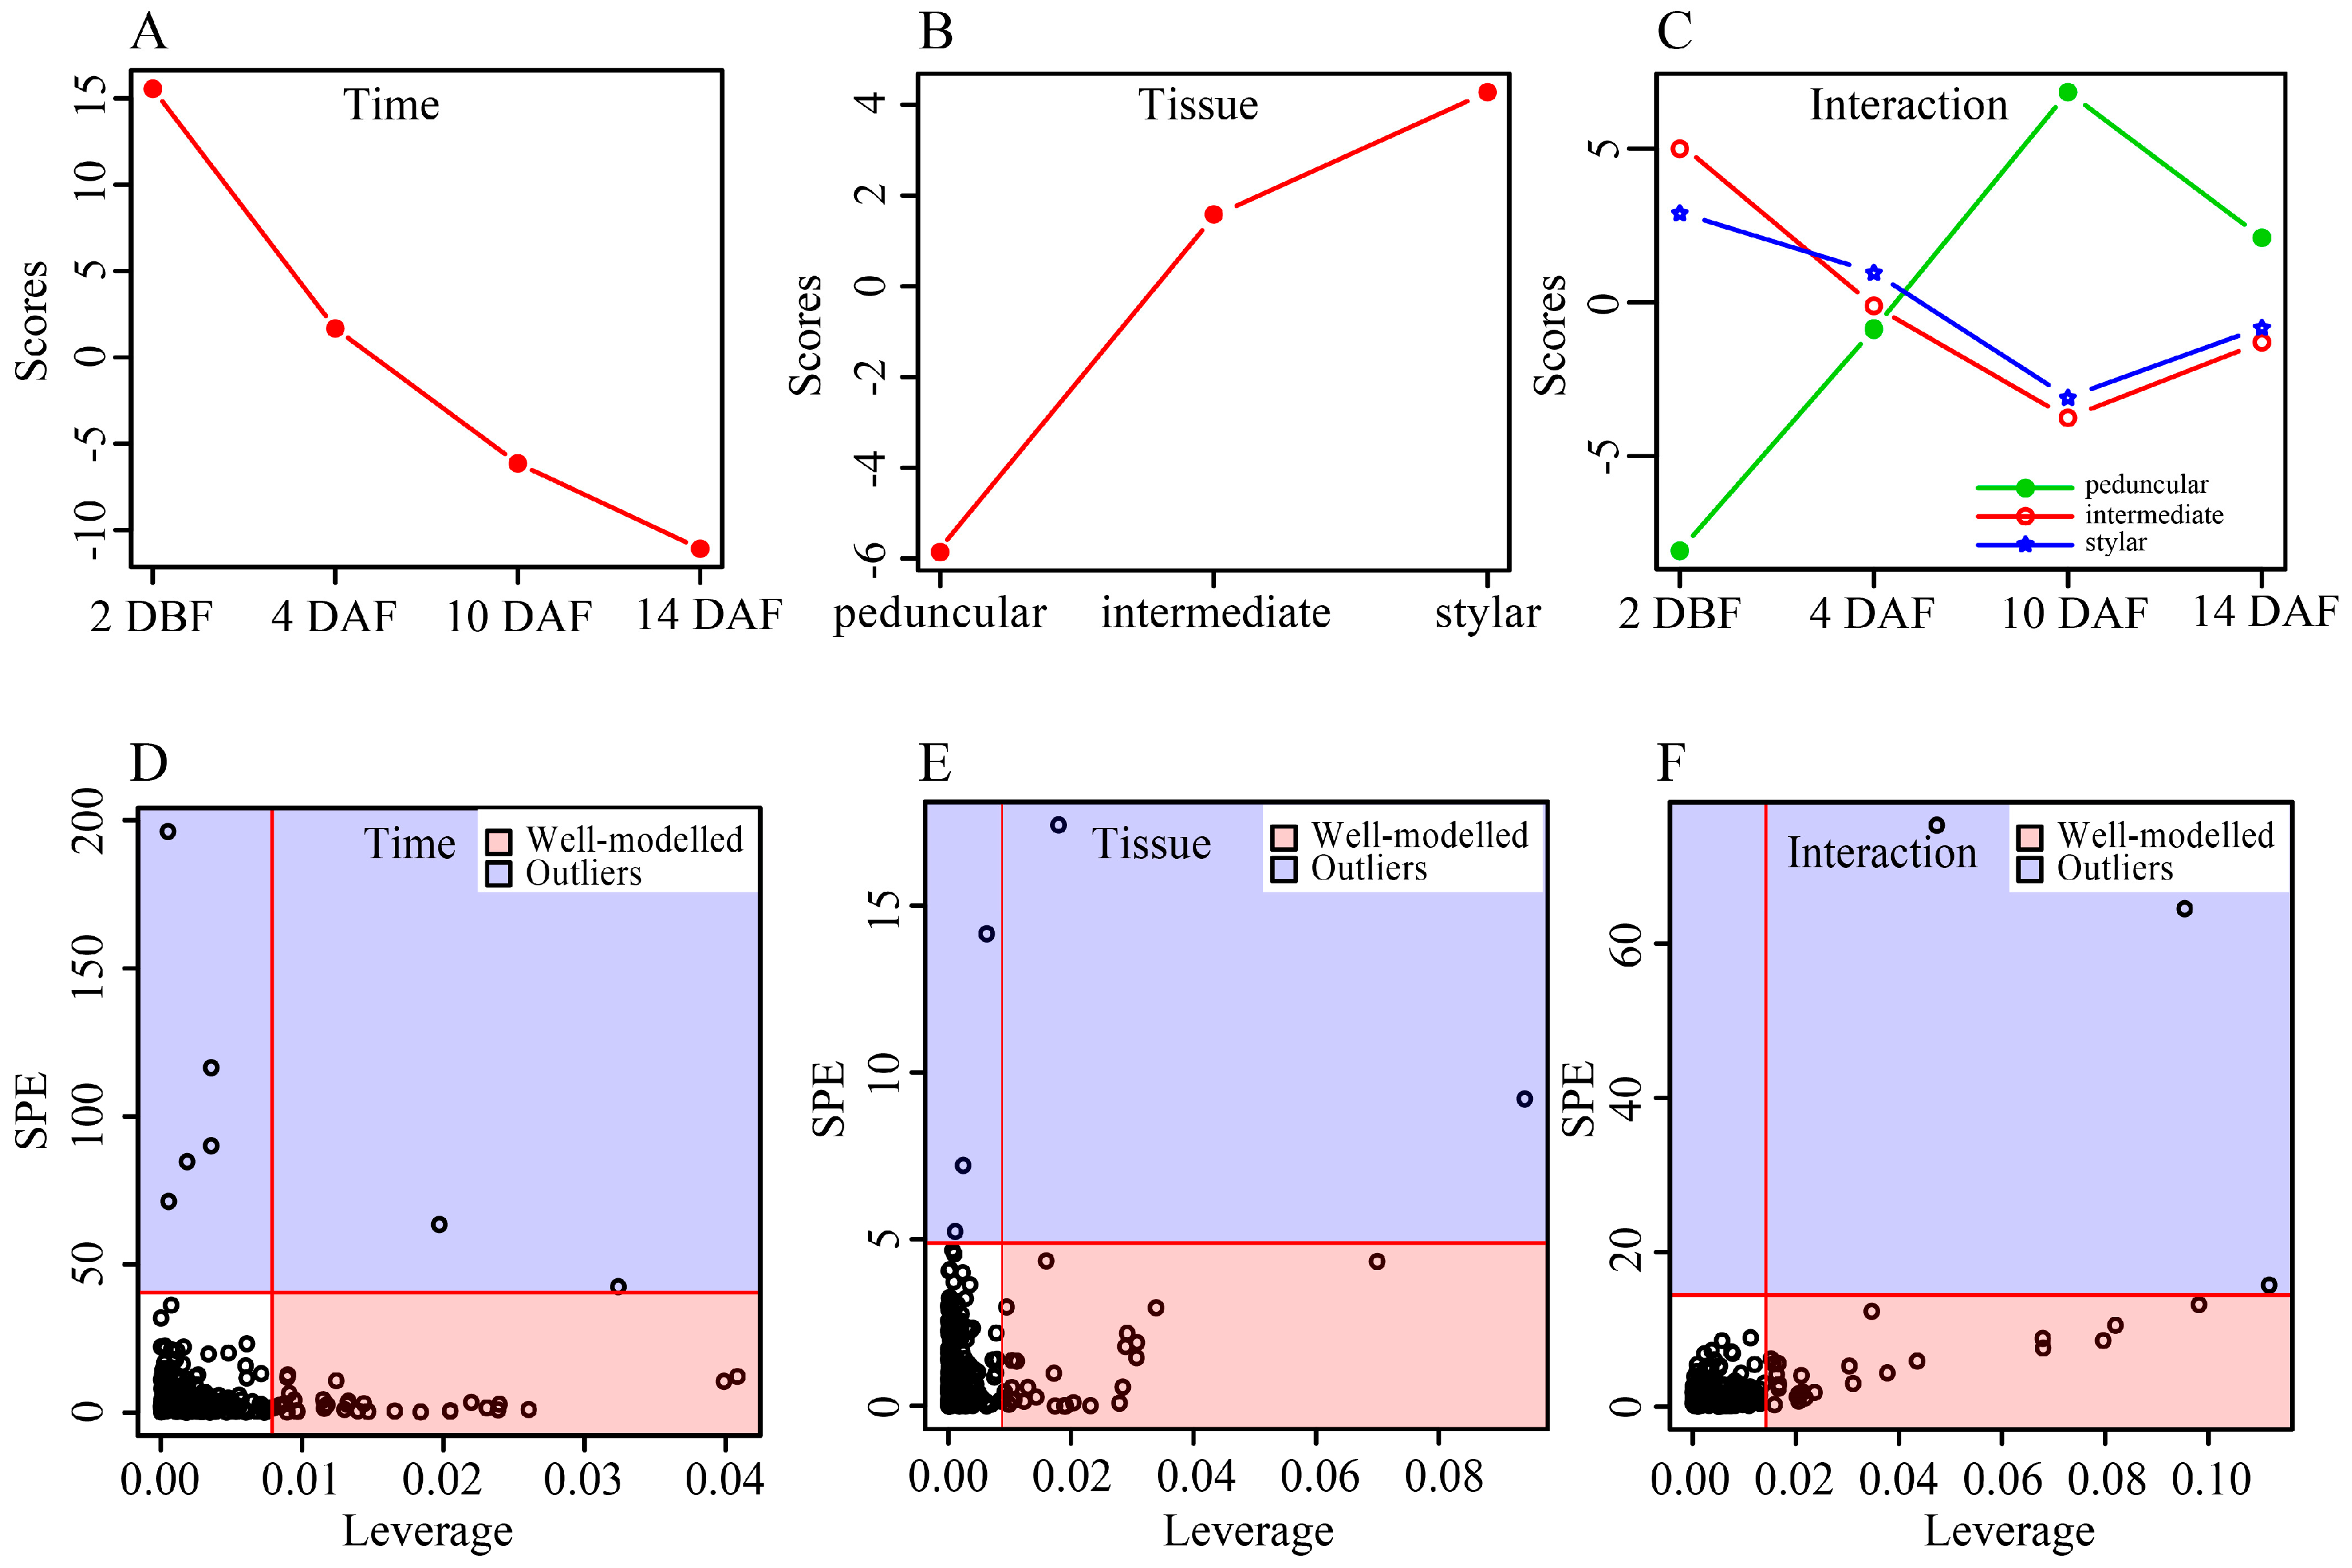
In addition, an ANOVA-Simultaneous Component Analysis (ASCA) was performed to identify the major patterns with regard to the two given factors and their interaction [
35]. Developmental time score plots based on component 1 of the corresponding model showed that the scores gradually decreased along the time (
Figure 4A), indicating that the abundance of most metabolites decreased from 2 DBF to 14 DAF. This result was well consistent with the PCA plots shown in
Figure 2, in which samples of different tissue types of cucumber fruit shifted in the same direction along its development. The tissue score plot showed that different tissue types differed in their PC1 scores and an increasing gradient was observed from the peduncular end to the stylar end of cucumber fruit (
Figure 4B). Component 1 of the interaction effect clearly showed the same trends over all of the time points between the intermediate segment and the stylar end while the peduncular end showed the opposite trend (
Figure 4C). The distances among the three tissue types of cucumber fruit at 4 and 14 DAF were relatively small, while the peduncular end was away from the intermediate segment and the stylar end at the other two time points in the interaction score plot (
Figure 4C), suggesting that the differences between the interaction effects among these tissues were relatively smaller at 4 and 14 DAF than those at 2 DBF and 10 DAF. This result was also consistent with the PCA score plots shown in
Figure 2, in which the stylar ends, the intermediate segments and the peduncular ends grouped tighter in 4 and 14 DAF groups than those at the other two time points.
Leverage/squared prediction error (SPE) plots were made to correlate the metabolic features with the experimental factors [
36]. Leverage evaluates the importance of the metabolite to the model, and SPE tests the fitness of the model for particular metabolites. Metabolites with high leverage and low SPE that contributed significantly to the model were picked out as well-modeled metabolites. Thirty well-modeled metabolites, including 25 flavonoids, stood out based on the major pattern of time (
Figure 4D and
Table S3), and the levels of these metabolites gradually decreased in all three tissues of the cucumber fruit. A total of 29 metabolites, including 12 flavonoids and five amino acids, were well-modeled by tissue type (
Figure 4E and
Table S3), the abundance of which differed among tissues. For example, the levels of astilbin, caffeic acid-
O-hexoside II, chalcone 2′-
O-glucoside, isovitexin and kaempferol-3-
O-rhamnoside increased from 2 DBF, peaked at 10 DAF, then sharply declined at 14 DAF in both the stylar end and the intermediate segment, but they tended to remain stable in the peduncular end (
Figure S2). A total of 25 metabolites, including 18 flavonoids and five amino acids, stood out based on the major pattern of interactive effect (
Figure 4F and
Table S3), and the levels of these metabolites changed differently among tissue types along development of the cucumber fruit.
2.2. Metabolic Changes along Cucumber Fruit Development
To investigate the change patterns of each metabolite along cucumber fruit development, the levels of the 238 identified metabolites at 4 DAF, 10 DAF and 14 DAF were compared with those at 2 DBF of the same tissue to eliminate the tissue-dependent variation.
Various kinetic metabolic change patterns were observed in the amino acids (
Figure 5A). The abundances of 17 amino acids (
Figure 5A, label 1), such as aspartate, asparagine, glutamic acid,
N-acetylglutamte, citrulline, ornithine,
N-acetylornithine and oxidized glutathione, significantly decreased, while those of methionine, tryptophan and spermidine increased in all three different parts of the cucumber fruit along its development. The levels of four amino acids, pyroglutamic acid, arginine,
N-acetyllysine and
N-acetylmethionine significantly increased, mainly at 14 DAF, in all three different parts of cucumber fruit, especially in the stylar end and the intermediate segment (
Figure 5A, label 2). Notably, the dynamic change patterns of some amino acids were tissue-specific. For example, the level of reduced glutathione significantly decreased in the peduncular end while it slightly increased in the stylar end and strongly increased in the intermediate segment, respectively.
The levels of 20 carbohydrates, such as sucrose, raffinose, glucose 6-phosphate and maltotetraose, decreased gradually in all three different parts of the cucumber except that of dimethyl malonate in the stylar end, which increased gradually along the cucumber fruits’ development (
Figure 5B, label 1). The abundances of 11 carbohydrates, such as glucose, glucose 1-phosphate and phosphoenolpyruvate (PEP), tended to increase slightly (
Figure 5B, label 2). The variations in the levels of TCA cycle intermediates, such as fumarate, malic acid, succinate, and alpha-ketoglutarate, were relative small along cucumber fruit development, except that of succinate, which decreased significantly at 14 DAF.
The levels of seven lipids (including five fatty acids, myristic acid, linoleic acid, linolenic acid, pinolenic acid and 2-hydroxypalmitate) decreased gradually in all three different parts of the cucumber (
Figure S3A, label 1). The levels of the majority (16 out of 20) of the lysoglycerophosphatidylcholines (LysoPCs) and lysoglycerophosphatidylethanolamines (LysoPEs) started to decrease from 4 DAF in the stylar and the peduncular ends while they decreased from 10 DAF in the intermediate segment (
Figure S3A, label 2). The levels of six lipids (including four oxolipids) decreased at 4 DAF and 10 DAF in all three different parts of the cucumber, while they were not significantly changed or even increased slightly at 14 DAF in the stylar end and the intermediate segments, only (
Figure S3A, label 3). The change patterns of three monoacylglycerides (i.e., 1-palmitoylglycerol, 2-palmitoylglycerol and 2-linoleoylglycerol, were tissue specific) increased gradually in the intermediate segment, while they decreased in the peduncular end during cucumber development (
Figure S3A, label 4).
The general kinetic change trend of the levels of cofactors, nucleotides, hydroxycinnamate derivatives and benzene derivatives was similar to that of lipids, which decreased gradually along cucumber fruit development (
Figure S3B–S3E). However, the levels of some metabolites of these classes increased in some tissues at some time points. For example, the levels of ascorbate and dehydroascorbate increased slightly at 4 DAF and 10 DAF in the stylar end (
Figure S3B). The levels of adenine, guanosine 3′,5′-cyclic phosphate, guanosine 5′-phosphate and uridine monophosphate increased significantly in the intermediate segment (
Figure S3C). The abundance of indole increased highly in all segments of cucumber fruits at 4, 10 and 14 DAF compared to that at 2 DBF, while that of 3-indoleacetic acid increased only in the stylar end (
Figure S3D). The levels of caffeic acid-
O-hexoside II increased at 4 and 10 DAF in both the stylar end and the intermediate segment of cucumber fruits (
Figure S3E).
The dynamic change patterns of two isomers of monoterpenol glycoconjugates were different though both levels tended to increase along cucumber fruit development (
Figure S3F). The level of terpenyl-pentosyl-glucoside I peaked at 4 DAF and then gradually decreased along cucumber development; however, it was still significantly higher at 10 DAF and 14 DAF than at 2 DBF in all three different parts except at 14 DAF in the peduncular end. The levels of terpenyl-pentosyl-glucoside II increased gradually and peaked at 14 DAF in the stylar end, while the levels fluctuated within a relatively narrow range in the intermediate segment and the peduncular end. Accumulation of monoterpenol glycoconjugates in cucumber fruit along development is associated with age-related resistance to pathogenic microorganism, such as
Phytophthora capsici [
37].
The levels of 76.7% (33 out of 43) of flavonoids, such as tricin, luteolin, kaempferol, quercetin, isorhamnetin and their glycosides, decreased gradually along development in all segments of the cucumber fruit (
Figure 5C, label 1). Nine flavonoids showed the same change patterns in both the stylar end and the intermediate segment but different from those in the peduncular end (
Figure 5C, label 2). For example, the levels of isorhamnetin-
O-rutinoside I and isoscoparin-2″-
O-glucoside gradually decreased in both the stylar end and the intermediate segments but were not significantly changed or even slightly increased in the peduncular end at 10 and 14 DAF compared to those at 2 DBF. The levels of chrysoeriol
C-arabinosyl-
C-arabinoside, chrysoeriol-
C-hexoside-
C-pentoside, chalcone 2′-
O-glucoside, astilbin, isovitexin, kaempferol-3-
O-rhamnoside and quercetin-3-
O-rhamnosyl(1-2)-glucoside-7-
O-rhamno-side increased from 2 DBF and peaked at 10 DAF in both the stylar end and the intermediate segment, while the level increased only at 4 DAF and then significantly decreased at 10 and 14 DAF in the peduncular end.
2.3. Metabolic Difference among Tissues at Each Time Point
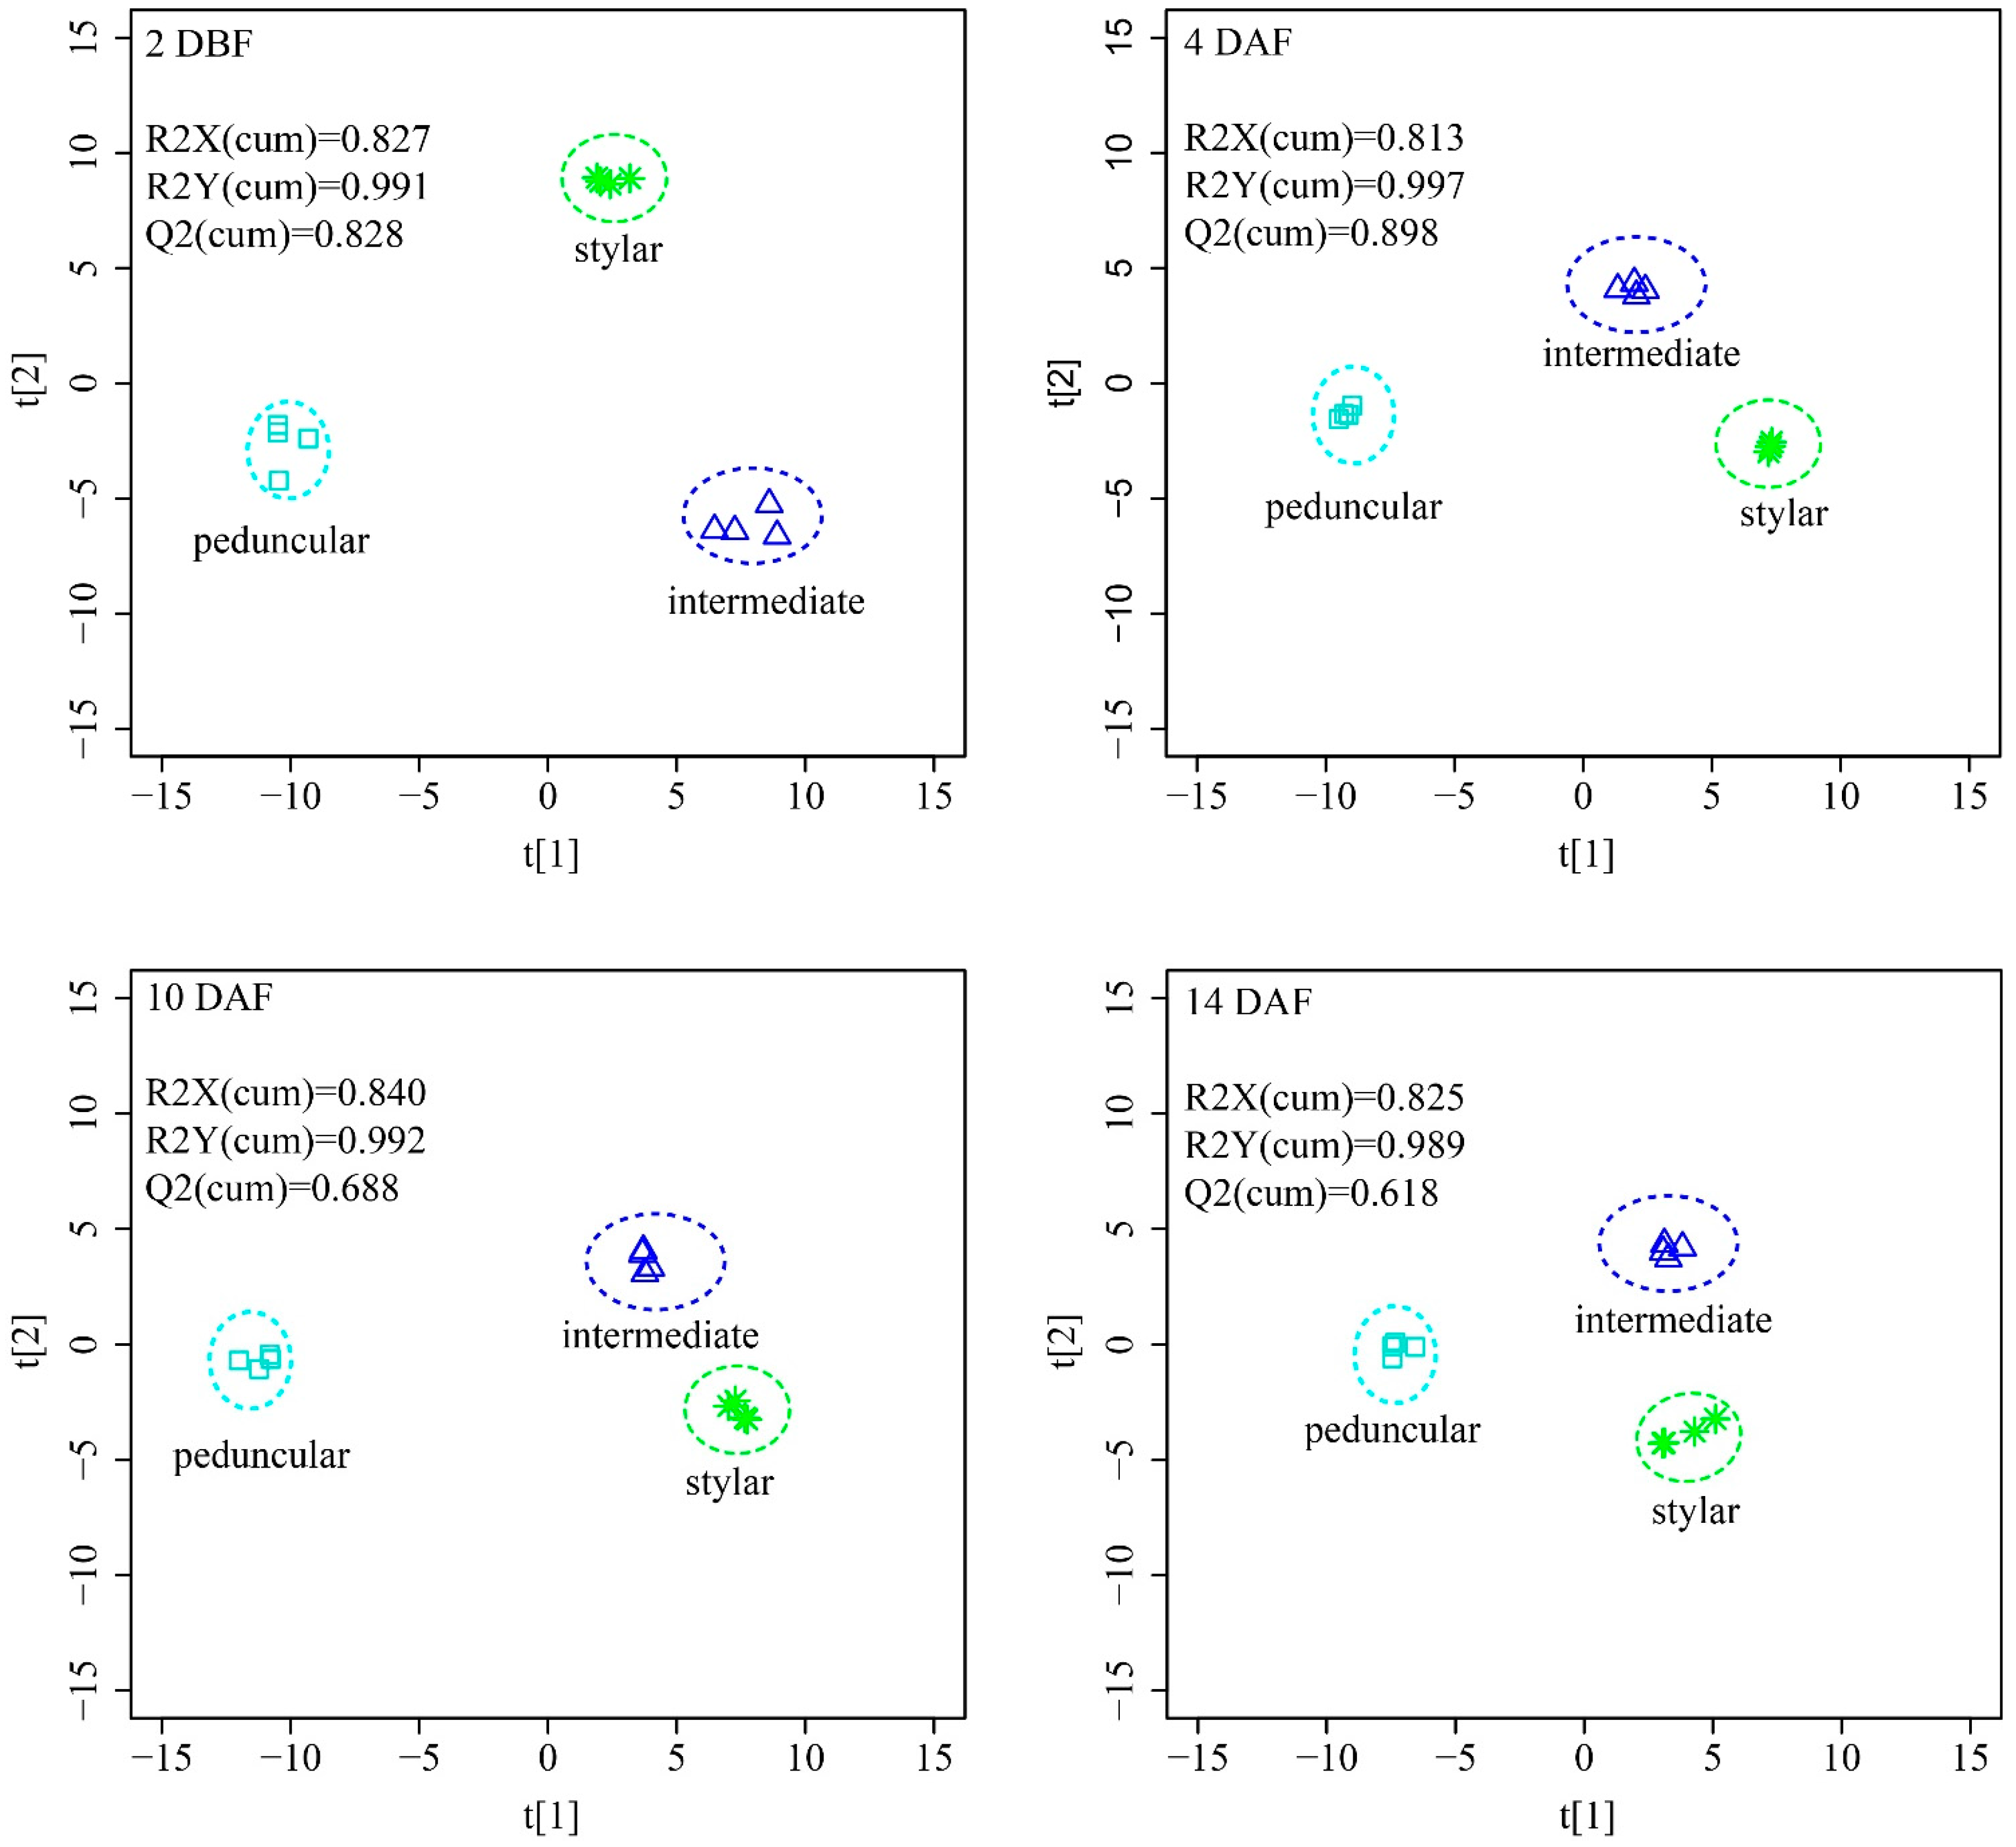
To obtain maximal covariance between the metabolite levels and the tissues of the cucumber fruit at each time point, an orthogonal partial least squares projection to latent structures-discriminant analysis (OPLS-DA) was applied. The OPLS-DA model established with two predictive components and three orthogonal components generated, the explained variation values: R2X(cum) > 0.82, and R2Y(cum) > 0.98 and the predictive capability: Q2(cum) > 0.62 at all four time points (
Figure 6). These high value parameters indicated the excellence in modeling and prediction with good discrimination among the stylar end, the intermediate segment and the peduncular end of cucumber fruit since OPLS-DA models with parameters higher than 0.5 are considered to be satisfactory in explanatory and predictive capabilities [
38]. The score plots of OPLS-DA showed a distinct separation among the three tissues at all four time points (
Figure 6). The stylar ends and the intermediate segments located at the same side of the score plots, while the peduncular ends on the other side indicated that the metabolic profiles between the stylar ends and the intermediate segments were more similar than those of the peduncular ends.
Based on a variable importance in projection (VIP) threshold (VIP > 1.5) from the seven-fold cross-validated OPLS-DA models, a number of metabolites responsible for the differentiation of metabolic profiles of the stylar end, the intermediate segment and the peduncular end of cucumber at each time point were obtained. In parallel, the candidate metabolites from OPLS-DA model, whose mean values significantly (false discovery rate < 0.05) differed among the tissues of cucumber fruit tested by one-way analysis of variance (ANOVA) with post hoc Tukey’s honestly significant difference (HSD), were further selected as biomarkers (
Table 1).
At 2 DBF, a total of 14 metabolites, including four amino acids, one benzene derivative, one cofactor, six flavonoids, one hydroxycinnamate derivatives and one nucleotide were selected as biomarkers (
Table 1). The levels of most of these metabolites were significantly different between the peduncular ends and the other two tissues but were not significantly different between the stylar end and the intermediate segment. The relative abundances of guanosine 5′-diphosphate, tricin
O-glucoside
O-guaiacylglyceryl ether, valine, quercetin-3-
O-rhamnoside-7-
O-rhamnoside II and 3-indoleacetic acid were the highest in the peduncular end compared with those in the stylar end and the intermediate segments. In contrast, the levels of isoscoparin 2″-
O-(6″-(E)-feruloyl)-glucopyranoside, histidine, isorhamnetin-
O-rutinoside II, isovitexin 2″-
O-(6″-(E)-feruloyl)-glucopyranoside and isorhamnetin-
O-rutinoside I were the lowest in the peduncular end. The levels of four metabolites, i.e., ascorbate, aspartate, serine and coumaric acid hexoside III, were significantly different between the stylar end and the intermediate segment.
At 4 DAF, a total of 14 metabolites, including one carbohydrate, nine flavonoids, two hydroxycinnamate derivatives and two monoterpenol glycoconjugates, were important in distinguishing the three different tissues of the cucumber fruit from each other (
Table 1). The levels of terpenyl-pentosyl-glucoside I and feruloylquinic acid II in the stylar end were the highest compared with those in the intermediate segment and the peduncular end. The highest level of tricin
O-glucoside
O-guaiacylglyceryl ether, while the lowest levels of isoscoparin 2″-
O-(6″-(E)-feruloyl)-glucopyranoside, isorhamnetin-
O-rutinoside II, isovitexin 2″-
O-(6″-(E)-feruloyl)-glucopyranoside, luteolin, kaempferol-3-
O-glucoside and luteolin-
O-malonylhexoside, were found in the peduncular ends. The abundances of terpenyl-pentosyl-glucoside II and norophthalmate were relatively higher in the intermediate segment, while those of tricin 7-
O-(6″-(E)-sinapoyl)-β-
d-glucopyranoside and kaempferol-3-
O-robinoside-7-
O-rhamnoside were the lowest in the intermediate segment of the cucumber fruit.
At 10 DAF, a total of 15 metabolites, including one benzene derivative, two carbohydrates, one cofactor, six flavonoids, one hydroxycinnamate derivative, three lipids and one monoterpenol glycoconjugates, had important roles in separating the three different parts of the cucumber fruit from each other. The levels of the top five metabolites with the highest VIP values (astilbin, caffeic acid-O-hexoside II, isovitexin, chalcone 2′-O-glucoside and terpenyl-pentosyl-glucoside I), two lipids (linolenoyl ethanolamide and phytosphingosine) and the other three flavonoids (chrysoeriol-C-hexoside-C-pentoside, chrysoeriol C-arabinosyl-C-arabinoside and kaempferol-3-O-rhamnoside) were all higher in the stylar end and the intermediate segment than those in the peduncular ends. The levels of sphinganine and 3-indoleacetic acid were significantly different in all three tissues, with the highest level of 3-indoleacetic acid and the lowest level of sphinganine in the peduncular ends. The levels of two carbohydrates, i.e., phosphoenolpyruvate and methylsuccinic acid, were significantly higher in the stylar end than those in the intermediate segment and the peduncular end.
At 14 DAF, a total of eight metabolites, including six amino acids, one flavonoid and one monoterpenol glycoconjugate were present (
Table 1). The levels of all the eight metabolites were the lowest in the peduncular end. Similar high levels of lysine, serine and kaempferol-3-O-rhamnoside were found in the stylar end and the intermediate segment. The levels of valine, terpenyl-pentosyl-glucoside II and gamma-guanidinobutyric acid in the stylar end were significantly higher than those in the intermediate segment and the peduncular end. The highest abundance of methionine was observed in the intermediate segment.
2.4. Metabolite-Metabolite Correlations in Develo** Cucumber Fruit
As described above, the majority of the metabolites were down-regulated, though some of them were up-regulated, during the early development of cucumber fruit. Thus, it is interesting to investigate which metabolites were co-regulated to better understand the metabolic regulation process in cucumber fruit and to look for a possible conserved metabolic pathway for metabolic engineering to increase the nutritional metabolite levels in the future. To this end, a pair-wise correlation analysis was performed by employing the Pearson’s product-moment correlation with the 238 identified metabolites. The correlation coefficients and p-values are affected by the sample number. Normally, a larger sample number can provide more reliable correlations, though with lower coefficients. Thus, the metabolite levels of 48 individual samples (i.e., each metabolite has 48 values), but not the mean metabolite levels of four biological replications, were used to obtain more reliable correlations.
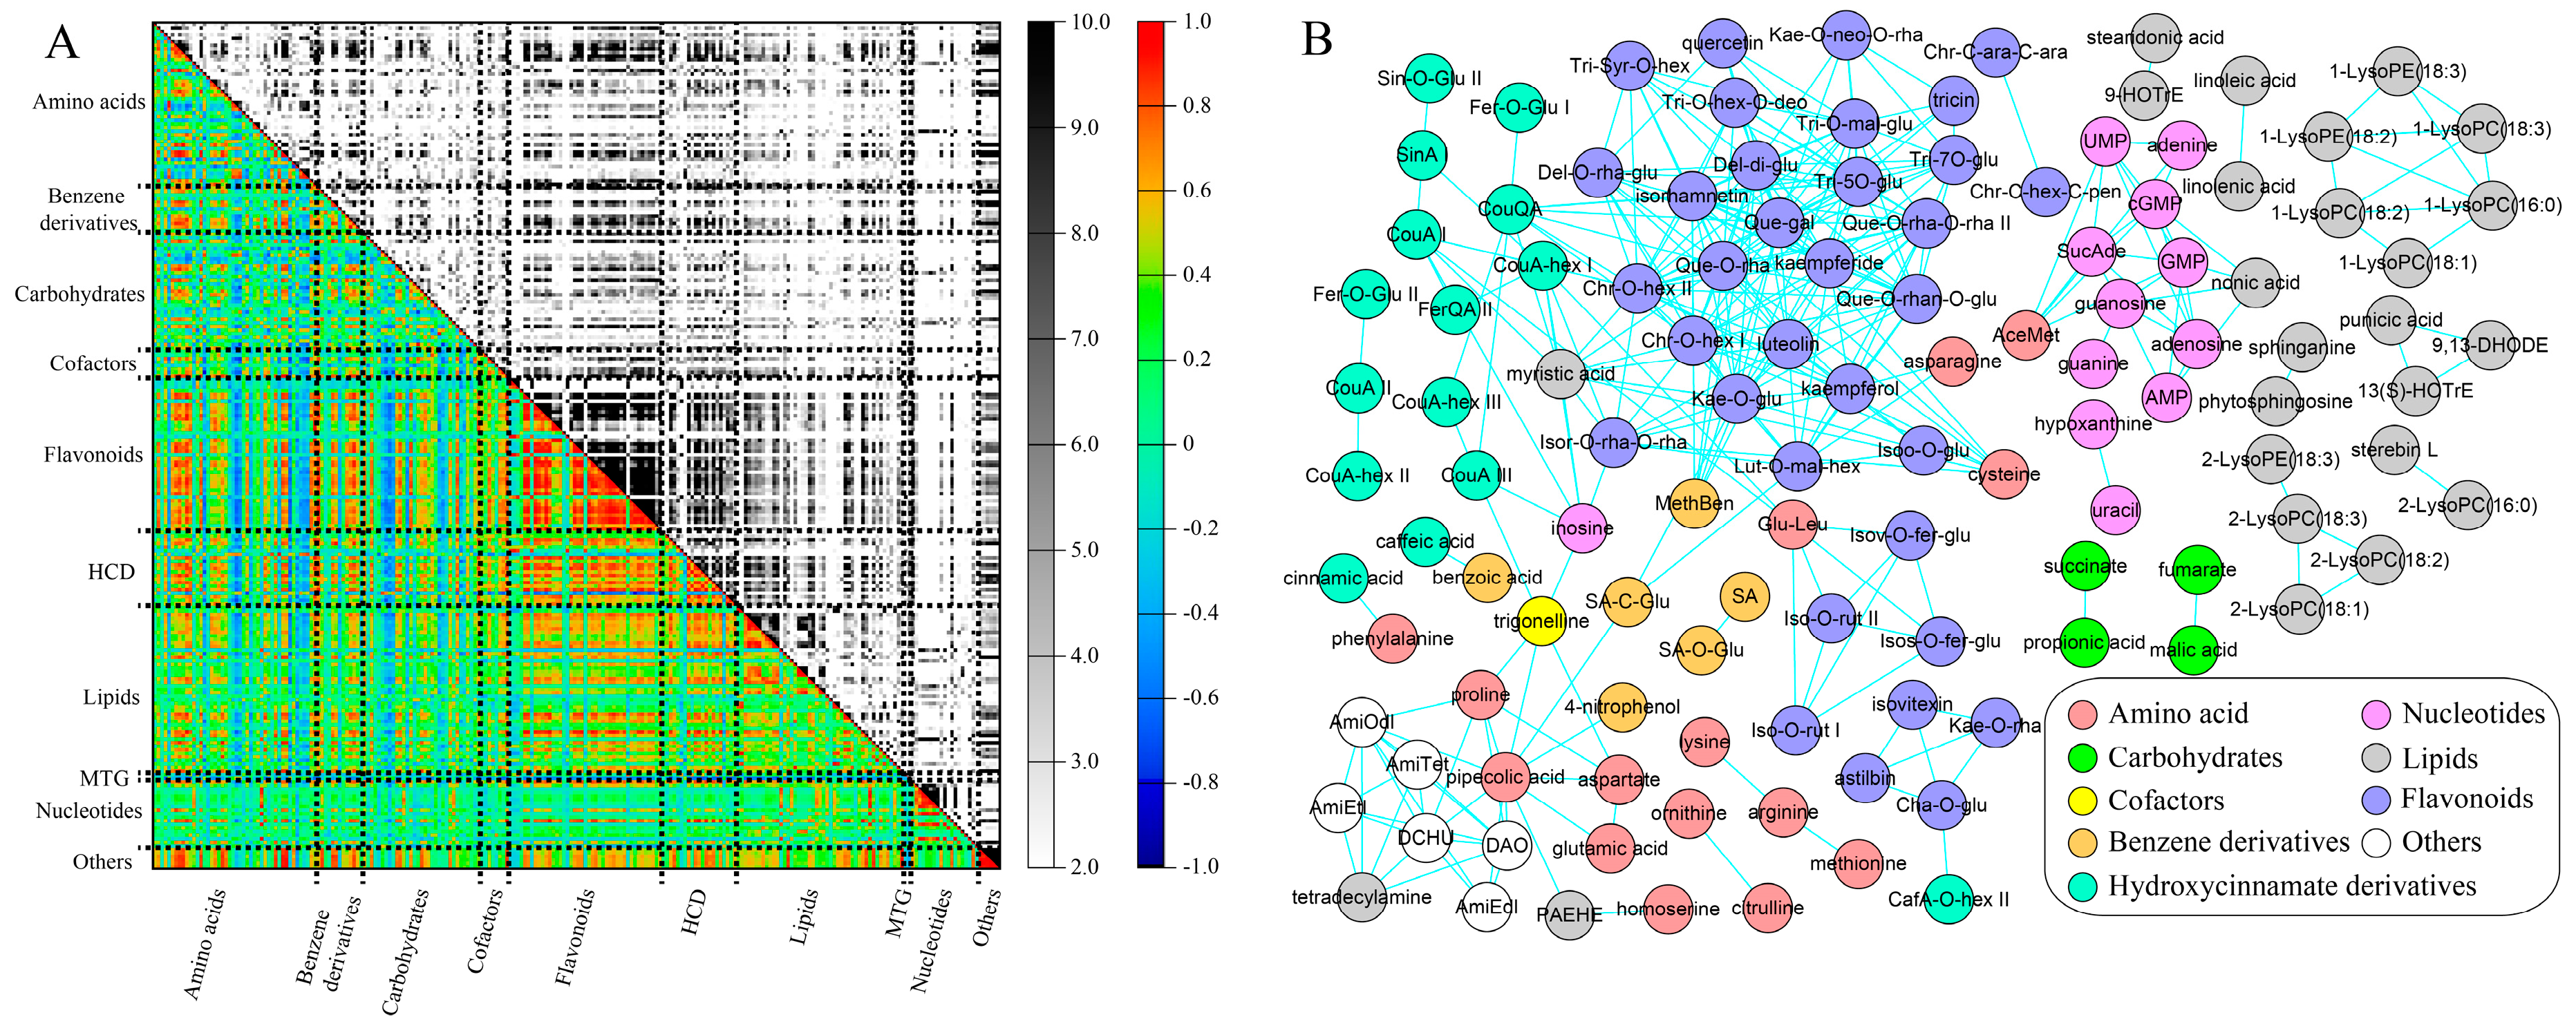
At the threshold of an absolute correlation coefficient greater than 0.70 (|
r-value| ≥ 0.70), there were 2989 pairs of positive correlations and 29 pairs of negative correlations (
Table S4). These positive correlations were found in all metabolite classes while most of them were associated with flavonoids, hydroxycinnamate derivatives, benzene derivatives or lipids (
Figure 7A). This is consistent with the abovementioned metabolic change patterns in cucumber fruits in which the levels of these metabolites decreased in all three different segments of the cucumber fruit during its early development. Six, five and four negative correlations were found to be connected with quinate, pyroglutamic acid and glutamine, respectively. Levels of these three metabolites increased gradually along cucumber development. Almost all of the highly correlated metabolite pairs (
r-value > 0.90) belonged to the same compound class, and the majority of them were flavonoids (
Figure 7B and
Table S4), indicating that metabolites involved in the same metabolic pathway were highly co-regulated.
The highly correlated metabolite pairs were observed between metabolites with at least three biological relations (
Table 2). The first relation was metabolites with the substrate–product connection in a metabolic reaction, such as phenylalanine and cinnamic acid, fumarate and malate, linoleic acid and linolenic acid, coumaric acid and coumaric acid hexoside, luteolin and luteolin-
O-malonylhexoside, etc. The second relation concerned isomers, such as chrysoeriol
O-hexoside I and chrysoeriol
O-hexoside II, kaempferol and luteolin, tricin 5-
O-glucoside and tricin 7-
O-glucoside, etc. The third relation represented metabolites with a similar structure or belonging to the same sub-class, which was clearly observed in lipids. For example, linoleic acid and linolenic acid (unsaturated fatty acids), 9,13-DHODE and 13(s)-HOTrE (oxolipids), LysoPEs and LysoPCs (glycerophospholipids) were highly correlated (
Figure 7B). It is interesting that LysoPEs and LysoPCs with the fatty acyl chain at the same position of glycerol (
sn-1 or
sn-2,
sn means stereospecific numbering), were highly correlated. For example, 1-LysoPE(18:3), 1-LysoPE(18:2), 1-LysoPC(18:3), 1-LysoPC(18:2), 1-LysoPC(18:1) and 1-LysoPC(16:0) were highly correlated, while 2-LysoPC(18:3) was highly associated with 2-LysoPE(18:3), 2-LysoPC(18:2) and 2-LysoPC(18:1).

 ,
, 


