1. Introduction
Rice false smut is a disease affecting rice spikes that occurs from the flowering to the milking stage [
1,
2]. Its most typical and visible symptom is the replacement of rice grains with false smut balls [
3,
4]. It occurs mainly in Asian countries such as China, Japan, Korea, the Philippines, and India, and is one of the most devastating diseases in the world’s major rice producing regions [
5,
6,
7,
8]. In recent years, due to the promotion of short-stalked compact and high-yielding rice varieties, indica–japonica interspecific hybrid rice combinations, changes in cultivation patterns, and the excessive use of nitrogen fertilizer during the tillering and gestation periods, the occurrence of rice false smut has become increasingly serious and has gradually risen from a previously minor or sporadic disease to become one of the three new major diseases affecting rice in China [
9,
10].
The damage caused not only results in a decrease in rice quality and yield, but also the generation of mycotoxin ustiloxins on infected rice spikelets [
11,
12]. As antimitotic cyclopeptide mycotoxins, the ustiloxins produced within a false smut ball can inhibit microtubule assembly and cell skeleton formation, which poses a serious threat to farmland preservation and ecosystems, as well as the health of humans and animals [
13]. Strategies to manage this devastating disease are therefore urgently needed.
It is widely accepted that
Ustilaginoidea virens (teleomorph
Villosiclava virens) is the causal agent of rice false smut [
14,
15]. As a typical airborne disease, virulent pathogen spores land on the surface of a rice spikelet and germinate hyphae as well as false smut balls on the spikelet [
3,
12,
16,
17,
18]. Thus, the epidemic of rice false smut is closely related to the amount of
U. virens spores in the field, and the diagnosis of rice false smut, combined with accurate detection and spore quantification, is of great importance for its prevention and management [
5,
19]. Traditionally, the microscopic counting of spores after capture is widely used in rice false smut diagnosis; however, this method requires specialist taxonomic technicians [
20]. Given the complexity of environmental samples and human subjectivity, it is difficult to obtain reliable data with high efficiency via microscopic analysis. A quantitative real-time PCR (q-PCR) technique has been applied for the early identification and quantification of pathogens in airborne diseases [
21]. However, this technique is susceptible to interference from environmental dust and other pathogens, making it difficult to quantify the low concentrations of spores captured [
20].
Loop-mediated isothermal amplification (LAMP), developed by Notomi et al. in 2000, is a non-PCR-based nucleic acid amplification technique that can be used for the molecular detection of various bacteria, viruses, fungi in disease diagnosis [
22,
23,
24]. The LAMP reaction is carried out at a constant temperature (between 60 and 65 °C) in less than an hour through the use of two pairs of primers—an inner primer (FIP/BIP) and an outer primer (F3/B3). These two pairs of primers constitute the basic LAMP primer set for the LAMP reaction, in order to recognize specific nucleic acid sequences of monitored targets [
25,
26,
27]. An additional pair of LAMP primers, loop primers, can also be used to significantly improve LAMP efficiency. A simple and visual LAMP assay was developed by Yang et al. in 2018 for the rapid diagnosis of
U. virens [
28]. However, this assay cannot be used directly for quantitative detection of complex DNA samples. The quantitative-LAMP (q-LAMP) assay (DiaSorin S.p.A., Saluggia, Italy) is a technical improvement from the classical LAMP, which combines LAMP technology with the real-time fluorescence quantitative PCR technique [
29]. It is based on the addition of nucleic acid fluorescent dyes, such as SYBR Green or SYTO, resulting in a more sophisticated method suitable for the needs of field diagnosis [
30,
31]. In this study, we aimed to design and develop a specific and sensitive q-LAMP assay for detection and quantification
U. virens, which can be applied in the early diagnosis of rice false smut for preventing the spread of this devastating airborne disease. Additionally, this study is the first report to describe a quantitative diagnostic test for the detection of
U. virens using q-LAMP.
3. Discussion
Currently, rice false smut disease caused by
U. virens is one of the most devastating rice diseases in China, as well as many other countries [
35]. The occurrence of rice false smut disease not only results in the decrease in rice quality and the serious loss of rice yield, but also threatens food safety due to its production of toxic mycotoxins within the false smut balls [
10,
11]. However, it has been found that rice false smut disease is difficult to control. As a typical airborne disease, the epidemic of rice false smut is closely related to the number of
U. virens spores in the field; thus, early detection and warning are critical for preventing and mitigating rice false smut. In this study, a q-LAMP assay system was developed. The results show that the species-specific UV-2 primer sets in the q-LAMP assay system could correctly distinguish
U. virens from the other nine air-dispersed fungi, including
Fusarium fujikuroi,
F. oxysporum,
F. proliferatum,
F. solani,
F. graminearum,
Penicillium sp.,
Pyricularia oryzae,
Alternaria alternata,
and Rhizoctonia solani (
Figure 3). Additionally, sensitivity validation found that the q-LAMP assay was able to detect a concentration of 6.4
U. virens spores/mL at an optimal reaction temperature of 63.4 °C within 60 min (
Figure 4), and the q-LAMP assay could even achieve accurate quantitative detection when there were only nine
U. virens spores on the Melinex tape (
Figure 6). Moreover, there was a good linear relationship between the spore amount (y) and the amplification time (x) (
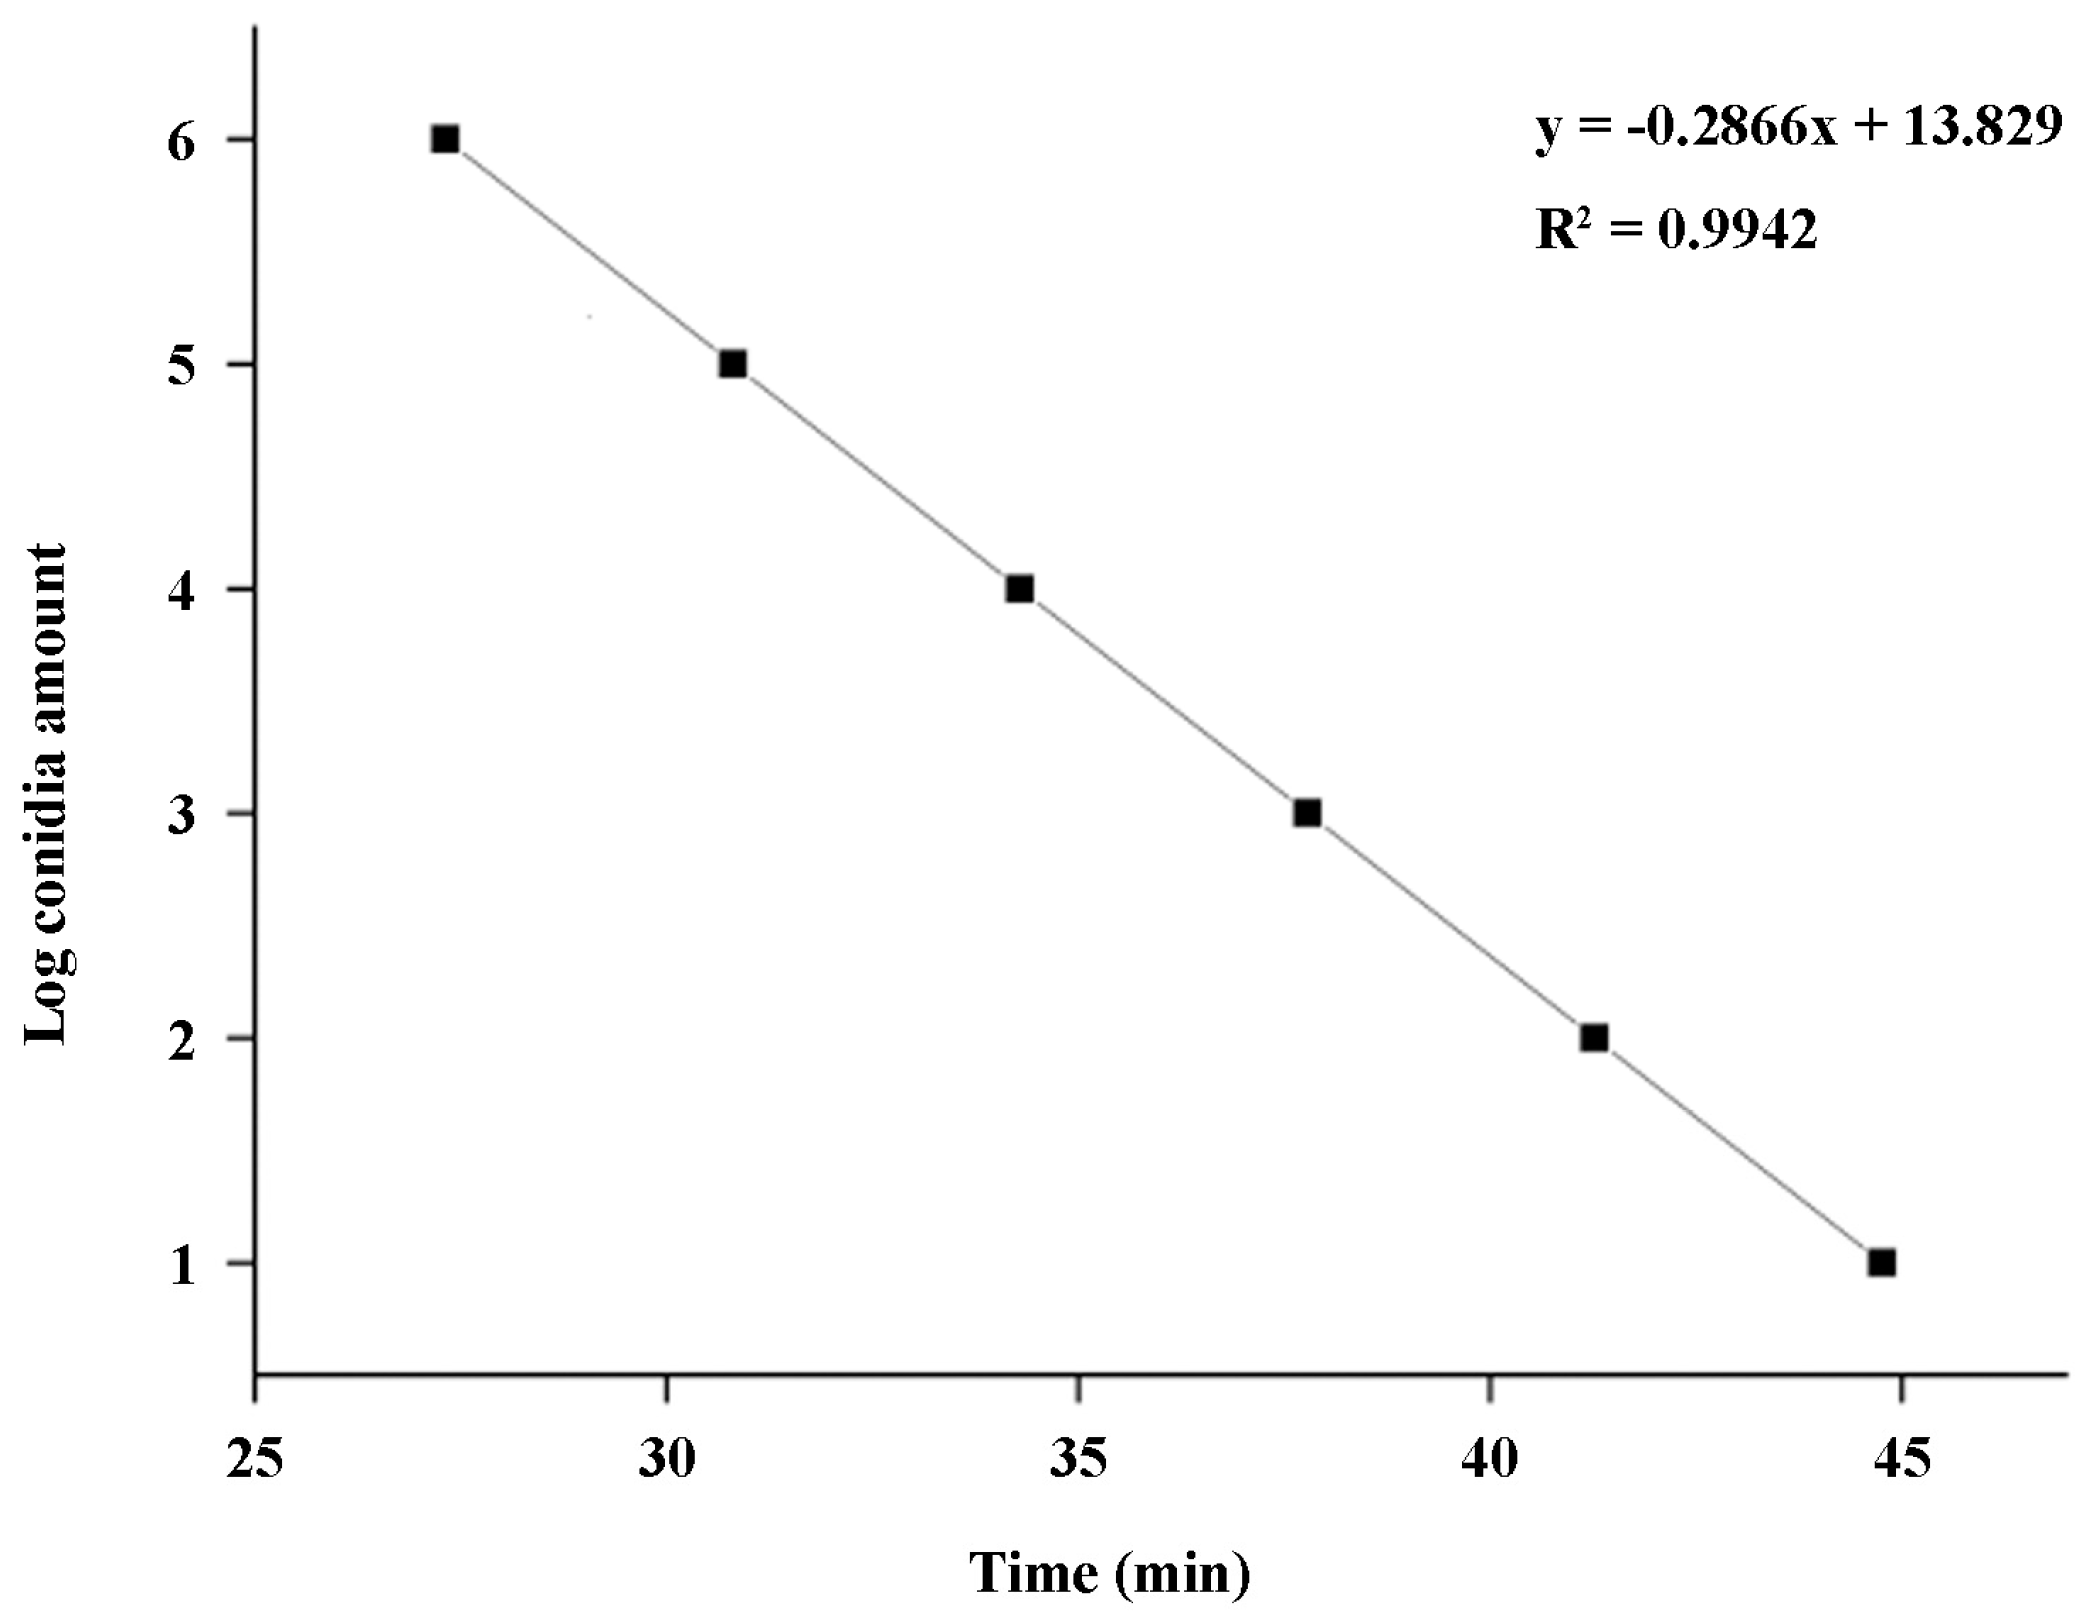
Figure 5), which enables accurate quantification of
U. virens and early diagnosis of
U. virens infection via q-LAMP assay.
The LAMP primer set consisted of two outer primers (forward primer F3 and backward primer B3), two inner primers (forward inner primer FIP and backward inner primer BIP), and two loop primers (forward loop F and backward loop B) (
Supplementary Figure S2). The outer primers (F3 and B3) were used in the initial steps of the LAMP reactions but later, during the isothermal cycling, only the inner primers were used for strand-displacement DNA synthesis. Outer and inner primers are necessary for LAMP primer design, while the loop primers can be used to accelerate amplification reactions and improve the LAMP assay efficiency [
36]. In this study, the q-LAMP primer set was designed according to the work of Wang et al. [
20] and Li et al. [
37], containing a forward inner primer (FIP), a backward inner primer (BIP), and two outer (F3 and B3) primers. The
ustiloxins biosynthetic gene sequence was used to design primers to ensure their specificity. Meanwhile, we sequenced the targeted region of
ustiloxins biosynthetic gene in 15
U. virens stains and designed the primer sets elaborately to eliminate the interference from nucleotide polymorphisms, ensuring the amplification efficiency in
U. virens detection (
Figure 3).
For
U. virens diagnosis, besides traditional disease diagnosis that includes the identification of symptoms, isolation of pathogens, and microscopic techniques, a conventional nested-PCR assay has been developed for the detection
U. virens in rice [
6]. However, the nested-PCR has less sensitivity and cannot be used in accurate quantification of
U. virens [
38]. Recently, the q-PCR technique and q-LAMP assay have been applied for the identification and quantification of pathogens in disease diagnosis. In this study, we have established these two systems for
U. virens quantification. The q-PCR assay was carried out using the F3/FB primer set and the effective amplification reactions were detected in samples with spore concentrations of 2 × 10
4, 4 × 10
3, 8 × 10
2, 1.6 × 10
2 spores/mL, but not 32 spores/mL (
Supplementary Figure S1), indicating a lower sensitivity of q-PCR for
U. virens detection compared to the q-LAMP assay system.
Rice false smut has no symptoms in the early stage and can only be identified in the late stage when the smut balls appear. Chemical control is the main means of rice false smut prevention and control [
39]. The previous study showed that the first 4~15 d of ear bud breakage was the main period of control, and the first 4~7 d of control was the best [
40]. If the key window in the infection of
U. virens in rice is not grasped, the efficacy of management will be inadequate [
16,
40]. Therefore, for rice false smut that relies on airborne transmission, early detection and early warning can aid in disease prevention and control. In this study, we collected spore samples of
U. virens from the field for two consecutive years using the q-LAMP assay system and microscopic observation. Compared with manual observation, the q-LAMP assay system could detect spores in the air more accurately and quickly, providing a theoretical basis for precise fungicide application (
Figure 7). Therefore, the q-LAMP assay, with higher efficiency and sensitivity, is a better choice for the early diagnosis of rice false smut.
In conclusion, this is the first assay developed for the detection of U. virens using q-LAMP assays. Compared with other U. virens detection methods, the newly developed LAMP assay has superior operability, specificity, and sensitivity, and is more suitable for the quantitative detection of U. virens and early diagnosis.
4. Materials and Methods
4.1. Fungal Isolates
Isolates of
Ustilaginoidea virens and the nine other fungal pathogens used in this study were isolated and identified in our lab, and detailed information on each fungus is listed in
Table 4. Isolates were maintained on potato dextrose agar (PDA, prepared by 200 g potato, 20 g glucose, and 20 g agar per 1 L pure water) slants at 4 °C.
4.2. DNA Template Preparation from Mycelium and Spores for q-PCR and q-LAMP Analysis
Preparation of mycelial DNA template for optimum conditions and specificity of the q-LAMP assay, after mycelia grew covering two-thirds of the PDA plate surfaces, the hyphae were then transferred to a mortar and ground with liquid nitrogen. The resultant powder was then placed into a 2-mL centrifuge tube and the mycelial DNA of each fungus was extracted using a Genomic DNA Kit (Sangon Biotech Co., Ltd., Shanghai, China) according to the manufacturer’s instructions. The extracted DNA was used as DNA template in q-LAMP analyses and stored at −20 °C. For spore DNA template preparation, after growing on PDA medium at 25 °C in darkness for 20 days, 5 mm diameter mycelial plugs taken from colony margin were placed into the potato sucrose (PS, prepared by 200 g potato and 20 g sucrose per 1 L pure water) medium at 25 °C 150 rpm, in darkness for 7 days. Spores were separated from medium with filtration through four layers of lens tissue and washed twice with distilled water. Then, spores were diluted with 10% sodium dodecylsulfate (SDS) solution into a series of concentration gradients. An amount of 1-mL spore suspension sample of known concentration mixed with 200-μL 10% Chelex-100 solution [
20], 50-μL 10% SDS solution and 0.4 g acid-washed glass beads was placed into a 2.0-mL centrifuge tube. The sample was lysed by Fast Prep Apparatus (JXFSTPRP-24L, **gxin Technology, Shanghai, China) for 40 s at speed of 6 m/s and placed in boiling water bath for 5 min. The grinding and heating steps were repeated three times, after which the sample was placed on ice for 2 min. The cooled lysate was used directly as DNA template in q-PCR and q-LAMP analyses and stored at −20 °C.
4.3. Design of q-LAMP Primers for U. virens Detection
Ustiloxin A and Ustiloxin B of
U. virens are synthesized by ustiloxins biosynthetic gene that was found to be species-specific to
U. virens [
13,
41]. Thus, the sequence of ustiloxins biosynthetic gene (NCBI accession number: BR001221.1) was chosen for q-LAMP primer design using Primer Explore V5 (online web service,
http://primerexplorer.jp/e/) ensuring the specificity and accuracy of q-LAMP assay system for
U. virens detection. The q-LAMP primers contain forward inner primer (FIP), backward inner primer (BIP), and two outer (F3 and B3) primers (
Supplementary Figure S2). The primers were designed according to the following rules: ΔG values of less than or equal to −4 Kcal/mol at the 3′end of F3/B3 and F2/B2 and 5′ends of F1c and B1c.
4.4. Determination of Optimum Condition of the q-LAMP Assay
To better facilitate the efficiency of q-LAMP reaction, the LAMP reaction system was improved via screening for the optimal reaction temperature based on a reference from Notomi [
42]. The LAMP reaction was carried out in the following reaction mixtures containing 0.25 μM·L
−1 of the primers, FIP and BIP; 0.2 μM·L
−1 of the primers, F3 and B3; 1.0 mM·L
−1 betaine; 2.0 mM·L
−1 dNTPs (Takara Bio Inc., 108, San Jose, CA, USA); 25 mM·L
−1 Tris-HCl (pH 8.8); 12.5 mM·L
−1 KCl, 12.5 mM·L
−1 (NH
4)
2SO
4; 10 mM·L
−1 MgCl
2; 0.125% (
v/
v) Triton X-100; 0.2 U·L
−1 of Bst DNA polymerase (New England Biolabs, 110, Bei**g, China); 0.5 μL 1 × SYBR Green I; and 1 μL of DNA template extracted as described above, and the volume was adjusted to 25 μL with nucleic-acid-free water. The screened reaction temperature gradients were 61.8 °C, 62.1 °C, 62.6 °C, 63.4 °C, 64.4 °C, 65.2 °C, 65.6 °C, and 66 °C. LAMP reactions were performed using a Bio-Rad quantitative fluorescent PCR instrument (Bio-Rad CFX96, Hercules, CA, USA) for 80 cycles each, each cycle for 60 s, and the reaction was terminated at 80 °C for 10 min. Optimal reaction temperature screening experiments were repeated three times.
4.5. Validation of the Specificity for q-LAMP Assay Systems
The specificity of the reaction system was tested by performing q-LAMP reactions at the optimal reaction temperature with UV-2 primers in above 25-μL reaction mixtures for 70 min. The assay results were compared with the DNA of
U. virens and the 9 other fungi listed in
Table 4. The nucleic acid-free water was set as negative control. Additionally, the DNA template of
U. virens and the 9 other fungi were prepared as descripted in 4.2 mycelial DNA template preparation. The extracted DNA of
U. virens and the 9 other fungi were stored at −20 °C and their concentration were more than 150 μg·mL
−1. The results were rigorously validated with the assessment that the detectable peak of fluorescence signals detected by Bio-Rad CFX96 as positive; no fluorescence signal as negative. The specificity testing experiment was repeated three times.
4.6. Sensitivity Validation of q-LAMP and q-PCR Assay Systems
The sensitivity validation of q-LAMP reactions was performed at the optimal reaction temperature with UV-2 primers in reaction mixtures above 25-μL for 60 min. An amount of 1 μL of DNA lysate from U. virens spores of known concentration was used as a DNA template in the LAMP reaction system. The nucleic-acid-free water was used as a DNA template in the negative control (CK). The detectable peak of fluorescence signals detected by Bio-Rad CFX96 was regarded as positive, while no fluorescence signal was regarded as negative. Sensitivity assay experiments were repeated three times. The sensitivity of the q-PCR reaction system was assayed via performing q-PCR amplification using primers, UV-2 F3/B3. The q-PCR reaction system was 12.5 μL SYBR® Premix Ex Taq II (Tli RNaseH Plus, 2×), 1.0 μL of forward primer F3 (10 μM), 1.0 μL of reverse primer B3 (10.0 μM), 1.0 μL DNA template (in CK, nucleic-acid-free water was used as DNA template), and the volume was adjusted to 25 μL with nucleic-acid-free water. The reaction conditions were: pre-denaturation at 95 °C for 2 min, denaturation at 95 °C for 5 s, annealing at 60 °C for 30 s, extension at 72 °C for 6 s. The fluorescence signal was collected during the extension for a total of 40 cycles, and finally the amplification curve was plotted. The detectable peak of fluorescence signals detected by Bio-Rad CFX96 was regarded as positive, while no fluorescence signal was regarded as negative. Sensitivity assay experiments were repeated three times.
4.7. Establishment of Standard Curves for q-LAMP Assay Systems
A standard curve was constructed using software SPSS 13.0 by analyzing the association of logarithmic values of the spore number (y) and the amplification time quantitated using the cycle threshold (Ct) values (x). The correlation coefficient R2 was used for assessing the linear relationship between the spore number in sample (y) and amplification time (x). The experiments were repeated three times.
4.8. Calculating of U. virens Spore Using q-LAMP System
Spores of U. virens were artificially added to each of the four Melinex tape (1 cm × 2 cm) in the ultra-clean bench, with 450, 116, 29 and 9 spores in each tape. The collected spore-adsorbed Melinex tape was cut and placed in 2-mL centrifuge tubes, and the genomic DNA of the spores on the Melinex tape was then extracted according to the method mentioned above. An amount of 1 μL of the cooled lysate was used directly as DNA template. q-LAMP assay was performed with the optimal reaction conditions in reaction mixtures above 25-μL for 60 min, and the time quantitated using the cycle threshold (Ct) values detected by Bio-Rad CFX96 was recorded as the amplification time (x). The linearized equation for the standard curve was used for converting the amplification time to the corresponding spore number. Then, the calculated spore number was compared to the amount of actual added (listed above) to test the accuracy efficiency of this q-LAMP system.
4.9. Field Application of q-LAMP Assay by U. virens
An air borne spore catcher (DIANJIANG, DJ-0723) with Melinex tape was established in Yongyou 1540 cultivation area, Jiangtang Village, **hua City, Zhejiang Province for the collection of spores of U. virens, and samples were collected at six-day intervals for 11 consecutive times, starting on the 9th of August 2018. Similarly, starting on the 13th of August of the following year (2019), 11 consecutive samples were collected every six days. The spores of U. virens were adsorbed on the Melinex tape and the tapes (1 cm × 1 cm) with spores were cut and placed in a 2-mL centrifuge tube, and the conidial DNA was extracted according to the methods mentioned above. An amount of 1 μL of the cooled lysate was used directly as DNA template. q-LAMP assay was performed with the optimal reaction conditions in the reaction mixtures above 25-μL for 60 min, and the amplification time quantitated using the cycle threshold (Ct) values was recorded. According to the established standard curve, the number of spores was calculated. The spore population of U. virens in the Melinex tape was recorded via q-LAMP assay at six-day intervals. Meanwhile, the spores of U. virens (1 cm × 1 cm) adsorbed on the slide were suspended in 1 mL of ddH2O, and the spore suspension was counted using a hemocytometer under the microscope to determine the spore concentration. There were three spore catchers placed at the collection site, and the data collected by each instrument were used as a repetition.


