Micro-Droplet Detection Method for Measuring the Concentration of Alkaline Phosphatase-Labeled Nanoparticles in Fluorescence Microscopy


Abstract
:1. Introduction
2. Methods
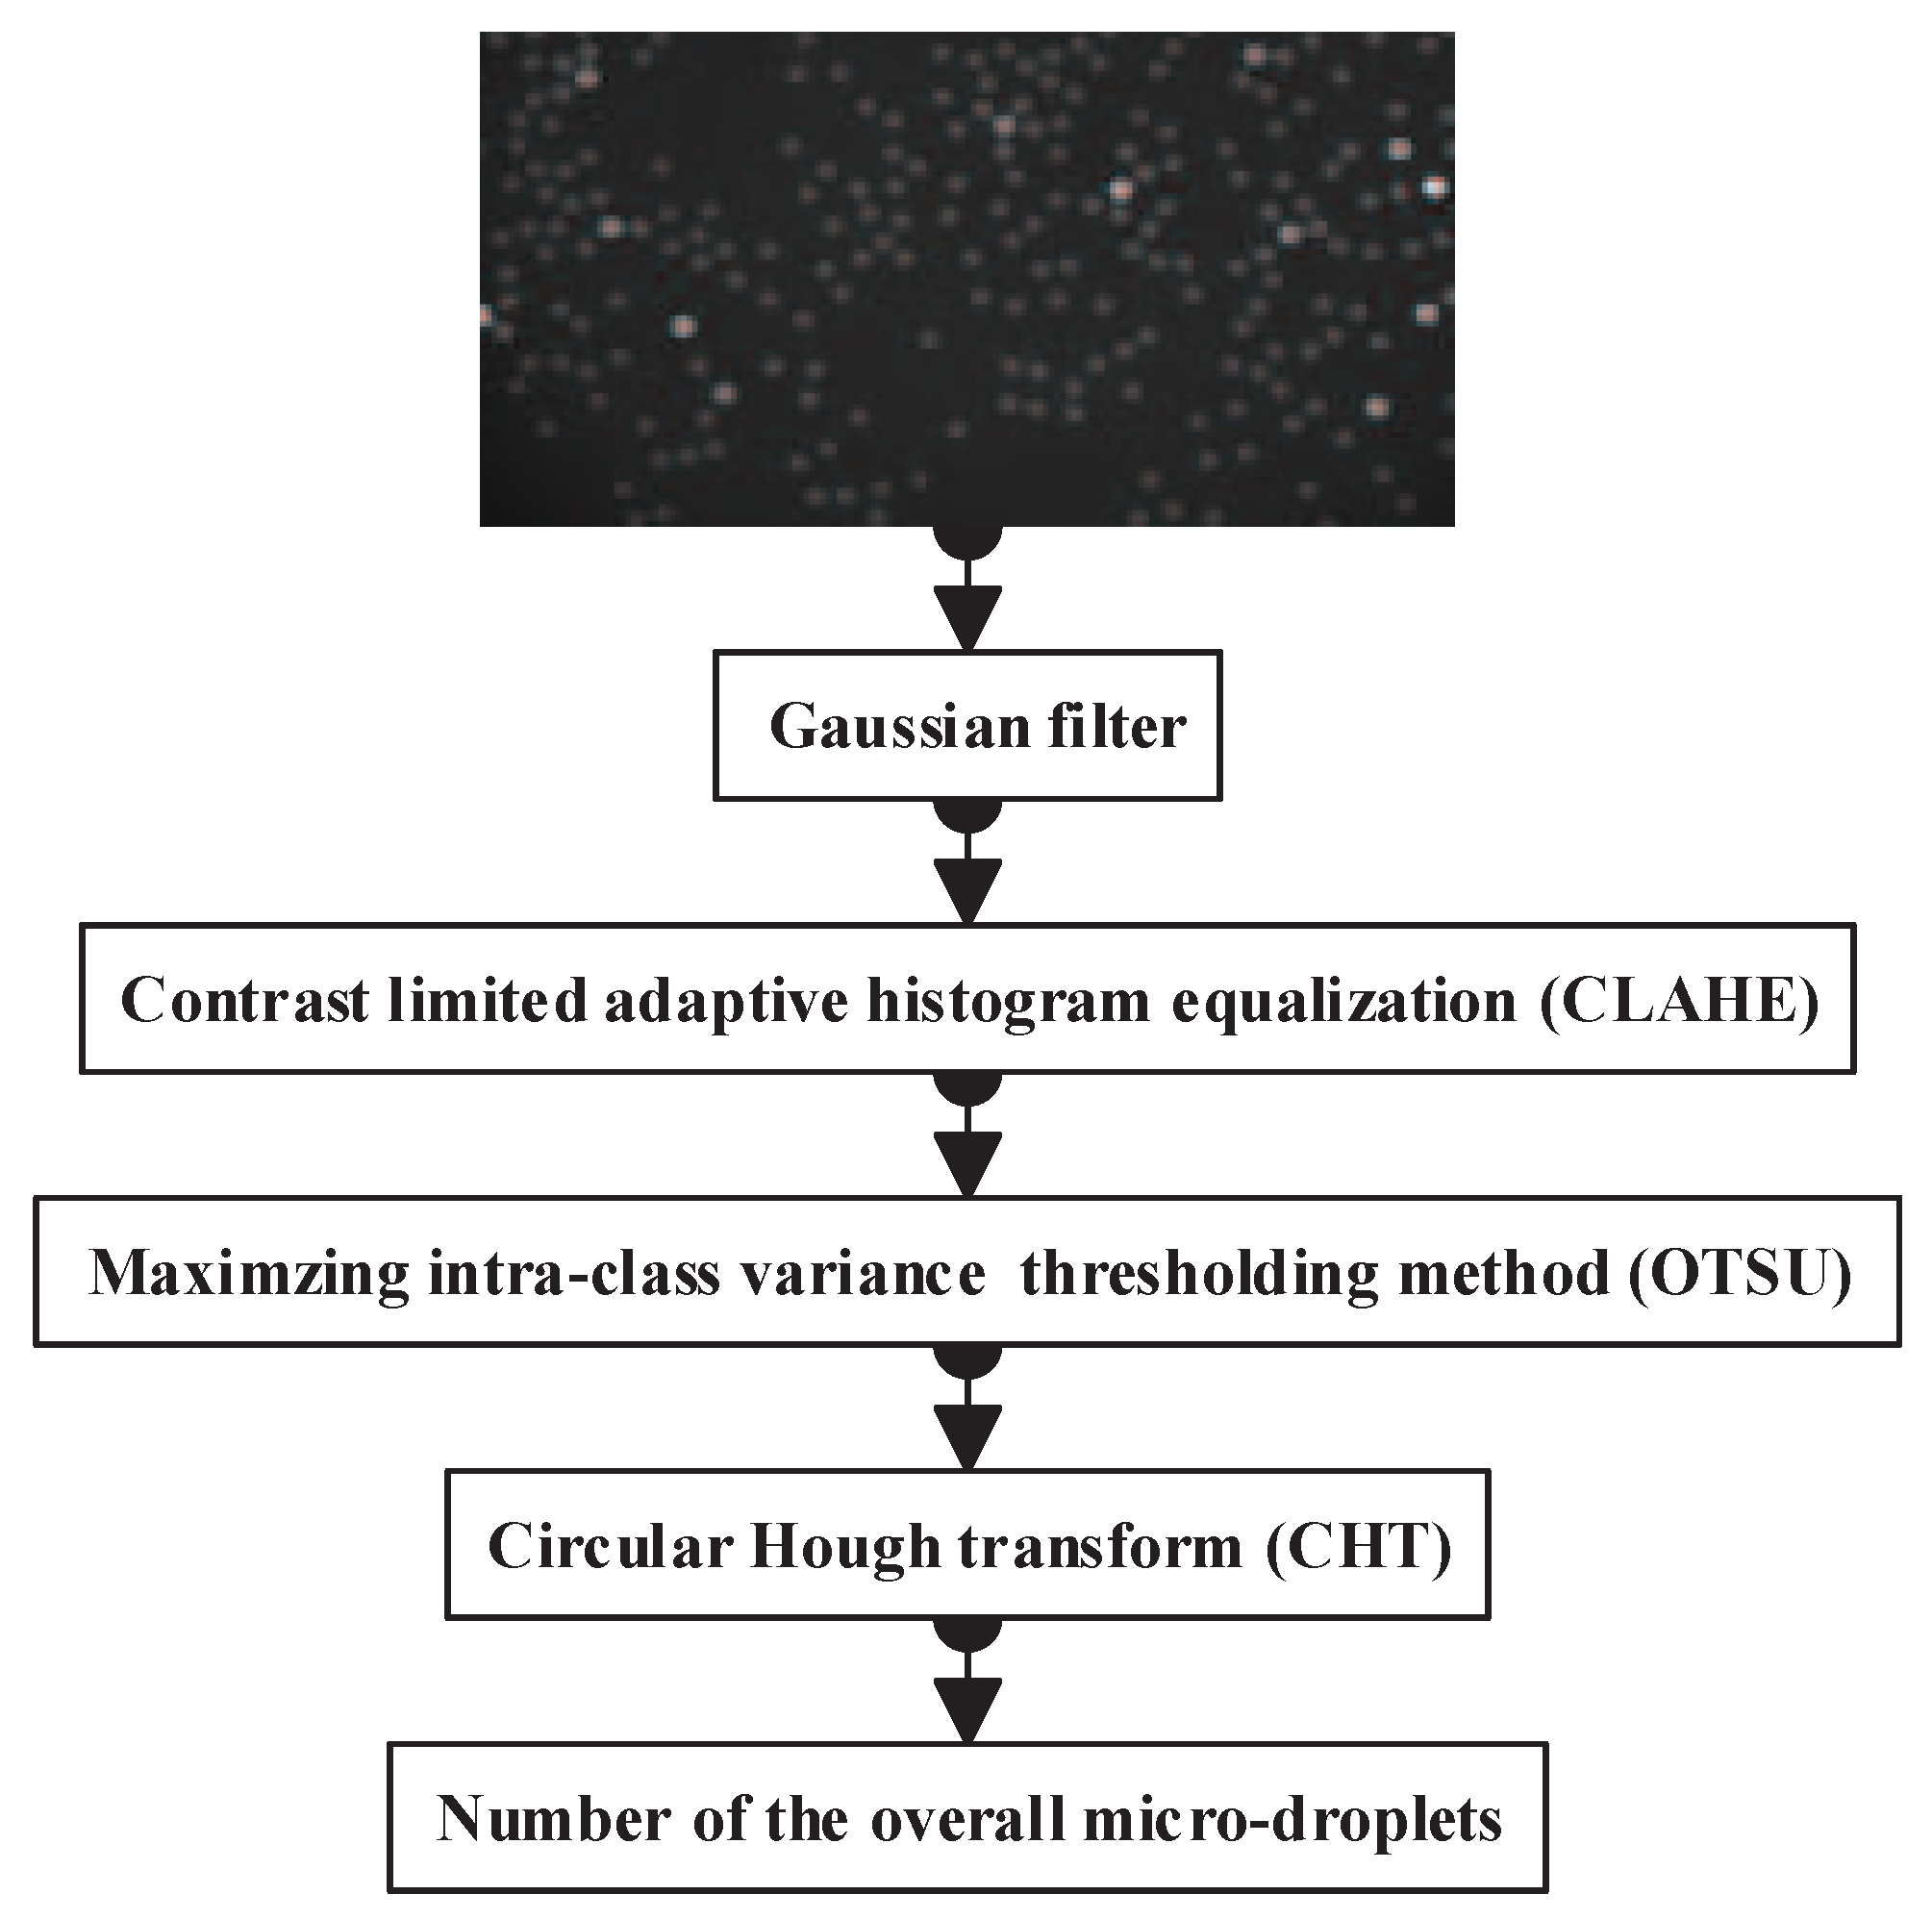
2.1. Overall Micro-Droplet Detection
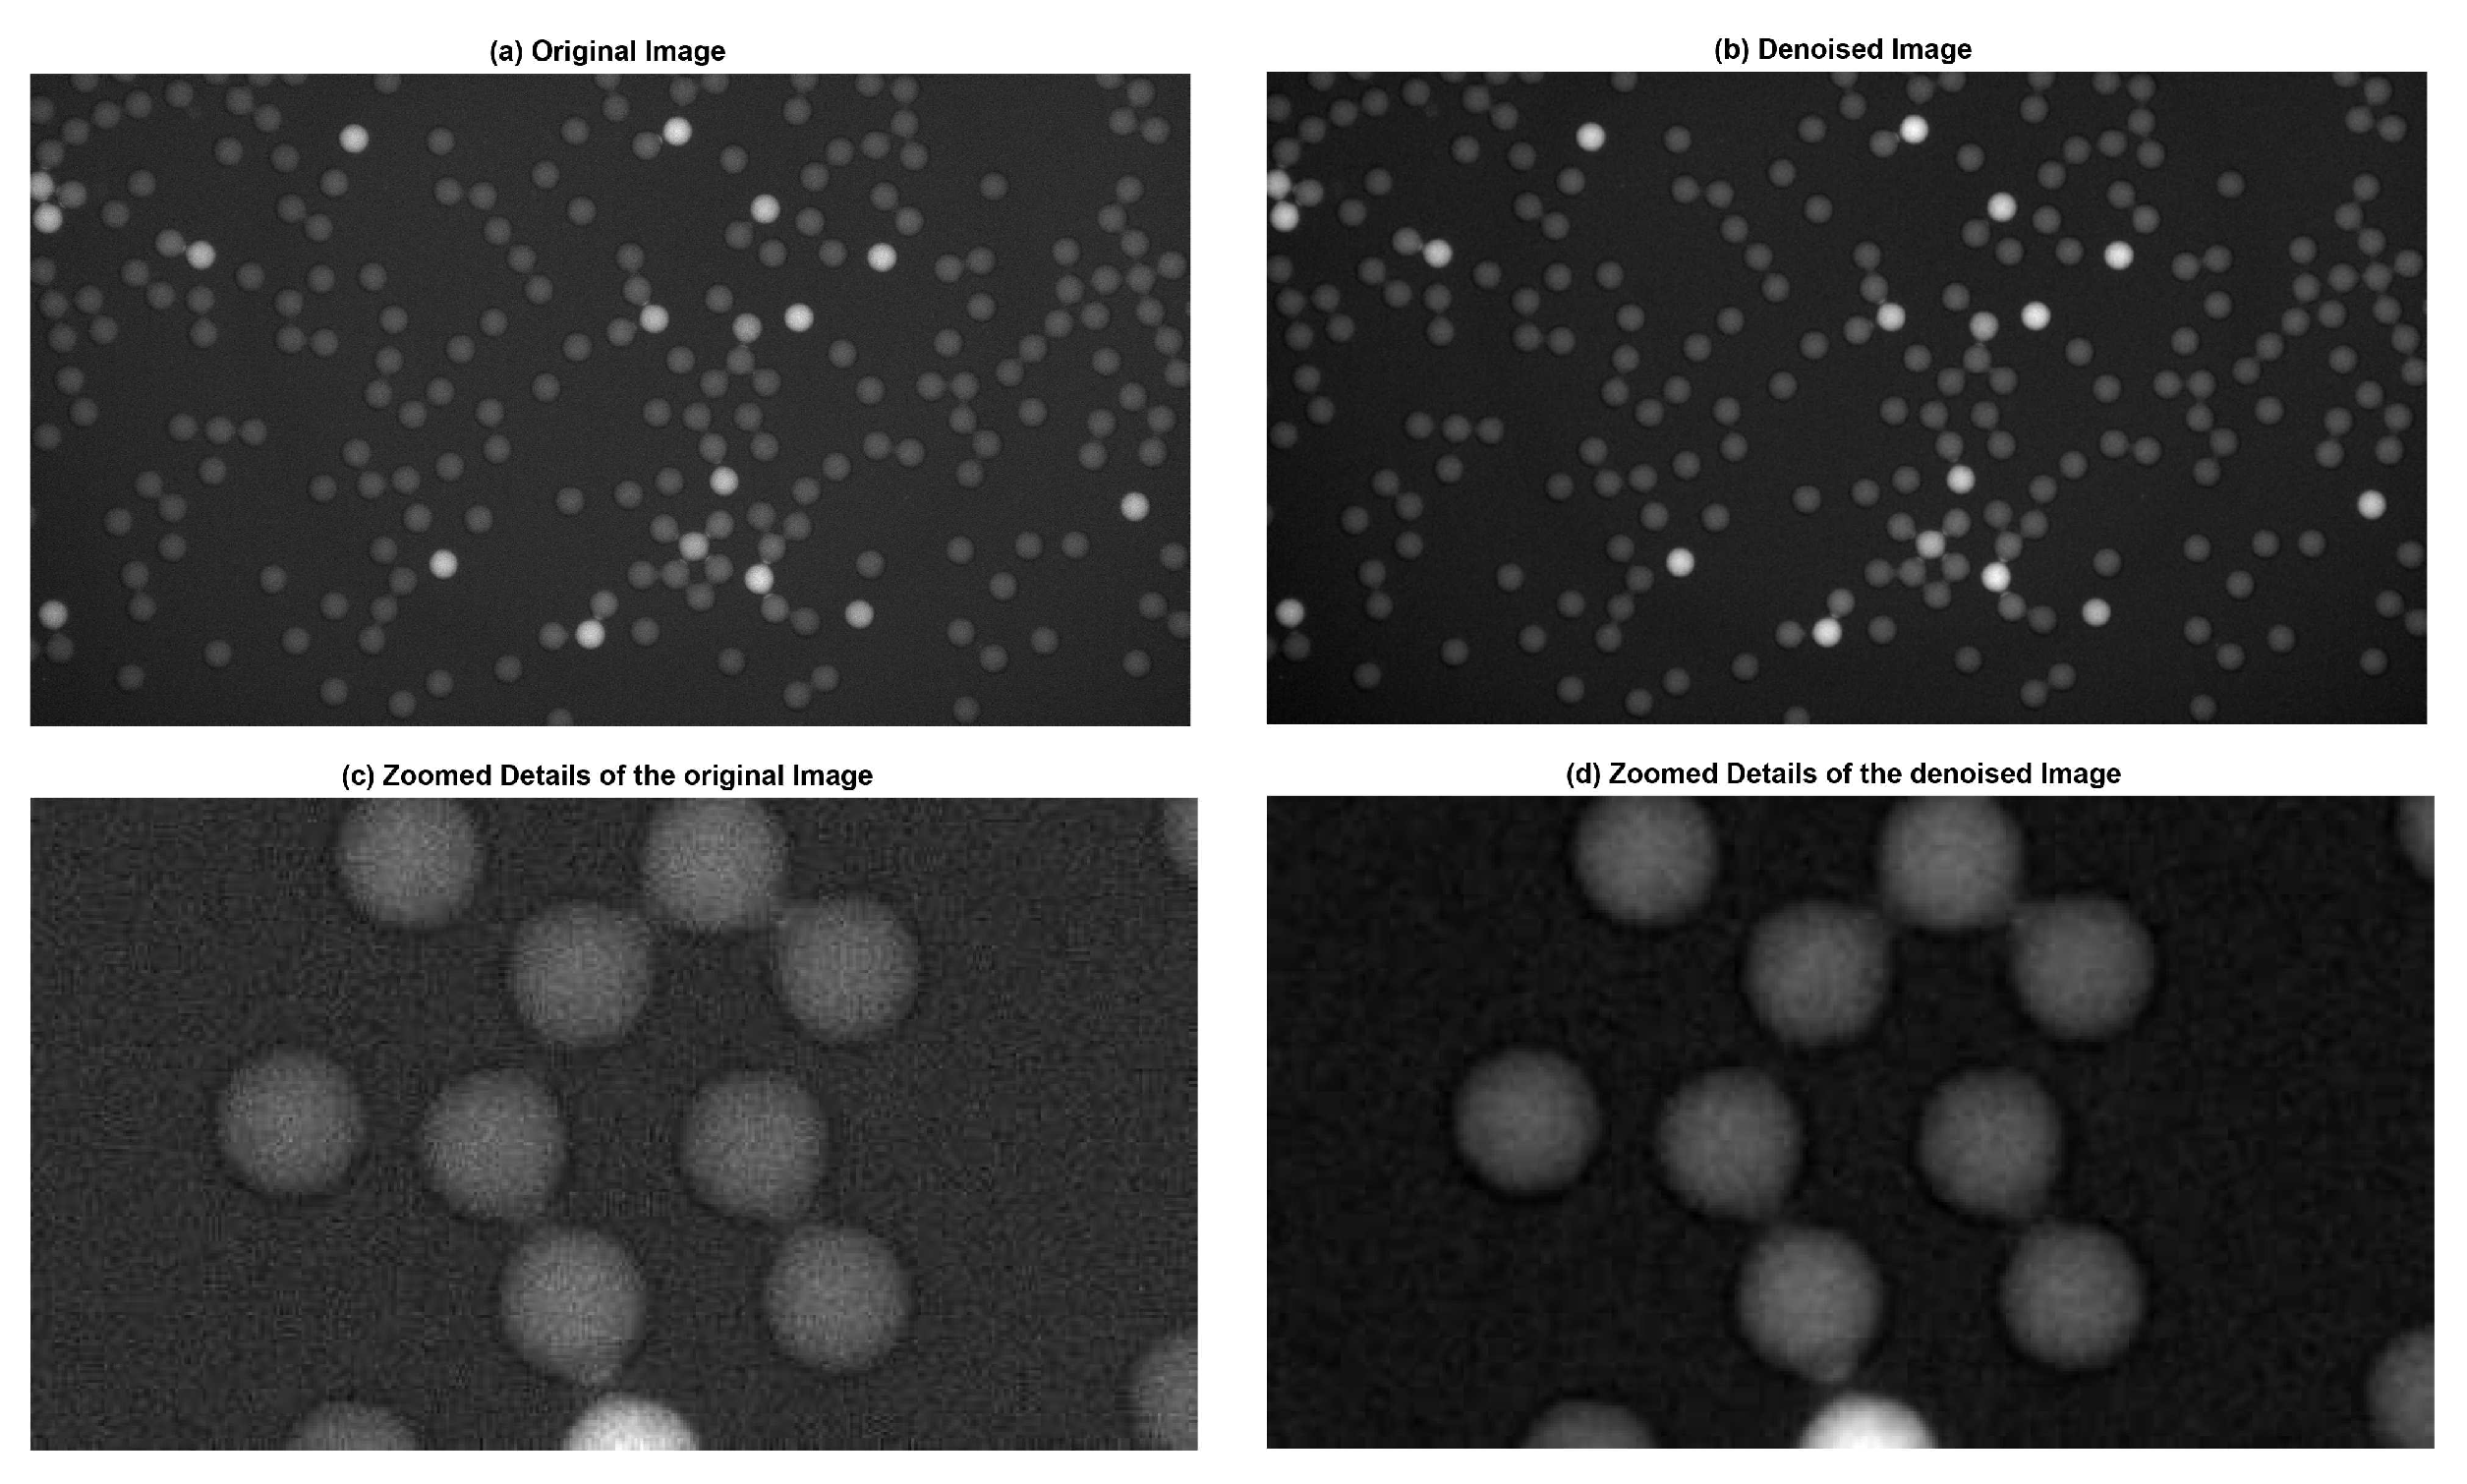
2.1.1. Noise Reduction with the Gaussian Filter
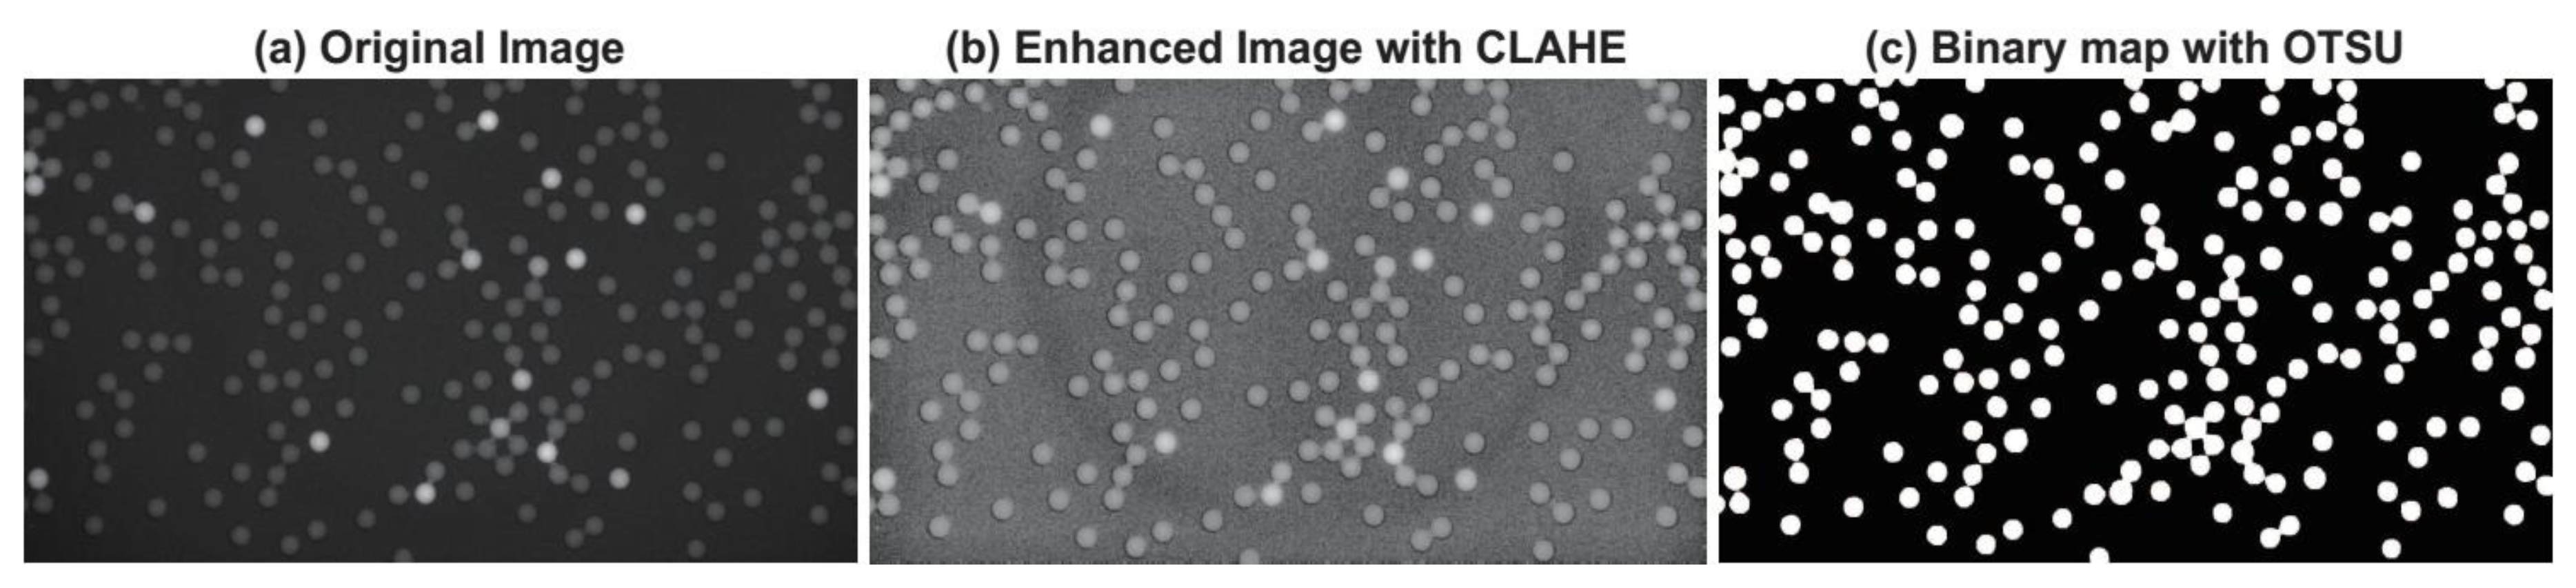
2.1.2. Contrast Limited Adaptive Histogram Equalization
2.1.3. Maximizing inter-class Variance Thresholding Method
2.1.4. Circle Detection via Circular Hough Transform
- Accumulator array computation:The edge detection is carried out on the binary map to get an edge image (L). The edge pixels of L are designated as candidate pixels and are allowed to cast ‘votes’ in the accumulator array A(a), which represents the weight of the circle with a fixed radius and the center of the circle. Here, . (a, b) represents the space location of pixels, and r is the radius of the expected circle. At the beginning, all the elements of A(a) are set to 0.
- Center and radius estimation:For every pixel x of the fluorescence image, we accumulate all the units of A(a) that satisfy the function . is the analytical expression of circle:Finally, the circular centers and radii are estimated by detecting the peaks in the accumulator array. We can get the number of micro-droplets by counting the centers of detected circles.
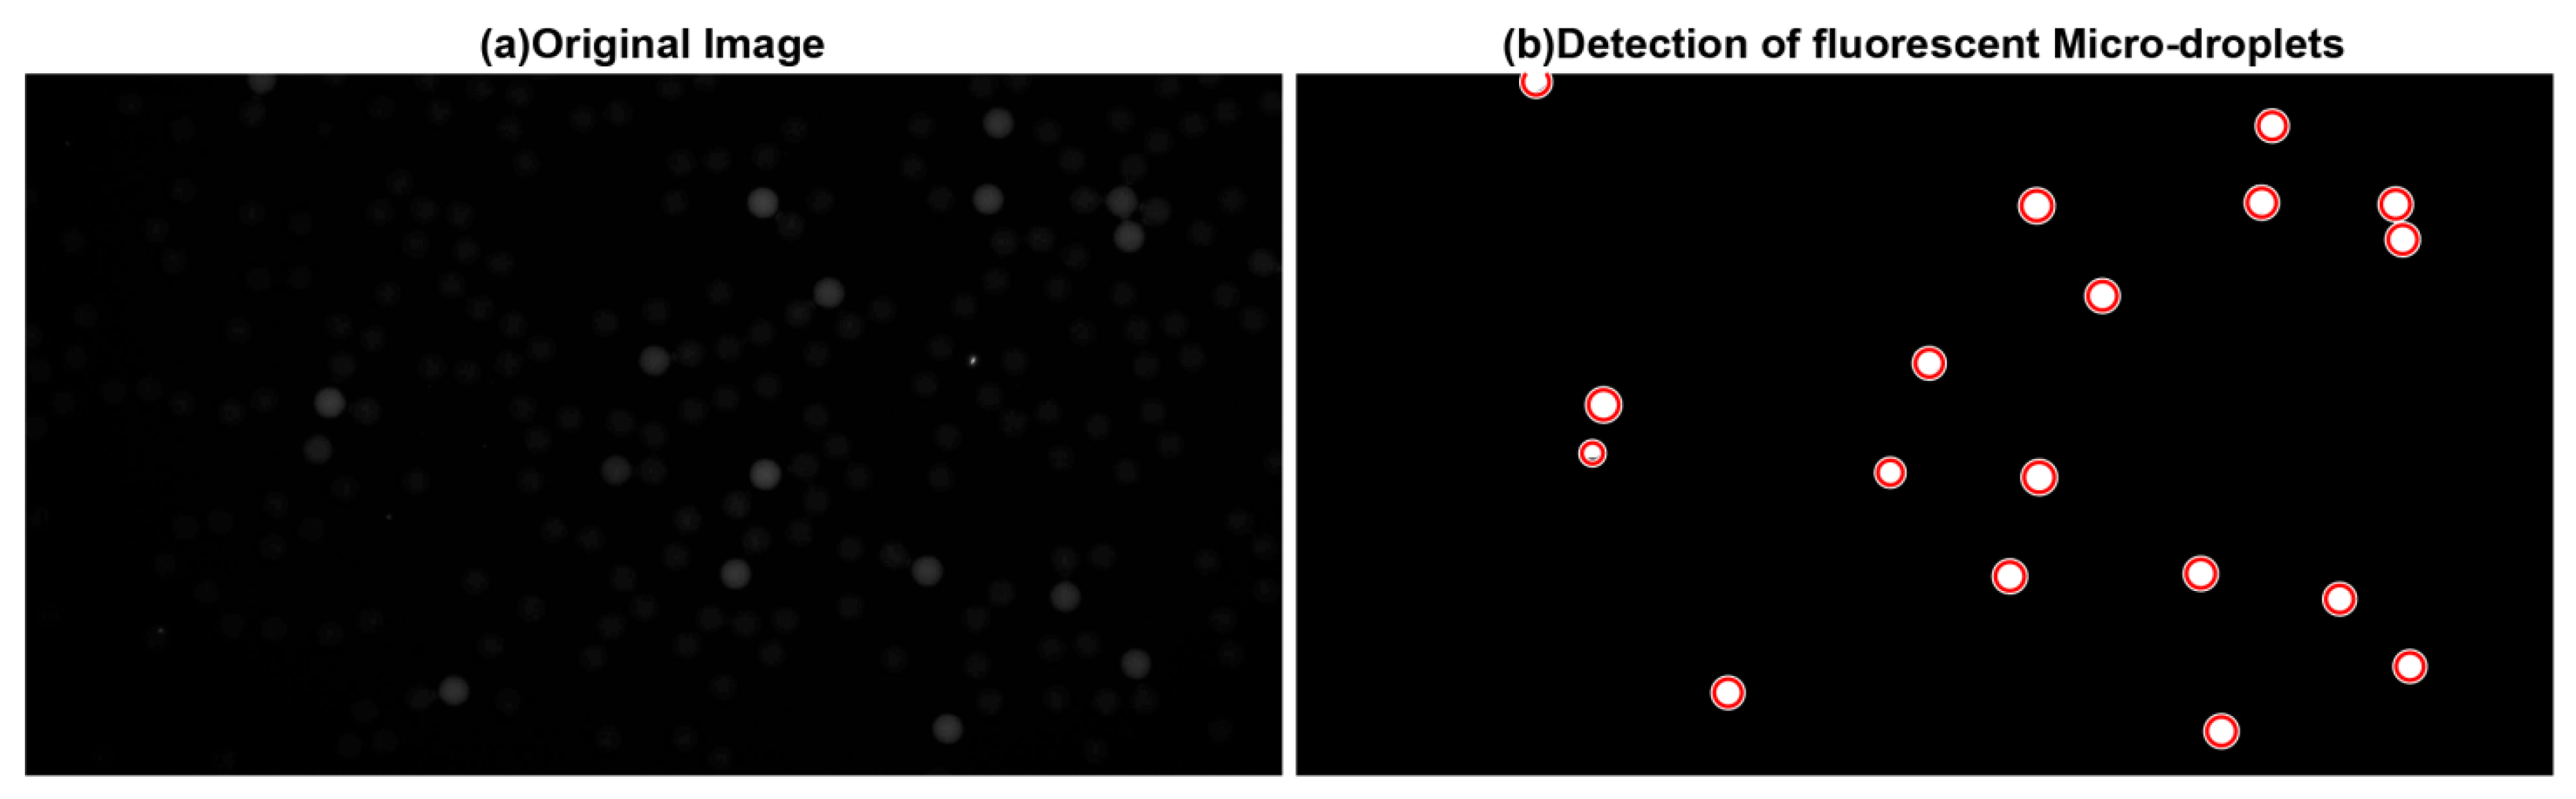
2.2. Fluorescent Micro-Droplet Detection
2.3. Measurement of AP-Labeled Nanoparticle Concentration
2.4. Evaluation
2.5. Code
3. Results
3.1. Overall Micro-Droplet Detection
3.1.1. Visual Evaluation
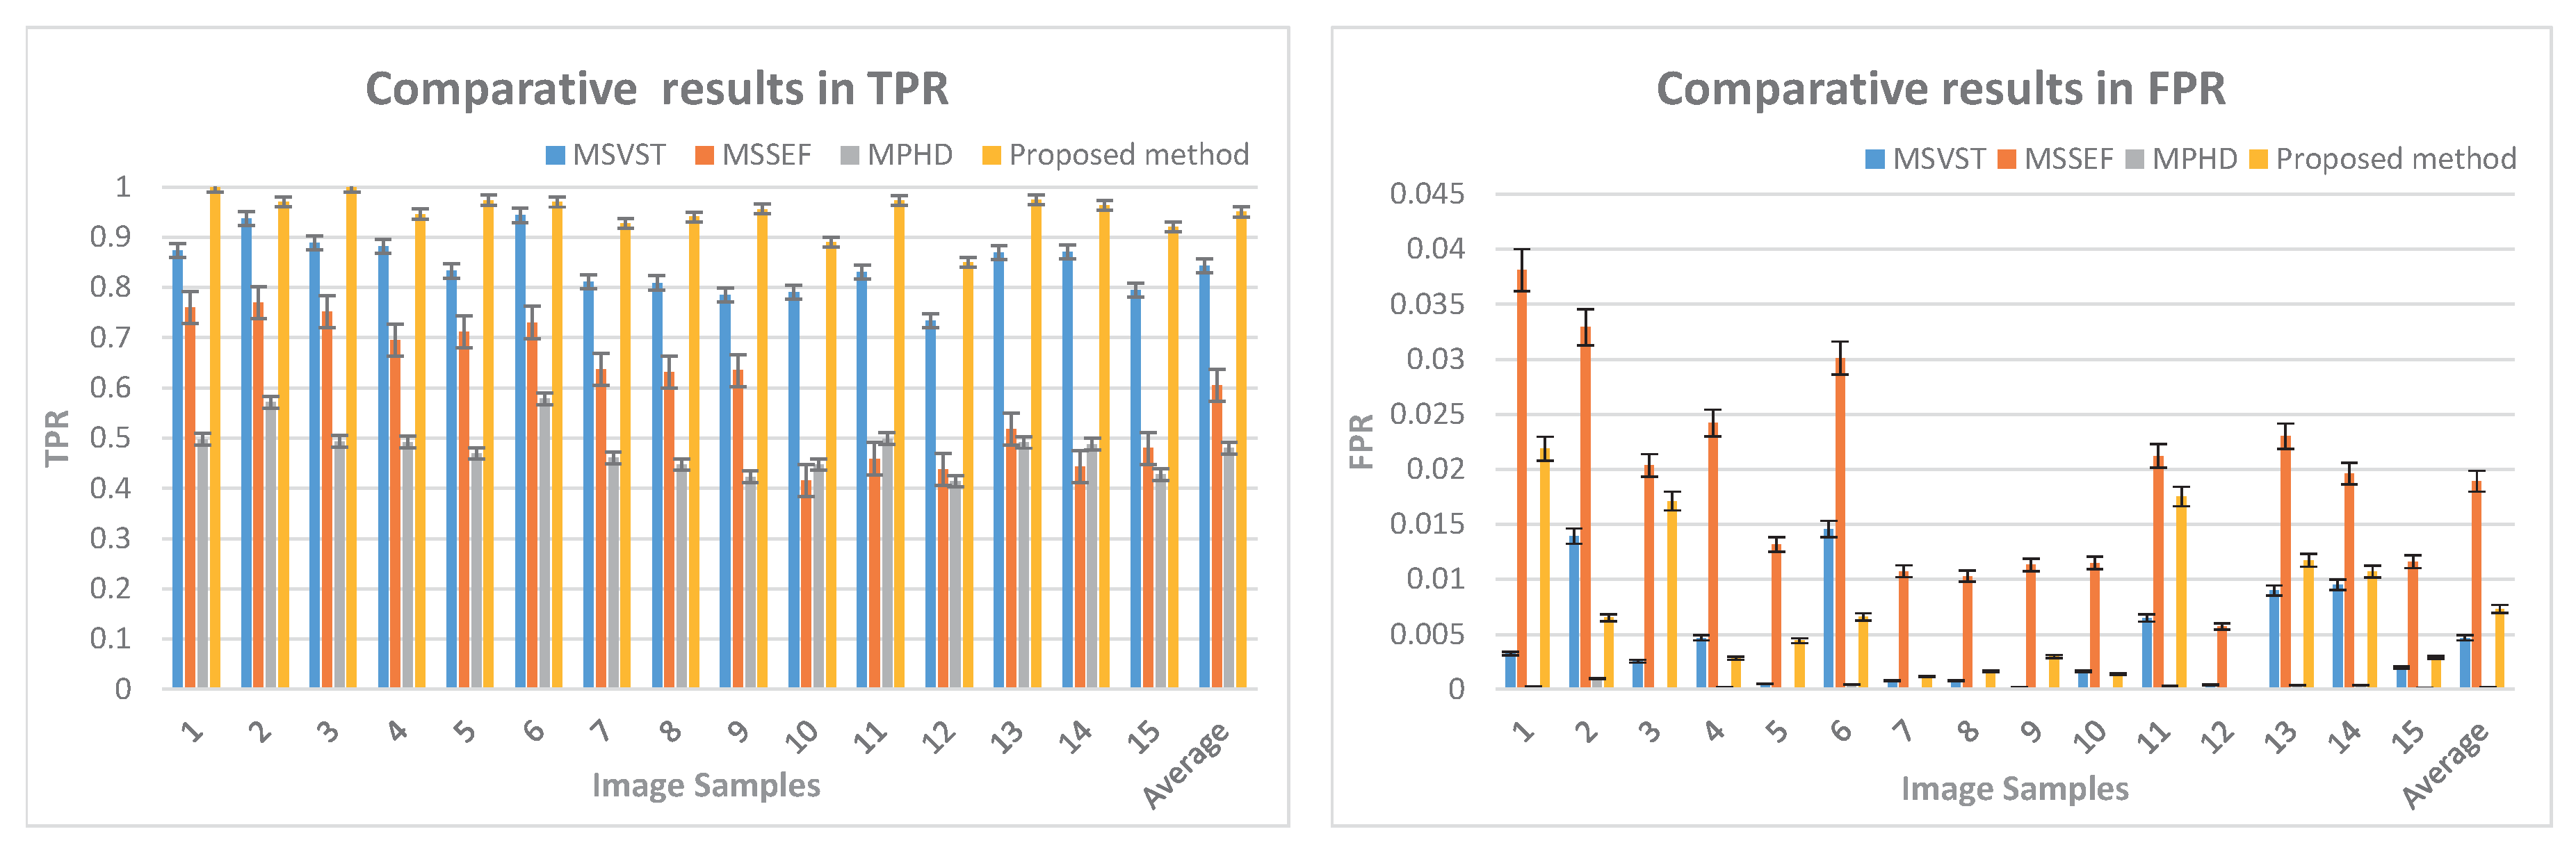
3.1.2. TPR and FPR
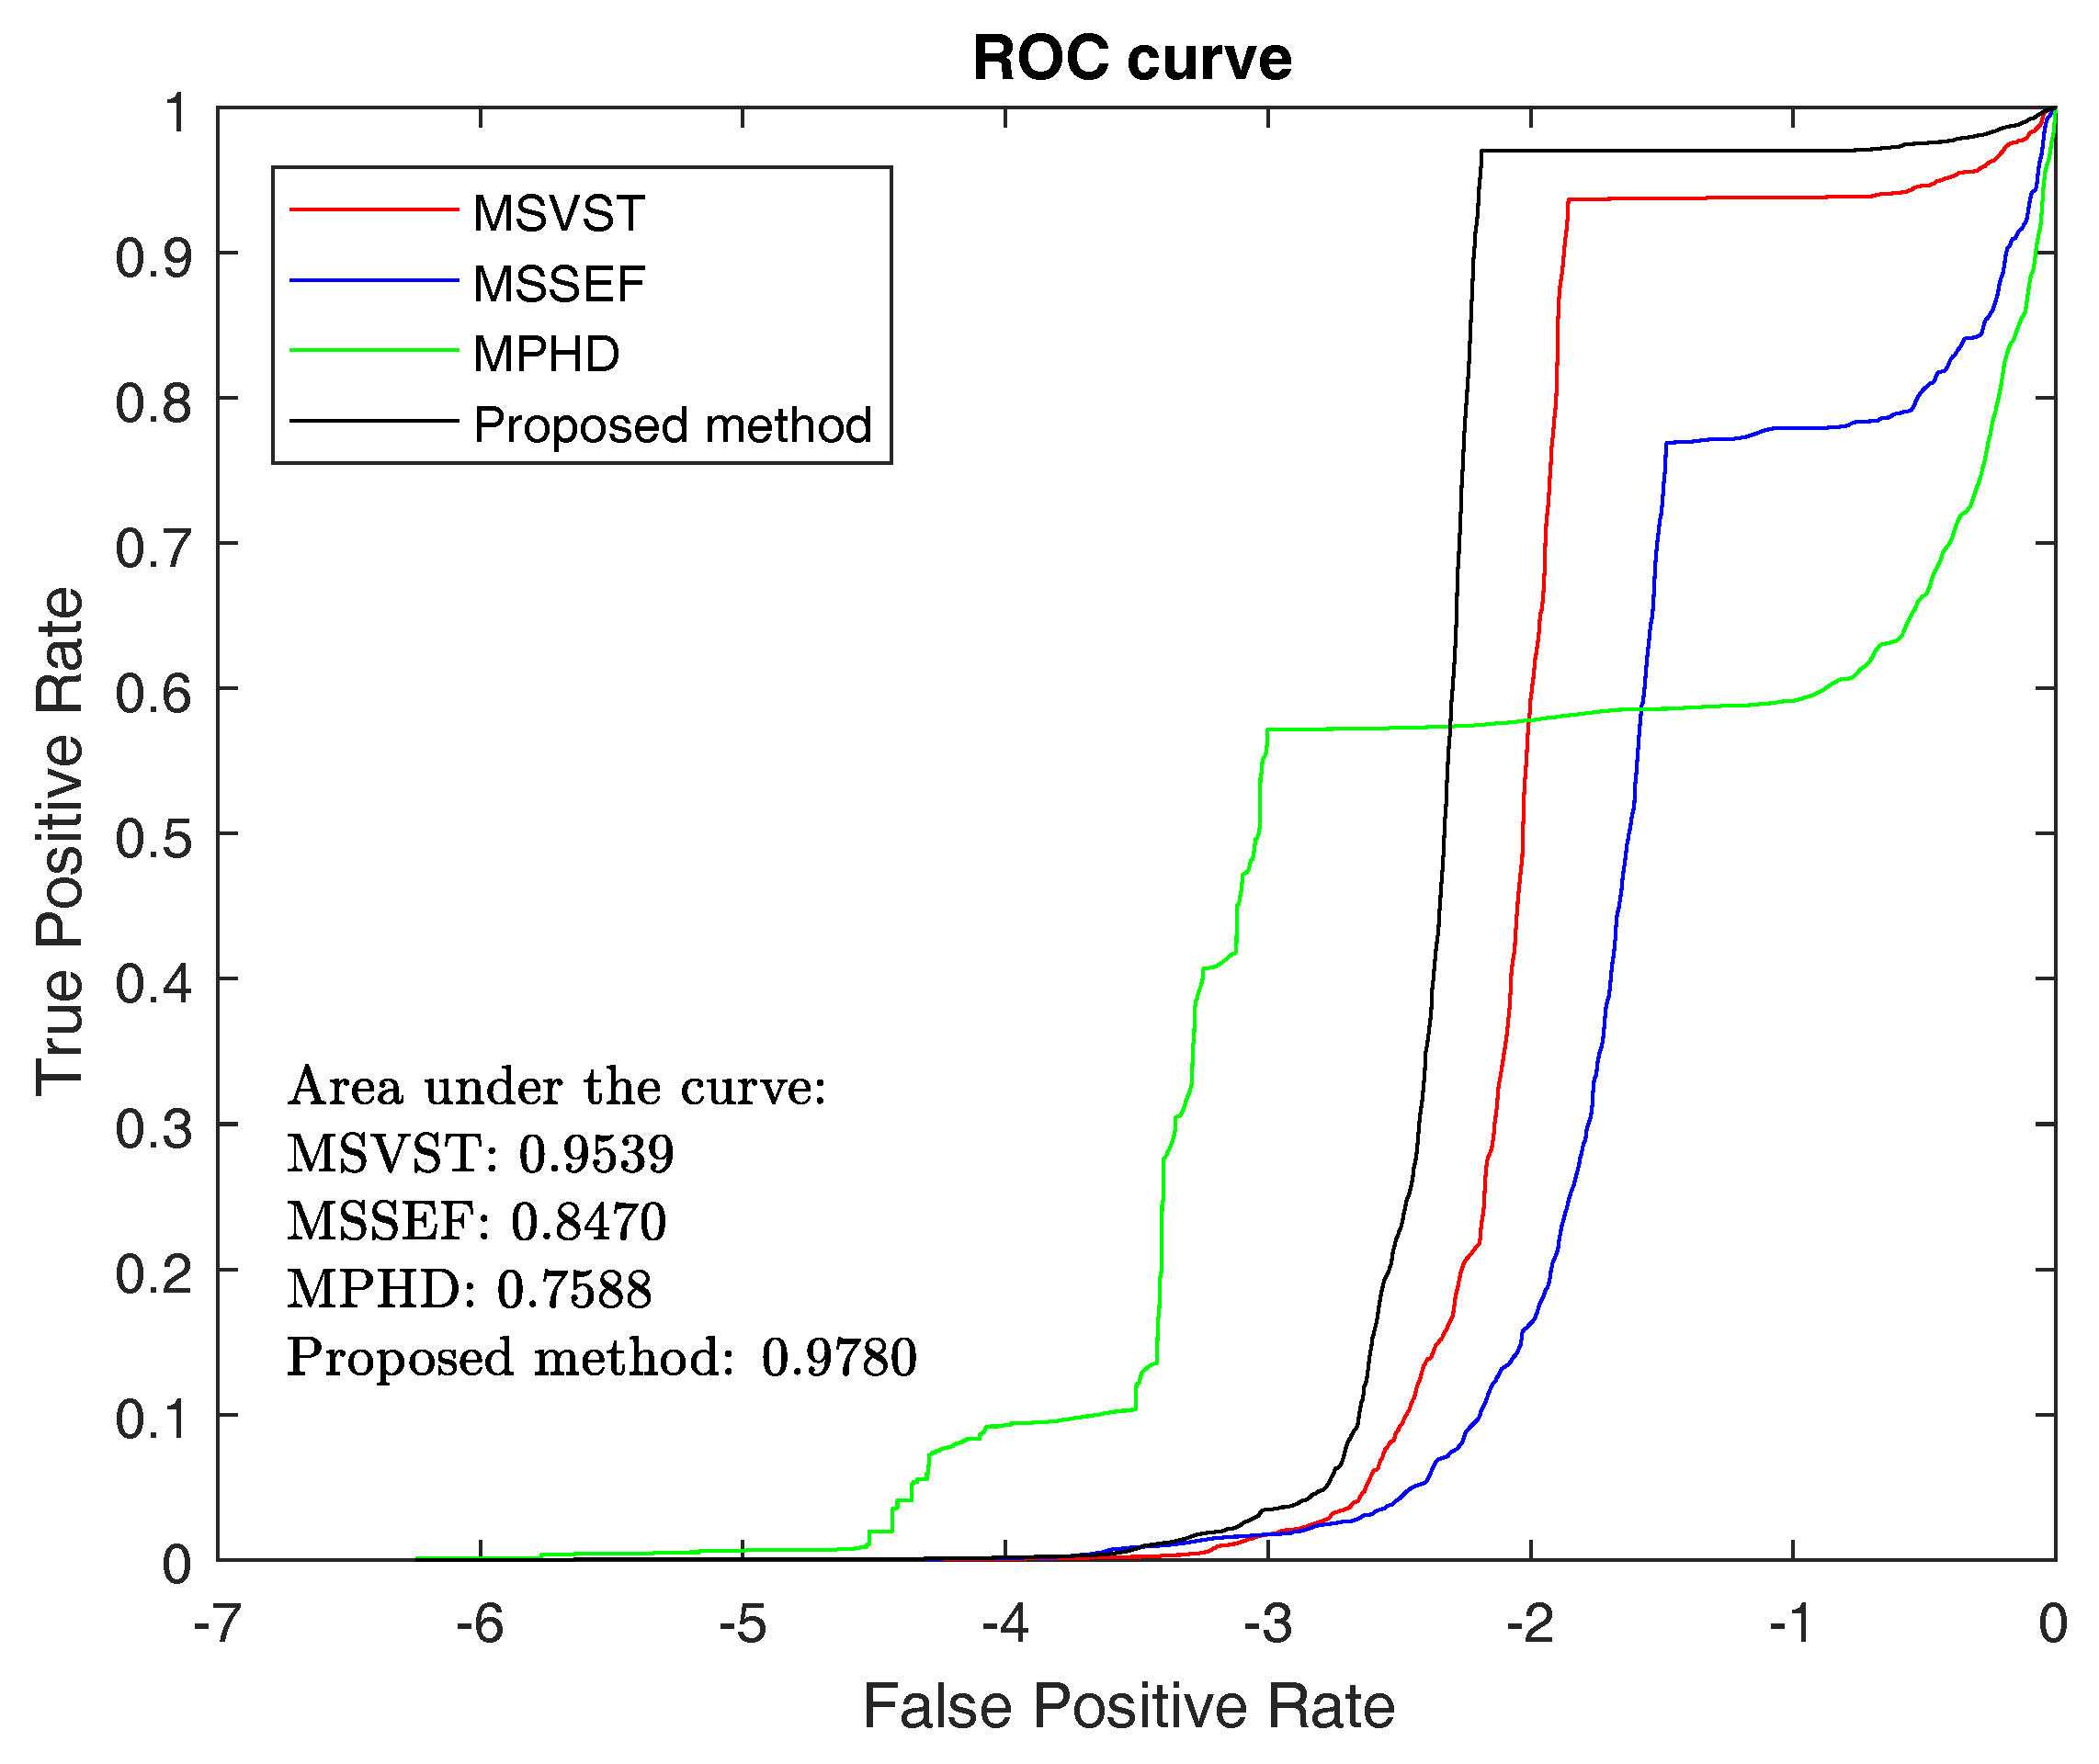
3.1.3. ROC and F-Measure
3.1.4. Detected Number of Overall Micro-Droplets
3.2. Fluorescent Micro-Droplet Detection
3.3. AP-Labeled Nanoparticle Concentration Measurement
4. Discussion
5. Conclusions
Acknowledgments
Author Contributions
Conflicts of Interest
References
- Nketia, T.; Sailem, H.; Rohde, G.; Machiraju, R.; Rittscher, J. Analysis of live cell images: Methods, tools and opportunities. Methods 2017, 115, 65–79. [Google Scholar] [CrossRef] [PubMed]
- Specht, E.A.; Braselmann, E.; Palmer, A.E. A Critical and Comparative Review of Fluorescent Tools for Live-Cell Imaging. Annu. Rev. Physiol. 2017, 79, 93–117. [Google Scholar] [CrossRef] [PubMed]
- Qiang, Y.; Lee, J.Y.; Bartenschlager, R.; Rohr, K. Colocalization analysis and particle tracking in multi-channel fluorescence microscopy images. In Proceedings of the 2017 IEEE 14th International Symposium on Biomedical Imaging (ISBI 2017), Melbourne, Australia, 18–21 April 2017; pp. 646–649. [Google Scholar]
- Rissin, D.M.; Kan, C.W.; Campbell, T.G.; Howes, S.C.; Fournier, D.R.; Song, L.; Piech, T.; Patel, P.P.; Chang, L.; Rivnak, A.J.; et al. Single-molecule enzyme-linked immunosorbent assay detects serum proteins at subfemtomolar concentrations. Nat. Biotechnol. 2010, 28, 595–599. [Google Scholar] [CrossRef] [PubMed]
- Basova, E.Y.; Foret, F. Droplet microfluidics in (bio)chemical analysis. Analyst 2015, 140, 22–38. [Google Scholar] [CrossRef] [PubMed]
- Joensson, H.N.; Andersson Svahn, H. Droplet Microfluidics—A Tool for Single-Cell Analysis. Angew. Chem. Int. Ed. 2012, 51, 12176–12192. [Google Scholar] [CrossRef] [PubMed]
- Rissin, D.M.; Walt, D.R. Digital concentration readout of single enzyme molecules using femtoliter arrays and Poisson statistics. Nano Lett. 2006, 6, 520–523. [Google Scholar] [CrossRef] [PubMed]
- Thompson, R.E.; Larson, D.R.; Webb, W.W. Precise nanometer localization analysis for individual fluorescent probes. Biophys. J. 2002, 82, 2775–2783. [Google Scholar] [CrossRef]
- Kervrann, C.; Sorzano, C.O.S.; Acton, S.T.; Olivo-Marin, J.C.; Unser, M. A guided tour of selected image processing and analysis methods for fluorescence and electron microscopy. IEEE J. Sel. Top. Signal Process. 2016, 10, 6–30. [Google Scholar] [CrossRef]
- Wiesmann, V.; Franz, D.; Held, C.; Munzenmayer, C.; Palmisano, R.; Wittenberg, T. Review of free software tools for image analysis of fluorescence cell micrographs. J. Microsc. 2015, 257, 39–53. [Google Scholar] [CrossRef] [PubMed]
- Arena, E.T.; Rueden, C.T.; Hiner, M.C.; Wang, S.; Yuan, M.; Eliceiri, K.W. Quantitating the cell: Turning images into numbers with ImageJ. Wiley Interdiscip. Rev.: Dev. Biol. 2017, 6. [Google Scholar] [CrossRef] [PubMed]
- Smal, I.; Loog, M.; Niessen, W.; Meijering, E. Quantitative comparison of spot detection methods in fluorescence microscopy. IEEE Trans. Med. Imaging 2010, 29, 282–301. [Google Scholar] [CrossRef] [PubMed]
- Zhang, B.; Fadili, M.J.; Starck, J.L.; Olivo-Marin, J.C. Multiscale variance-stabilizing transform for mixed-Poisson-Gaussian processes and its applications in bioimaging. In Proceedings of the 2007 14th IEEE International Conference on Image Processing (ICIP 2007), San Antonio, TX, USA, 16–19 September 2007; Volume 6, p. VI-233. [Google Scholar]
- Smal, I.; Niessen, W.; Meijering, E. A new detection scheme for multiple object tracking in fluorescence microscopy by joint probabilistic data association filtering. In Proceedings of the 2008 5th IEEE International Symposium on Biomedical Imaging: From Nano to Macro (ISBI 2008), Paris, France, 14–17 May 2008; pp. 264–267. [Google Scholar]
- Mallat, S.G. A theory for multiresolution signal decomposition: The wavelet representation. IEEE Trans. Pattern Anal. Mach. Intell. 1989, 11, 674–693. [Google Scholar] [CrossRef]
- Rezatofighi, S.H.; Hartley, R.; Hughes, W.E. A new approach for spot detection in total internal reflection fluorescence microscopy. In Proceedings of the 2012 9th IEEE International Symposium on Biomedical Imaging (ISBI 2012), Barcelona, Spain, 2–5 May 2012; pp. 860–863. [Google Scholar]
- Jaiswal, A.; Godinez, W.J.; Eils, R.; Lehmann, M.J.; Rohr, K. Tracking virus particles in fluorescence microscopy images using multi-scale detection and multi-frame association. IEEE Trans. Image Process. 2015, 24, 4122–4136. [Google Scholar] [CrossRef] [PubMed]
- Basset, A.; Boulanger, J.; Bouthemy, P.; Kervrann, C.; Salamero, J. SLT-LoG: A vesicle segmentation method with automatic scale selection and local thresholding applied to TIRF microscopy. In Proceedings of the 2014 IEEE 11th International Symposium on Biomedical Imaging(ISBI), Bei**g, China, 29 April–2 May 2014; pp. 533–536. [Google Scholar]
- Basset, A.; Boulanger, J.; Salamero, J.; Bouthemy, P.; Kervrann, C. Adaptive spot detection with optimal scale selection in fluorescence microscopy images. IEEE Trans. Image Process. 2015, 24, 4512–4527. [Google Scholar] [CrossRef] [PubMed]
- Acosta, B.M.T.; Basset, A.; Bouthemy, P.; Kervrann, C. Multi-scale spot segmentation with selection of image scales. In Proceedings of the 2017 IEEE International Conference on Acoustics, Speech and Signal Processing (ICASSP), New Orleans, LA, USA, 5–9 March 2017; pp. 1912–1916. [Google Scholar]
- Traore, D.; Rietdorf, K.; Al-Jawad, N.; Al-Assam, H. Automatic Hotspots Detection for Intracellular Calcium Analysis in Fluorescence Microscopic Videos. In Annual Conference on Medical Image Understanding and Analysis; Springer: Cham, The Netherlands, 2017; pp. 862–873. [Google Scholar]
- Zuiderveld, K. Contrast limited adaptive histogram equalization. In Graphics Gems IV; Academic Press Professional, Inc.: New York, NY, USA, 1994; pp. 474–485. [Google Scholar]
- Otsu, N. A threshold selection method from gray-level histograms. IEEE Trans. Syst. Man Cybern. 1979, 9, 62–66. [Google Scholar] [CrossRef]
- Ghaye, J.; Kamat, M.A.; Corbino-Giunta, L.; Silacci, P.; Vergeres, G.; Micheli, G.; Carrara, S. Image thresholding techniques for localization of sub-resolution fluorescent biomarkers. Cytom. Part A 2013, 83, 1001–1016. [Google Scholar] [CrossRef] [PubMed]
- Bartell, L.R.; Bonassar, L.J.; Cohen, I. A watershed-based algorithm to segment and classify cells in fluorescence microscopy images. ar**v, 2017; ar**v:1706.00815. [Google Scholar]
- Acharya, V.; Kumar, P. Identification and Red Blood Cell Automated Counting from Blood Smear Images using Computer Aided System. Med. Biol. Eng. Comput. 2017. [Google Scholar] [CrossRef] [PubMed]
- Jain, R.; Kasturi, R.; Schunck, B.G. Machine Vision; McGraw-Hill: New York, NY, USA, 1995; Volume 5. [Google Scholar]
- Zhu, F.; Qin, B.; Feng, W.; Wang, H.; Huang, S.; Lv, Y.; Chen, Y. Reducing Poisson noise and baseline drift in X-ray spectral images with bootstrap Poisson regression and robust nonparametric regression. Phys. Med. Biol. 2013, 58, 1739. [Google Scholar] [CrossRef] [PubMed]


| Samples | MSVST | MSSEF | MPHD | The Proposed Method |
|---|---|---|---|---|
| Image1 | 0.9204 | 0.7414 | 0.6640 | 0.9231 |
| Image 2 | 0.9306 | 0.7889 | 0.7250 | 0.9674 |
| Image 3 | 0.9348 | 0.8127 | 0.6610 | 0.9597 |
| Image 4 | 0.9260 | 0.7678 | 0.6591 | 0.9656 |
| Image 5 | 0.9075 | 0.8038 | 0.6392 | 0.9770 |
| Image 6 | 0.9343 | 0.7737 | 0.7318 | 0.9677 |
| Image 7 | 0.8945 | 0.7607 | 0.6311 | 0.9604 |
| Image 8 | 0.8931 | 0.7564 | 0.6183 | 0.9663 |
| Image 9 | 0.8792 | 0.7569 | 0.5946 | 0.9721 |
| Image 10 | 0.8810 | 0.5775 | 0.6183 | 0.9402 |
| Image 11 | 0.8999 | 0.6082 | 0.6653 | 0.9655 |
| Image 12 | 0.8462 | 0.6044 | 0.5859 | 0.9186 |
| Image 13 | 0.9177 | 0.6545 | 0.6586 | 0.9707 |
| Image 14 | 0.9202 | 0.5954 | 0.6555 | 0.9692 |
| Image 15 | 0.8831 | 0.6368 | 0.5987 | 0.9551 |
| Average | 0.9046 | 0.7093 | 0.6471 | 0.9586 |
| Samples | True Number | MSVST | MSSEF | MPHD | The Proposed Method |
|---|---|---|---|---|---|
| Image1 | 161 | 163 | 93 | 152 | 161 |
| Image 2 | 222 | 232 | 142 | 202 | 222 |
| Image 3 | 221 | 223 | 142 | 202 | 221 |
| Image 4 | 223 | 227 | 135 | 198 | 222 |
| Image 5 | 219 | 224 | 149 | 202 | 218 |
| Image 6 | 229 | 235 | 152 | 210 | 229 |
| Image 7 | 250 | 255 | 150 | 236 | 249 |
| Image 8 | 239 | 245 | 149 | 224 | 240 |
| Image 9 | 245 | 246 | 141 | 224 | 245 |
| Image 10 | 381 | 393 | 155 | 350 | 381 |
| Image 11 | 372 | 383 | 159 | 348 | 372 |
| Image 12 | 381 | 386 | 175 | 345 | 381 |
| Image 13 | 347 | 356 | 166 | 320 | 349 |
| Image 14 | 414 | 422 | 175 | 371 | 412 |
| Image 15 | 358 | 365 | 164 | 325 | 357 |
| Samples | True Number | Detected Number of Fluorescent Micro-Droplets | Relative Error |
|---|---|---|---|
| Image1 | 21 | 21 | 0.00% |
| Image 2 | 18 | 18 | 0.00% |
| Image 3 | 18 | 18 | 0.00% |
| Image 4 | 16 | 17 | 6.25% |
| Image 5 | 13 | 13 | 0.00% |
| Image 6 | 24 | 24 | 0.00% |
| Image 7 | 27 | 27 | 0.00% |
| Image 8 | 26 | 26 | 0.00% |
| Image 9 | 9 | 9 | 0.00% |
| Image 10 | 36 | 36 | 0.00% |
| Image 11 | 28 | 28 | 0.00% |
| Image 12 | 30 | 30 | 0.00% |
| Image 13 | 33 | 35 | 6.06% |
| Image 14 | 32 | 32 | 0.00% |
| Image 15 | 31 | 31 | 0.00% |
| Samples | True AP-Labeled Nanoparticle Concentration (fM) | Test AP-Labeled Nanoparticle Concentration (fM) | Relative Error |
|---|---|---|---|
| Image1 | 16.4222 | 16.4222 | 0.00% |
| Image 2 | 9.9356 | 9.9356 | 0.00% |
| Image 3 | 9.9825 | 9.9825 | 0.00% |
| Image 4 | 8.7483 | 9.3610 | 7.00% |
| Image 5 | 7.1905 | 7.2246 | 0.47% |
| Image 6 | 13.0088 | 13.0088 | 0.00% |
| Image 7 | 13.4291 | 13.4862 | 0.43% |
| Image 8 | 13.5327 | 13.4730 | 0.44% |
| Image 9 | 4.3976 | 4.3976 | 0.00% |
| Image 10 | 11.6625 | 11.6625 | 0.00% |
| Image 11 | 9.1947 | 9.1947 | 0.00% |
| Image 12 | 9.6366 | 9.6366 | 0.00% |
| Image 13 | 11.7421 | 12.4174 | 5.75% |
| Image 14 | 9.4524 | 9.5002 | 0.51% |
| Image 15 | 10.6424 | 10.6736 | 0.29% |
© 2017 by the authors. Licensee MDPI, Basel, Switzerland. This article is an open access article distributed under the terms and conditions of the Creative Commons Attribution (CC BY) license (http://creativecommons.org/licenses/by/4.0/).
Share and Cite
Li, R.; Wang, Y.; Xu, H.; Fei, B.; Qin, B. Micro-Droplet Detection Method for Measuring the Concentration of Alkaline Phosphatase-Labeled Nanoparticles in Fluorescence Microscopy. Sensors 2017, 17, 2685. https://doi.org/10.3390/s17112685
Li R, Wang Y, Xu H, Fei B, Qin B. Micro-Droplet Detection Method for Measuring the Concentration of Alkaline Phosphatase-Labeled Nanoparticles in Fluorescence Microscopy. Sensors. 2017; 17(11):2685. https://doi.org/10.3390/s17112685
Chicago/Turabian StyleLi, Rufeng, Yibei Wang, Hong Xu, Baowei Fei, and Binjie Qin. 2017. "Micro-Droplet Detection Method for Measuring the Concentration of Alkaline Phosphatase-Labeled Nanoparticles in Fluorescence Microscopy" Sensors 17, no. 11: 2685. https://doi.org/10.3390/s17112685