1. Introduction
The Chinese Gaofen-3 (GF-3) satellite was launched on 10 August 2016 by the China Academy of Space Technology (CAST), and carries a C-band (~5.3 GHz) synthetic aperture radar (SAR) sensor with different polarizations. It has 12 imaging modes with a spatial resolution of image ranging from 1 m to 500 m and a swath coverage ranging from 10 to 650 km. GF-3 SAR operates in different polarizations, including single-, dual- and quad-polarization. Through a cooperation project between the National Satellite Ocean Application Service (NSOAS) and our institutes, a number of images have been recorded of whole open seas, particularly covering the National Data Buoy Center (NDBC) in situ buoys of the National Oceanic and Atmospheric Administration (NOAA) around U.S. western coastal areas. Wind and wave monitoring are the two main marine applications of SAR in all-weather conditions, especially in tropical cyclones [
1,
2].
It is well known that Bragg waves, which have the wavelength with the order of centimeters, backscatter the microwaves of SAR. Bragg waves are produced by sea surface winds. Through studying co-polarization (vertical-vertical (VV) and horizontal-horizontal (HH)) Spaceborne Imaging Radar (SIR) data on Seasat launched in 1978 [
3,
4], the geophysical model function (GMF) has been exploited. GMF describes an empirical relationship between normalized radar cross-section (NRCS) in VV-polarization and a wind vector. C-band GMFs, e.g., CMOD4 [
5], CMOD-IFR developed at Institut Francais de Recherche pour Exploitation de la MER (IFREMER) [
6], CMOD5 [
7] and CMOD5N [
8]. These GMFs provide a convenient application for wind retrieval from SAR [
9,
10,
11] and have been successfully implemented for various C-band SAR data over the last few decades, e.g., ERS-1/2 [
12], Envisat-ASAR [
13], Radarsat-1/2 [
14] and Sentinel-1A/1B [
15] within about 2 m/s error of wind speed. CMOD4 and CMOD-IFR work at wind speeds smaller than 20 m/s, due to no higher wind source being available in the tuning process. The formulation of an improved C-band GMF CMOD5 was essentially redesigned with a number of ERS-2 images taken in tropical cyclones and corresponding European Centre for Medium-Range Weather Forecasts (ECMWF) re-analysis winds. In particular, some case studies have shown that CMOD5 can be used in hurricanes [
16,
17,
18] to some extent. Later, CMOD5 was retuned for neutral winds, denoted as CMOD5N, which takes a correction for CMOD5 can be more stable applied. As GMF is applied for HH-polarization SAR, NRCS in HH-polarization has to be converted into NRCS in VV-polarization by using a polarization ratio (PR) model [
19,
20,
21,
22,
23]. The latest achievement of the PR model was proposed by the authors of [
23] and the improvement is that the dependence of sea surface wind speed on PR is included in the model. More recently, using collocated scatterometer measurements on aboard Metop-A/B and ECMWF winds with co-polarization Envisat-ASAR and Sentinel-1A/1B SAR data, a new C-band GMF for wind retrieval from co-polarization SAR was developed in [
24], denoted as C-SARMOD. Although the accuracy of wind speeds retrieved from Sentinel-1A/1B images in VV-polarization by using C-SARMOD showed a 1.6 m/s STD of wind speed against moored buoy measurements [
25], the validation of its application for C-band SAR in HH-polarization has not yet been systematically investigated.
Traditionally, the methodology of wave retrieval from SAR is based on the SAR map** mechanism [
26]. The major modulations of waves on SAR have been well studied over many decades, e.g., tilt modulation, hydrodynamic modulation and velocity bunching [
27,
28]. Both tilt and hydrodynamic modulations are linear map** mechanisms and the two modulation transfer functions (MTF) were proposed by the authors of [
29,
30]. However, velocity bunching is caused by the relative motion between satellite platform and sea surface, resulting in a Doppler frequency shift in the azimuth direction (the direction of satellite flight is defined as the azimuth direction and radar look direction is the range direction). This velocity bunching causes wavelengths smaller than a specific value (or cutoff wavelength) in the azimuth direction, which is not detectable and the peak of the SAR spectrum rotates toward the range direction. These two effects create the difficulty of directly inverting SAR intensity spectra to wave spectra. The first solution was established by the authors of [
28], with an algorithm known as the Max–Planck Institute (MPI) algorithm. The basic scheme of the MPI is described as follows: (1) a first-guess wave spectrum is produced from numeric wave modes, e.g., Simulating WAves Nearshore (SWAN) and WaveWatch-III; (2) a simulated SAR spectrum is obtained by map** the first-guess wave spectrum; (3) the reality of the wave spectrum is inverted by minimizing the simulated and real SAR spectrum through a cost function. The Semi Parametric Retrieval Algorithm (SPRA) [
31] is more applicable than the MPI, because the SPRA employs wind measurements from a scatterometer in order to produce the first-guess spectrum by using the Jonswap parametric model. Later the Parameterized First-guess Spectrum Method (PFSM) algorithm was proposed by the authors of [
32,
33] and recent studies show that the PFSM works for X-band TerraSAR-X [
34] and C-band Sentinel-1 SAR data [
25]. The improvement of the PFSM involves the wind-wave and swell information on SAR being separated by calculating the wave number threshold of the SAR intensity spectra. A 0.54 m standard deviation (STD) of SWH is exhibited in study [
25] by using the algorithm PFSM as the SAR-derived SWH from Sentinel-1 SAR data validated against the buoys. In addition, there are other wave algorithms, e.g., the Partition Rescaling and Shift Algorithm (PARSA) [
35] for SAR complex data and unconstrained algorithms [
36,
37], in which the MTF of velocity bunching is bypassed and it only works for long wave dominated regions.
Empirical wave retrieval algorithms, without calculating complex MTF, were developed by the SAR group at the German Aerospace Center (DLR), and include CWAVE_ERS for ERS-2 SAR [
38], CWAVE_ENV for Envisat-ASAR [
39] and XWAVE for X-band TerraSAR-X SAR [
40]. CWAVE allows direct retrieval of significant wave height (SWH) from SAR wave mode data at a fixed incidence angle of about 23°. However, these are not conducive to the operational application of wave retrieval from various SAR data. Interestingly, the cutoff wavelength in azimuth direction caused by velocity bunching is theoretically related with SWH [
28]. Several recent studies have made great efforts to retrieve wave parameters through the cutoff wavelength [
41,
42,
43,
44,
45]. In our previous study [
46], the four existing algorithms, including PFSM and three other empirical algorithms, have been implemented for HH-polarization Sentinel-1 SAR images. It was found that the empirical algorithm, herein called CSAR_WAVE, has a good performance as the retrieval results compared with moored buoys.
In this study, we give a preliminary assessment of wind and wave retrieval from the new Chinese C-band GF-3 SAR for the first time. After employing ECMWF wind direction, wind speed is retrieved from a VV-polarization GF-3 SAR image using CMOD5N. The PR model proposed in [
23] is used together with CMOD5N for wind speed retrieval from an HH-polarization GF-3 SAR image. SWH is retrieved using CSAR_WAVE for both VV and HH polarization GF-3 SAR without any prior knowledge.
The remainder of this paper is organized as follows. The description of collected C-band co-polarization GF-3 SAR images and the validation sources, including NOAA buoy measurements, available ECMWF re-analysis winds and wave computations from the WaveWatch-III model provided by the IFREMER group, are briefly introduced in
Section 2.
Section 3 shows the methodology of wind and wave retrieval algorithms used in this study. Then retrieval results and discussions are presented in
Section 4 and
Section 5, respectively. Conclusions are summarized in
Section 6.
2. Description of Datasets
In total, we collected 224 GF-3 SAR images in co-polarization (VV and HH polarization) through September 2016 to March 2017 at seas. These single look complex (SLC) images were acquired in Stander Stripmap (SS) or Quad-Polarization Stripmap (QPS) mode. In the 224 images, there are 166 images, which are a matchup with 0.125 × 0.125° grids ECMWF re-analysis winds at intervals of six hours and 0.5 × 0.5° grids waves from the WaveWatch-III model at intervals of 3 h. The time difference between the imaging time of those images and ECMWF/WaveWatch-III data was within two hours. They were used to investigate the accuracy of wind and wave retrieval results in our study. The following equation is used for calculating the NRCS of co-polarization GF-3 SAR intensity image.
wherein σ° is the NRCS united in dB, DN is the intensity derived from GF-3 SAR Level-1A data, M is the external calibration factor and N is the offset constant stored in the annotation file. As an example, a quick-look image of a calibrated GF-3 SAR image in VV-polarization around the Hawaiian islands acquired in QPS mode at 16:22 UTC on 20 December 2016 is shown in
Figure 1. The ECMWF wind field at 18:00 UTC is shown in
Figure 2a and SWH from the WaveWatch-III model at 18:00 UTC are shown in
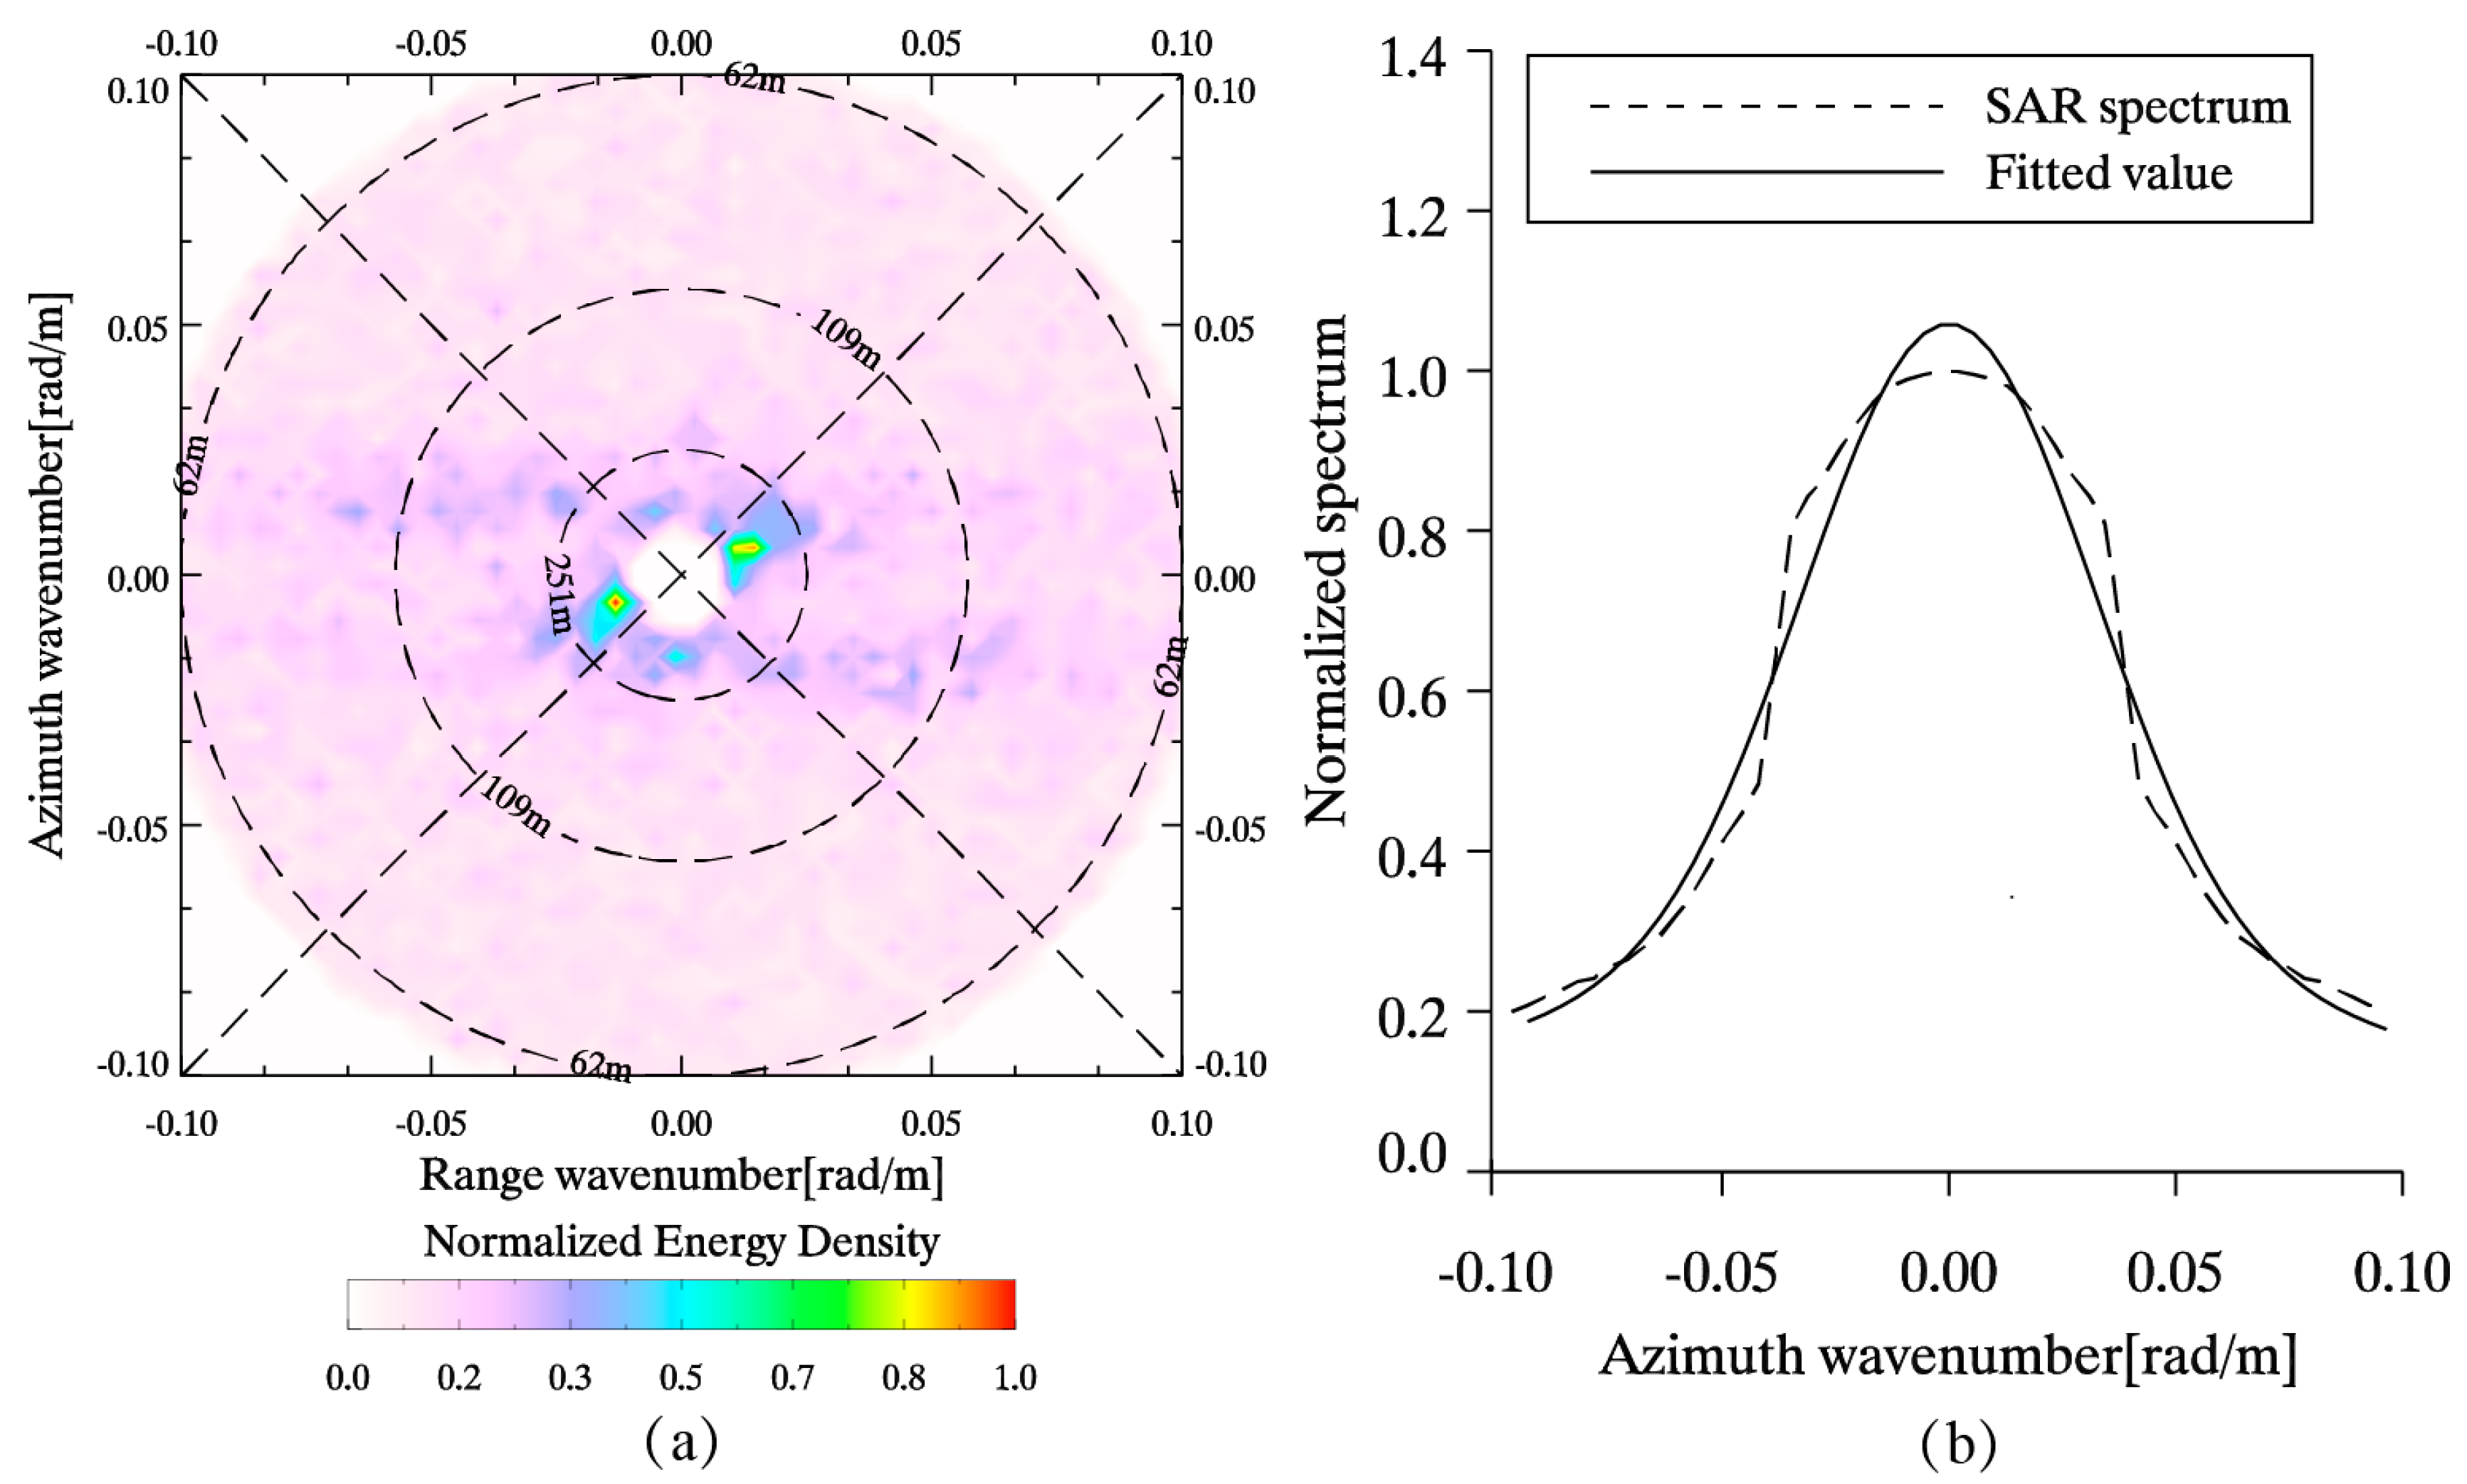
Figure 2b. The black rectangle represents the coverage of the case image. In the matchups, we only used homogenous sub-scenes derived from images for wave validation, that is, the good-quality SAR intensity spectra can be obtained by using the two-dimensional Fast Fourier Transform (FFT) method.
Out of the 166 GF-3 SAR image matchups, 58 images cover the NDBC in situ buoys of NOAA around U.S. western coastal areas. It is necessary to calculate that the wind speeds measured by the NDBC in situ buoys are at a height of 5 m above the sea surface, so we use Equation (2) to convert buoy-measured wind speeds to values at 10 m height as neutral winds,
wherein U
10 is the wind speed at 10 m height, U
5 is the wind speed measured by NDBC in situ buoy and z
0 is the roughness length taken as a constant 1.52 × 10
−4 [
25,
46].
5. Discussion
In order to further investigate the accuracy of winds and waves retrieved from GF-3 SAR images. We also compared SAR-derived wind speeds with 0.125 × 0.125° grids ECMWF re-analysis wind speeds and SAR-derived SWH with those from the 0.5 × 0.5° grids WaveWatch-III model through more GF-3 co-polarization images at seas.
Out of 58 GF-3 SAR images matchup with buoys, there are additional 166 images in our collections, including 96 images in VV-polarization and 70 images in HH-polarization. The retrieval wind speeds from these images were compared with ECMWF re-analysis gridded winds at 1 m/s bins, showing a 2.0 and 2.2 m/s RMSE of wind speed for VV-polarization and HH-polarization respectively, as exhibited in
Figure 7.
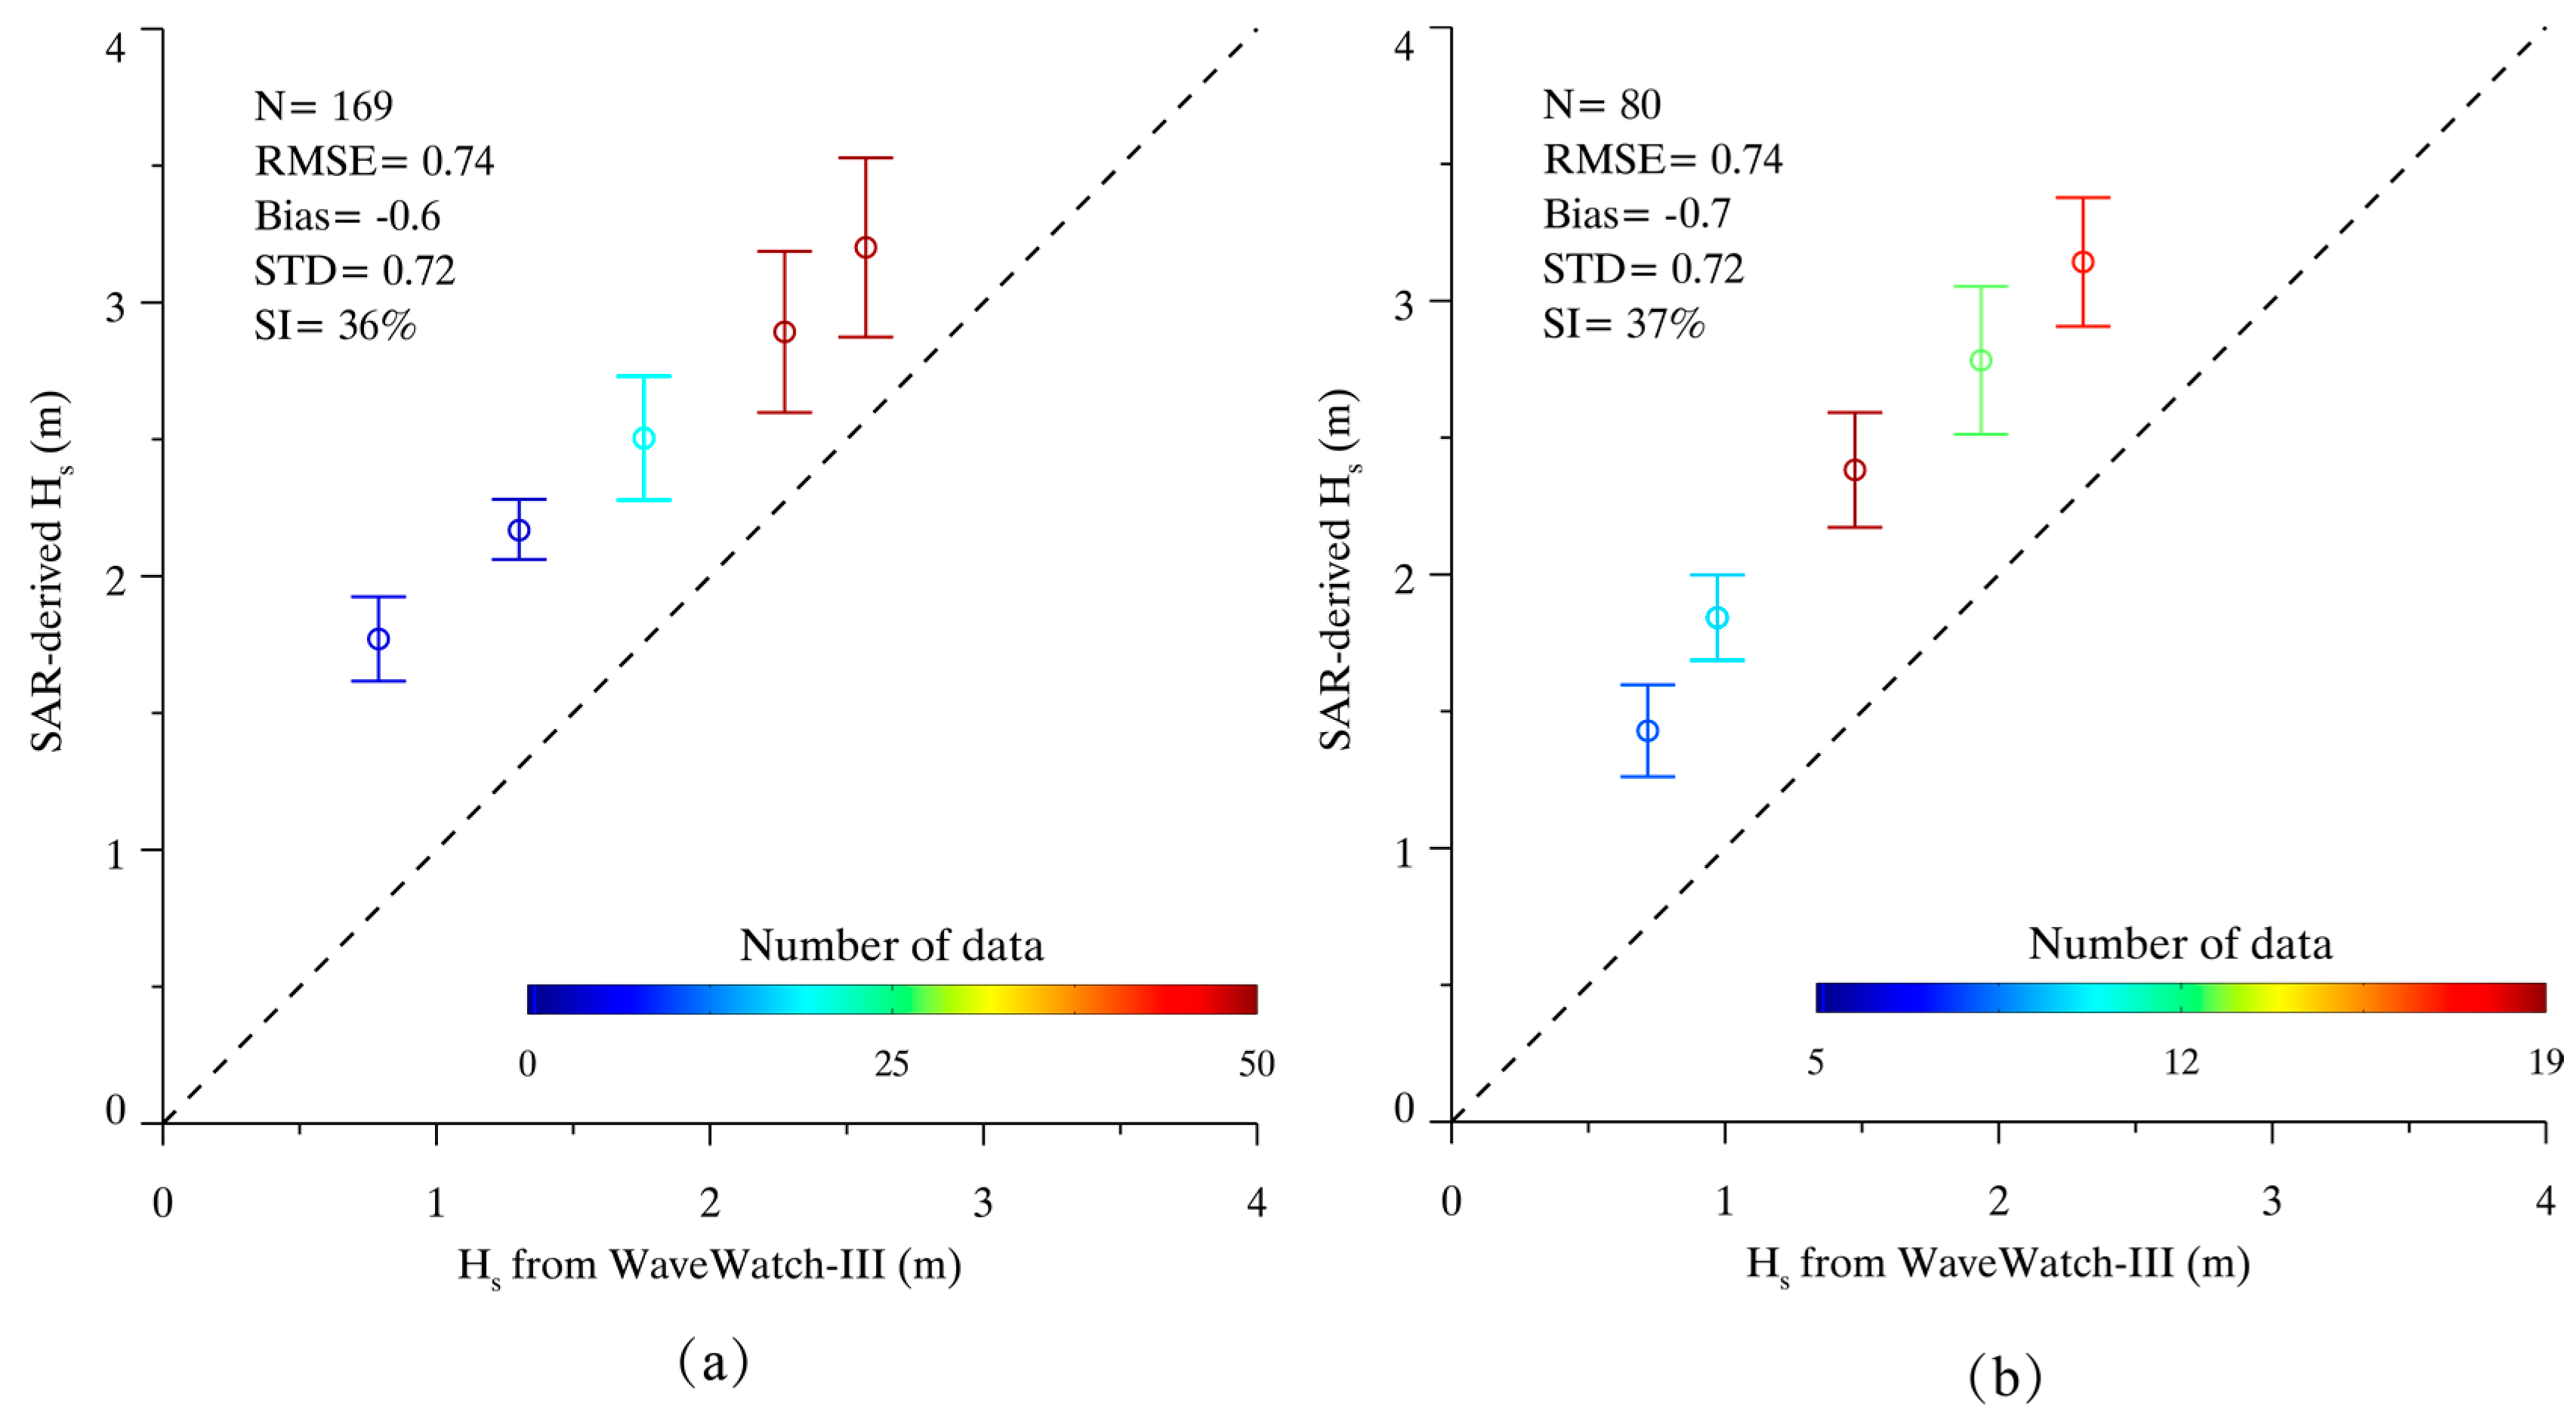
The computations run by the WaveWatch-III model at intervals of three hours. In our previous study, that data has been used for the validation of wave retrieval results from X-band SAR by using algorithm PFSM [
34]. Although the open-accessed simulations from the WaveWatch-III model have a lower spatial resolution of 0.5° grid, the model results can be used for independent validation purposes. We applied the CSAR_WAVE model to a total of 96/70 GF-3 SAR images in VV/HH polarization and then compared the retrieval results with those from the WaveWatch-III model at 0.5 m bins of SWH.
Figure 8 shows the SI of SWH is 36% with a 0.74 m RMSE for VV-polarization and the SI of SWH is 37% with a 0.74 m RMSE for HH-polarization.
As a result, it is found that SAR-derived winds have a good agreement with ECMWF re-analysis winds for wind speeds between 5 and 10 m/s. However, SAR-derived winds are larger than ECMWF re-analysis winds for wind speeds smaller than 5 m/s and wind speeds greater than 10 m/s. We think it is probably due to the change of atmospheric stability at low winds and high wind conditions. Compared with SWH from WaveWatch-III model, the SWH retrieval results are generally larger. It is necessary to figure out that herein statistical results have a larger error than the result as exhibited in
Figure 6, due to the coarse spatial resolution of wave data from WaveWatch-III model. To give a better performance, the bias can somehow be improved with the simple expediency of subtracting 0.6 for VV-polarization or 0.7 for HH-polarization.
6. Conclusions
Wind speed and SWH are two of most the important parameters in oceanography research, and SAR has the capability to observe wind and wave in wide spatial coverage. The Chinese GF-3 satellite carries a C-band SAR sensor, and has been operating in 12 imaging modes with a fine spatial resolution of up to 1 m since September 2016. Recently, the validation of SAR-derived winds from GF-3 images has been presented in [
50]. In our work, the accuracy of wind speed and SWH retrieval results from GF-3 SAR have been simultaneously investigated.
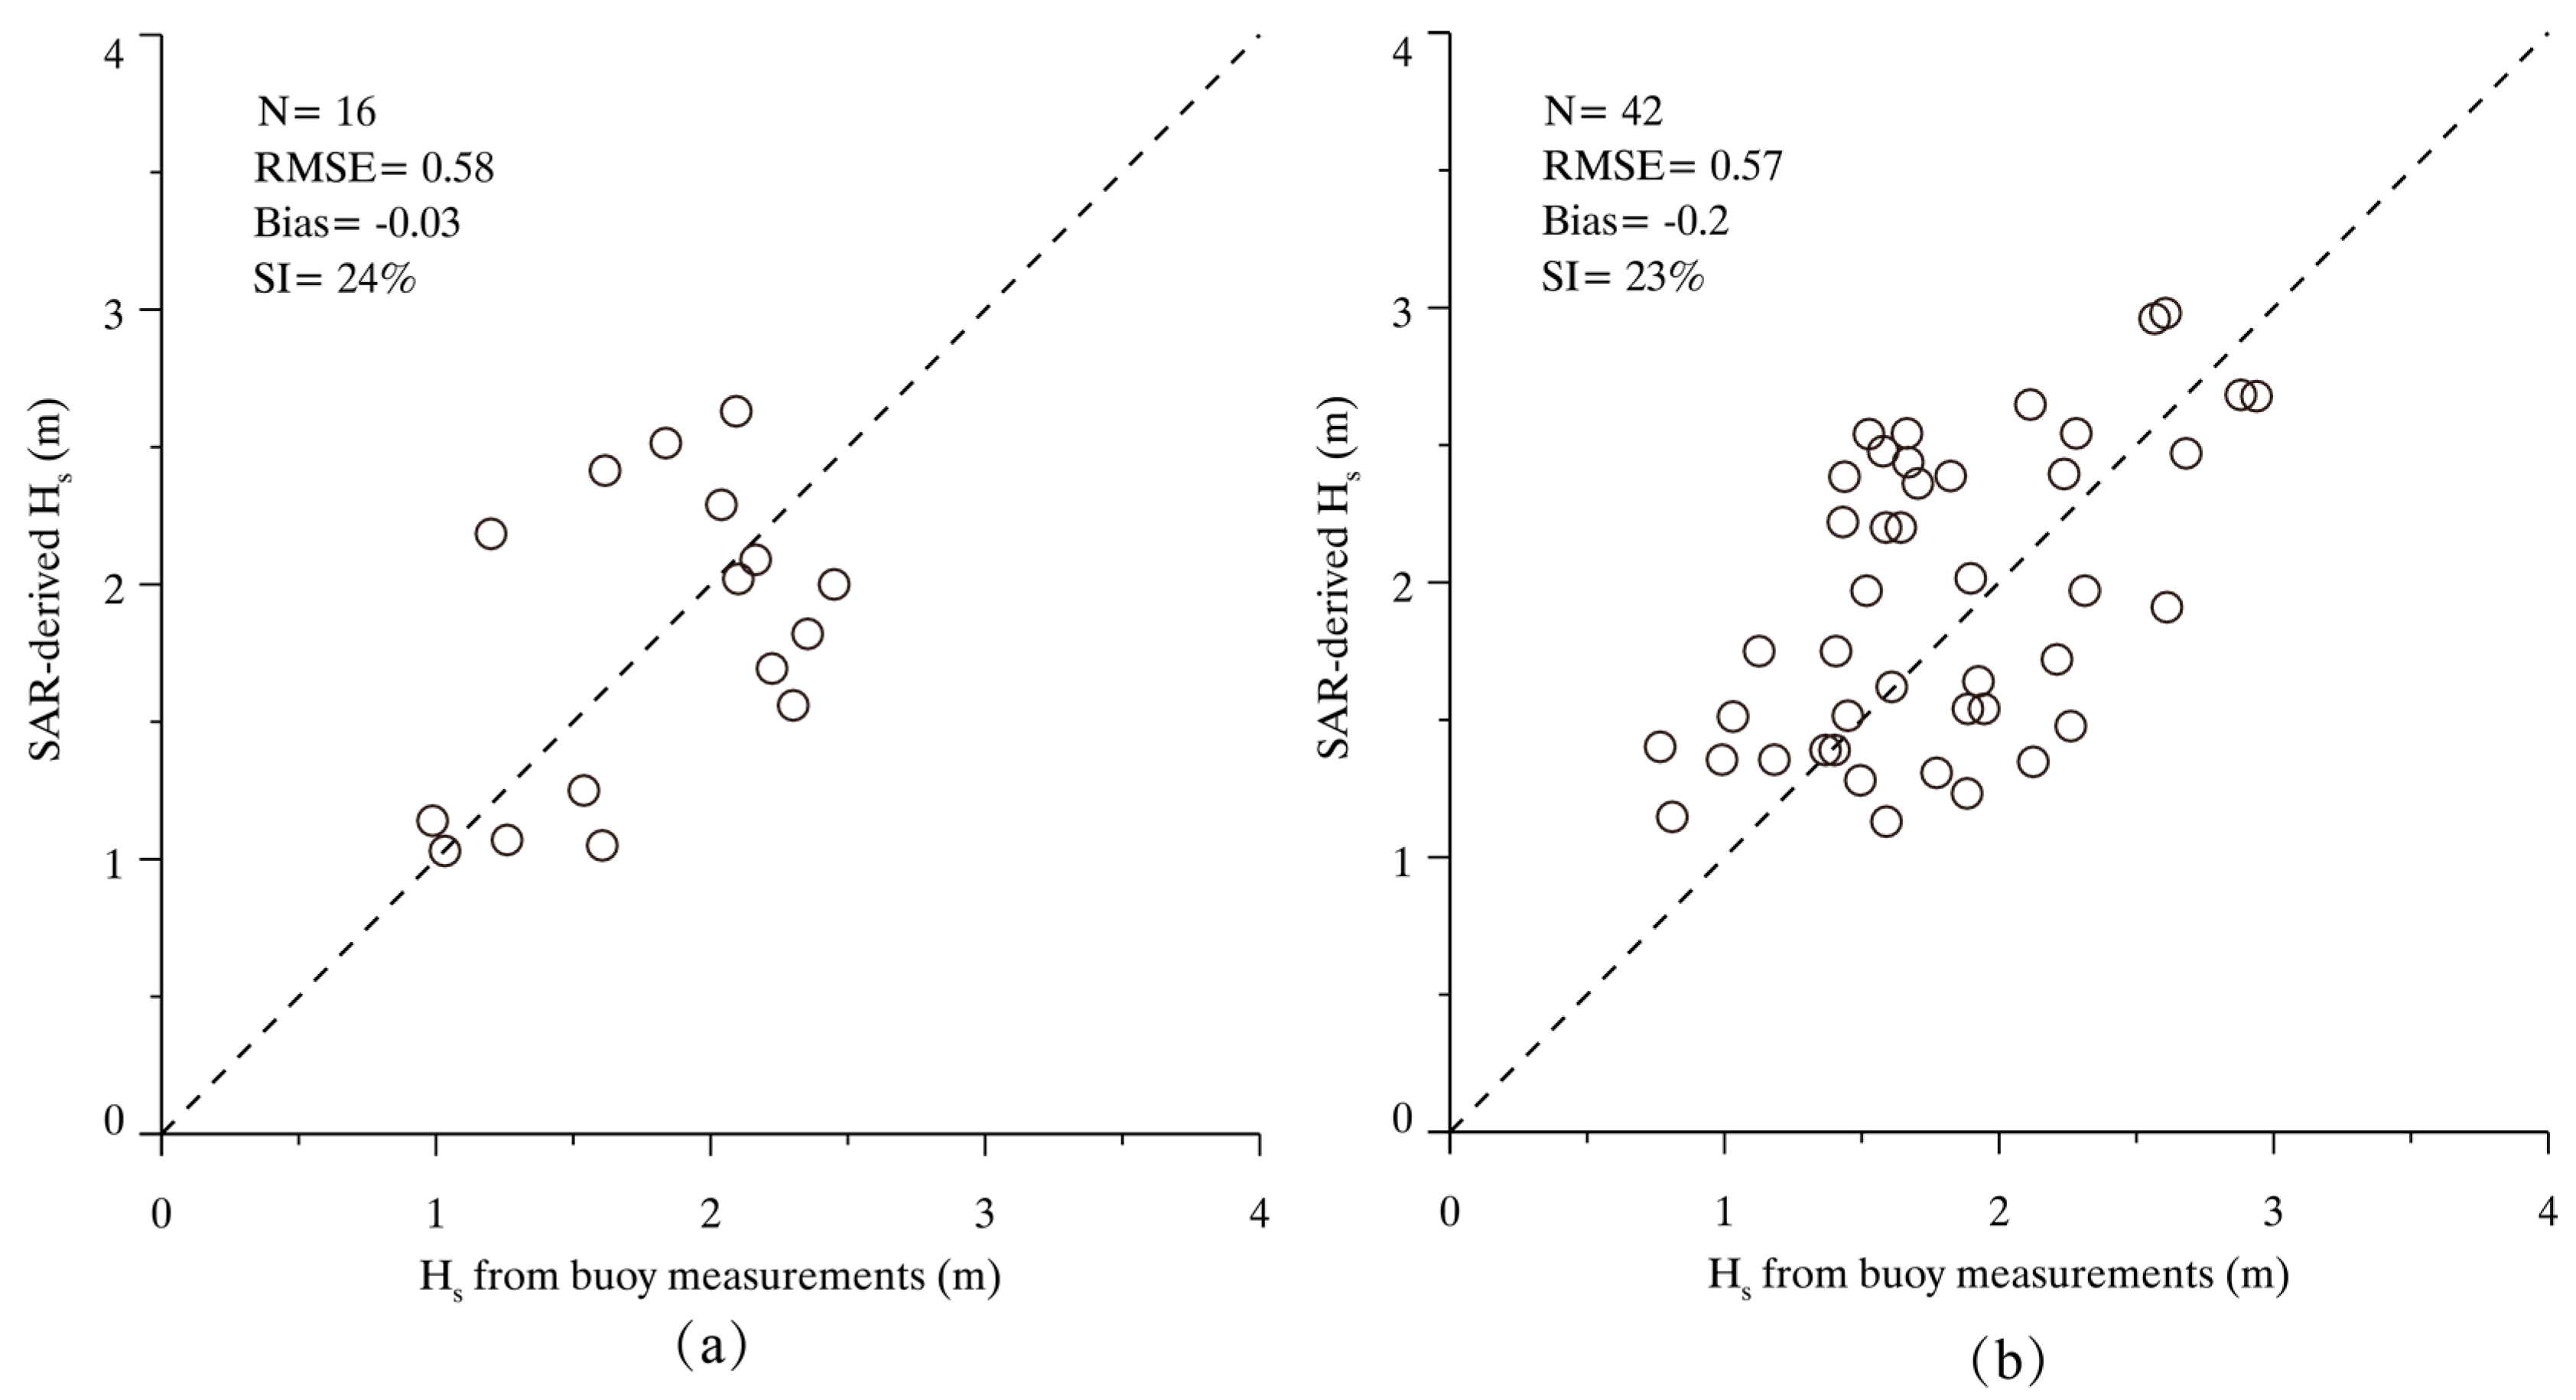
We employed wind directions directly from ECMWF re-analysis data. Then CMOD5N, together with the PR model, involving the dependence on wind speed and incidence angle, were used for retrieving wind speeds. Validations against NDBC in situ buoys showed a 1.4 and 1.9 m/s RMSE of wind speed through 16 VV-polarization and 42 HH-polarization GF-3 SAR images. SAR-derived wind speeds from an additional 96/70 GF-3 images in VV/HH polarization were compared with ECMWF re-analysis winds, showing a 2.0/2.2 m/s RMSE of wind speed, respectively.
Theoretical-based algorithms and empirical CWAVE models have been developed in recent years. However, all of these rely on either wind speed or computations from numeric wave models. The new empirical CSAR_WAVE model is designed based on the relation between SAR cutoff wavelength in azimuth direction and SWH, and can be applicable without any prior information. The comparisons between SWH retrieval results and measurements from NDBC in situ buoys show a 24 and 23% SI of SWH with a 0.58 and 0.57 m RMSE of SWH for VV-polarization and HH polarization, respectively. We also compared the SWH retrieval results with the computations from the WaveWatch-III model, showing a 36/37% SI of SWH through 96/70 GF-3 images in VV/HH polarization. Therefore, CSAR_WAVE is suitable for wave retrieval from Chinese C-band GF-3 SAR.
In summary, the proposed methods are operationally applicable for wind and wave retrieval from C-band GF-3 SAR images in co-polarization. Moreover, the independent extraction of wind and wave from co-polarization GF-3 SAR images due to SAR-derived wind speed is no longer required in the process of wave retrieval when using the empirical CSAR_WAVE model. It is concluded that the performance achieves the design requirements of GF-3 SAR referred to the preliminary assessment of winds and waves presented in this study.


