Understanding Collective Human Mobility Spatiotemporal Patterns on Weekdays from Taxi Origin-Destination Point Data


Abstract
:1. Introduction
2. Materials and Methods
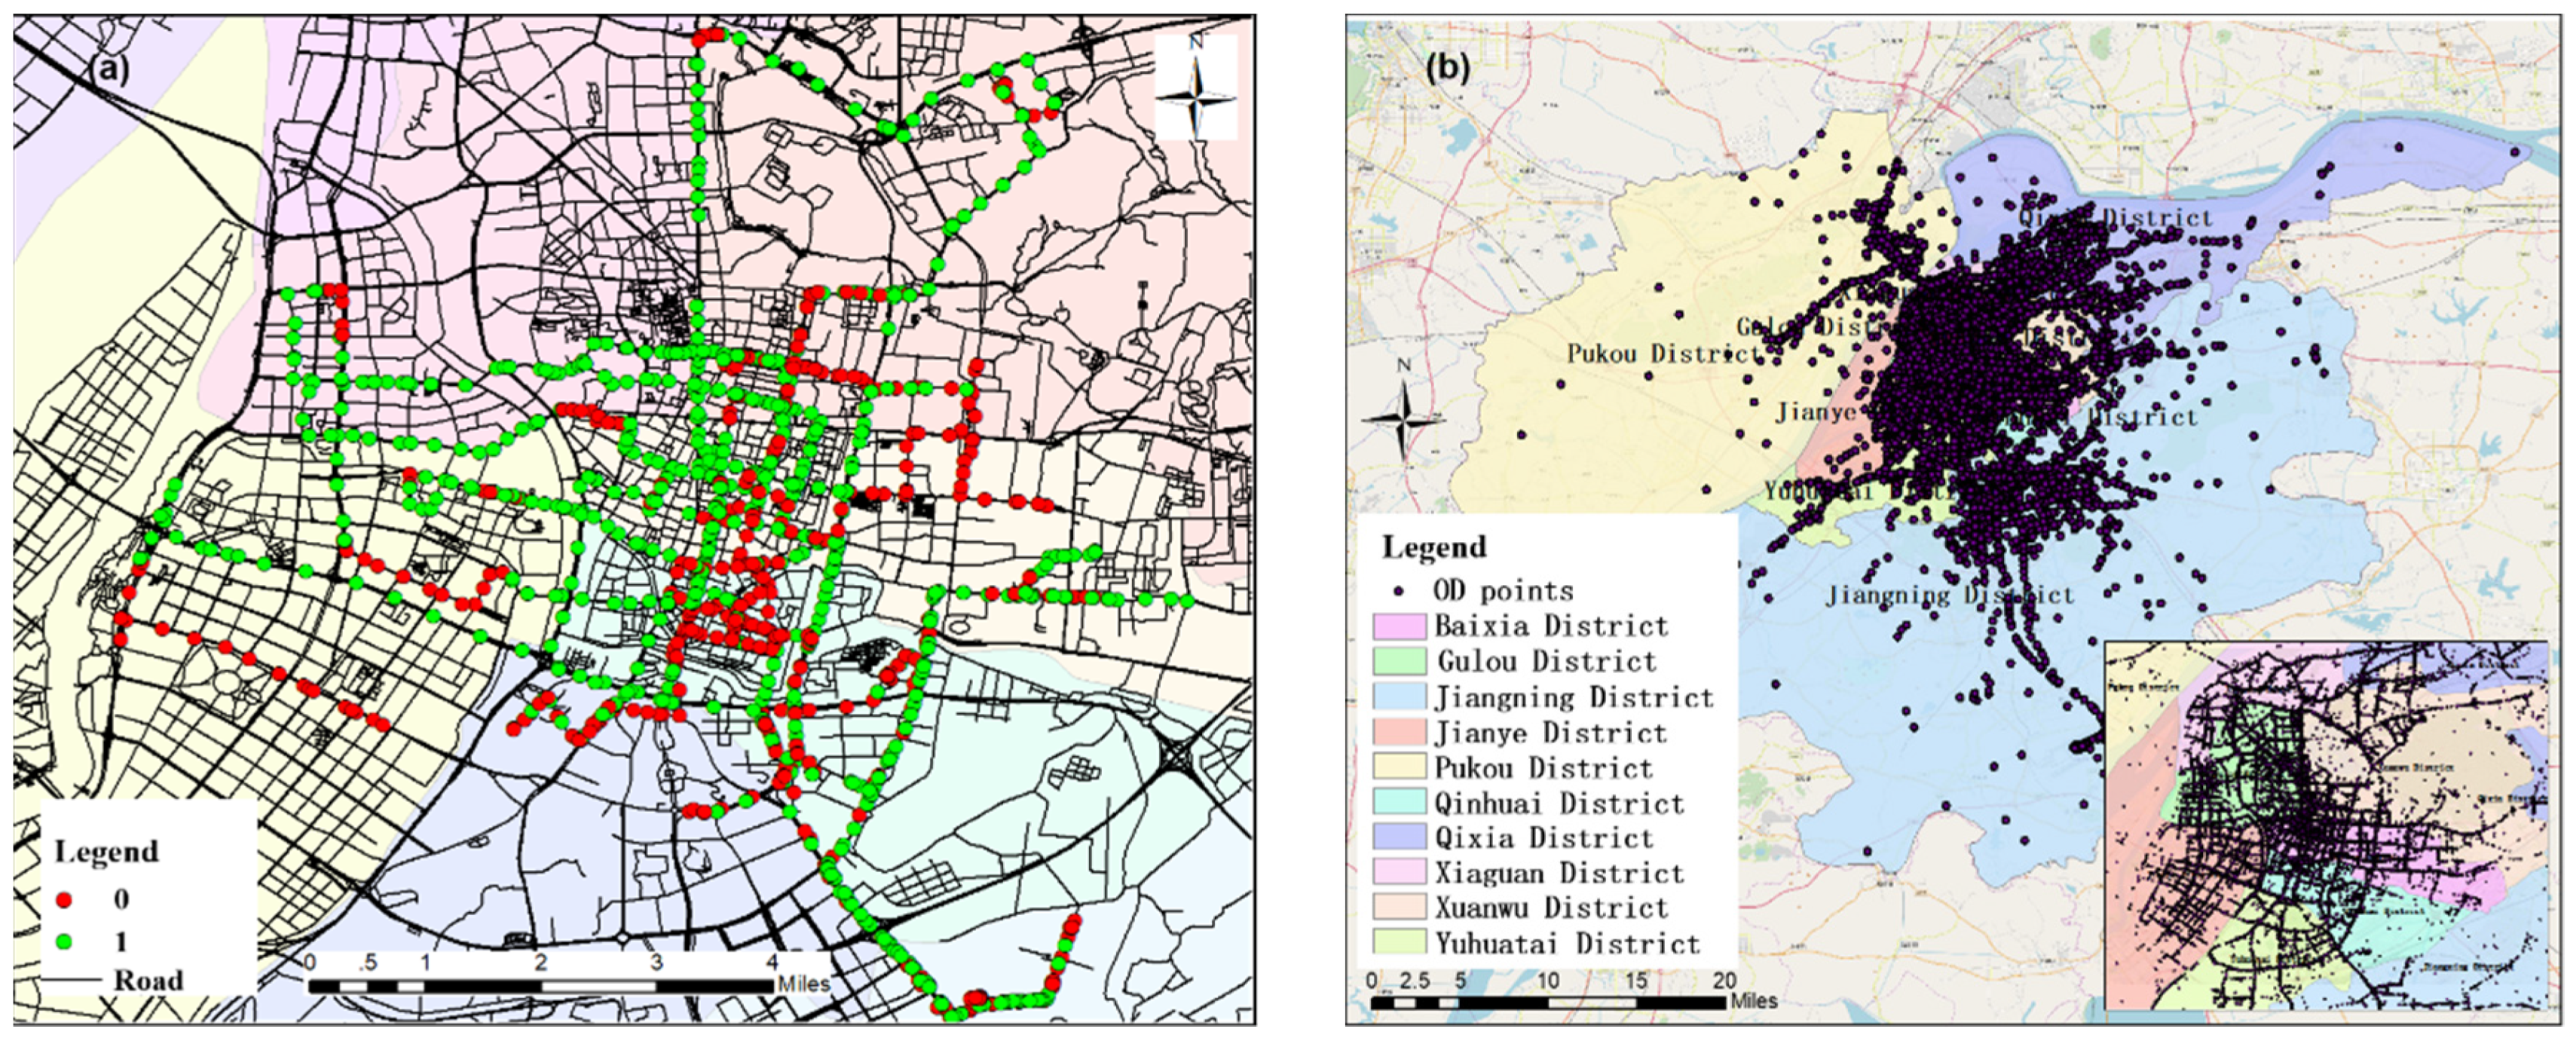
2.1. Study Area and Data Sources
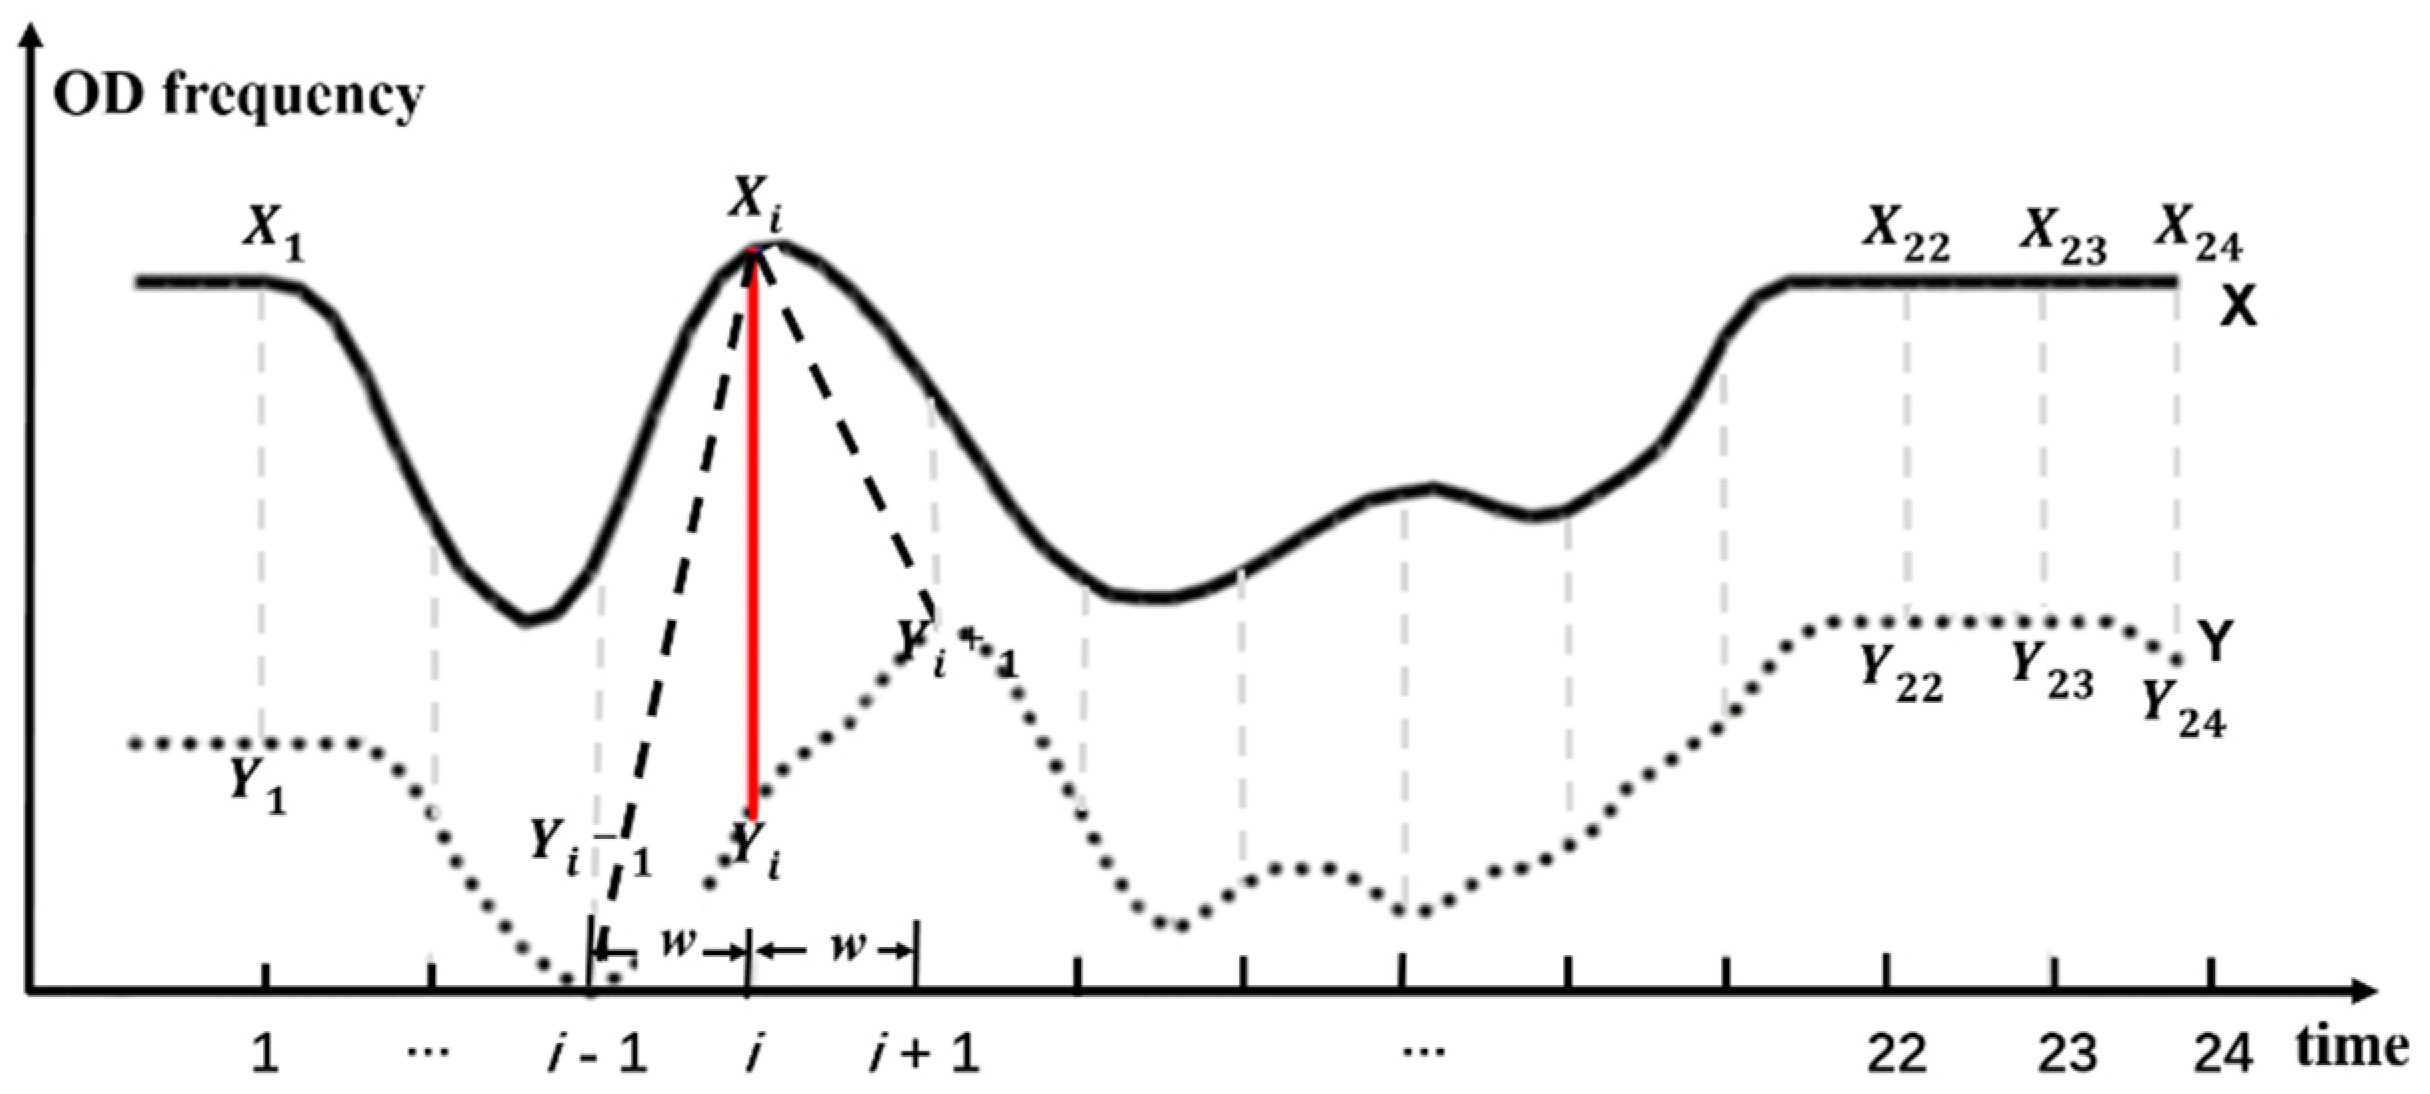
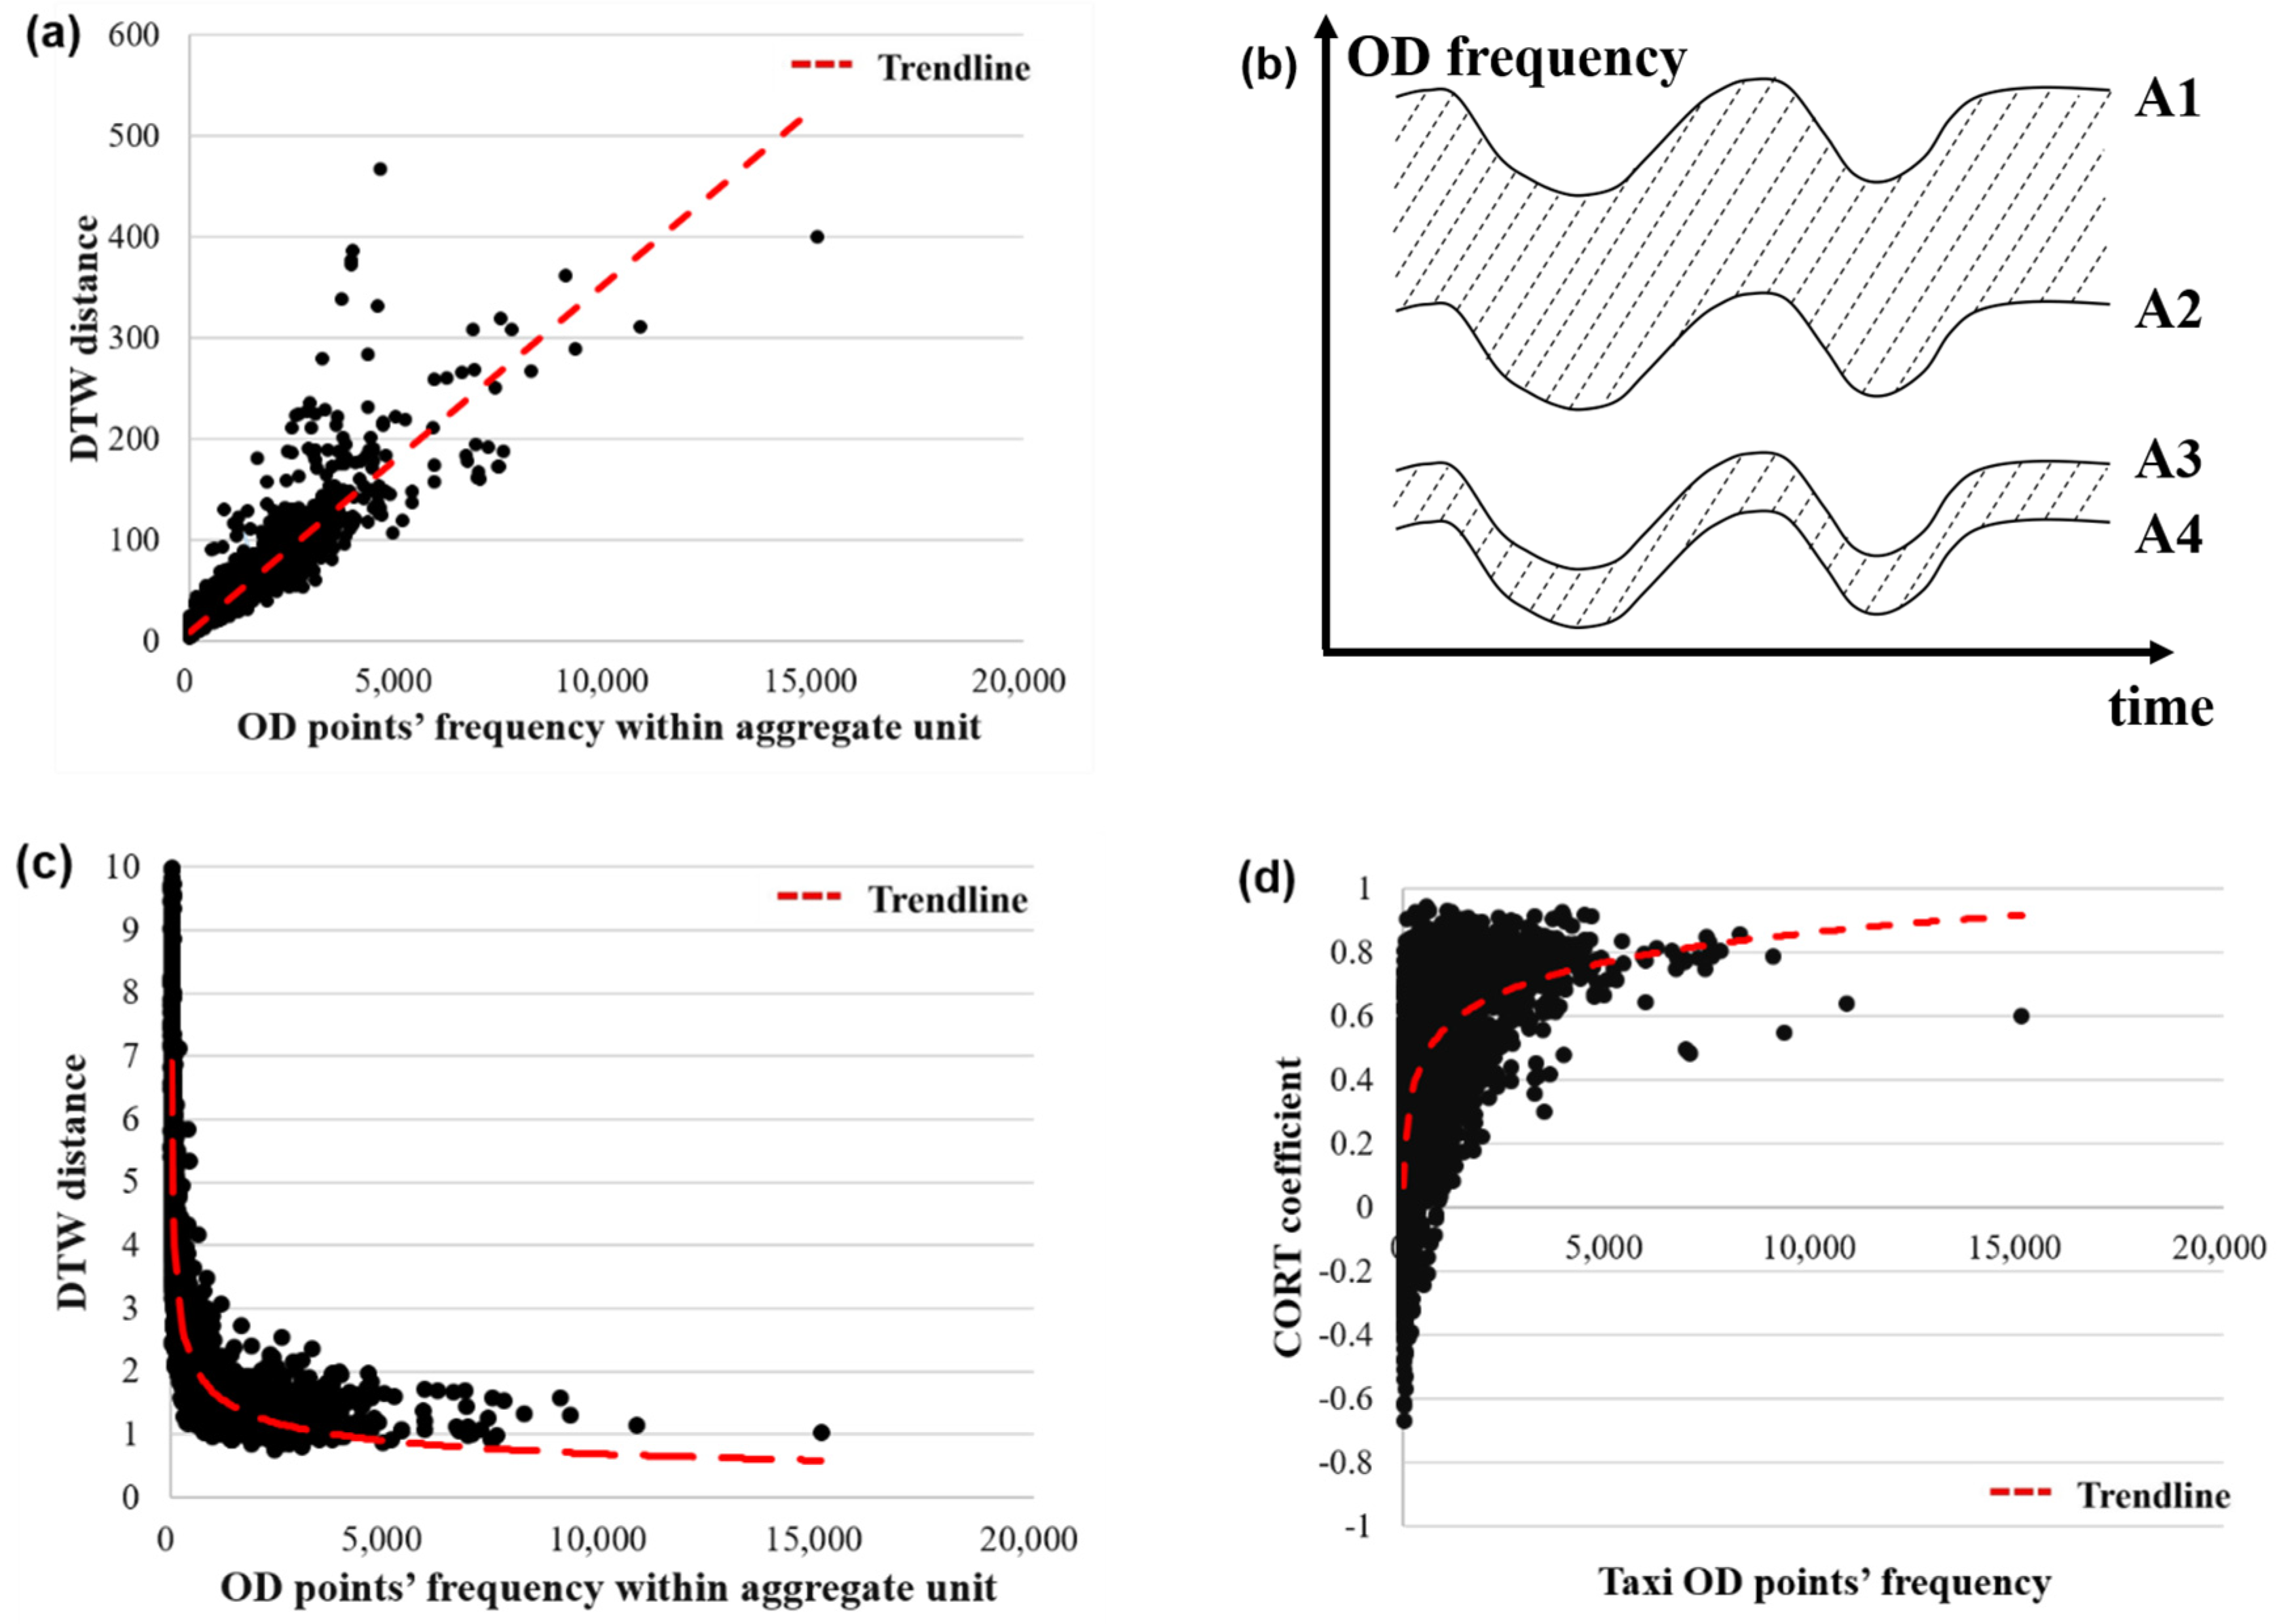
2.2.3. Adaptive Dissimilarity Index
2.2.4. Construction of the Similarity Measurement Function
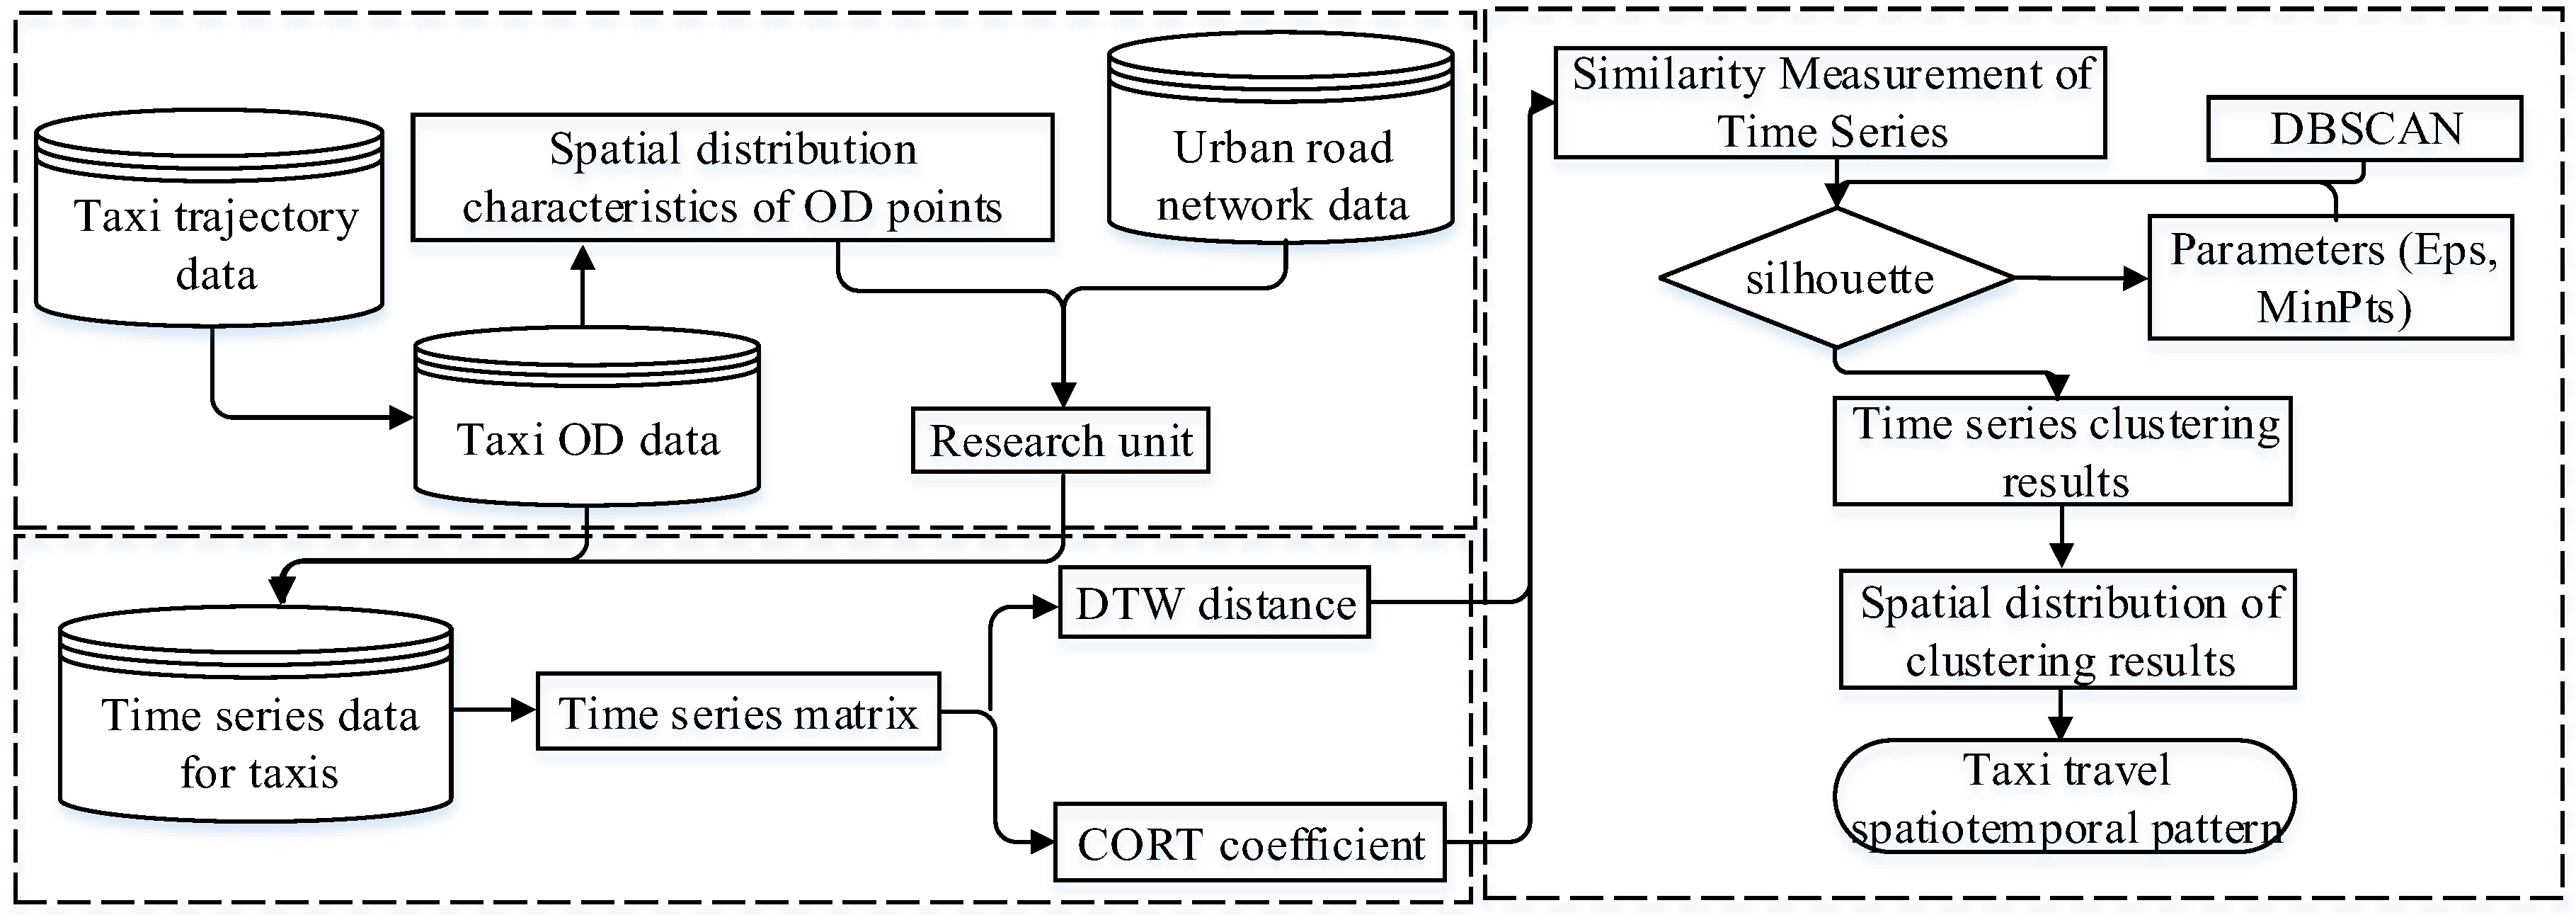
2.3. Collective Human Mobility Spatial-Temporal Pattern Recognition
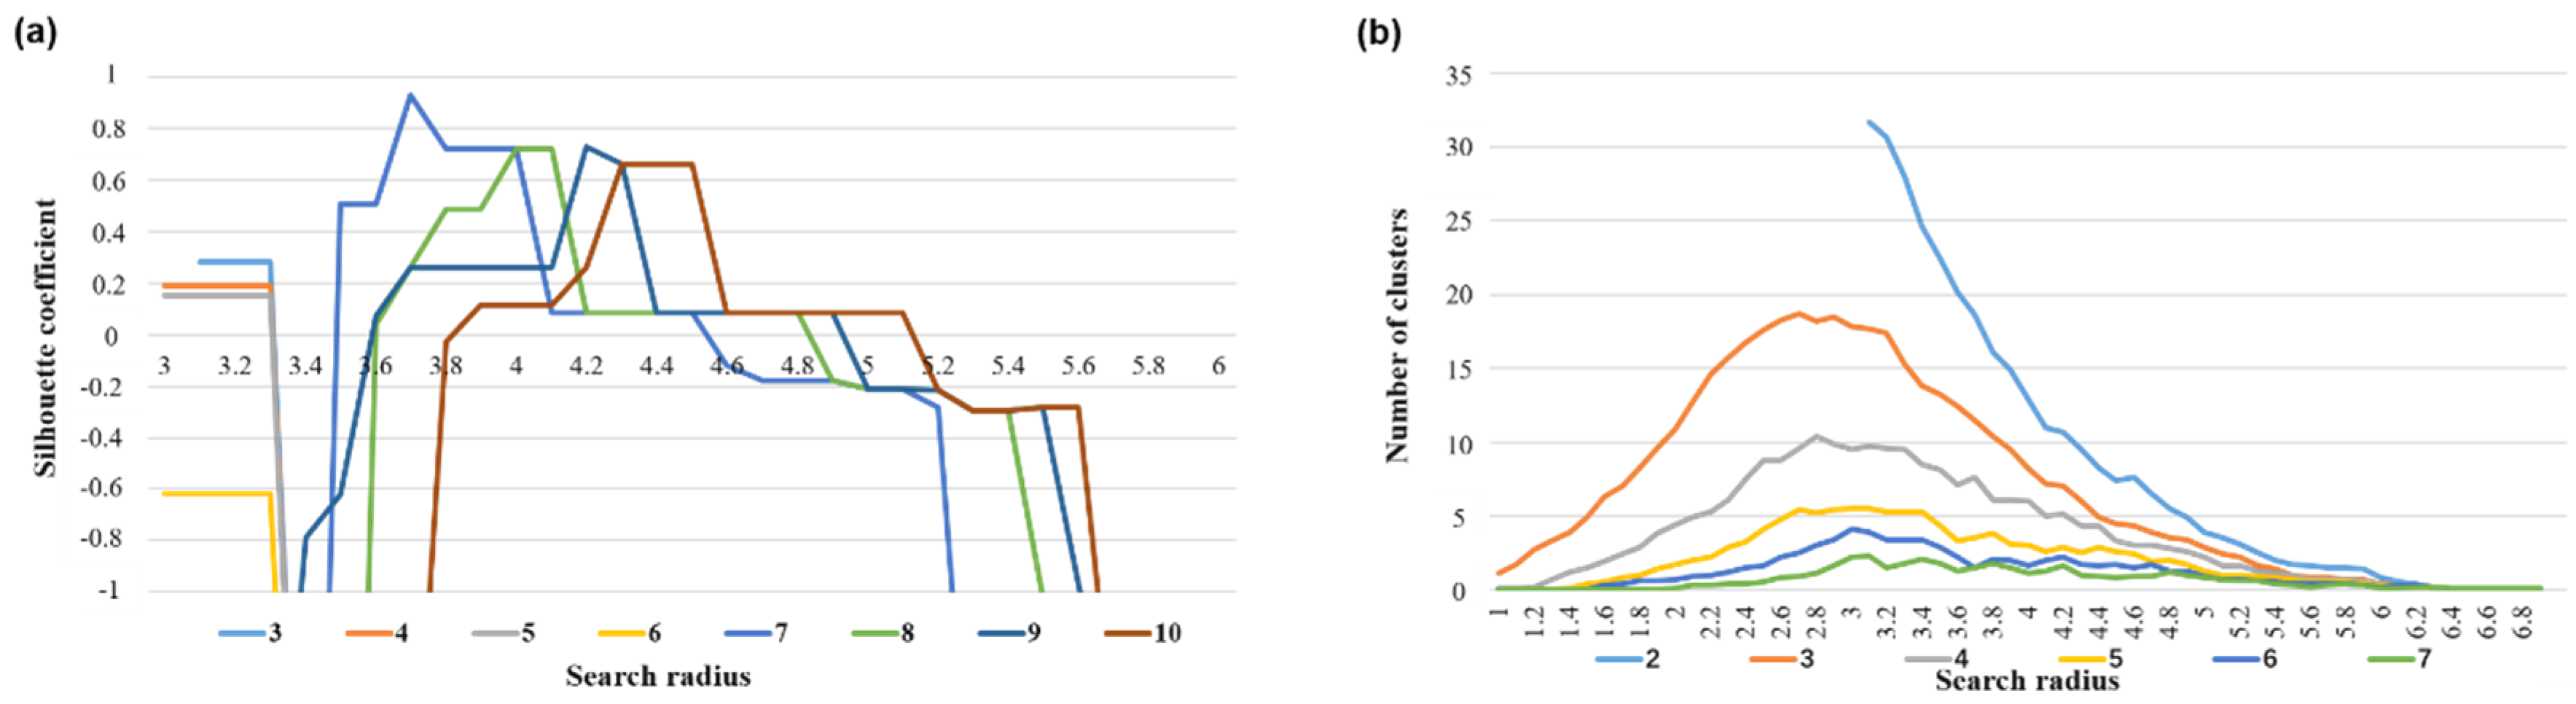
2.3.1. Clustering Method for the Travel Time Series
2.3.2. Comparing the Results with the K-Means Method
3. Results
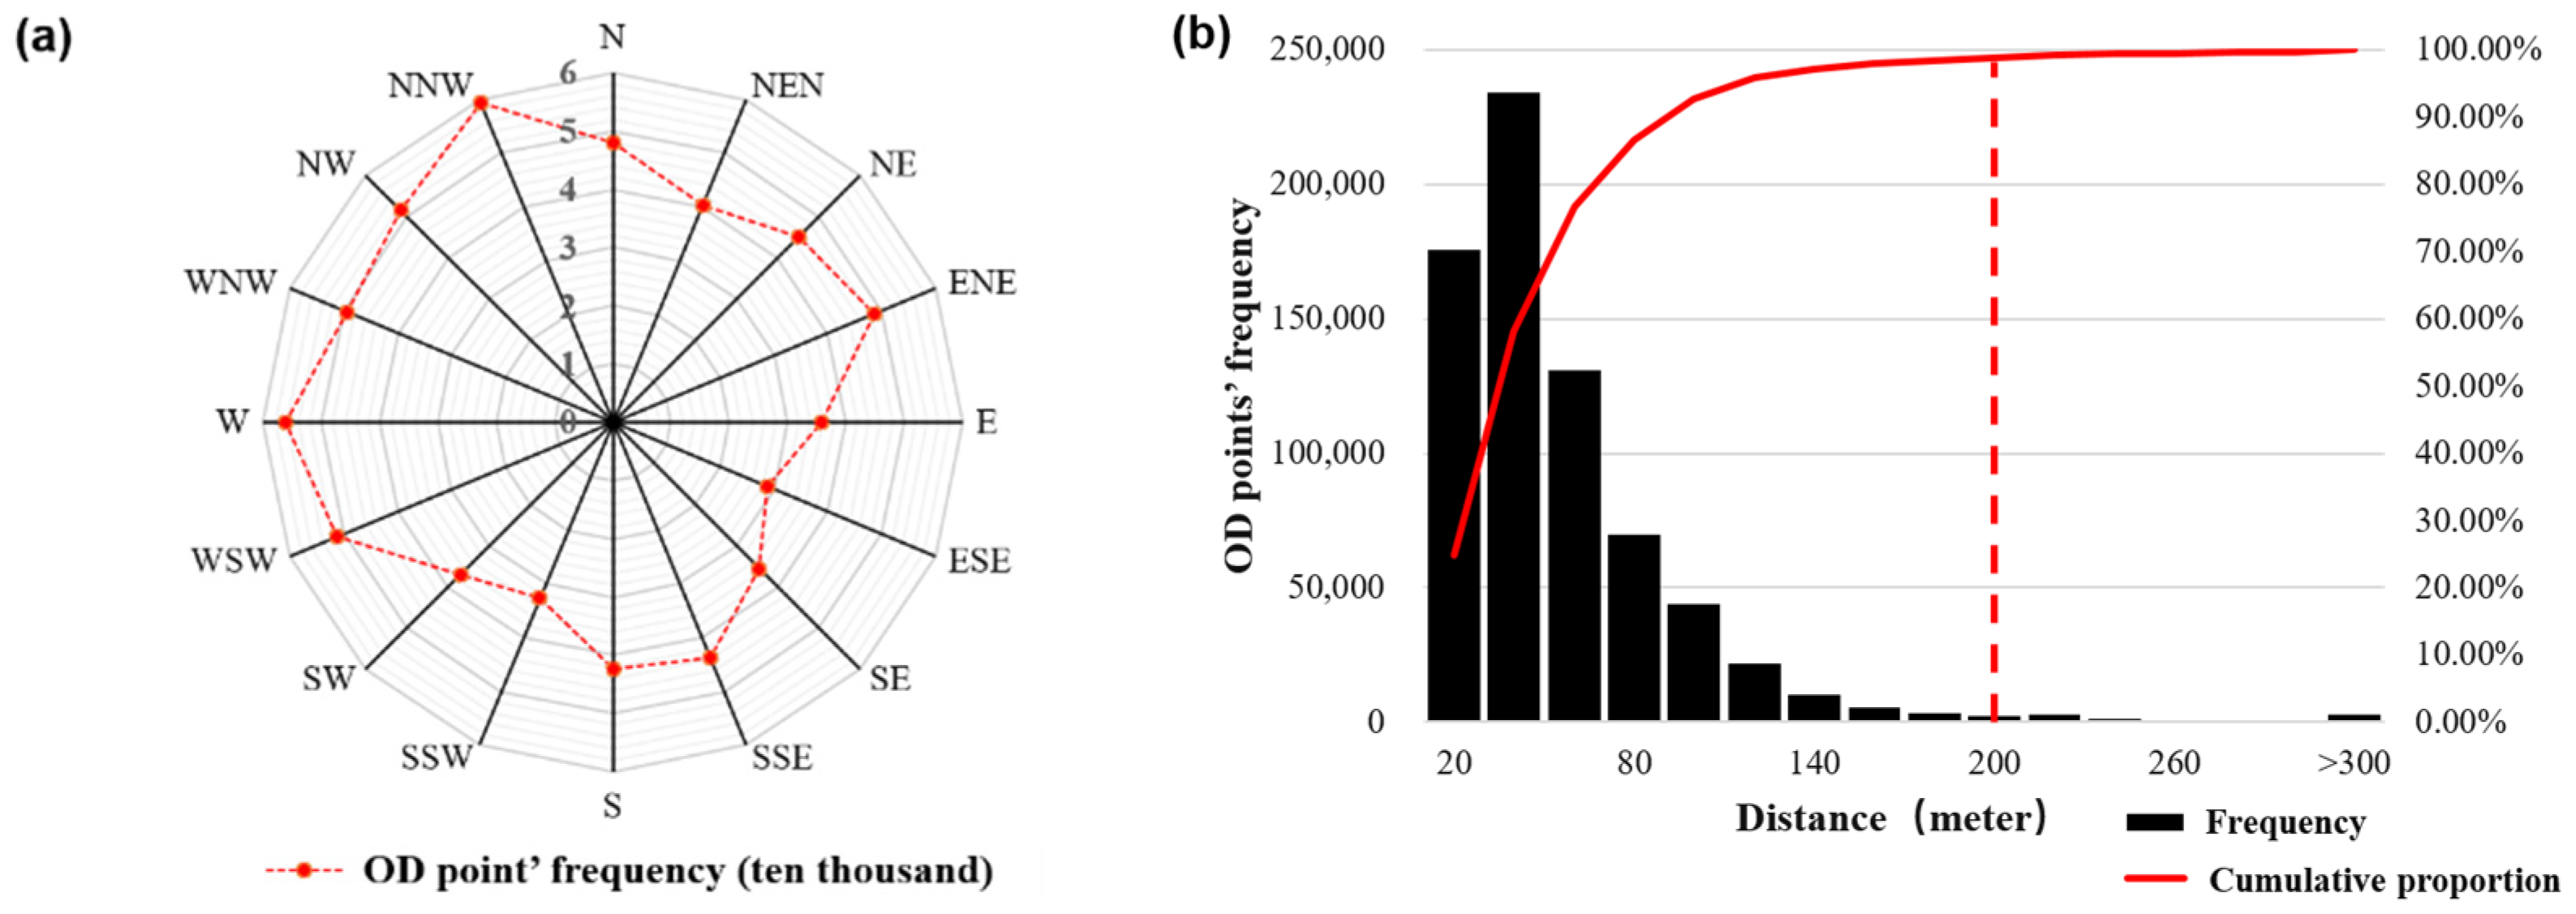
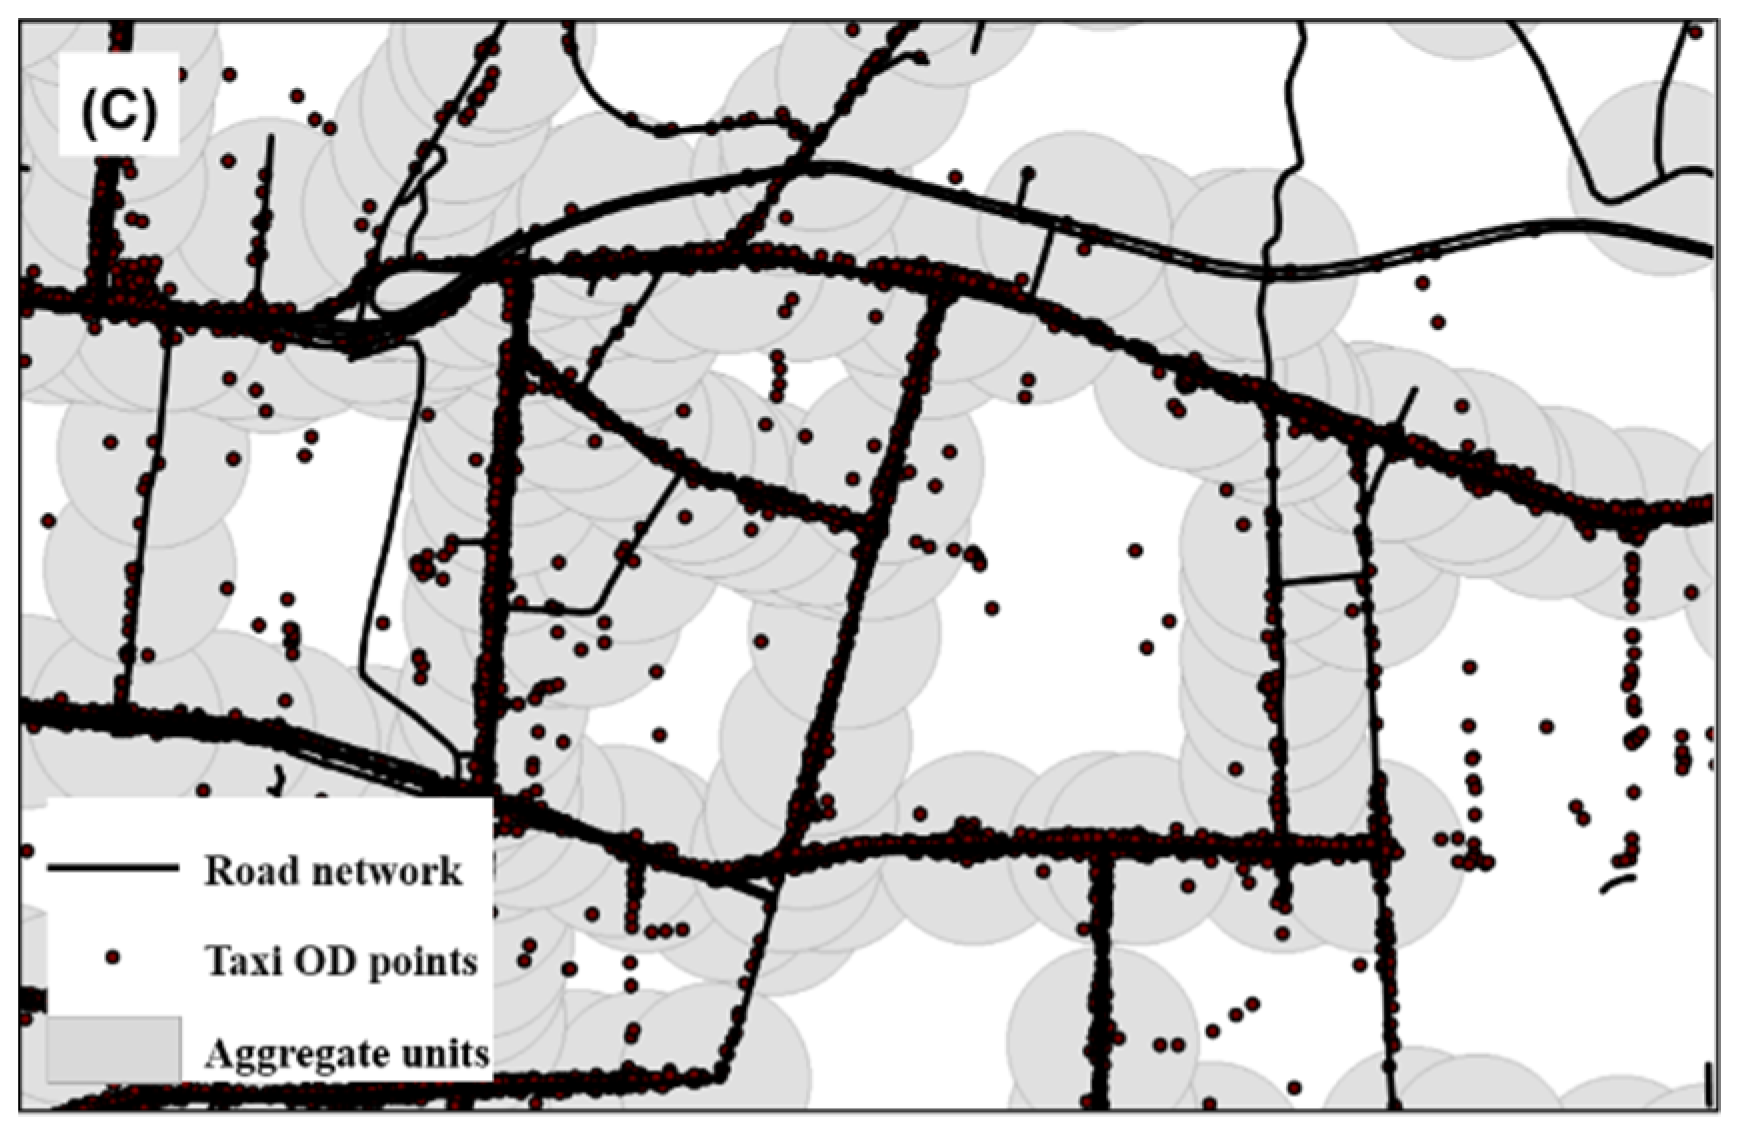
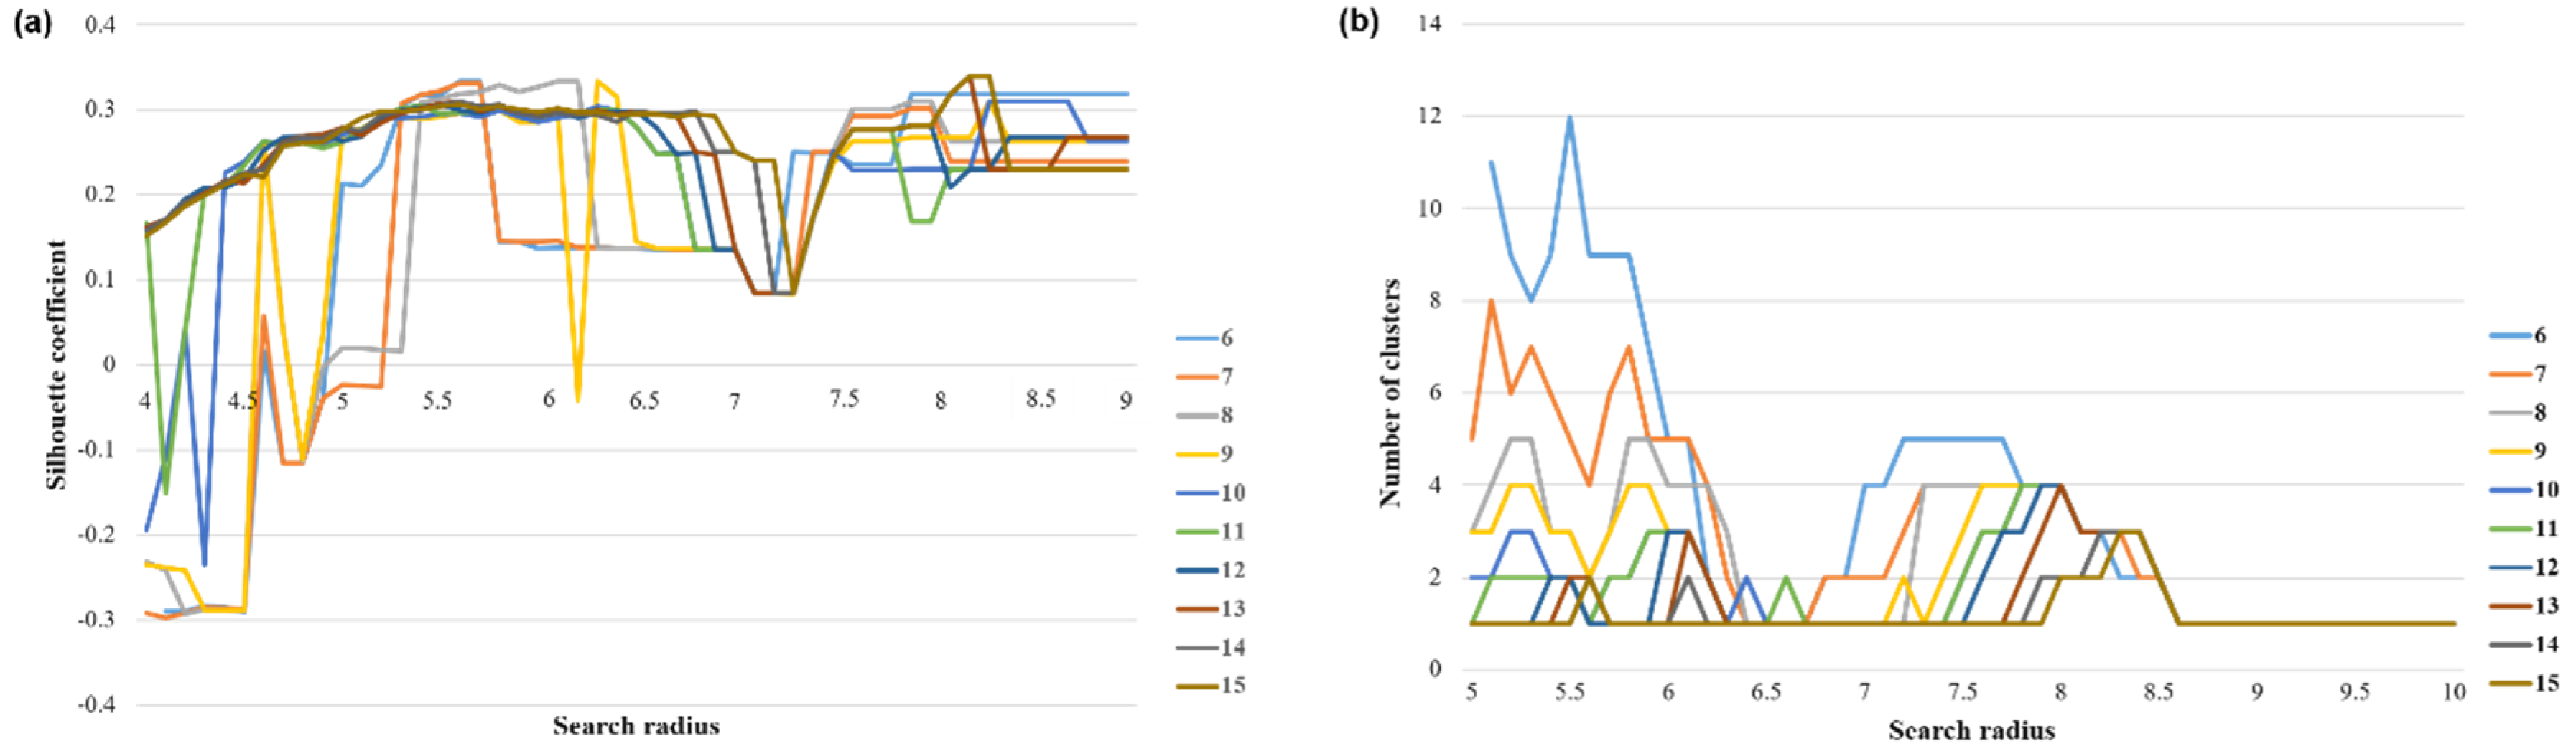
3.1. Screening the Aggregate Units
3.2. Extraction of the Spatiotemporal Travel Patterns
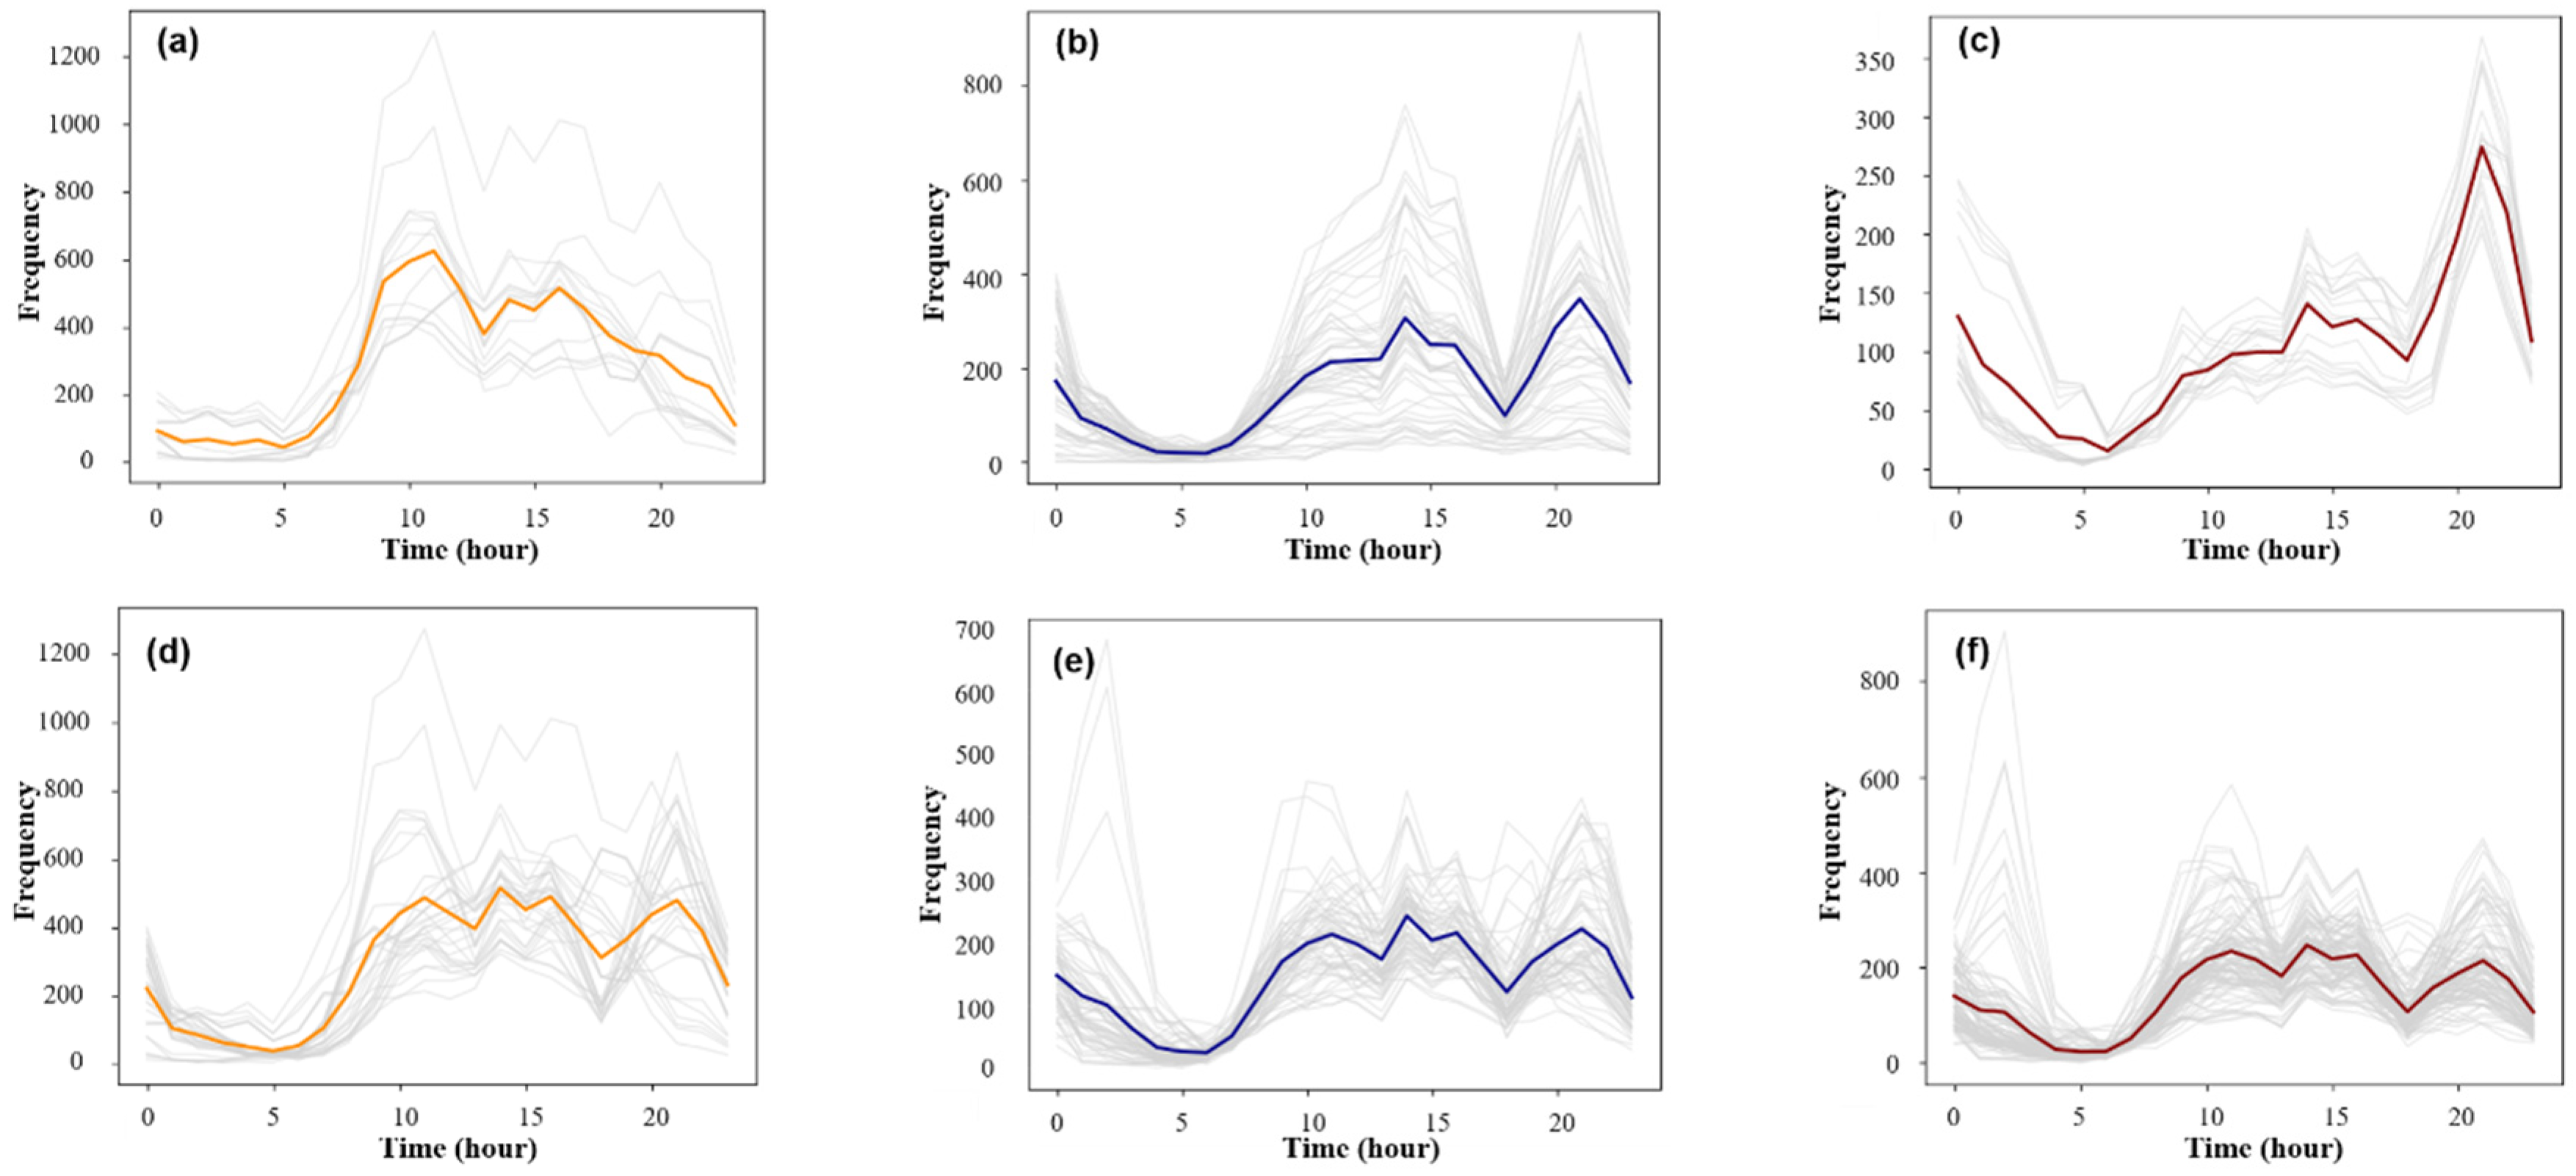
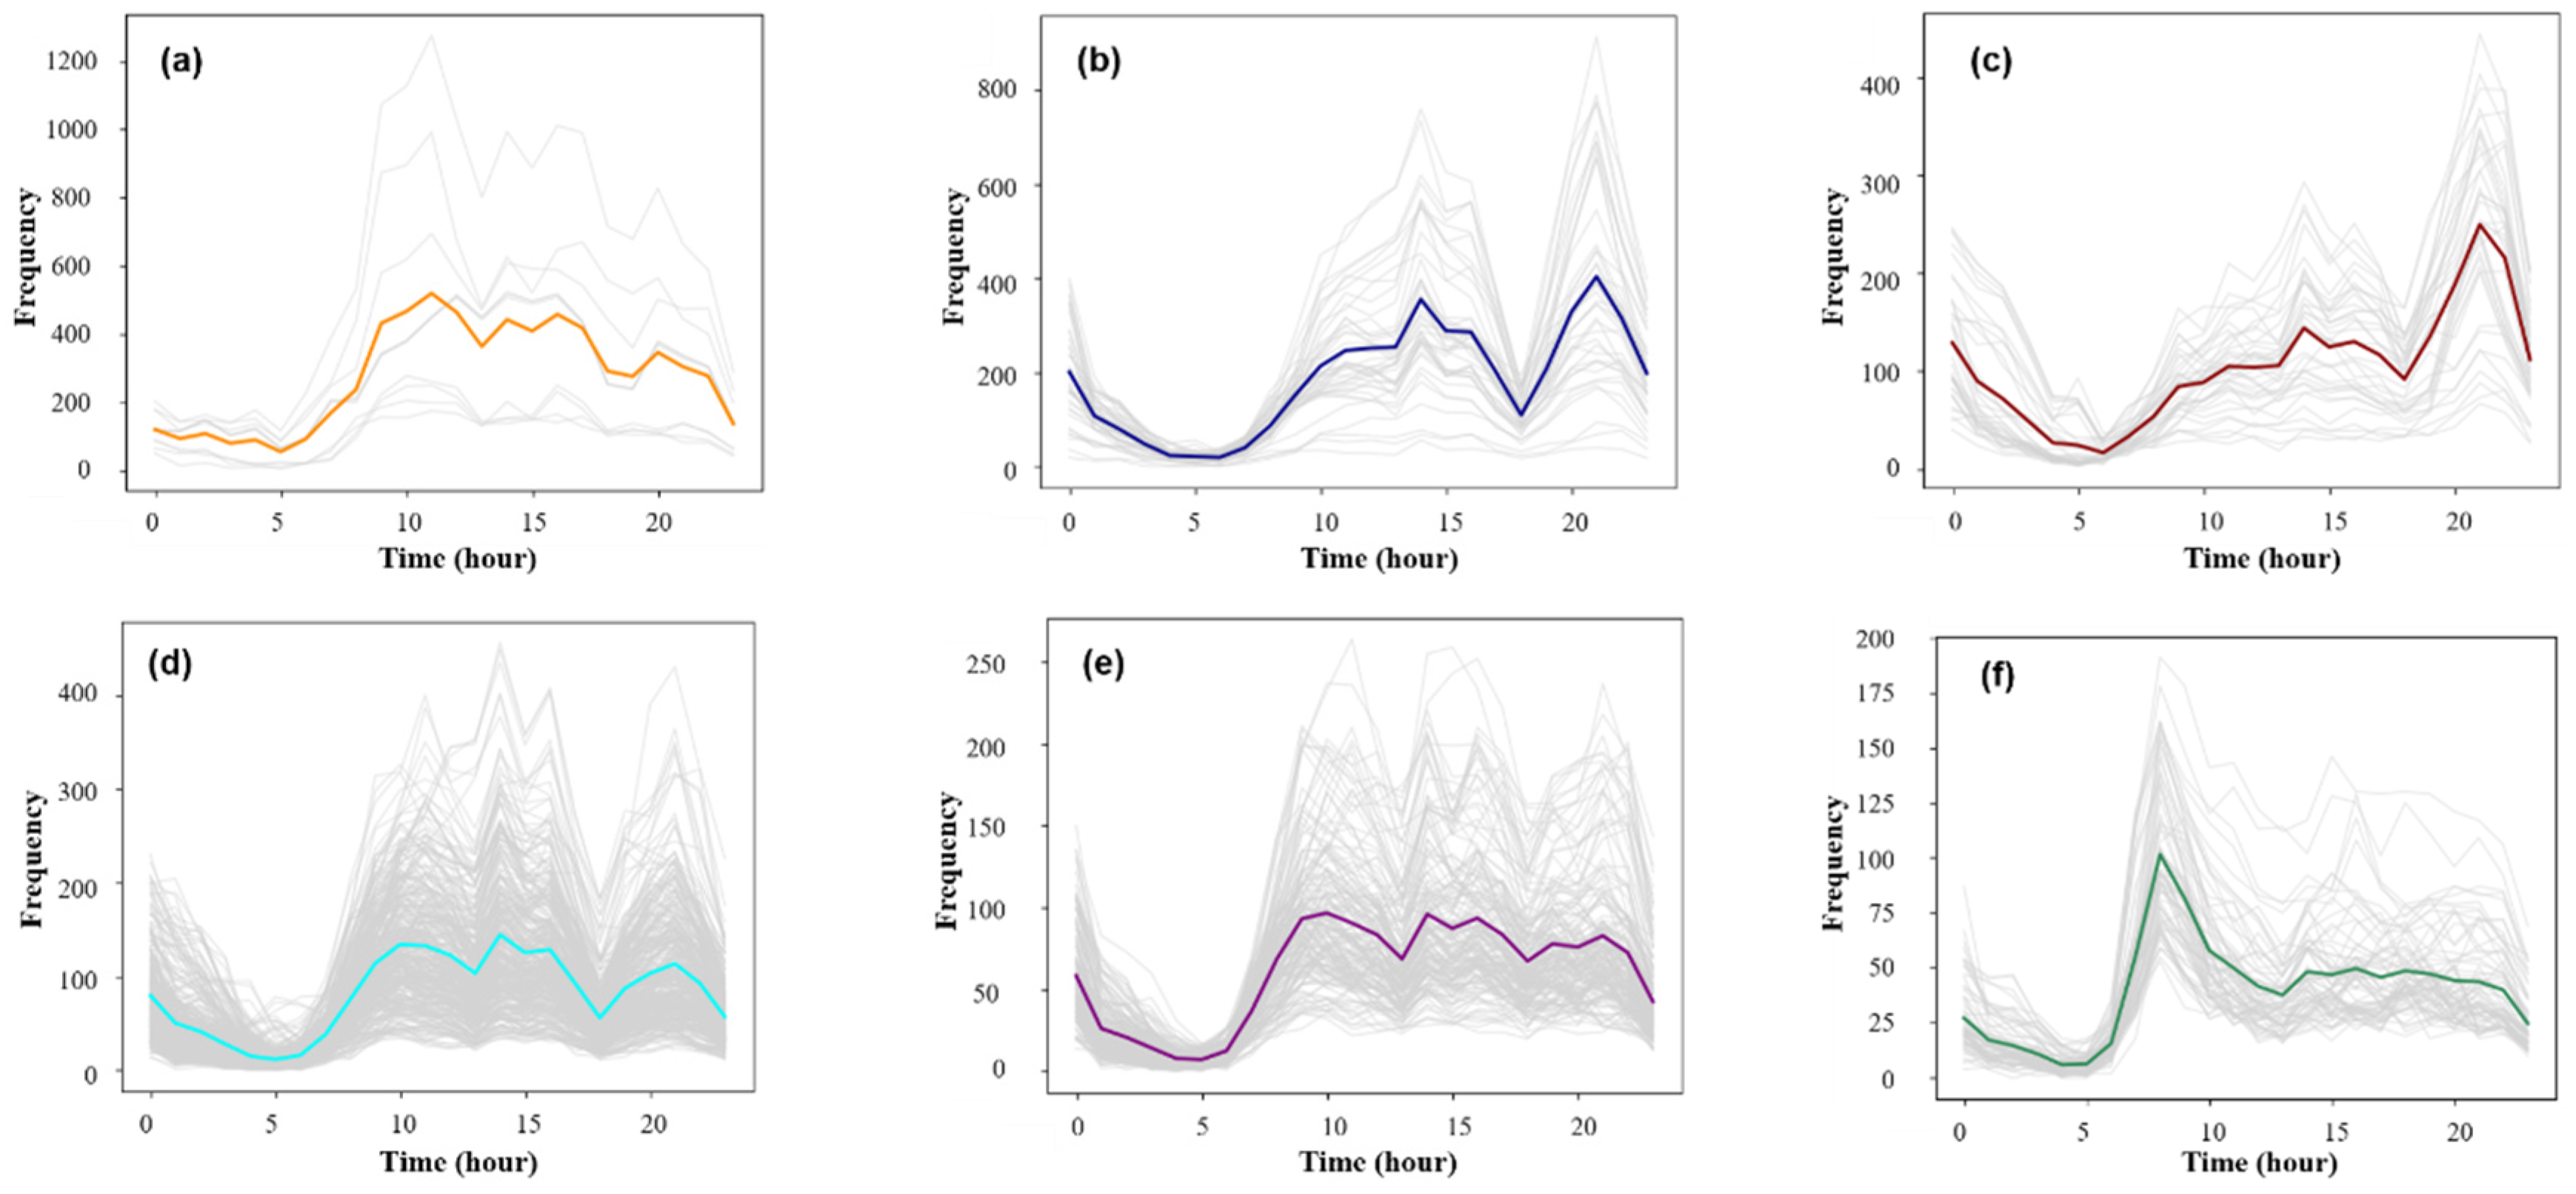
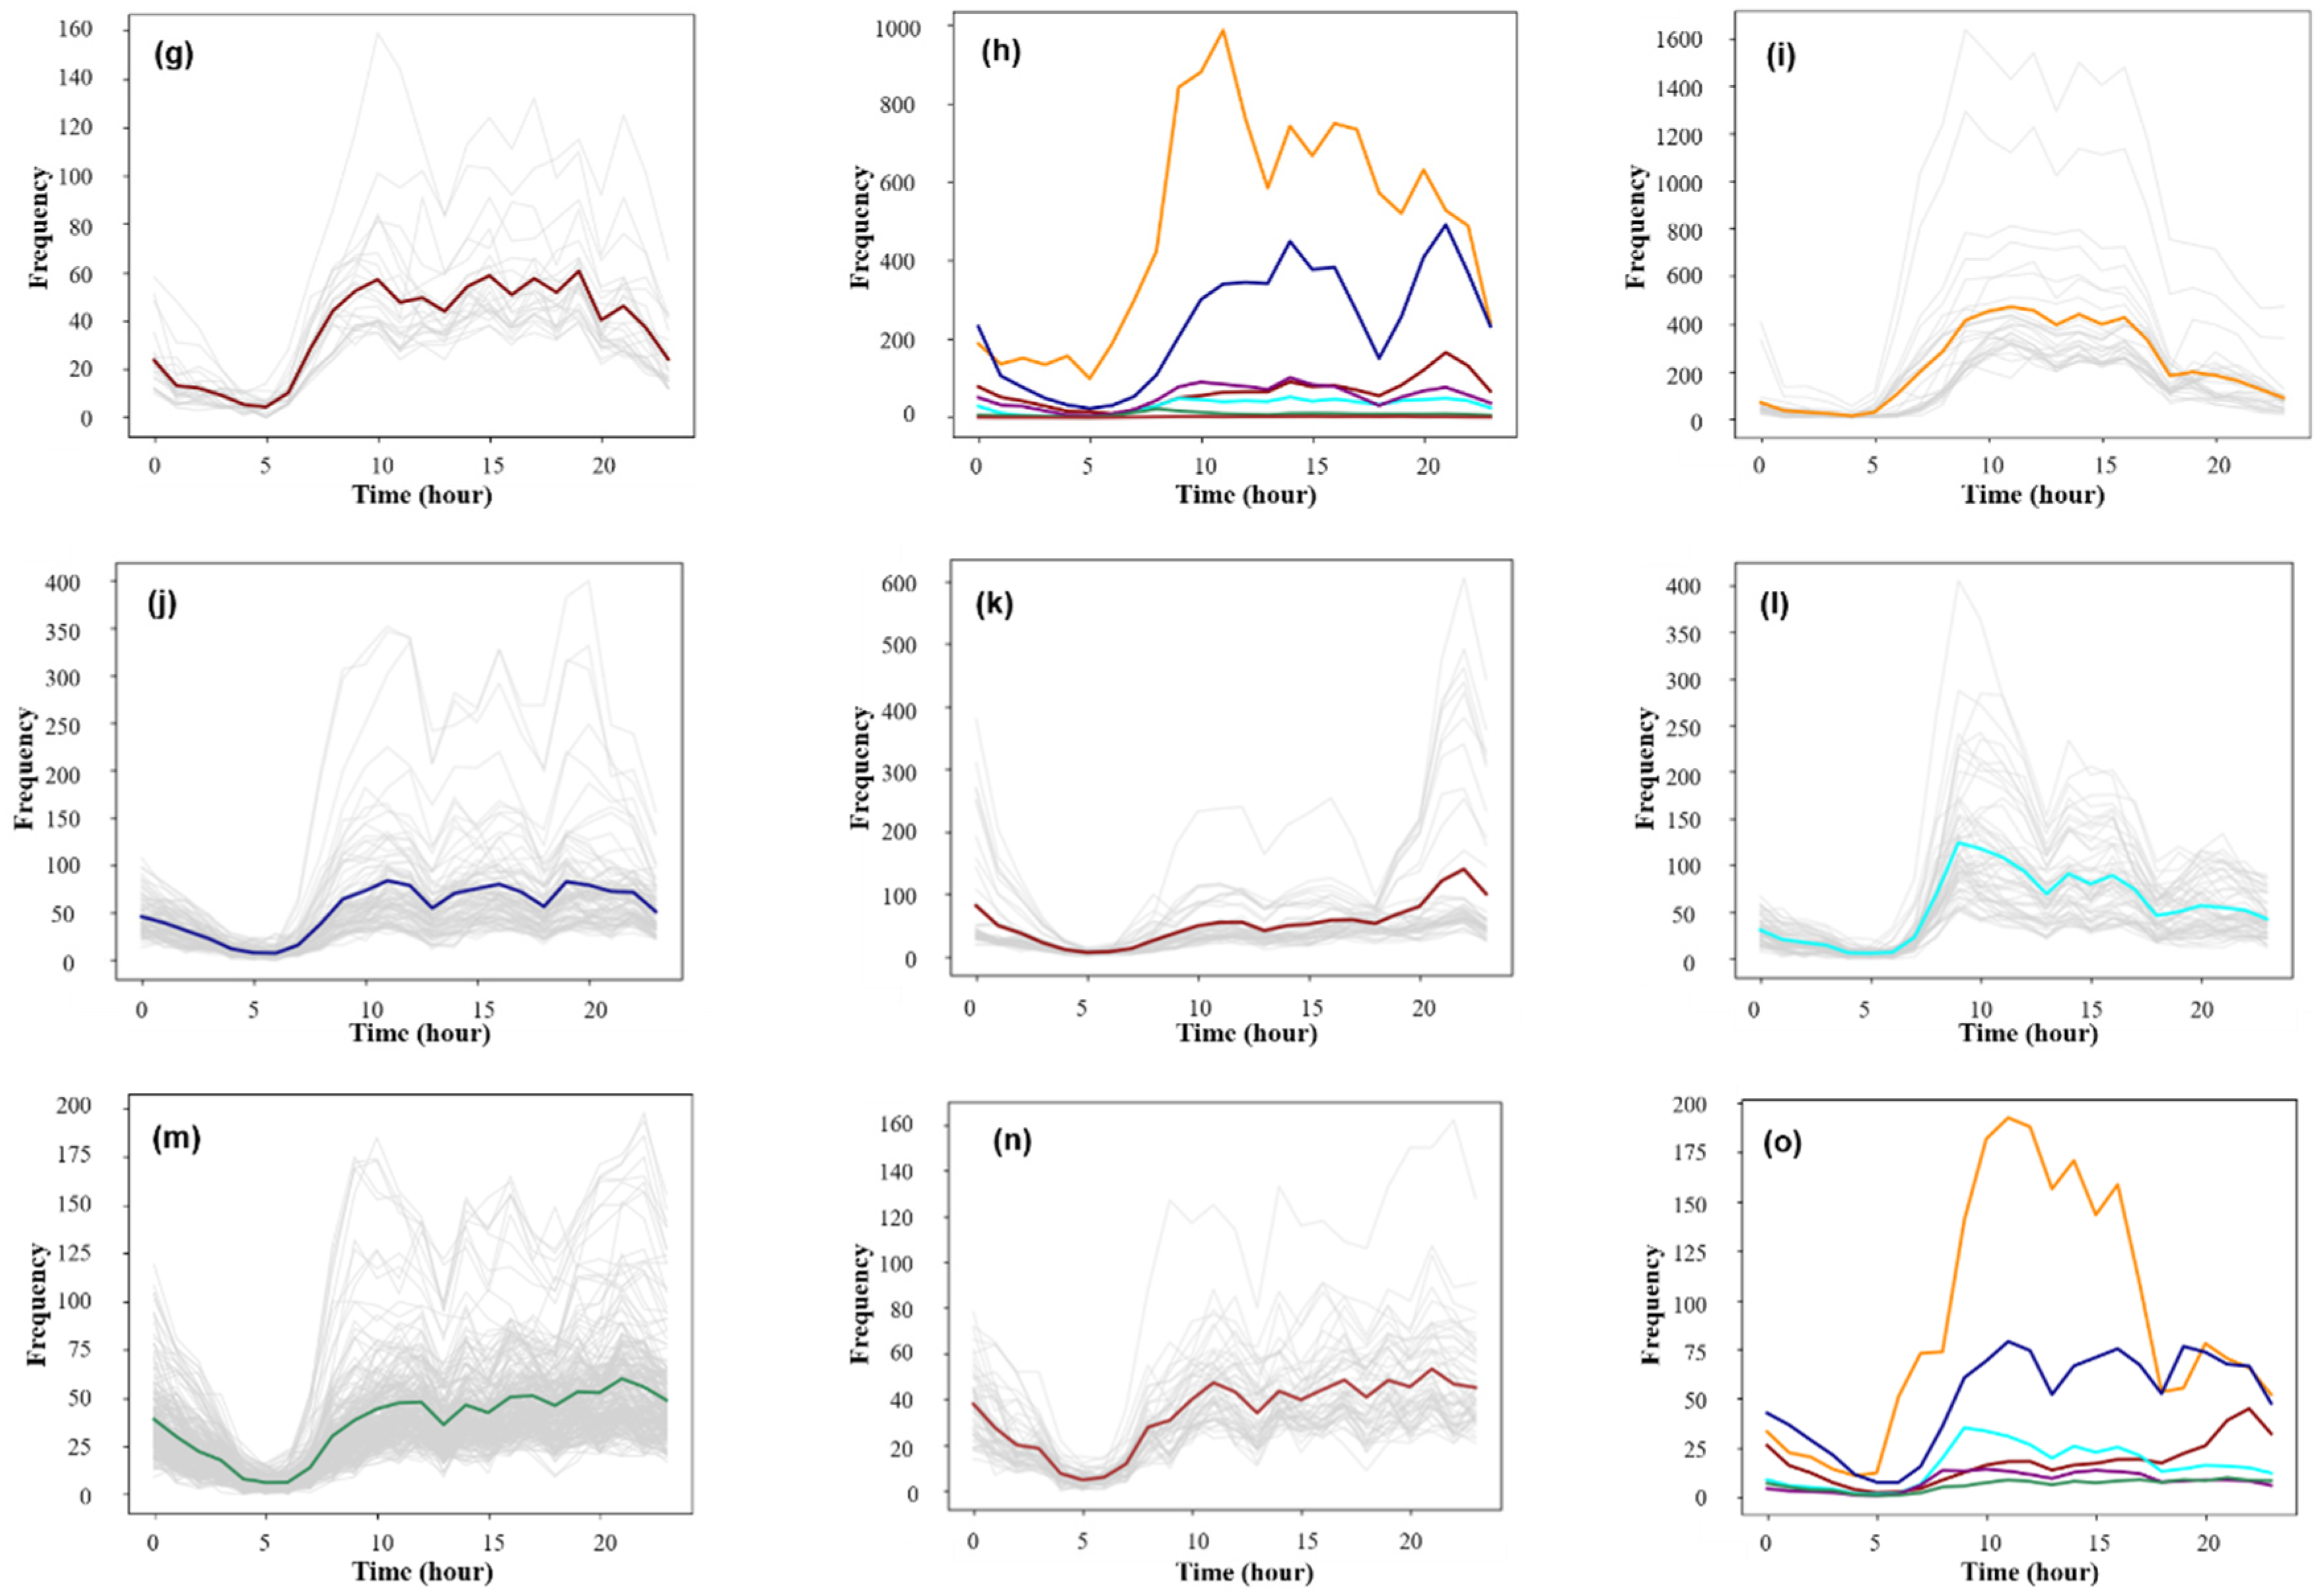
3.2.1. Classification of the Travel Time Series
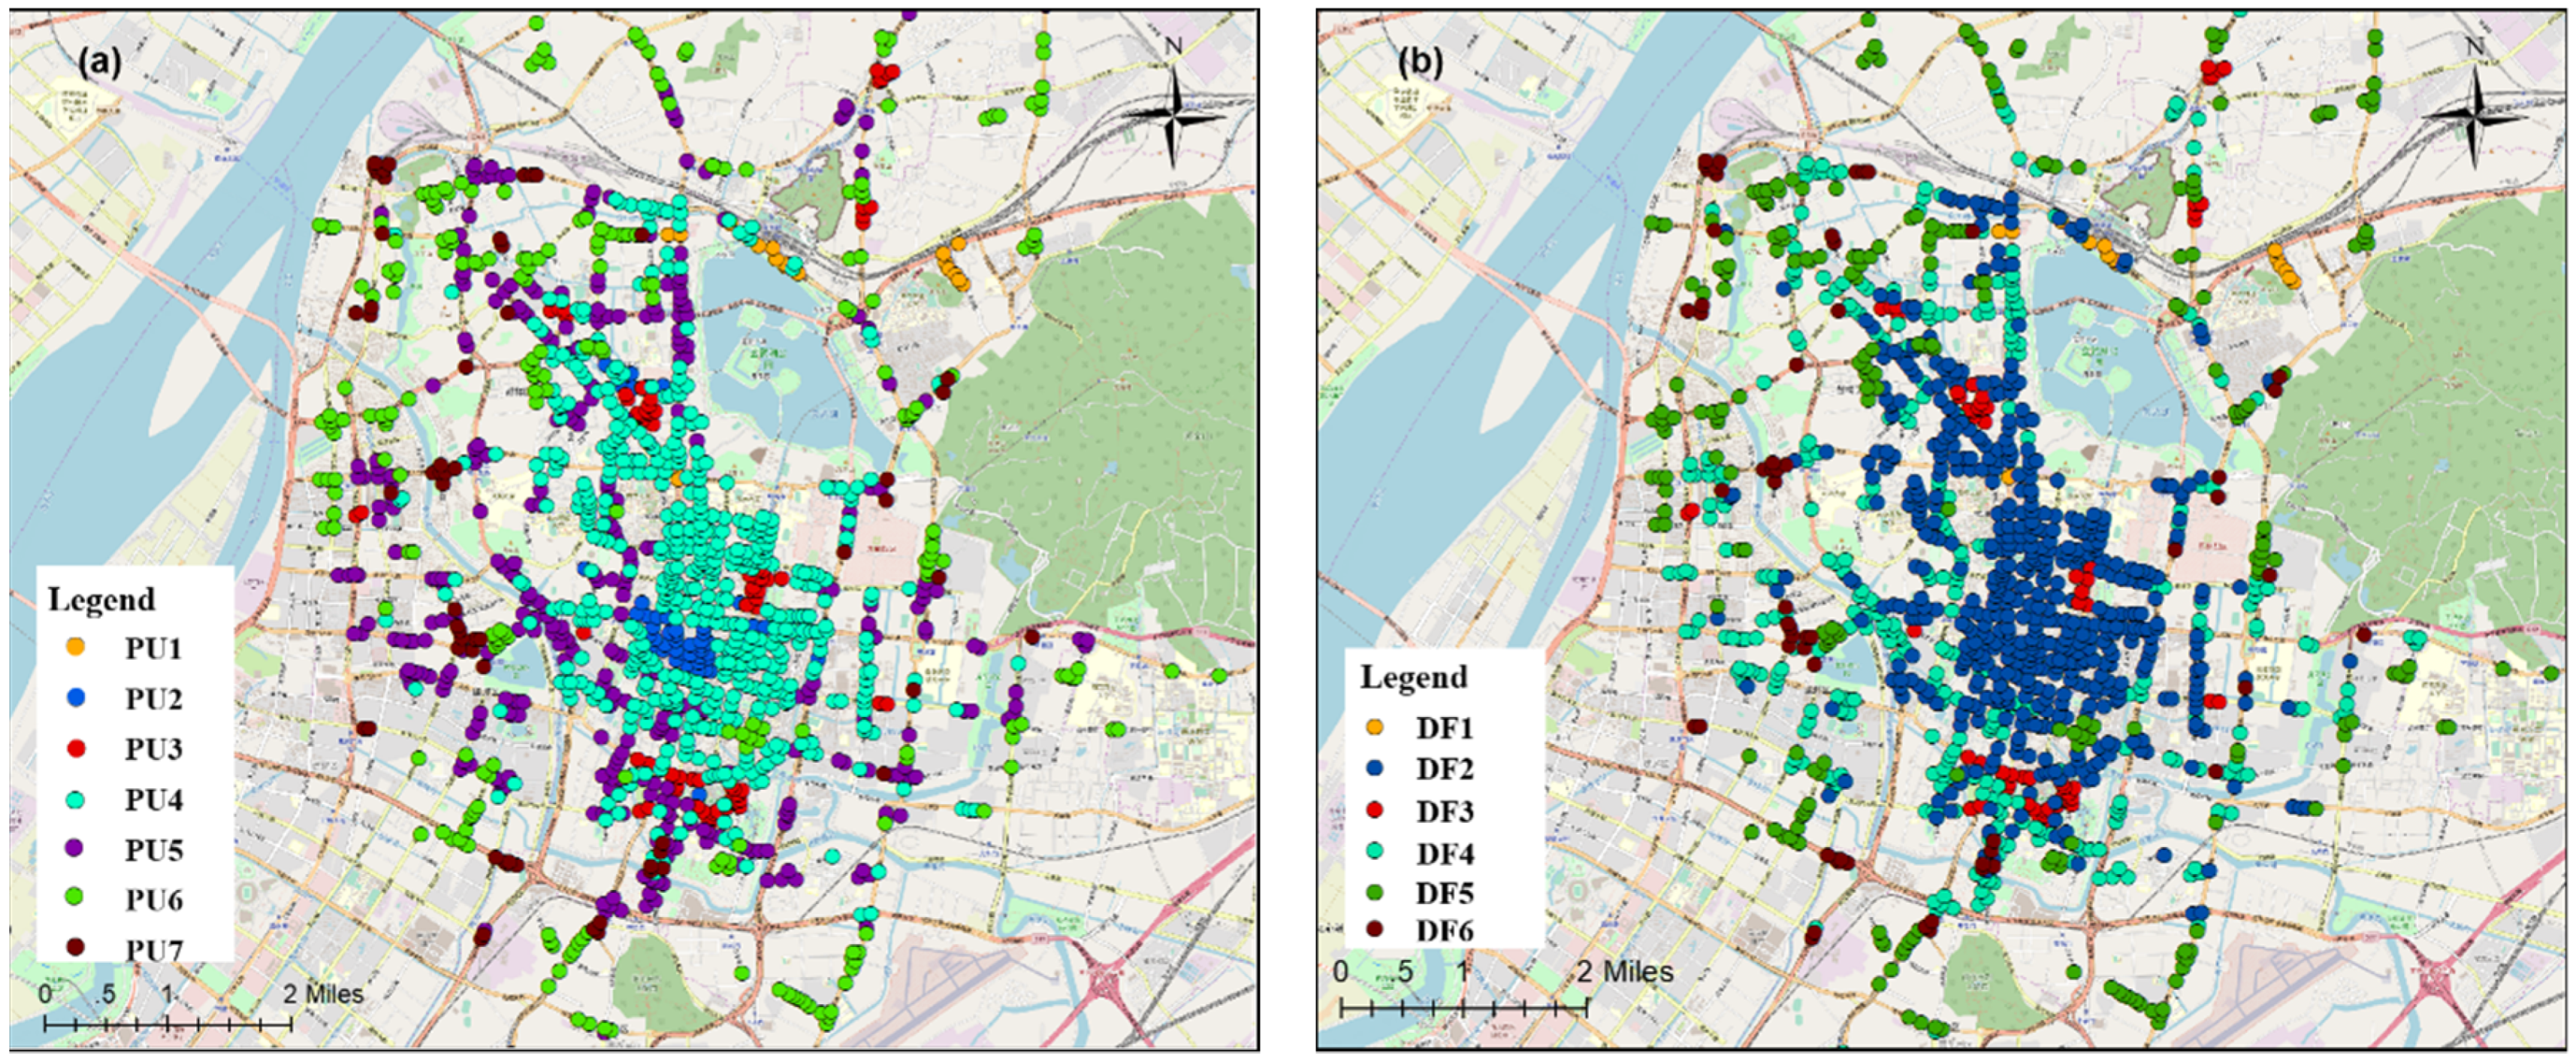
3.2.2. Spatial Distribution of the Travel Patterns
4. Discussion
5. Conclusions
- We used the DBSCAN algorithm, which can effectively eliminate noise, to cluster the taxi travel time series data, and seven departure patterns and six arrival patterns were obtained. Finally, seven human mobility patterns were delimited through spatial matching based on the aggregate units.
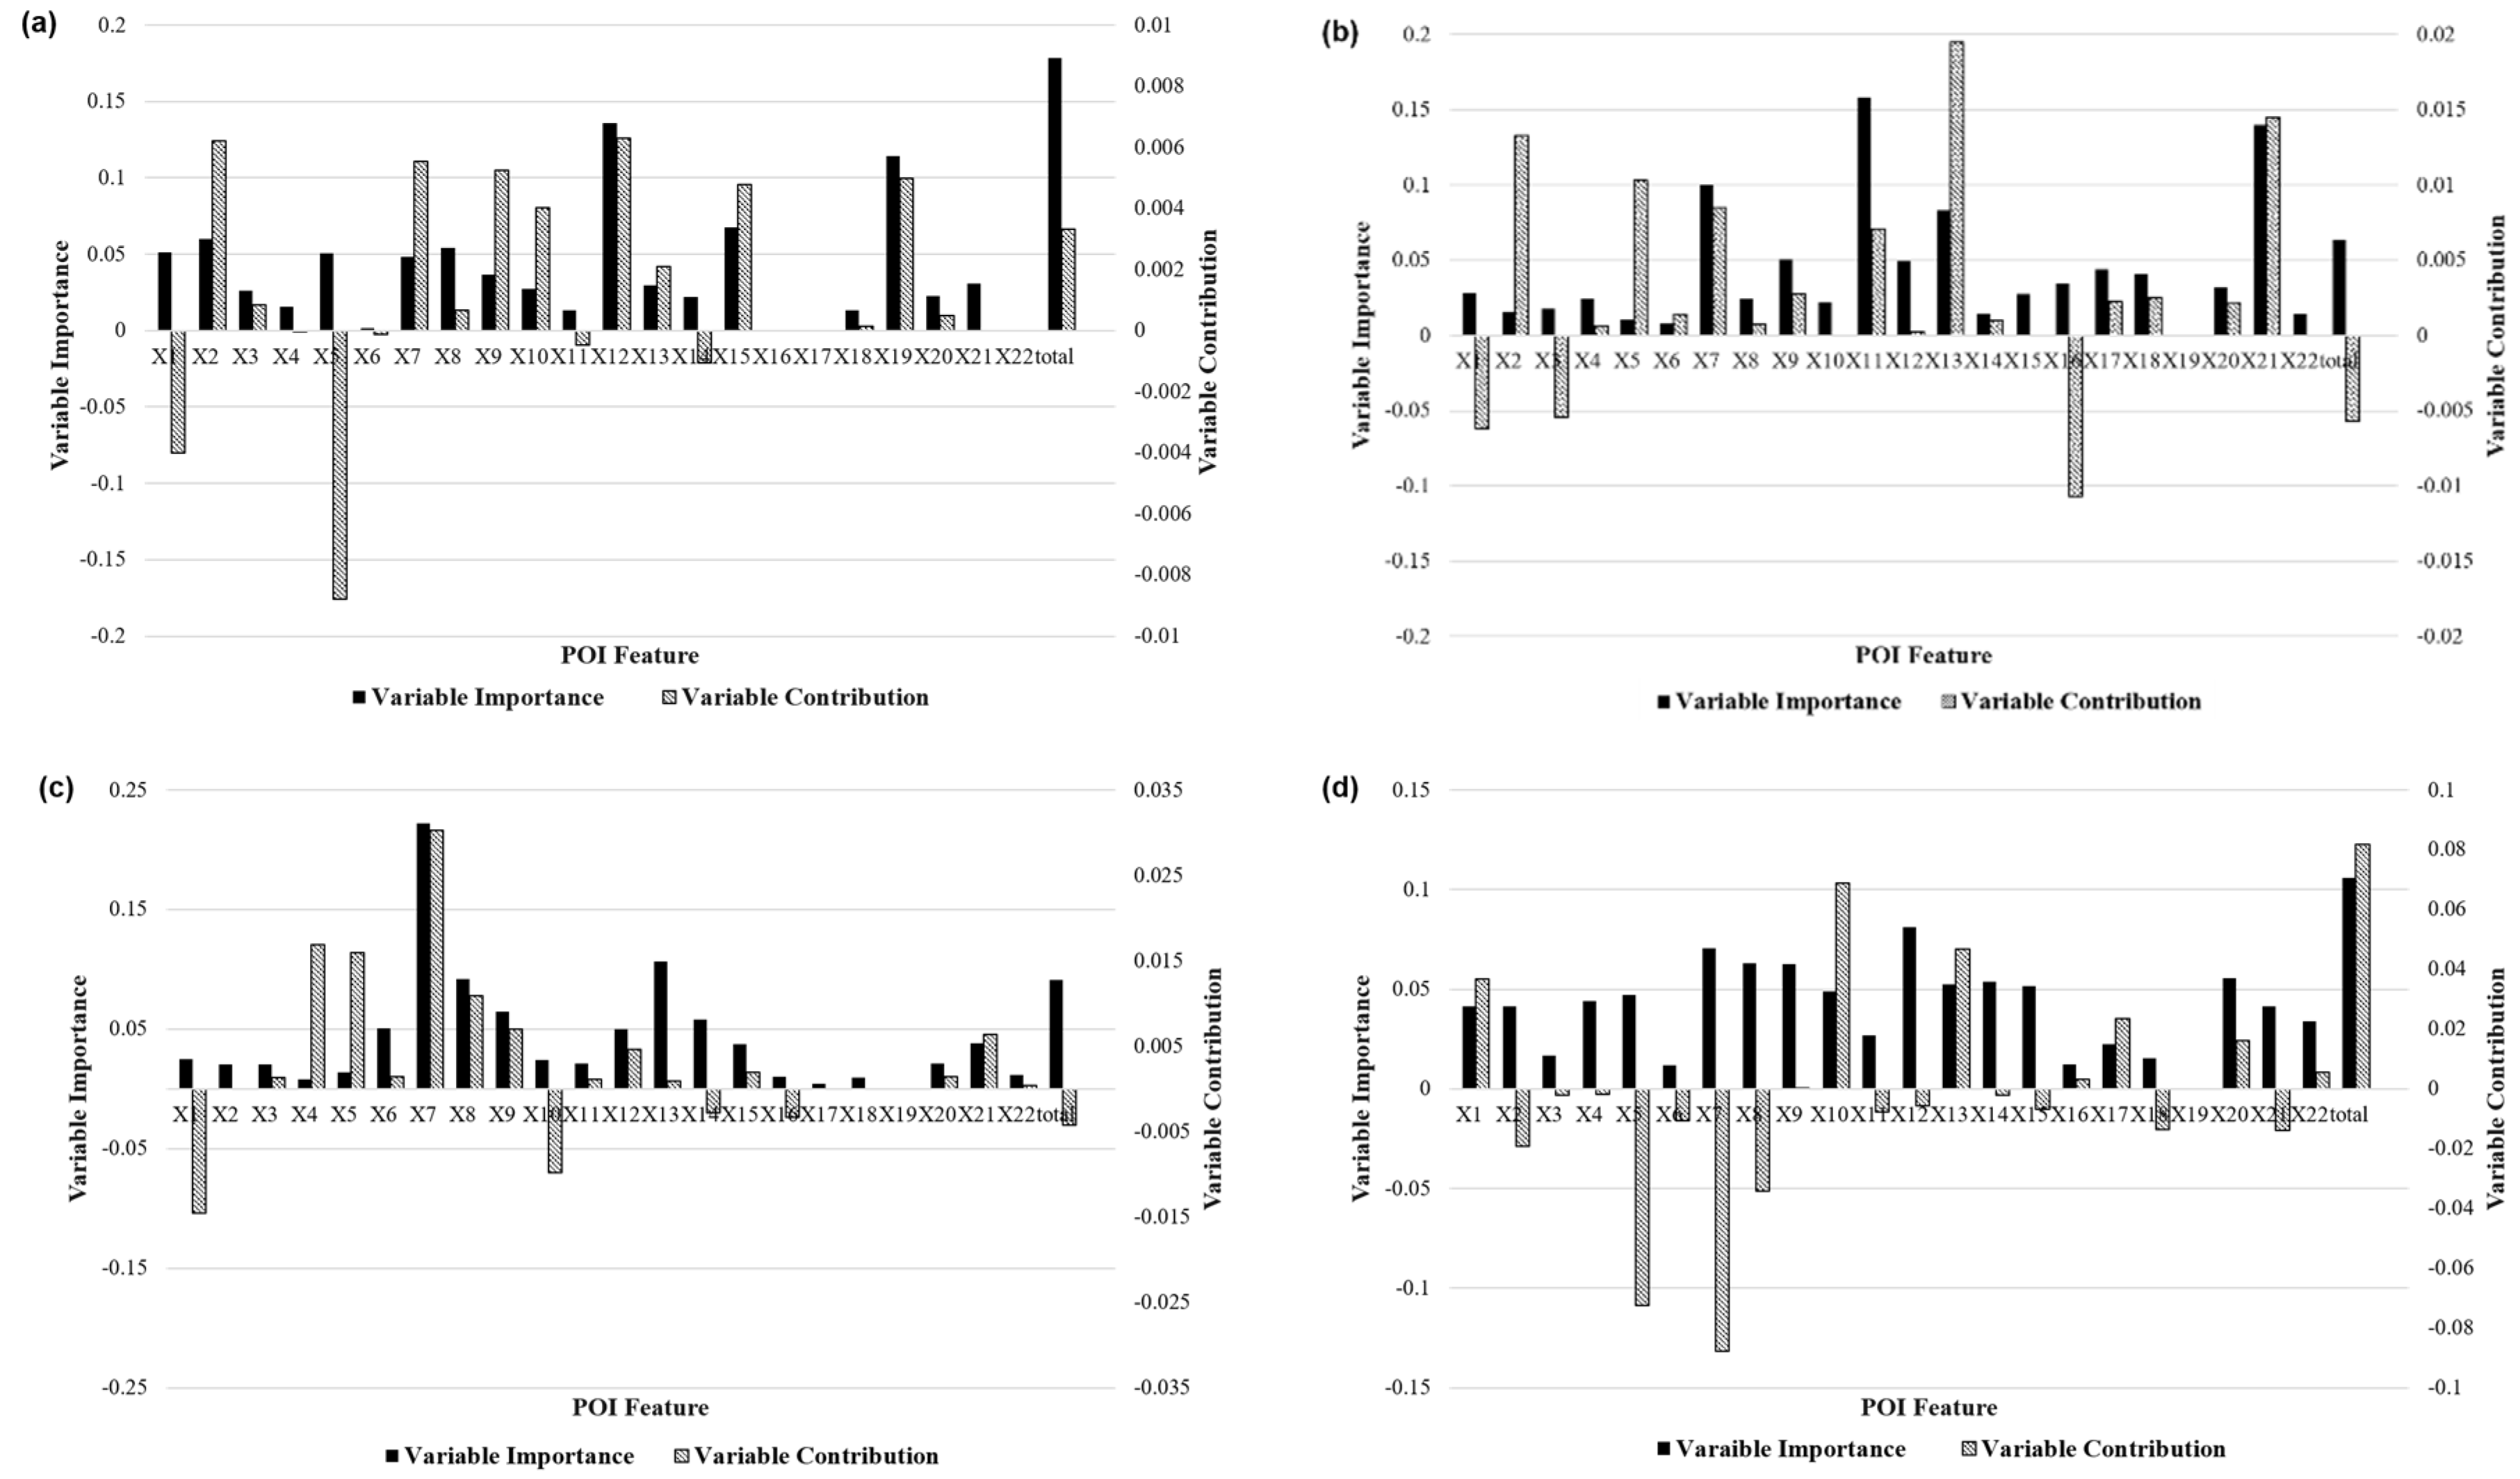
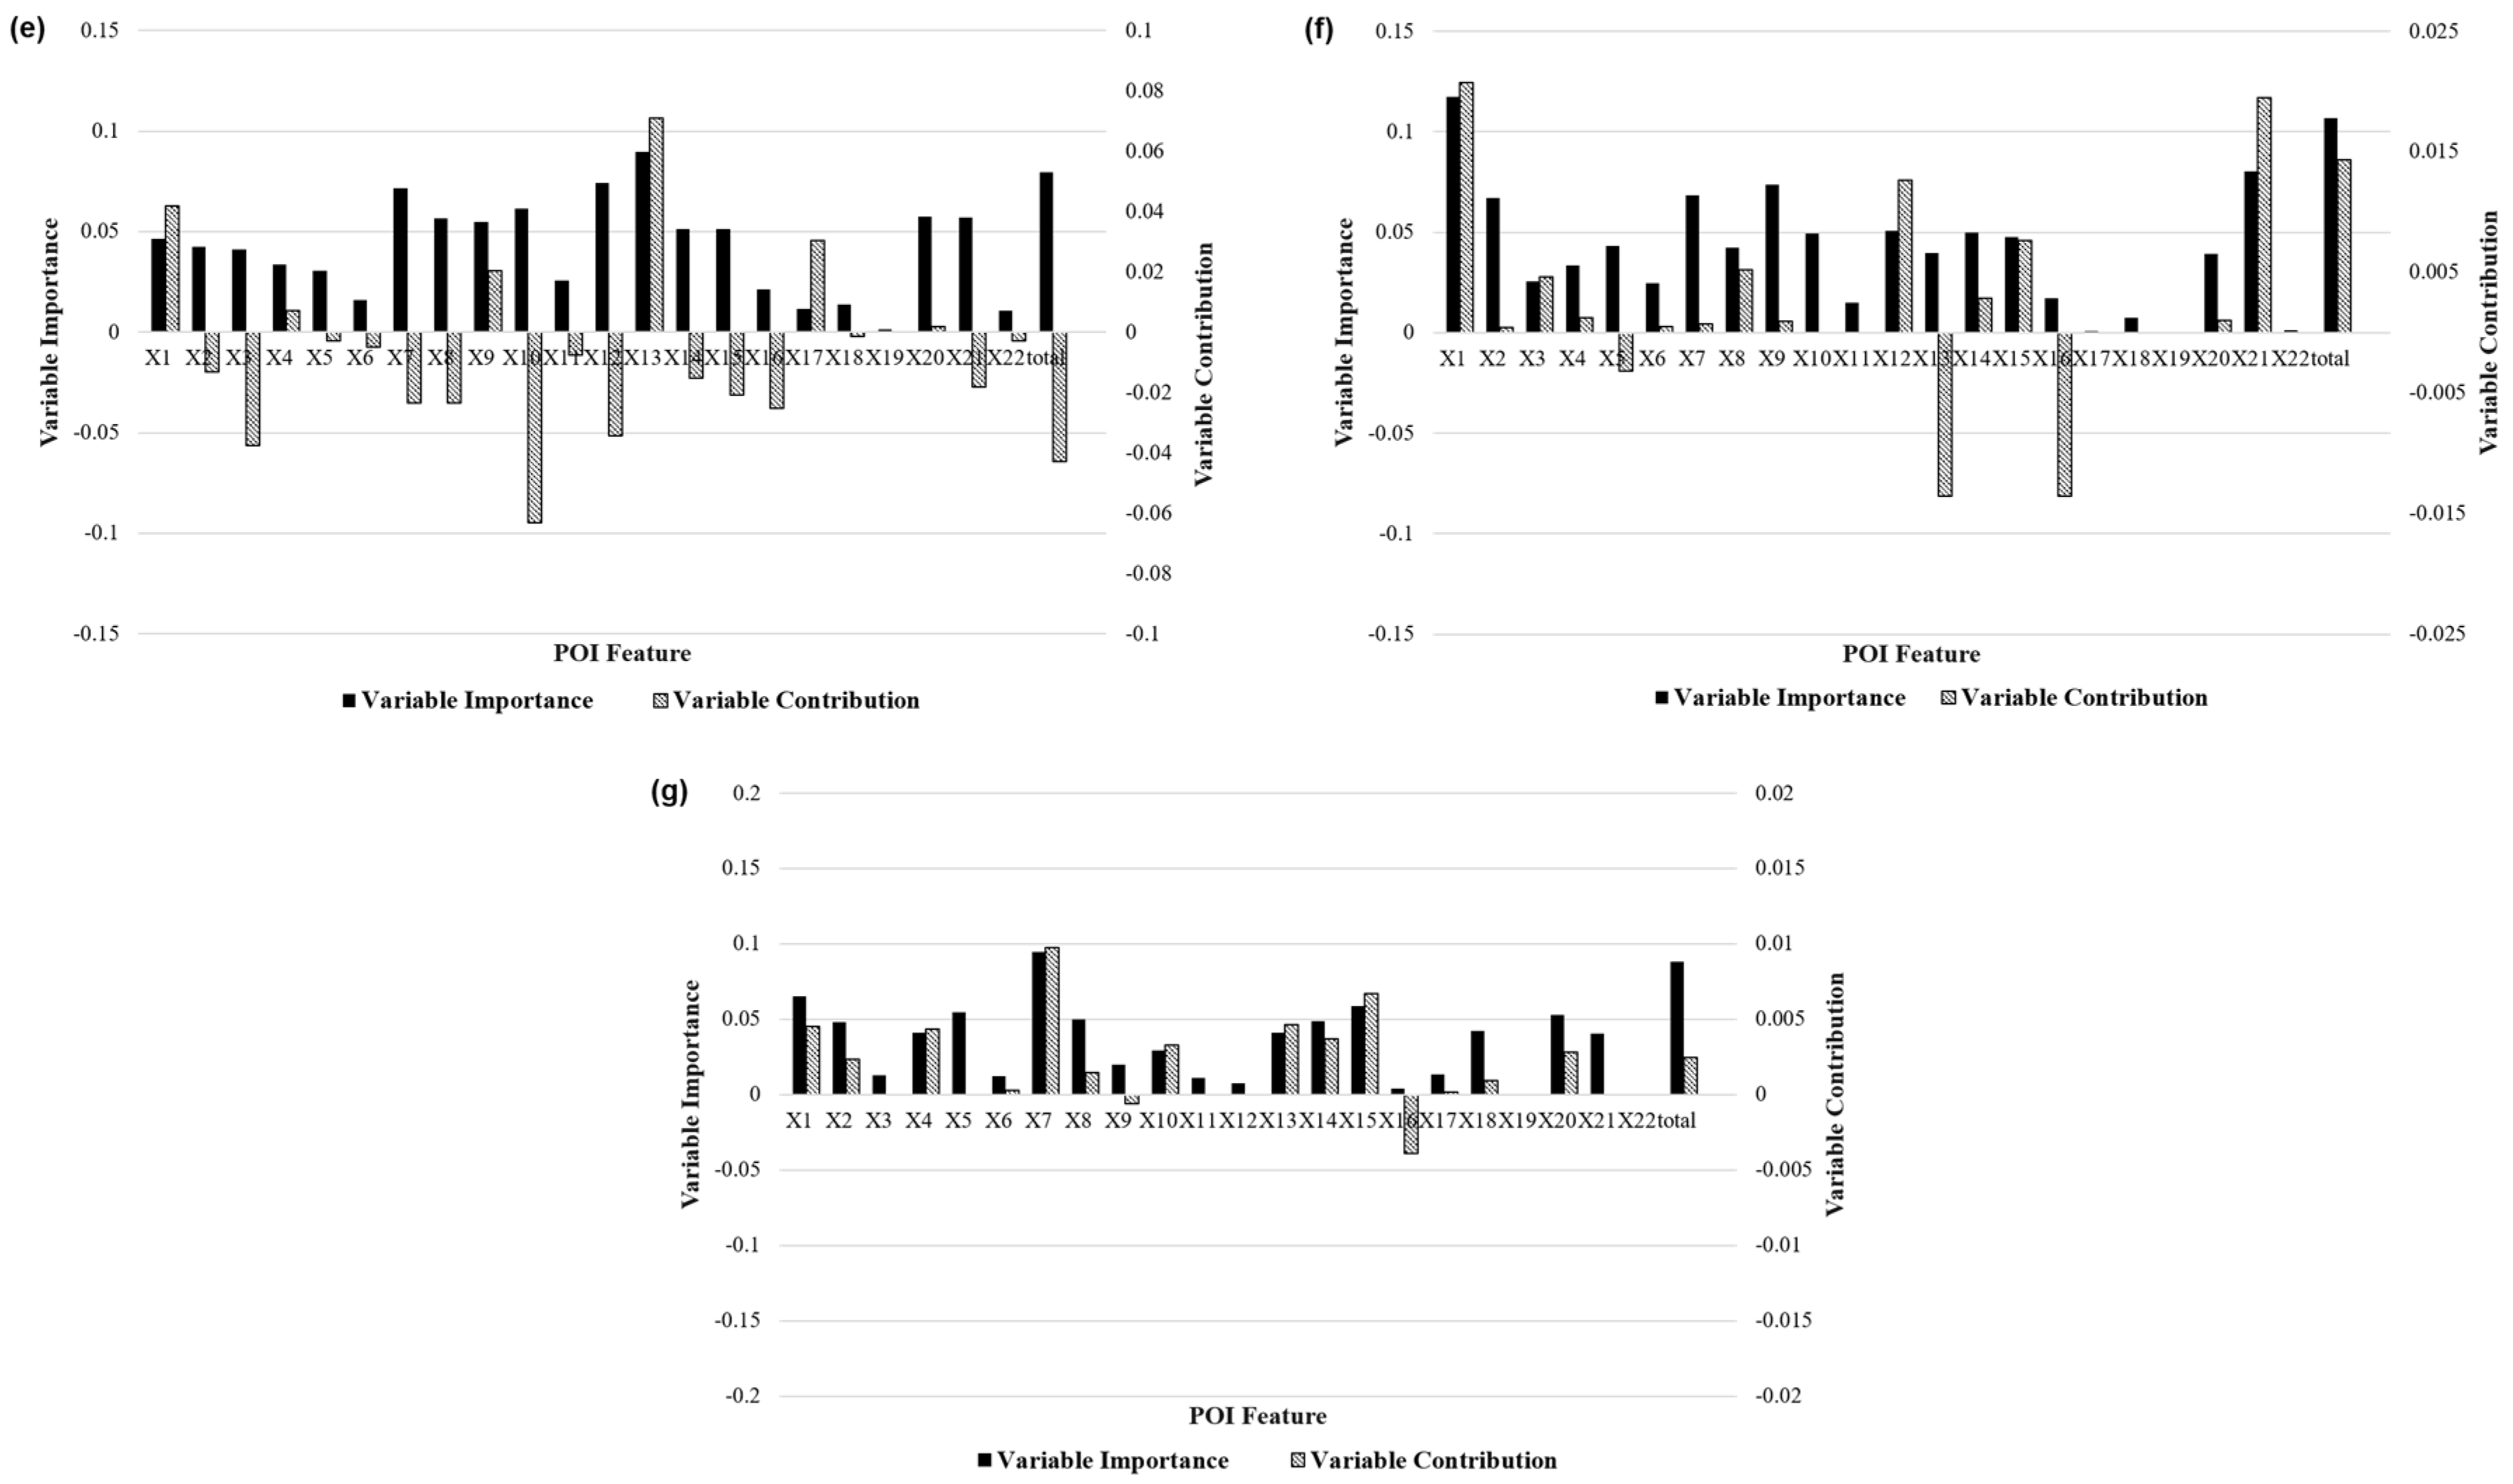
- Using the random forest algorithm, this paper established a correlation model between the mobility patterns and POI features. Using the feature importance and feature contribution measures as indicators, it was verified that the different urban regional functions had different driving mechanisms for the various taxi travel patterns.
Author Contributions
Funding
Acknowledgments
Conflicts of Interest
References
- Zheng, Y.; Liu, Y.; Yuan, J.; ** space. Ann. Tour. Res. 2003, 30, 567–580. [Google Scholar] [CrossRef]
- Shen, Y.; Chai, Y.W. Daily activity space of suburban mega-community residents in Bei**g based on GPS data. Acta Geogr. Sin. 2013, 68, 506–516. [Google Scholar]
- Peng, C.; **, X.; Wong, K.C.; Shi, M.; Liò, P. Collective human mobility pattern from taxi trips in urban area. PLoS ONE 2012, 7, e34487. [Google Scholar]
- Yuan, J.; Zheng, Y.; ** using floating car data: A network-constrained density estimation approach. J. Transp. Geogr. 2011, 19, 379–393. [Google Scholar] [CrossRef]
- Yue, Y.; Zhuang, Y.; Li, Q.; Mao, Q. Mining time-dependent attractive areas and movement patterns from taxi trajectory data. In Proceedings of the 2009 17th International Conference on Geoinformatics, Fairfax, VA, USA, 12–14 August 2009; pp. 1–6. [Google Scholar]
- Wang, H.; Zou, H.; Yue, Y.; Li, Q. Visualizing hot spot analysis result based on mashup. In Proceedings of the 2009 International Workshop on Location Based Social Networks, Seattle, WA, USA, 3 November 2009; pp. 45–48. [Google Scholar]
- Veloso, M.; Phithakkitnukoon, S.; Bento, C. Urban mobility study using taxi traces. In Proceedings of the 2011 International Workshop on Trajectory Data Mining and Analysis, Bei**g, China, 18 September 2011; pp. 23–30. [Google Scholar]
- Liu, X.; Gong, L.; Gong, Y.; Liu, Y. Revealing travel patterns and city structure with taxi trip data. J. Transp. Geogr. 2015, 43, 78–90. [Google Scholar] [CrossRef] [Green Version]
- Shen, J.; Liu, X.; Chen, M. Discovering spatial and temporal patterns from taxi-based Floating Car Data: A case study from Nan**g. Gisci. Remote Sens. 2017, 54, 617–638. [Google Scholar] [CrossRef]
- Liao, T.W. Clustering of time series data—A survey. Pattern Recognit. 2005, 38, 1857–1874. [Google Scholar] [CrossRef]
- Sankoff, D. Time warps, string edits, and macromolecules. Theory Pract. Seq. Comp. Read. 1983, 11, 356. [Google Scholar]
- Fréchet, M.M. Sur quelques points du calcul fonctionnel. Rendiconti del Circolo Matematico di Palermo (1884–1940) 1906, 22, 1–72. [Google Scholar] [Green Version]
- Chouakria, A.D.; Nagabhushan, P.N. Adaptive dissimilarity index for measuring time series proximity. Adv. Data Anal. Classif. 2007, 1, 5–21. [Google Scholar] [CrossRef]
- Hennig, C.; Hausdorf, B. Design of Dissimilarity Measures: A New Dissimilarity between Species Distribution Areas. In Data Science and Classification; Springer: Berlin/Heidelberg, Germany, 2006. [Google Scholar]
- Montero, P.; Vilar, J.A. TSclust: An R Package for Time Series Clustering. J. Stat. Softw. 2014, 62, 1–43. [Google Scholar] [CrossRef]
- Rousseeuw, P.J. Silhouettes: A graphical aid to the interpretation and validation of cluster analysis. J. Comput. Appl. Math. 1987, 20, 53–65. [Google Scholar] [CrossRef] [Green Version]
- Cutler, A.; Cutler, D.R.; Stevens, J.R. Random forests. In Ensemble Machine Learning: Methods and Applications; Springer: Berlin/Heidelberg, Germany, 2012. [Google Scholar]
- Strobl, C.; Boulesteix, A.L.; Kneib, T.; Augustin, T.; Zeileis, A. Conditional variable importance for random forests. BMC Bioinform. 2008, 9, 307. [Google Scholar] [CrossRef]
- Reif, D.M.; Motsinger, A.A.; McKinney, B.A.; Crowe, J.E.; Moore, J.H. Feature selection using a random forests classifier for the integrated analysis of multiple data types. In Proceedings of the 2006 IEEE Symposium on Computational Intelligence in Bioinformatics and Computational Biology, CIBCB’06, Toronto, ON, Canada, 28–29 September 2006. [Google Scholar]
- Khalilia, M.; Chakraborty, S.; Popescu, M. Predicting disease risks from highly imbalanced data using random forest. BMC Med. Inf. Decis. Mak. 2011, 11, 51. [Google Scholar] [CrossRef] [PubMed]
- Verikas, A.; Gelzinis, A.; Bacauskiene, M. Mining data with random forests: A survey and results of new tests. Pattern Recognit. 2011, 44, 330–349. [Google Scholar] [CrossRef]
- Kuz’min, V.E.; Polishchuk, P.G.; Artemenko, A.G.; Andronati, S.A. Interpretation of QSAR models based on random forest methods. Mol. Inf. 2011, 30, 593–603. [Google Scholar] [CrossRef] [PubMed]
- Yang, J.; Zhu, J.; Sun, Y.; Zhao, J. Delimitating Urban Commercial Central Districts by Combining Kernel Density Estimation and Road Intersections: A Case Study in Nan**g City, China. ISPRS Int. J. Geo-Inf. 2019, 8, 93. [Google Scholar] [CrossRef]


| Feature ID | Feature Description | Urban Construction Land Category |
|---|---|---|
| X1 | Residential area | Residential |
| X2 | Government agency | Administrative office |
| X3 | Cultural facilities | Cultural facility |
| X4 | School/research institute | Educational /Research |
| X5 | Hospital | Medical |
| X6 | Scenic area | Cultural relics and historic sites; religious facilities |
| X7 | Restaurant | Commercial facility |
| X8 | Hostel | Commercial facility |
| X9 | Entertainment venue | Commercial facility |
| X10 | Supermarket | Commercial facility |
| X11 | Department store | Commercial facility |
| X12 | Retail store | Commercial facility |
| X13 | Commercial Building | Commercial facility |
| X14 | Bank | Commercial facility |
| X15 | Company | Commercial facility; Industrial |
| X16 | Cinema | Recreation and wellness facilities |
| X17 | Wellness facility | Recreation and wellness facilities |
| X18 | Subway station | Urban rail transit |
| X19 | Transportation hub | Transportation hub |
| X20 | Bus station | Traffic station site |
| X21 | Parking lot | Traffic station site |
| X22 | Park/garden | Green space |
| Simulation Mode | Mode 1 | Mode 2 | Mode 3 | Mode 4 | Mode 5 | Mode 6 | Mode 7 | |
|---|---|---|---|---|---|---|---|---|
| Actual Mode | ||||||||
| Mode 1 | 7 | 0 | 0 | 1 | 1 | 0 | 0 | |
| Mode 2 | 0 | 9 | 0 | 0 | 6 | 0 | 0 | |
| Mode 3 | 0 | 0 | 7 | 0 | 5 | 0 | 0 | |
| Mode 4 | 0 | 0 | 0 | 22 | 14 | 1 | 1 | |
| Mode 5 | 0 | 0 | 0 | 15 | 92 | 4 | 0 | |
| Mode 6 | 0 | 0 | 0 | 1 | 2 | 15 | 0 | |
| Mode 7 | 0 | 0 | 0 | 3 | 3 | 1 | 2 | |
| Mode | Precision | Recall | F1-Score | Support |
|---|---|---|---|---|
| Mode 1 | 1.00 | 0.78 | 0.88 | 9 |
| Mode 2 | 1.00 | 0.60 | 0.75 | 15 |
| Mode 3 | 1.00 | 0.58 | 0.74 | 12 |
| Mode 4 | 0.52 | 0.58 | 0.55 | 38 |
| Mode 5 | 0.75 | 0.83 | 0.79 | 111 |
| Mode 6 | 0.71 | 0.83 | 0.77 | 18 |
| Mode 7 | 0.67 | 0.22 | 0.33 | 9 |
| Weighted average | 0.74 | 0.73 | 0.72 | 212 |
© 2019 by the authors. Licensee MDPI, Basel, Switzerland. This article is an open access article distributed under the terms and conditions of the Creative Commons Attribution (CC BY) license (http://creativecommons.org/licenses/by/4.0/).
Share and Cite
Yang, J.; Sun, Y.; Shang, B.; Wang, L.; Zhu, J. Understanding Collective Human Mobility Spatiotemporal Patterns on Weekdays from Taxi Origin-Destination Point Data. Sensors 2019, 19, 2812. https://doi.org/10.3390/s19122812
Yang J, Sun Y, Shang B, Wang L, Zhu J. Understanding Collective Human Mobility Spatiotemporal Patterns on Weekdays from Taxi Origin-Destination Point Data. Sensors. 2019; 19(12):2812. https://doi.org/10.3390/s19122812
Chicago/Turabian StyleYang, **g, Yizhong Sun, Bowen Shang, Lei Wang, and Jie Zhu. 2019. "Understanding Collective Human Mobility Spatiotemporal Patterns on Weekdays from Taxi Origin-Destination Point Data" Sensors 19, no. 12: 2812. https://doi.org/10.3390/s19122812