1. Introduction
As electricity distribution grids are being developed, the need for metering has increased. In 1977, Paraskevakos [
1] presented the first automatic and commercialized remote meter. Nevertheless, the concept of remote and smart metering was not considered for many years. Many concerns in recent years have arisen, including climate change, trends in the electricity markets, efficiency, and the promotion of renewable energy resources. In addition, other active agents in power systems are promoting distributed grids with distributed storage. This drastic change requires an evolution in the actual electricity model [
2].
The core of the smart grid concept resides in an electricity grid model able to treat different energy sources in an efficient and decentralised manner. The capability for a new metering system or smart metering will manage this smart grid. Smart metering or an intelligent metering system is defined as “an electronic system that can measure energy consumption, providing more information than a conventional meter, and can transmit and receive data using a form of electronic communication.” This definition was established by the European Parliament in its 2012/27/EC directive [
3]. The implementation of the energy efficiency directive can be found in [
4].
This implementation of the energy efficiency directive is a consequence of the transition of power grids from centralised generation to distributed generation, motivated by global trends in environmentally friendly power generation systems. This is possible if the real state of the grids is known. This requires fine-grained knowledge of the state itself. The concept of the smart grid allows for the delivery of electricity in a controlled system.
A smart grid is an electric grid that joins points of generation to points of consumption, which recognize the real state of the net. Since a smart grid is conceived to deliver electricity, the consequence is the emergence of new and develo** technologies in power generation, transmission, and distribution. This can be considered as a class of technology driven by recent advances in renewable energy sources and modern communications and computation technologies [
5]. The electric grid is more than a generation and transmission infrastructure. It is an ecosystem with assets from government, providers, manufacturers, and owners. This technology set up three foundations: advanced renewable energy sources, control systems, and computer processing [
6]. These advanced technologies must be composed with advanced sensors known as advanced measurement units or multipurpose network analysers and smart meters [
7], allowing operators to assess grid stability and provide consumers with better information including automatically reported outages. The system includes relays that sense and recover from faults at a substation automatically, automated feeder switches that reroute power around problems, and batteries that store excess energy and make it available later to the grid to meet customer demand.
Many studies have highlighted the advantages derived from the progressive development of distributed generation systems, smart grids, and microgrids [
8,
9]. Under this new paradigm, some authors have drawn attention to the importance of develo** new sensors and tools for the real-time monitoring and control of the energy flow and power quality. For example, in [
10] the residential power consumption is modelled using smart meters and data mining techniques. Other researchers have proposed systems for real-time detection and classification of power quality disturbances in smart grids [
11]. These smart metering systems are often integrated with computing and communication technologies to enhance efficiency and reliability of future power systems with renewable energy resources [
12]. Further, smart meters include efficient control and processing algorithms [
13]. In [
14] smart handheld devices were used to perform the real-time monitoring and fuzzy control strategies of an intelligent windowsill system in a smart home. In [
15] neural network and swarm intelligence approaches were successfully applied to analyze the dynamic operation and control strategies for a microgrid hybrid power supply systems. Moreover, the system stability has also been considered in by some researchers. In [
16] it was proposed a direct building algorithm for microgrid distribution ground fault analysis that consider the network topology changes. The topological characteristics of the microgrid are also considered in [
17], where it was proposed an unsymmetrical faults analysis method with hybrid compensation for microgrid distribution systems. In [
18] it was proposed an optimization algorithm to manage real-time congestions using all power system capabilities.
Complex networks and the advance of electronic devices have inspired the power quality (PQ) concept [
19], that is, the measurement of the amount of disturbance in the electricity supply, which is later assessed. Millions and millions of electronic devices are plugged into the grid, affecting the global grid. Most PQ problems result from grid-connected distributed generations. In addition, nonlinear electronic loads introduce PQ disturbances into the grid because electric car chargers, rectifiers, lighting, switch-mode power supplies, and other power electronic devices are commonly used [
20].
PQ disturbances such as swell, sag, interruption, oscillatory transients, flicker, and harmonic distortion are becoming challenging issues for power systems. Modulated power sinusoids have also been detected. Both can manifest as steady-state or transient states. These disturbances may impose penalties on consumers by adding reactive power, redispatch costs, and load curtailment costs. Moreover, these PQ problems can overheat the transformers, damage capacitor banks, and affect sensitive electronic equipment [
21]. Owing to the increase of these issues, scientists and engineers have started to study them through significant number of PQ studies [
22,
23,
24,
25]. Electric power quality monitoring has become an essential part of these studies [
26].
Mitigating actions against power quality disturbances must be taken, and their sources and causes must be identified accurately as well. Power quality disturbances must be detected, recognized, and classified [
27,
28]. Engineers have to select the appropriate technique for extracting any power quality disturbance in order to recognise and classify them. In recent years, many techniques (apart from Fourier and Short Time Fourier Transform) have been implemented for extracting these features of power quality disturbances, including the S-transform [
29] where a new detection and classification method of power quality disturbances based on S-transform, interpolating windowed fast Fourier transform (FFT), and probabilistic neural network (PNN) was proposed; wavelet transform [
30] where wavelets and fuzzy support vector machines are used to automated detect and classify power quality (PQ) disturbances; Kalman filters [
31] where a practical model describes the behavior of electric arc furnaces in the simulation of power system for power quality issues; Gabor transform and Wigner distribution function [
32] where improved Gabor-Wigner transform algorithm is studied and applied to power quality disturbance detection; empirical mode decomposition [
33] where performance comparisons of Support Vector Machine (SVM) and different classification method for power quality disturbance classification is presented; compressive sensing (CS) [
34] where a new approach for classifying multiple power quality disturbances (PQD) is presented; curvelet [
35] where a new scheme based on curvelet transform and support vector machine is proposed; Hilbert transform [
36] where a new classification method of transient disturbance based on Hilbert transform and classification trees is proposed; Hilbert-Huang transform [
37] where the power quality in the distribution network is considered to characterize power signal disturbances; and hybrid transform-based methods [
38] where a sparse method for PQ representation, starting from overcomplete dictionaries, is introduced. These techniques are used as input to a classifier such as support vector machine [
39] where a new hybrid algorithm is presented for PQ disturbances detection in electrical power systems with SVM; fuzzy logic [
40] where a fuzzy logic based online fault detection and classification of transmission line using Programmable Automation and Control technology based National Instrument Compact Reconfigurable i/o (CRIO) devices is introduced; ensemble technique [
33] where performance comparisons of SVM and different classification method like ensemble mode decomposition for power quality disturbance classification is analyzed; deep learning [
41] where a deep learning-based method is introduced into the classification of power quality disturbances; artificial neural network [
22] where a conjugate gradient back-propagation based artificial neural network for real time power quality assessment is proposed; and maximum likelihood classifier [
42] where a newly developed CS, maximum likelihood (ML), and rule-based method for classification of power quality disturbances.
The technology for smart metering is a heterogenous infrastructure that includes many branches of engineering: communication networks, data processing, management, and installation. The minimum infrastructure for this system of smart metering is the electronic device for metering (smart meter), a cloud-based data gathering system, a communication system (normally based on the Internet), and a computational centralised center. A few academic researchers have presented energy meters and power quality analysers, but up to now, most of the installations are monitored by using commercial devices. However, these devices are often expensive and difficult to manage by non-expert users. Therefore, it is a challenge to develop low-cost and high-precision devices for general usage in any type of electrical installation. This is precisely the main contribution of oZm, a small-sized open source, low-cost, precise, and reliable power and electric energy meter aimed to help people to analyze and visualize energy consumption measures complying with international standards such as IEC 61000-4-30 and EN-50160. Herein, the openZmeter (oZm from now on) device is described as a key part of a smart metering infrastructure. This electronic device is a major redesign of the basic prototype in [
43]. It is low-cost, single-phase open-hardware, with advanced bidirectional capabilities applied to monitoring electric features and cloud-based data gathering. This smart meter presents a wide range of features, which accomplish the minimum desirable requirements for an electricity smart meter as published in recommendation 2012/148/EU [
44]. The smart meter here presented is useful to monitor and prevent distribution network problems. Thanks to the features of oZm, it is possible to receive information about significant events detected in the electrical installations. By monitoring these abnormal situations, e.g., high power consumption or significant power quality disturbances, it would be possible to implement preventive strategies.
The main contribution of this paper is to present a professional low-cost open-source hardware device for power quality and energy metering and submetering for the Internet of Things. The advanced design of oZm ensures reliable and accurate energy consumption and power quality measurements under a wide range of operating conditions in a single handy device. Given its small size and large variety of current probes, it can be easily installed at any electrical installation, i.e., it can be used both as bulk metering or as metering/submetering for individual units or appliances. Unlike other typical low-cost data loggers or meters like those analyzed in [
45], oZm records all electrical parameters and events following international standards. Finally, other important contribution of the paper is to present and display a large number of measurements with an user-friendly interface that can be customized according the particular needs.
The rest of the paper is organized as follows:
Section 2 presents a detailed overview of the hardware and software of the smart meter design.
Section 3 presents an analysis of its usage in a real environment, while the main conclusions are summarized in
Section 4. The acronyms used in the text are listed in
Table 1 in alphabetic order together with their meaning in full words as found in literature.
2. IoT Power Quality and Smart Meter Design
Herein, an open-hardware platform for PQ monitoring and smart energy metering is designed, developed, and manufactured. This electronic device was designed for monitoring PQ events, voltage, and current waveforms (along with other advanced features) following the specifications given by international standards such as IEC 61000-4-30 and EN-50160. The system for PQ monitoring and smart metering can be considered an Internet-based power quality monitoring and smart metering system because of its accurate probes and embedded server that manage all PQ and energy information over the Internet or a local network. Raw and processed values can be accessed locally from an internal database through a web application or uploaded to a central server in the cloud for massive deployment.
Currently, single-phase hardware has been successfully built, and a three-phase version is already in the prototype stage. Because of its characteristics, this single-phase version is mainly used in domestic environments, but there is no limit to using it elsewhere if the current is below 35 A RMS because the Hall effect current sensor used is limited to a 50-A peak value. However, the system is able to accept any other current probe (split-core, Rogowski, etc.) if the voltage output is between ±1.25 V. All components are isolated from the main voltage in order to allow safe operation of the system. For industrial applications, the three-phase version is recommended. In this case, high-accuracy current clamps or Rogowski coils should be used to sense the current.
The core of the Analog Front End (AFE) is the STM32F373 from the STM32 microcontroller family, which combines high performance, real-time capabilities, digital signal processing, and low-power operation. The STM32F373 is the smallest micro in the family with onboard 16 bit Analog Digital Converter (ADC). In this case we looked for the highest precision without increasing too much the number of components, thus avoiding the use of external ADCs. Also, the manufacturer STMicroelectronics classifies this model as "High precision line" for metering purposes. The onboard ADC is used for signal sampling and conditioning. The conditioned signal is filtered and limited. Then, a correction for gain and offset is applied. This ADC can sample values up to 16 kHz per channel.
The current and voltage signals converted are preprocessed by the digital signal processing (DSP) module of the STM32 using custom signal algorithms designed by the authors. Afterward, the output is sent to a poweful embedded ARM board for final processing. Complex calculations such as FFT, zero crossing, and RMS values are then executed by a Linux core (the host), where a daemon service is run in an endless loop in real time. This real-time strategy allows to implement priorities for threads and queues, so that critical processes are treated with a high priority and less critical processes have a low priority.
2.1. Hardware Structure of oZm
Advanced electronics such as microprocessors or field programmable gate array (FPGA) devices are commonly used for PQ monitoring and energy smart metering. Every choice has its own advantages and drawbacks. Recently, the use of highly efficient and low-cost ARM boards has been demonstrated to be a real option when coupled to other microcontrollers. In our case, smart metering and PQ monitoring are accomplished using a Linux ARM board and AFE managed by an STM32 microcontroller.
In terms of cost, this approach is the most efficient. Within the evolution of hardware, it is possible to find low-cost DSP devices that can work at high speeds with more integration and more features at a cheaper cost. Moreover, the ARM Linux controller is reliable, efficient, and low-cost. It has also been proven to be much more flexible than any other device thanks to its software repositories and packages.
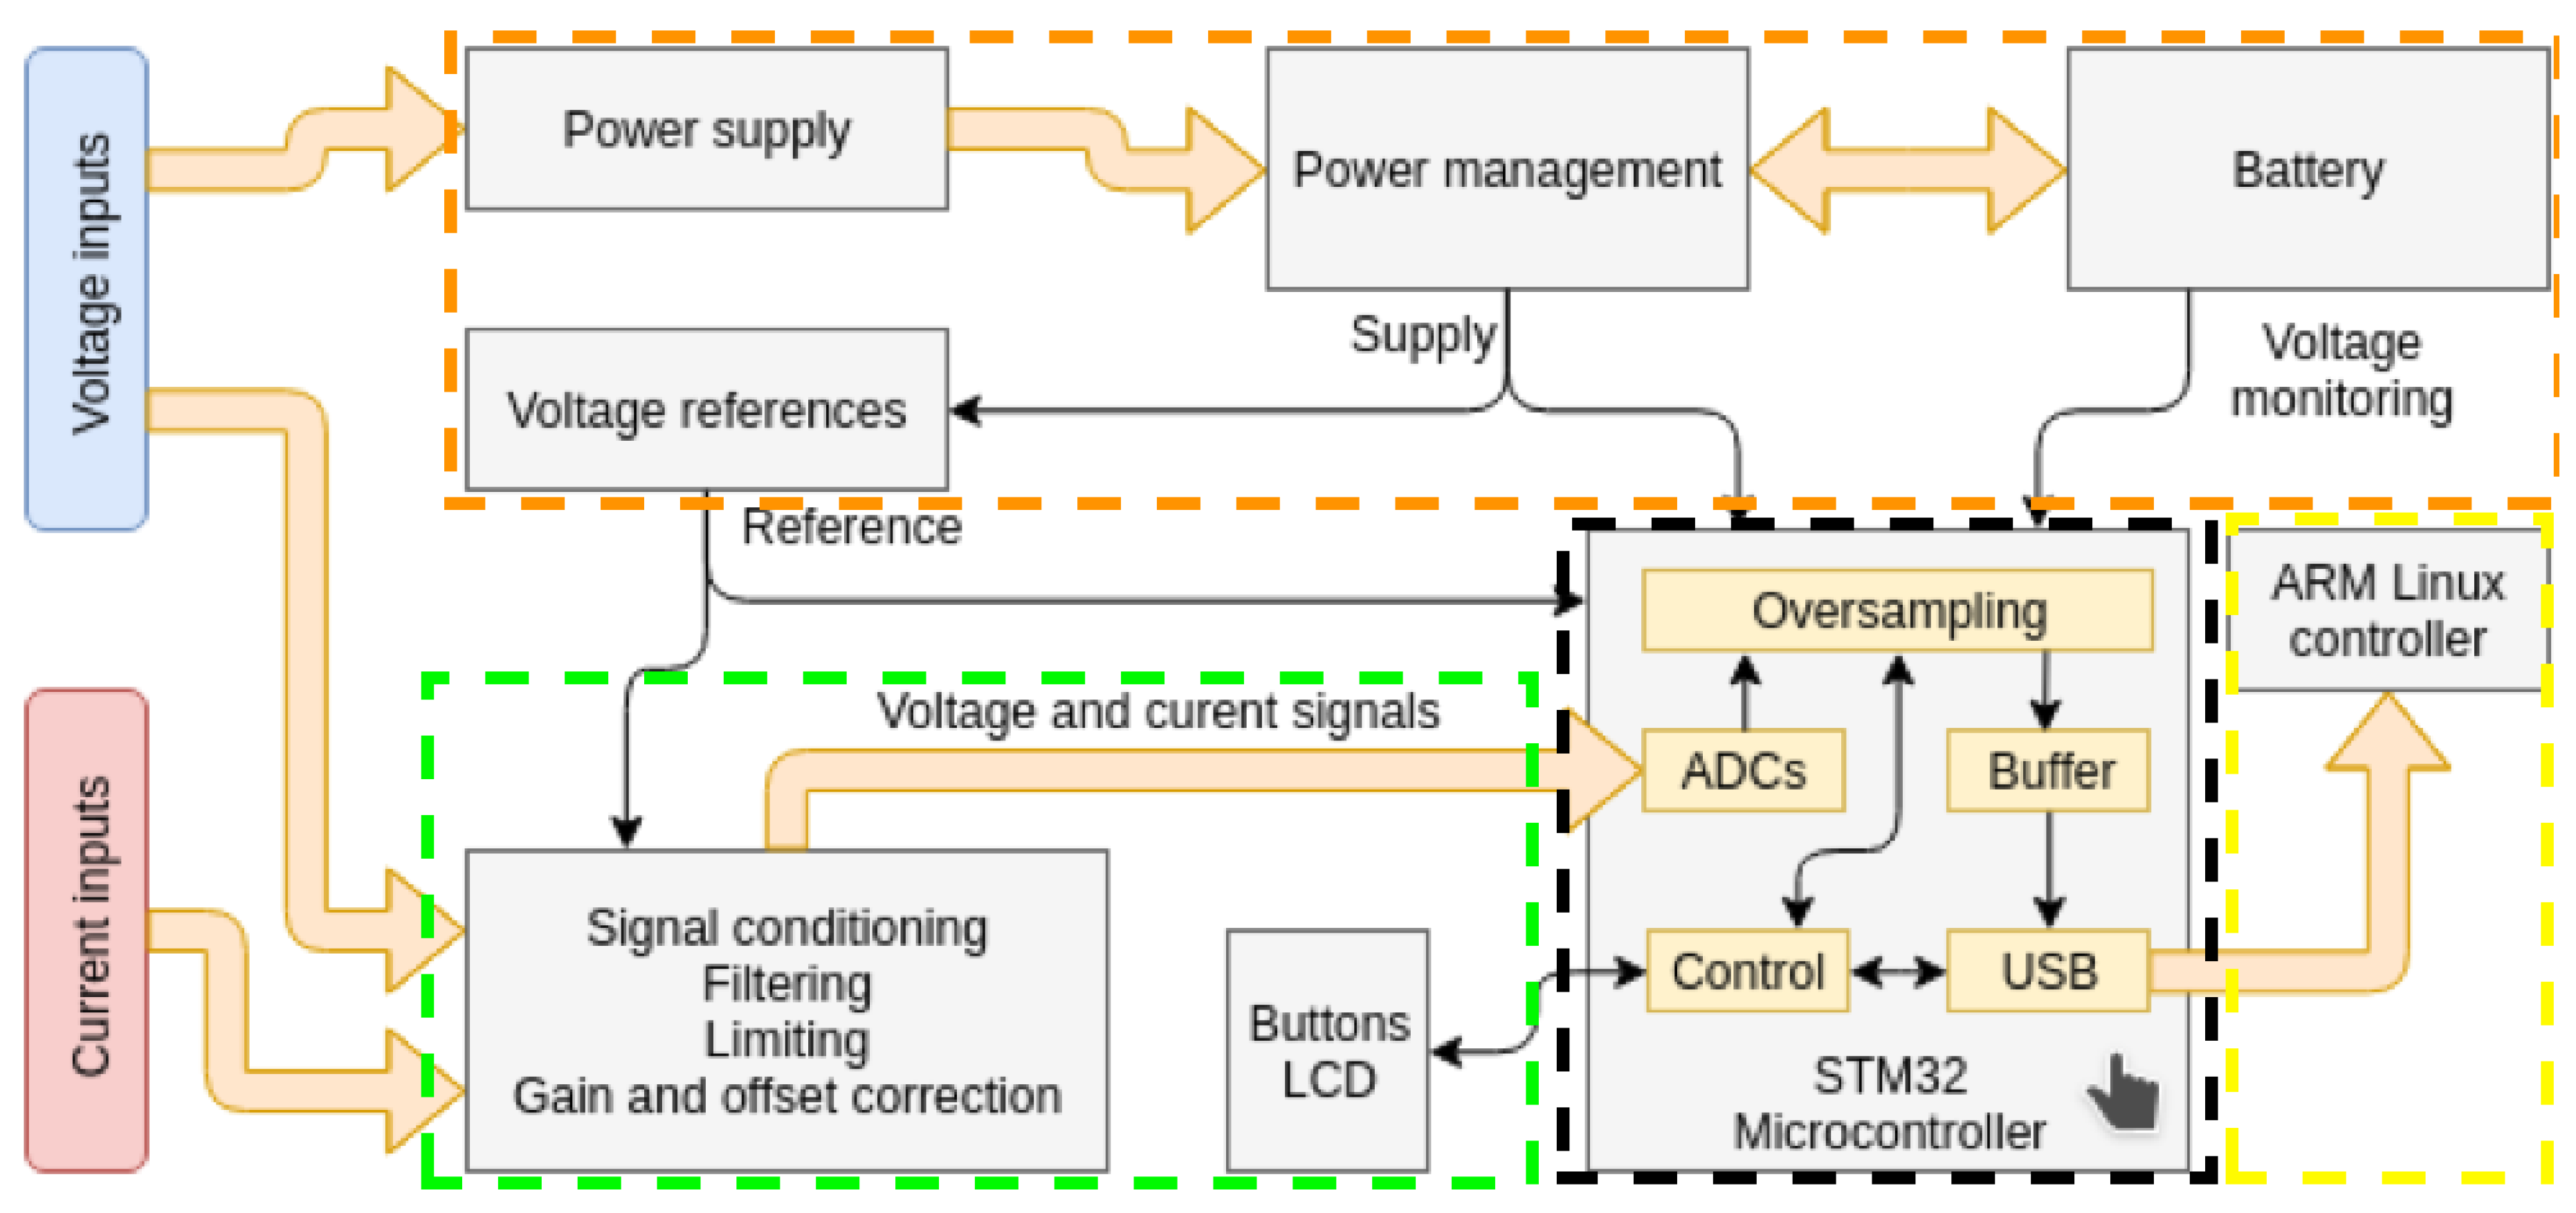
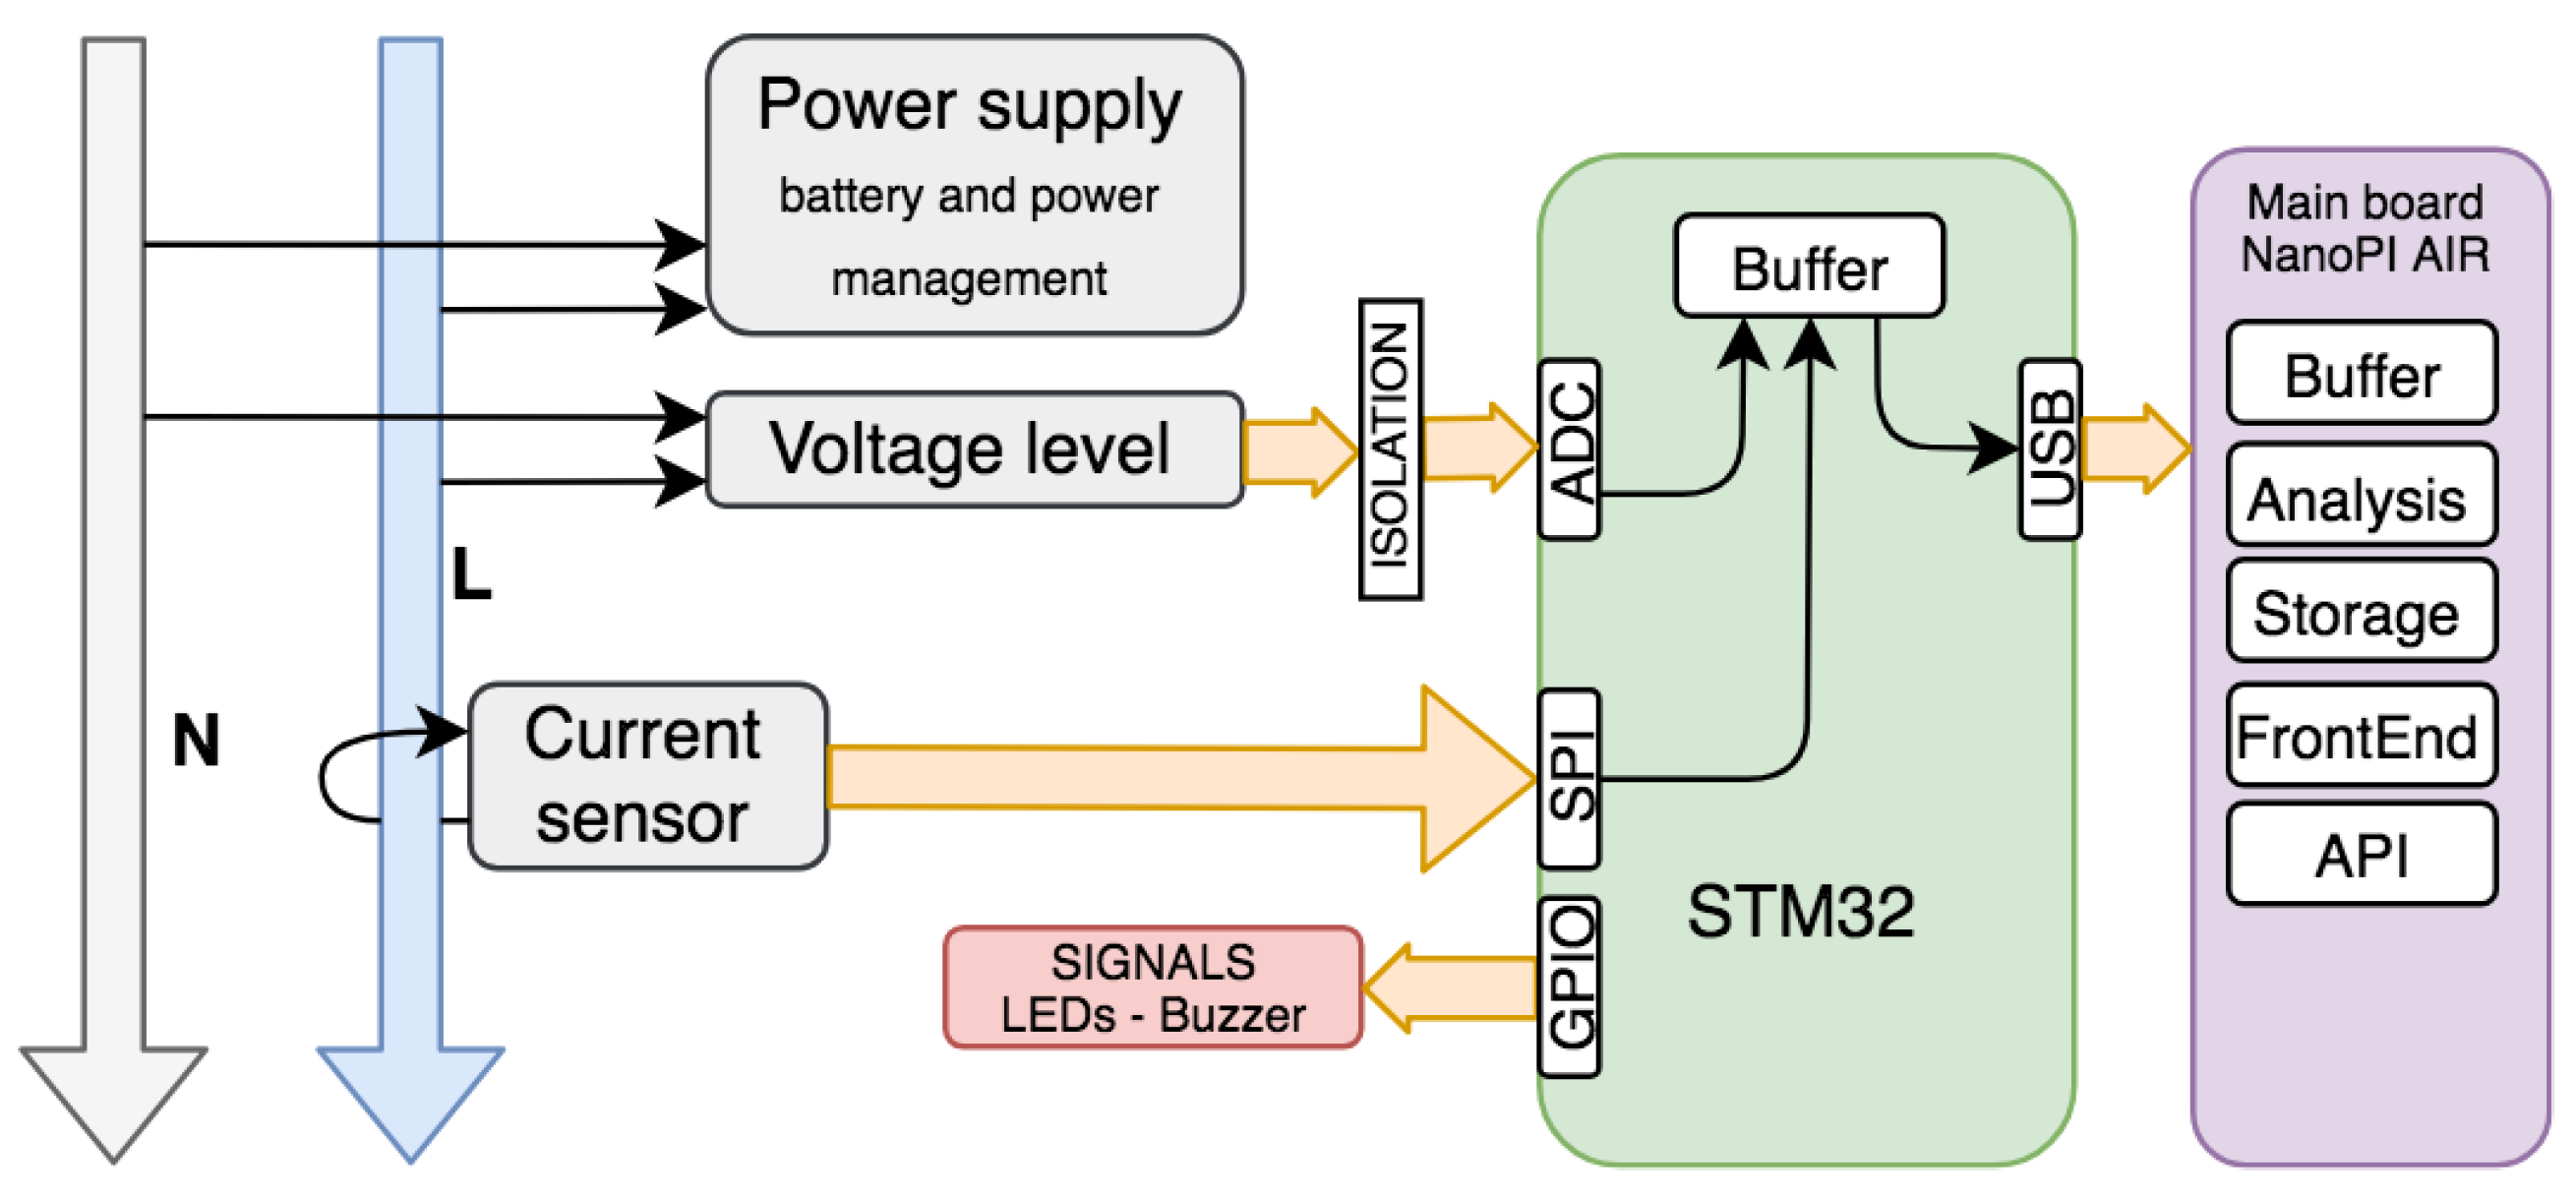
Figure 1 shows a block diagram for the oZm hardware, where four main blocks can be identified. The first one (coloured in green) is the signal acquisition stage for current and voltage. An accurate resistor divider is used to sense and reduce the main voltage to a low level around a few volts. Filtering and correction are applied using a low-pass filter in order to avoid aliasing effects. The current is sensed by means of a Hall effect integrated circuit (IC) from Infineon. The second block (coloured in orange) is composed of a power supply and management elements, including the Li-Po battery.
The third block (coloured in black) is an STM32 microcontroller that handles all acquired signals, i.e., sampling, buffering, and USB communication with the fourth block (coloured in yellow), which is the ARM Linux board controller. Here, major processing tasks are executed along with database storage, web server functions, and web visualization.
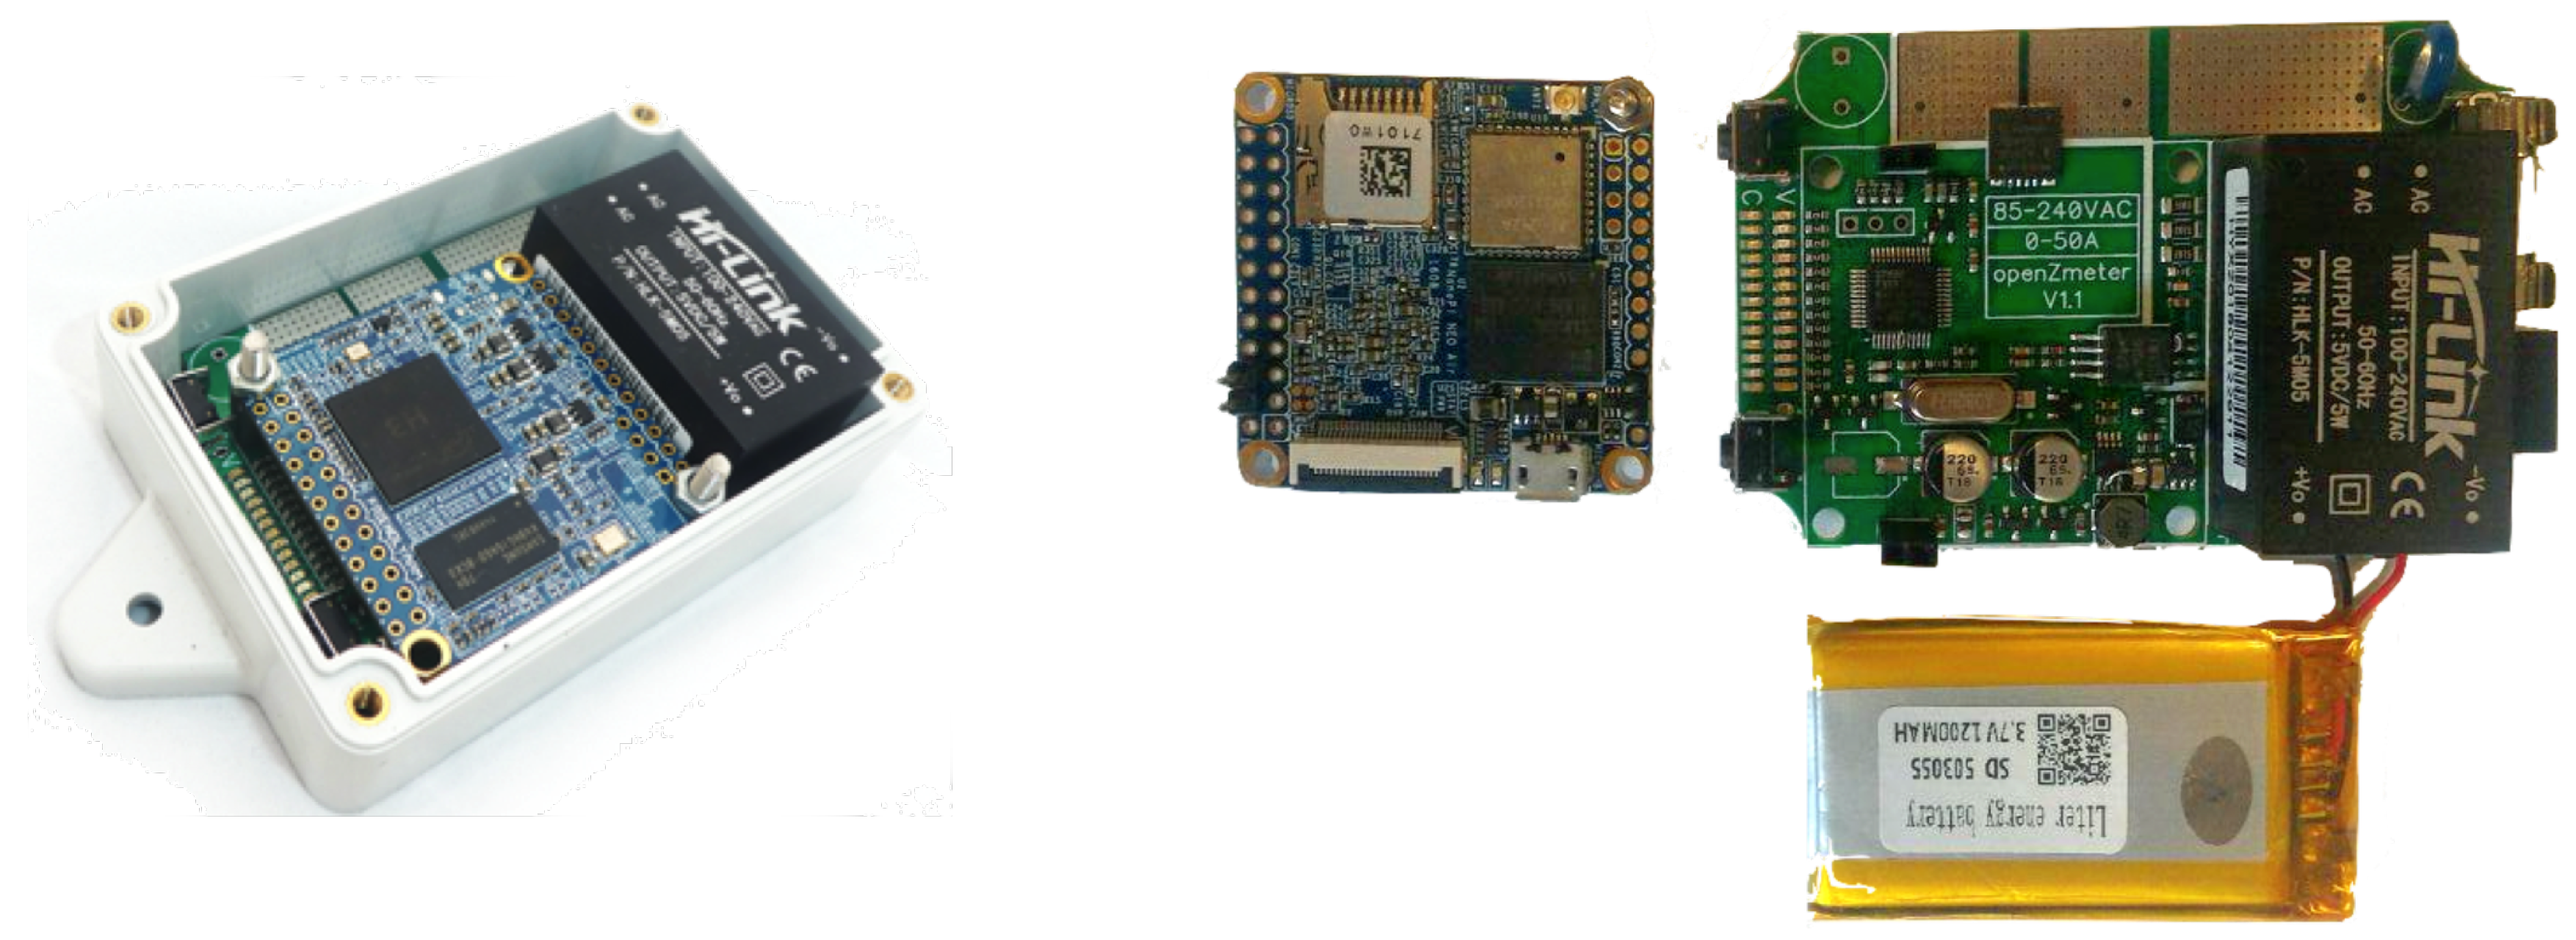
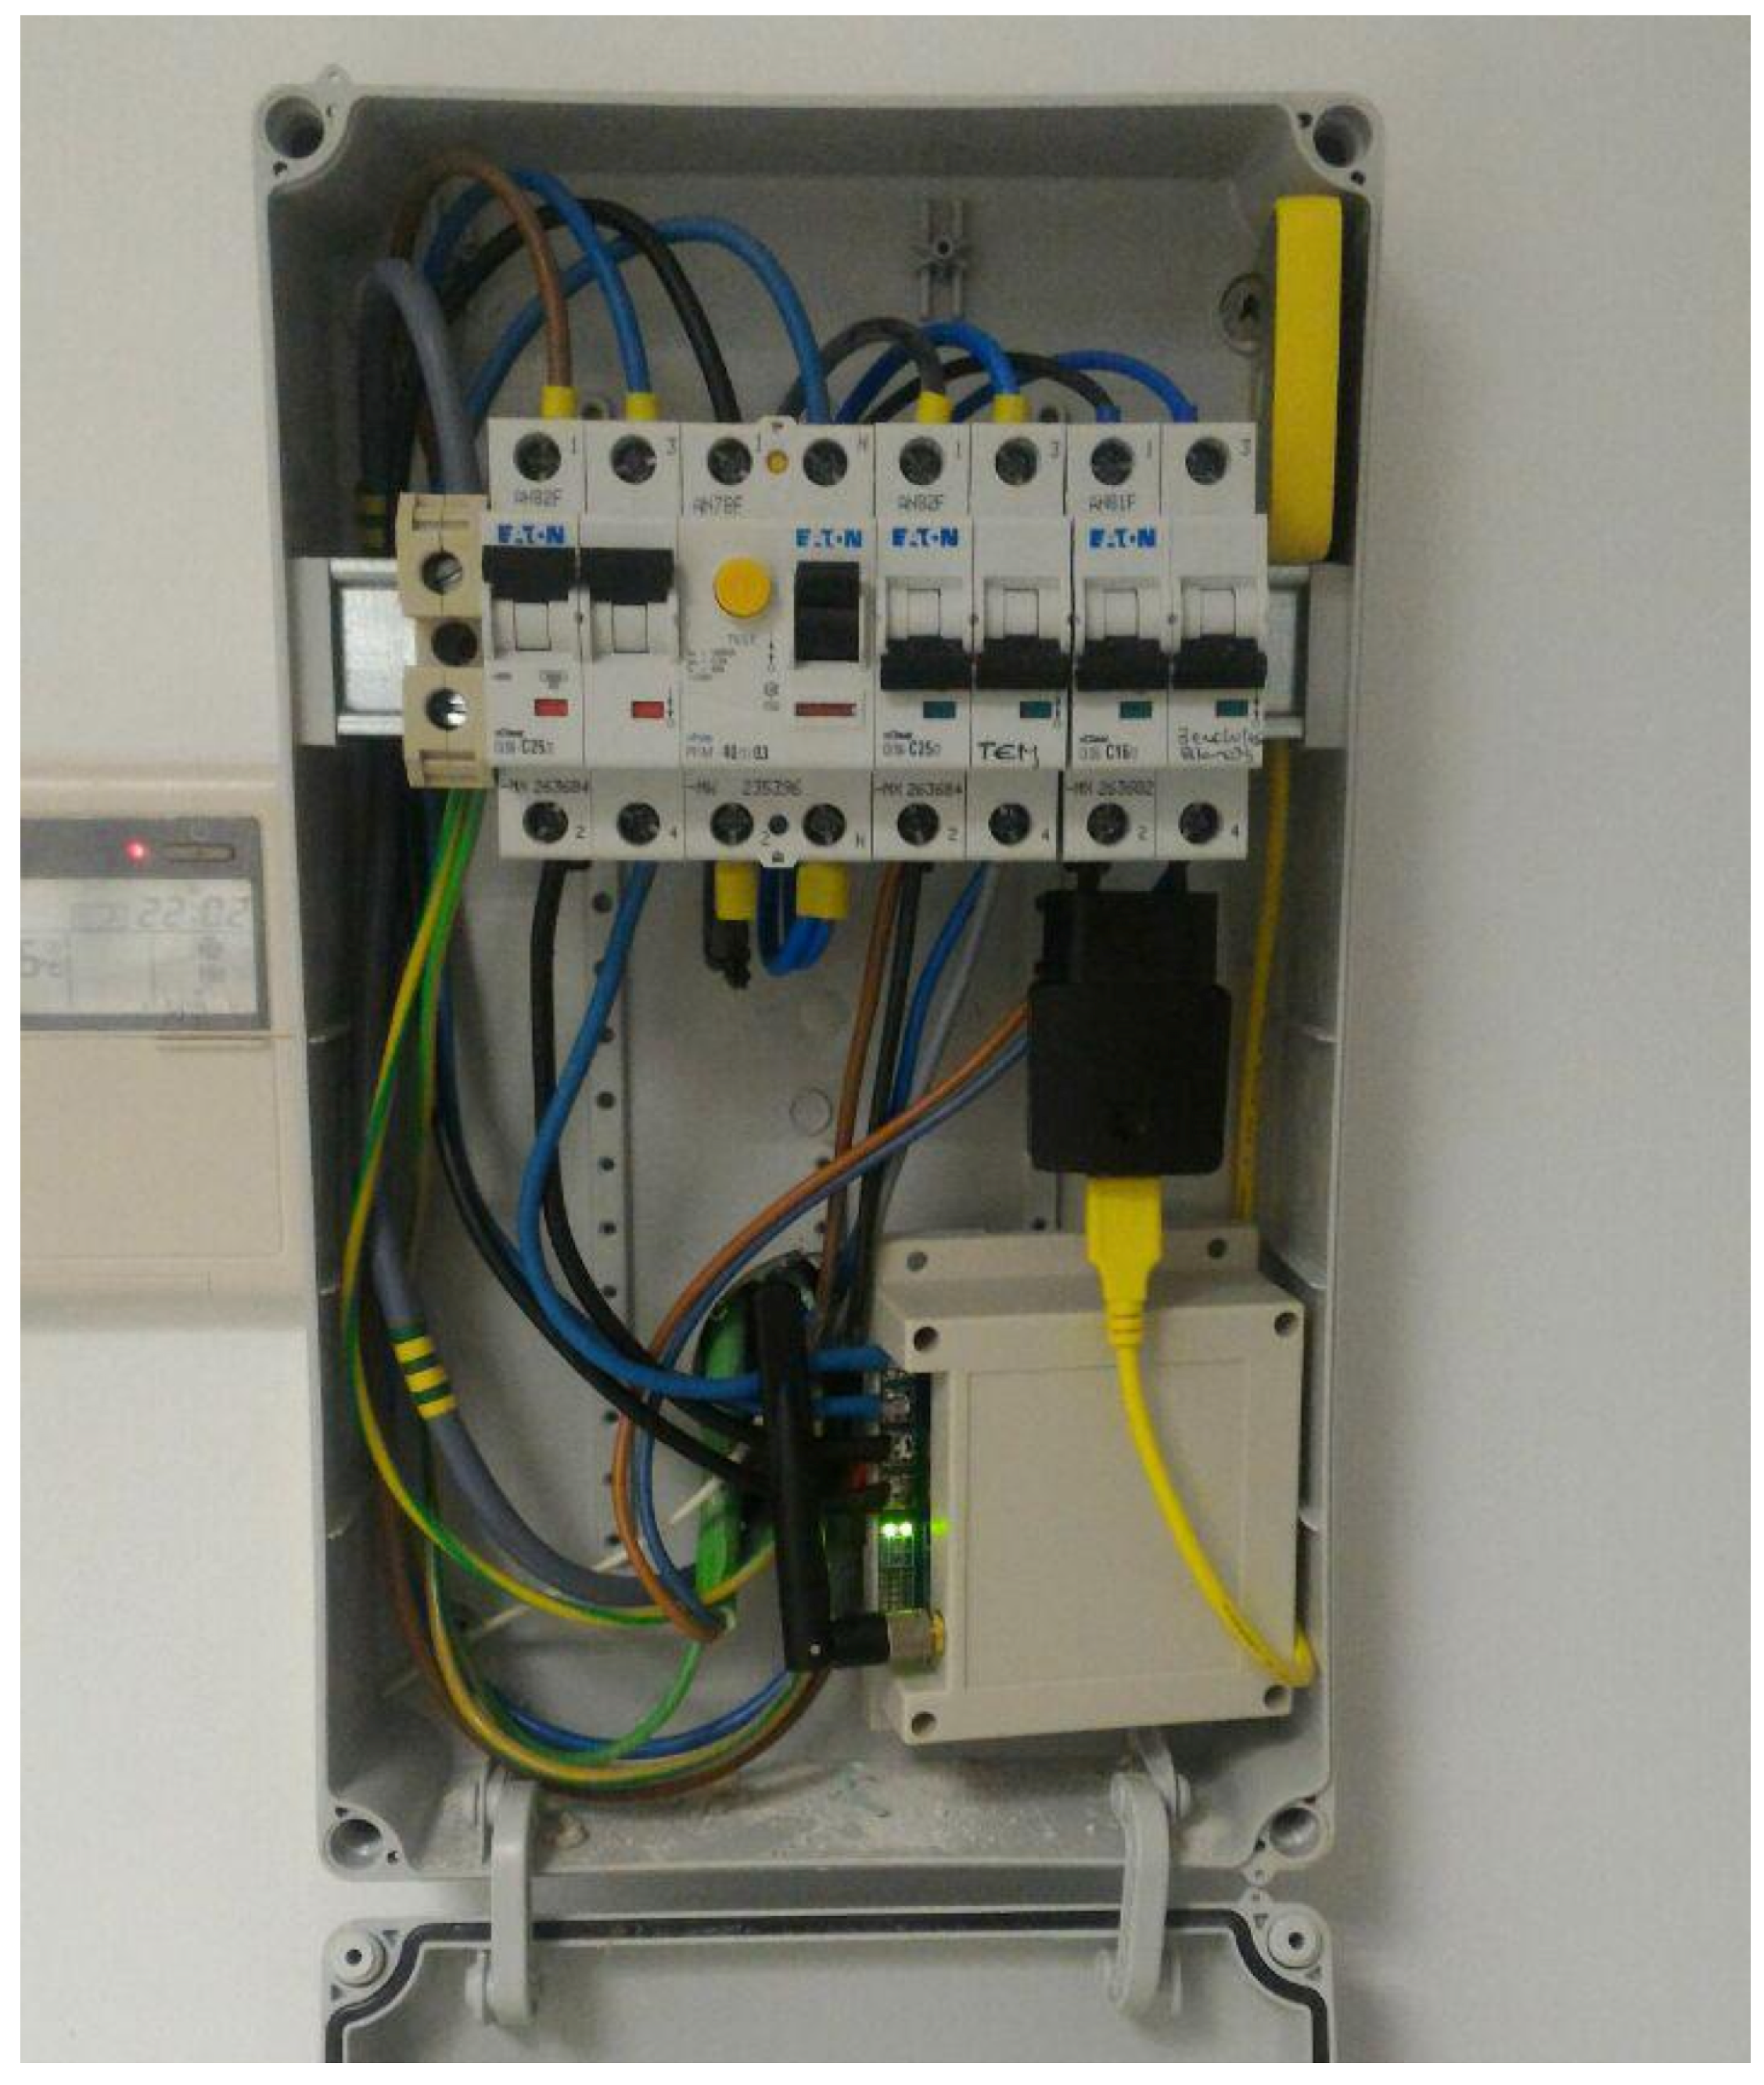
Figure 2 presents some views of the hardware. A general view is on the left side, and a detailed component view is on the right. The ARM board, Li-Po battery, and AFE can be seen.
The voltage input is protected against overvoltage and transients. Protection is realized by means of a voltage limiter using a varistor. To protect against overcurrent, a fuse is also installed. Moreover, the resistance of the fuse limits the high current required during the connection because of the charging of capacitors from the main voltage. A jumper selects the operating mode, which must be provided with the appropriate connection. The oZm is single phase and has an integrated Hall-effect sensor.
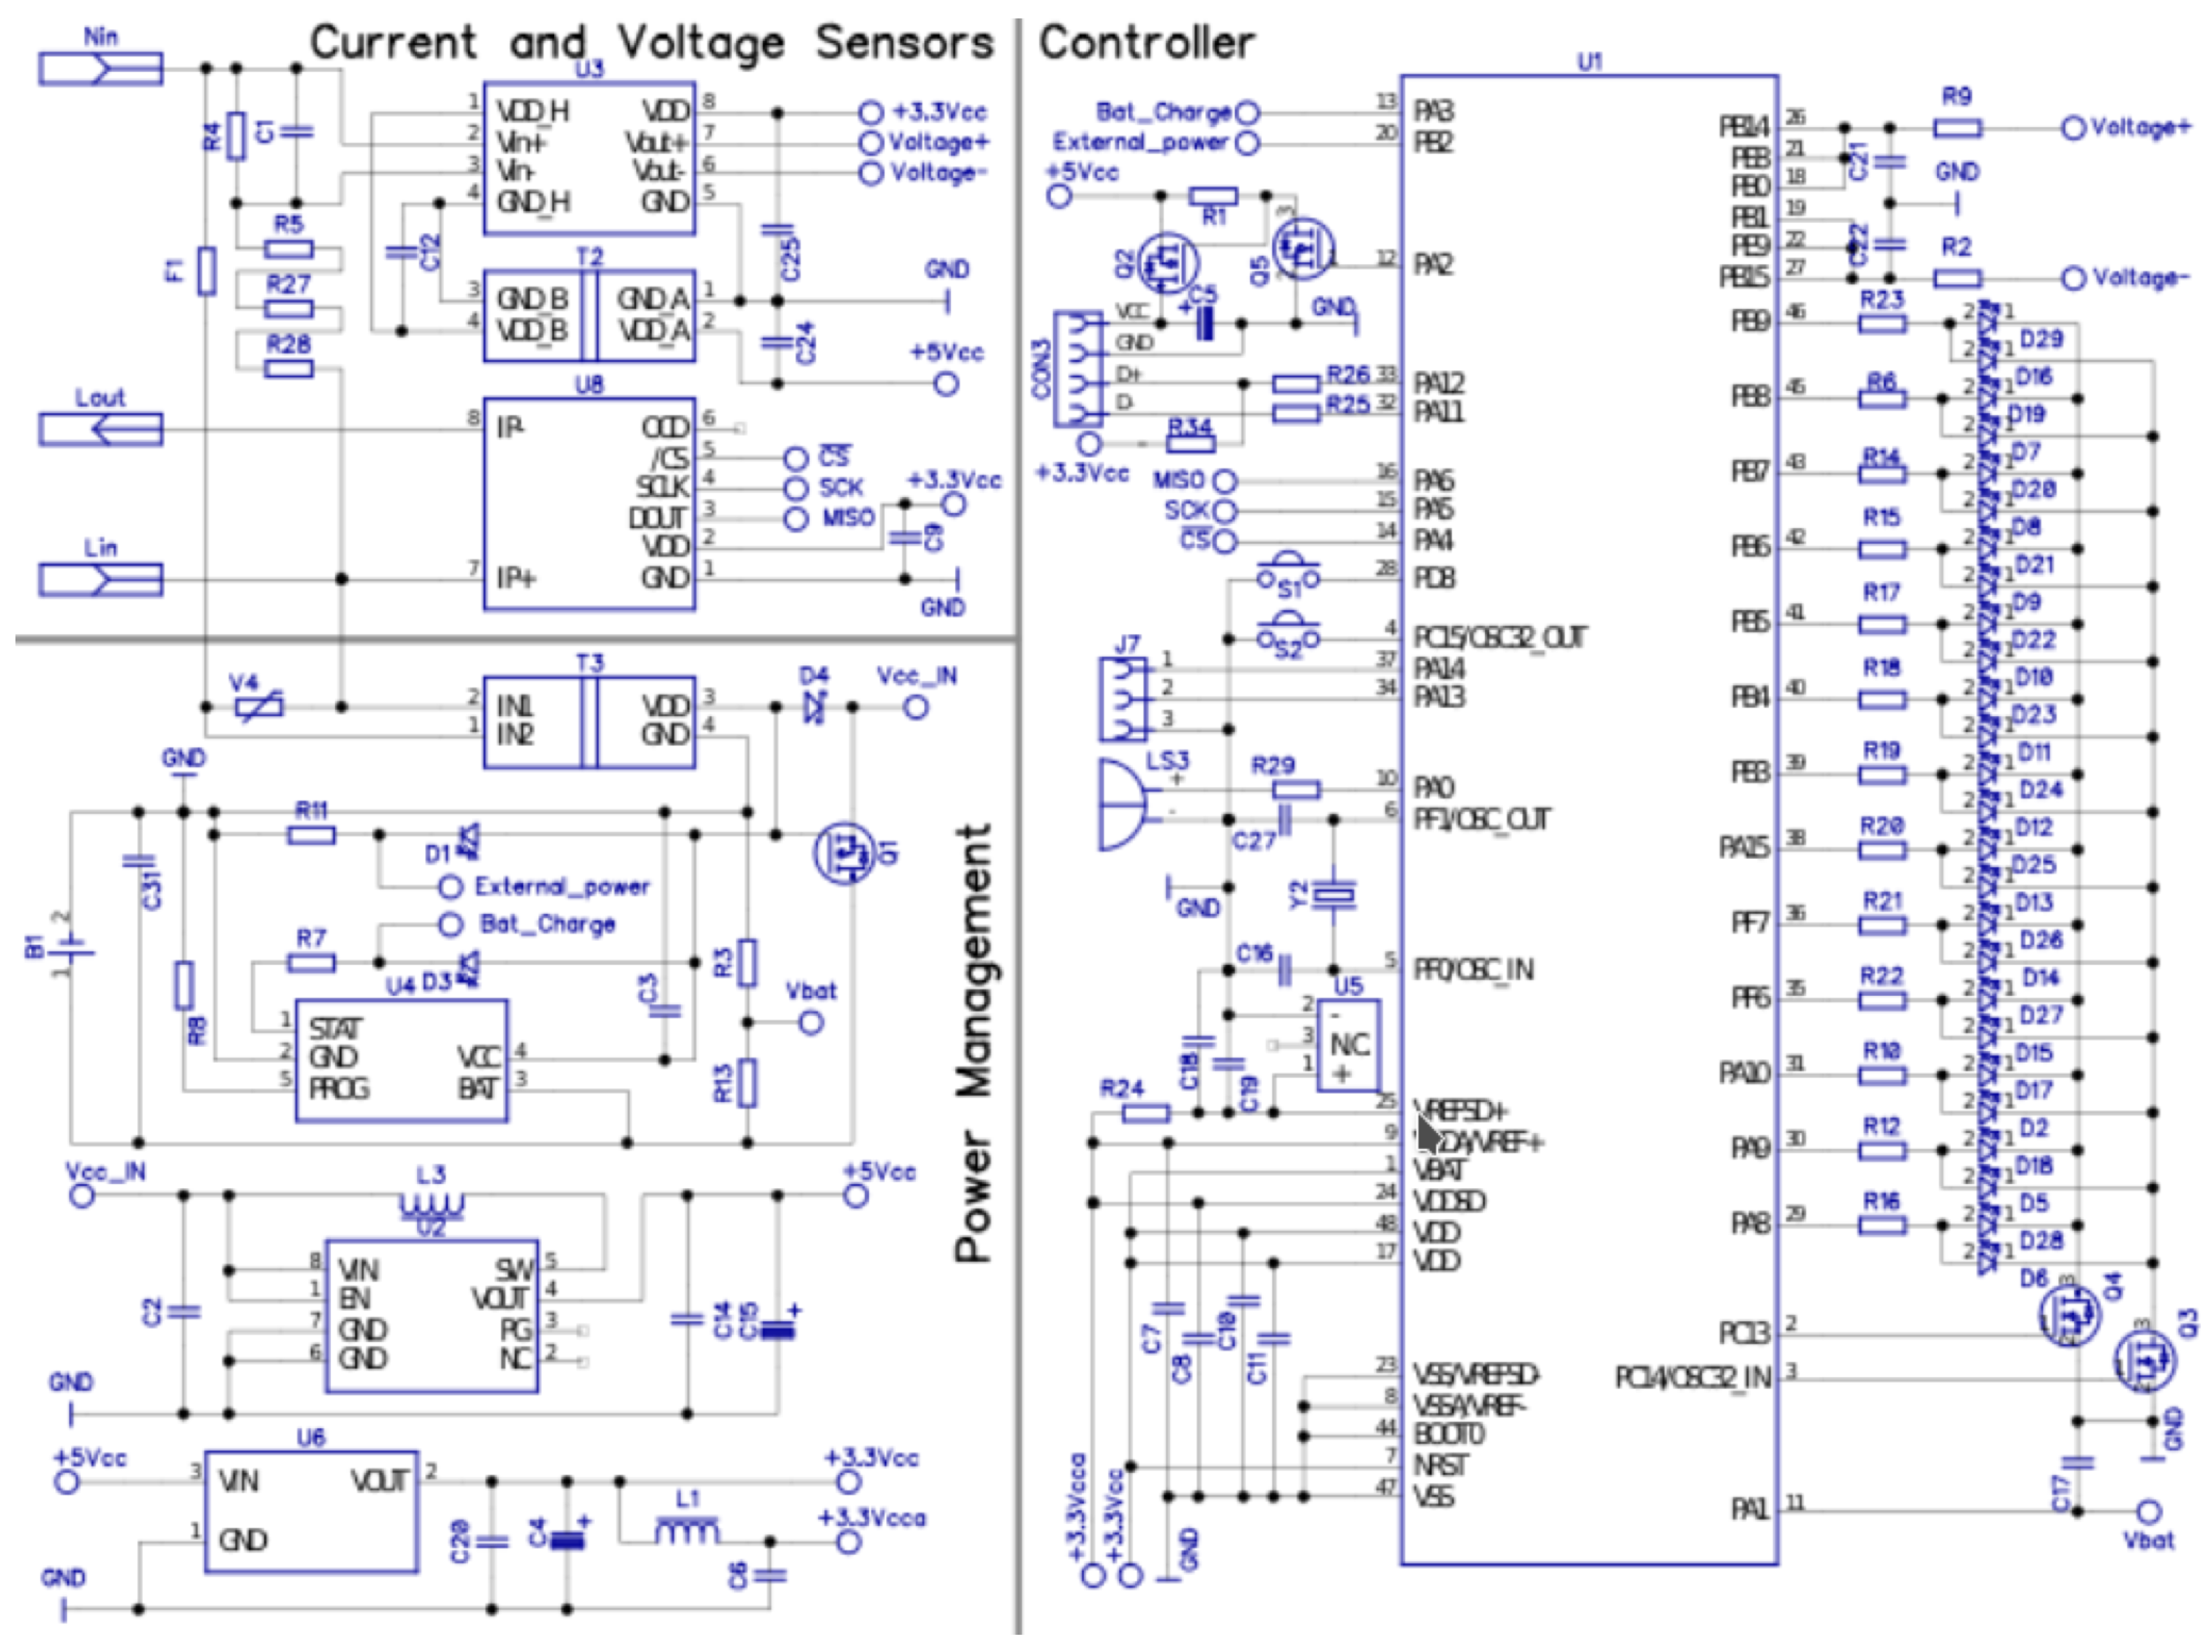
In
Figure 3, the proposed electronic scheme is presented along with a flowchart in
Figure 4. It can be seen that the current flows in the oZm through a Hall-effect sensor integrated in the PCB (Infineon TLI4970).
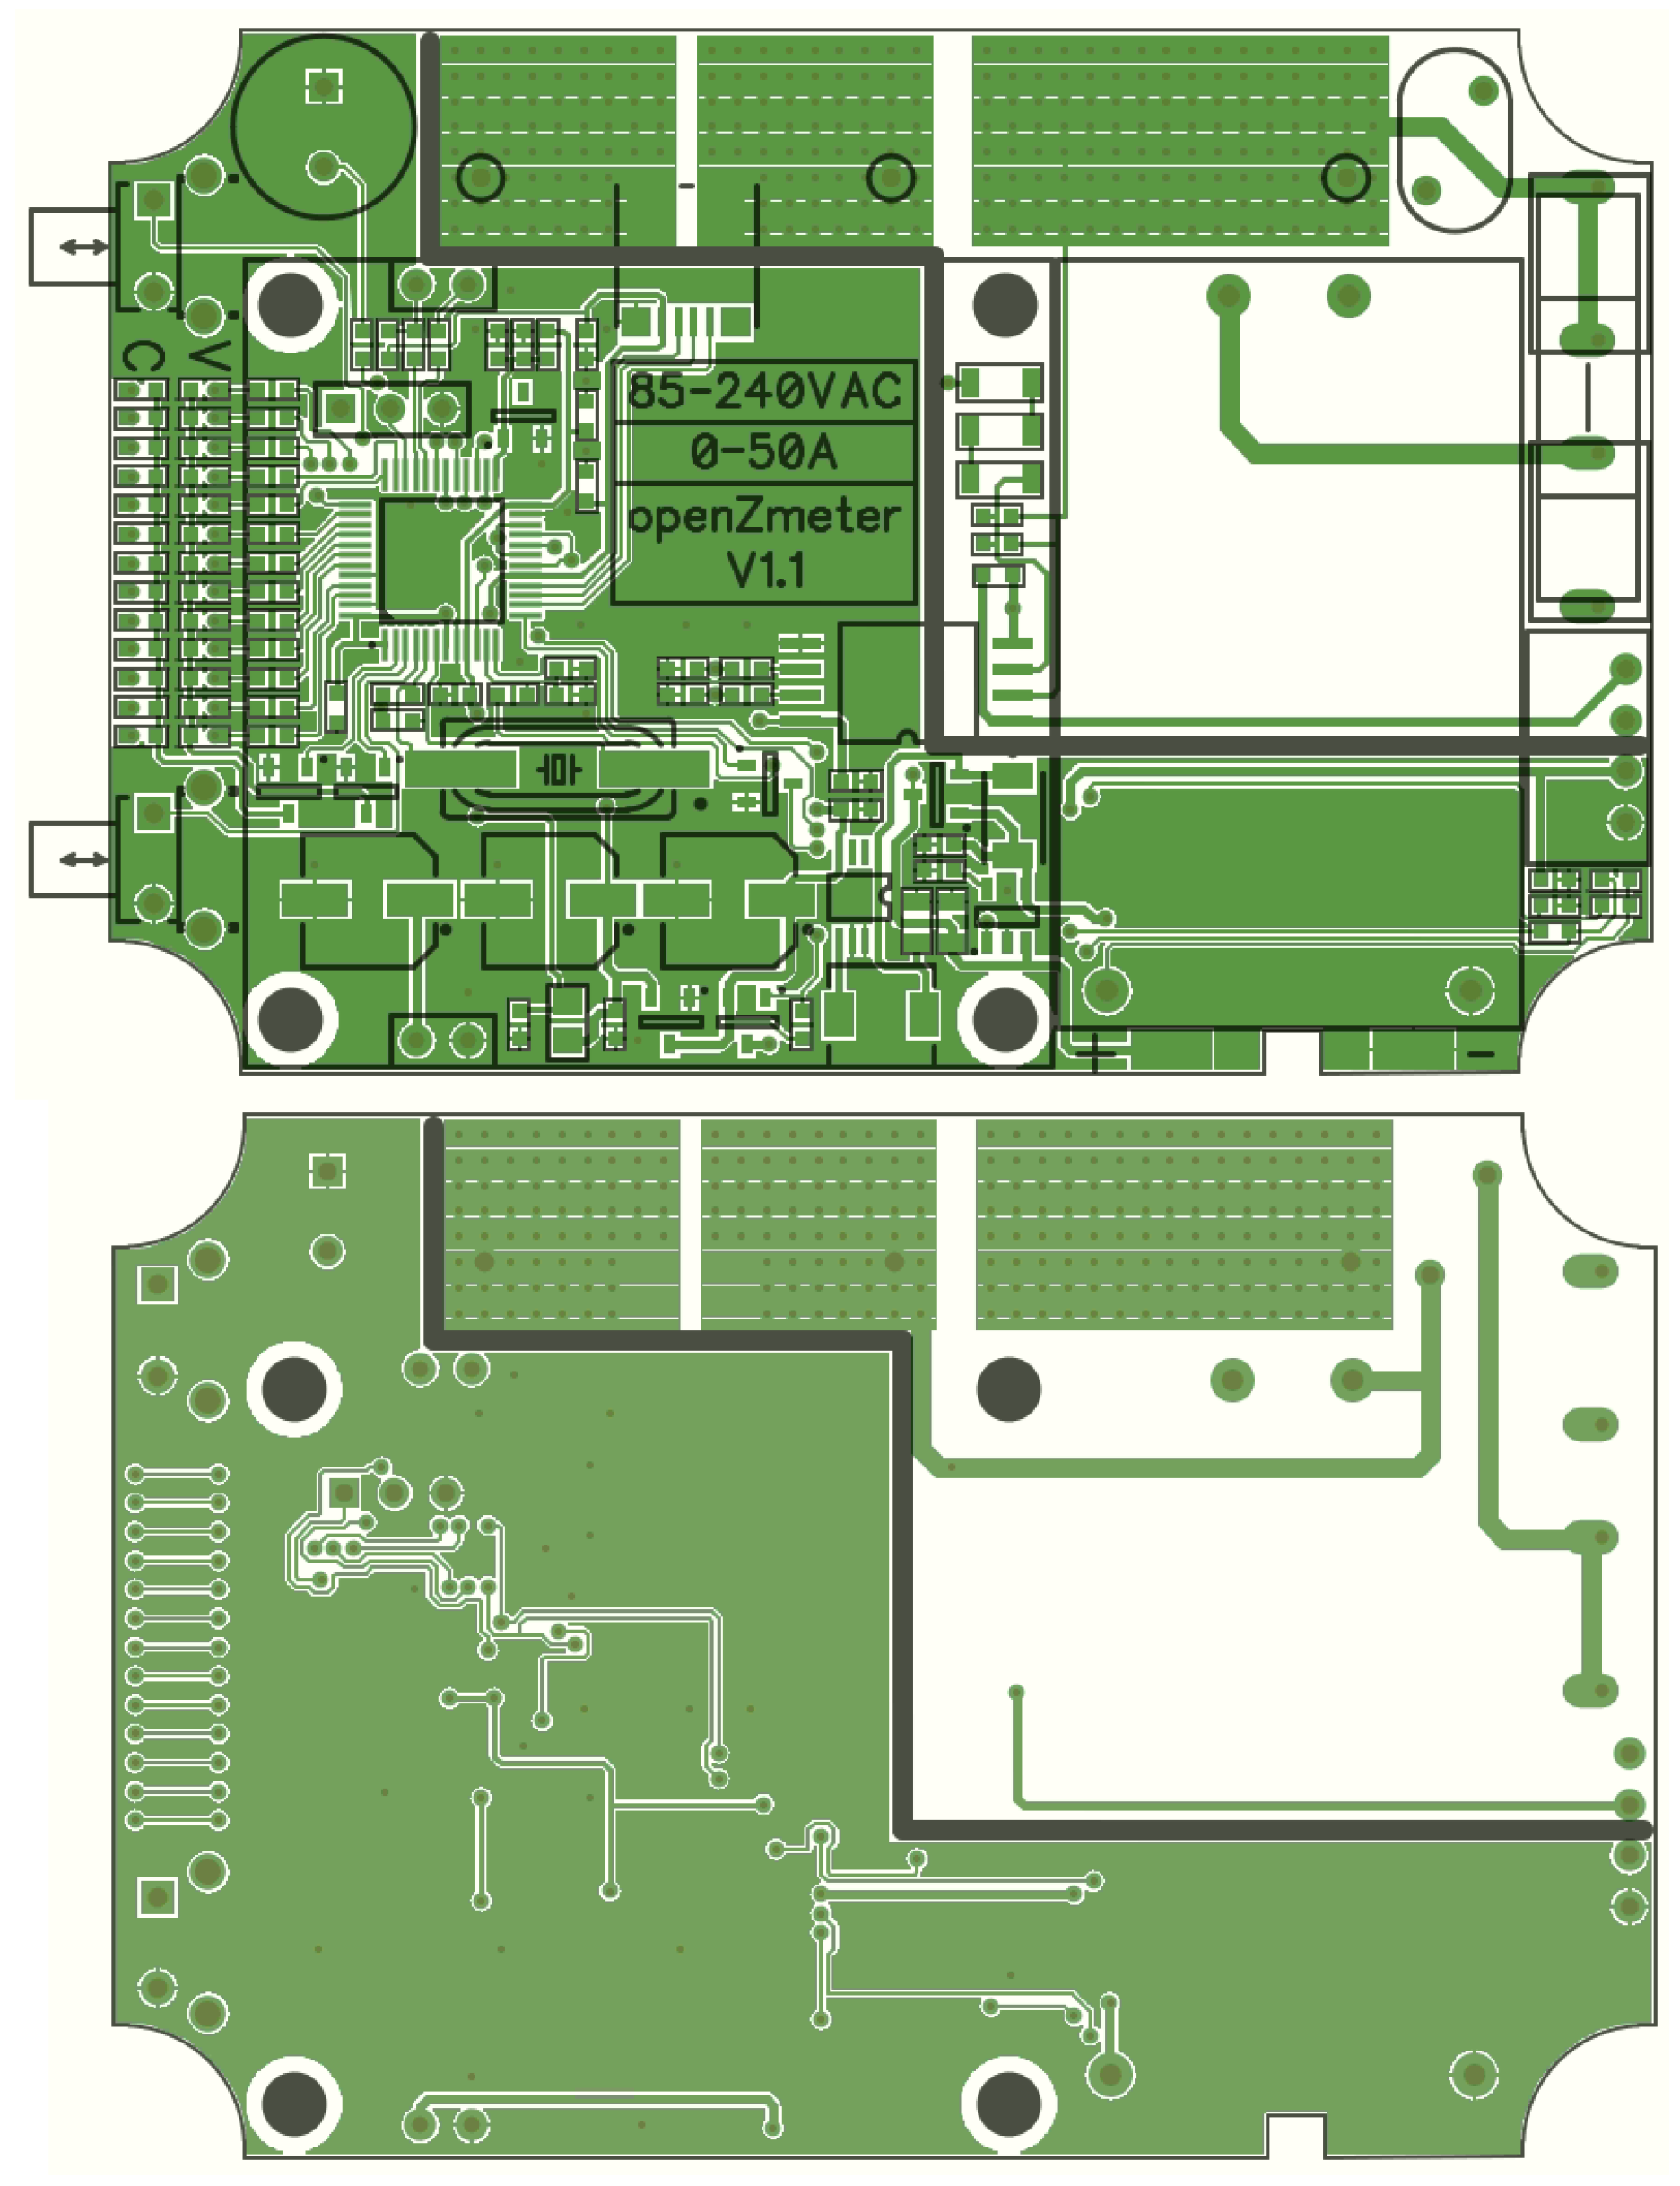
Figure 5 shows a detailed silkscreen of the PCB made with opensource software Kicad [
46]. For safety reasons, the PCB tracks are sized for the maximum current of 50 A allowed by the sensor. No further processing is required on this channel thanks to the serial SPI connection to our STM32. The samples of the voltage channel are obtained through the isolation amplifier (U3) ACPL-C79 model from Broadcom. This device provides the necessary isolation from the mains voltage.
To obtain the input signal, a phase-to-neutral resistive divider is used. This reduces the voltage to mV for an input range of approx. V. This output is then redirected to a Broadcom ACPL-C79 isolation amplifier (input signal of mV), which converts to a differential output signal of V. The splitter incorporates an RC filter that attenuates frequencies above 16 kHz. The ACPL-C79 incorporates a modulator that converts the input voltage into a train of pulses that are transmitted optically to a converter that restores the signal to the output range set internally to V. The optical coupling provides the required insulation.
This topology requires a power supply for the part connected to the network that is isolated from the power supply of the module. This function is performed by a DC/DC converter (Recom RFM-0505S). The obtained signal from the isolation amplifier is injected into the three ADC channels of the STM32 after passing through an RC filter that attenuates out-of-range frequencies, from where the sample conversion can be coordinated. Conversion is performed with 16-bit accuracy and a maximum speed of 16 kHz per ADC channel. The STM32 has a great flexibility in the capture process, allowing for the use of only one connected channel and for 16-kHz sampling or sequencing of the three channels, thus increasing the sampling frequency. These functions, as well as the synchronization of the voltage and current samples, are performed by the firmware running on the STM32.
The voltage is conditioned to the appropriate level. An AC/DC converter module gives a stable 5-V output in the range of 85 to 265 VAC for the single-phase version. The galvanic isolation is set between the network and the PCB components. Four blocks are implemented in the power supply:
Input rectifier: Rectifier diodes convert AC to DC, which must withstand at least twice the mains voltage. The device can be used, in safety conditions, up to 1000 V.
Input filter: To prevent noise sources from spreading to the mains, and to stabilize the rectified voltage.
Buck converter: Reduces the voltage to 22 V in order to offer up to 4.5 W.
Secondary buck converter: The IC used has some limitations. The voltage must be set at 5 V, and this voltage must be stable. A second buck converter is used with the MCP16312 to obtain a stable voltage at 5 V, with low ripple and up to 1 A of current.
A battery is also integrated in the power chain circuitry. oZm is manufactured to remain active even when there is no voltage in the inputs, or when the power supply is not in the operating range. A lithium-ion battery with built-in protection is included. The battery provides a voltage between 3.5 V and 4.2 V, incorporating the necessary electronics to avoid overloads and accelerated discharges. The PCB incorporates a charge controller to store energy while connected to the mains. The load manager is the MCP73832 module, which limits the maximum load current to about 100 mA.
The components of the oZm require 5 V to operate correctly. A DC/DC boost converter (MCP1642) is necessary to adjust the voltage from the battery (voltage between 3.5 V and 4.2 V) and some oscillations in the power supply. Therefore, a final conversion is performed to adjust the voltage to 5 V. The circuit designed uses a typical layout offered by the manufacturer. The selection of one input or another (battery or external power supply) is made by means of a MOSFET, which connects the battery to the input of the converter when there is no voltage in the input converter.
2.2. Real-Time PQ Monitoring and Smart Metering Software
The oZm software consists of an embedded ARM unit, where a daemon service runs in an endless loop. The acquisition is performed in real time using an STM32 microprocessor and buffers the ARM unit running a real-time kernel (Linux RT). The daemon service is mainly coded in C++ to obtain a robust and reliable system. Being an Internet-based sensor, it incorporates a wireless module (Ampak AP6212) with WiFi: 802.11b/g/n and Bluetooth: 4.0 dual mode. This makes it possible to connect to the device and monitor the PQ parameters using a web browser with https secure encryption layer. The real-time electric measurement list is as follows:
RMS values for voltage and current
Active power, reactive power, and apparent power
Phase between current and voltage
Power factor
Harmonics up to 50th for current and voltage
Active energy and reactive energy
Frequency
Voltage events such swell, sags/dips, and interruptions
Based on the above list of measurements, the service can present clear visualizations based on the following features:
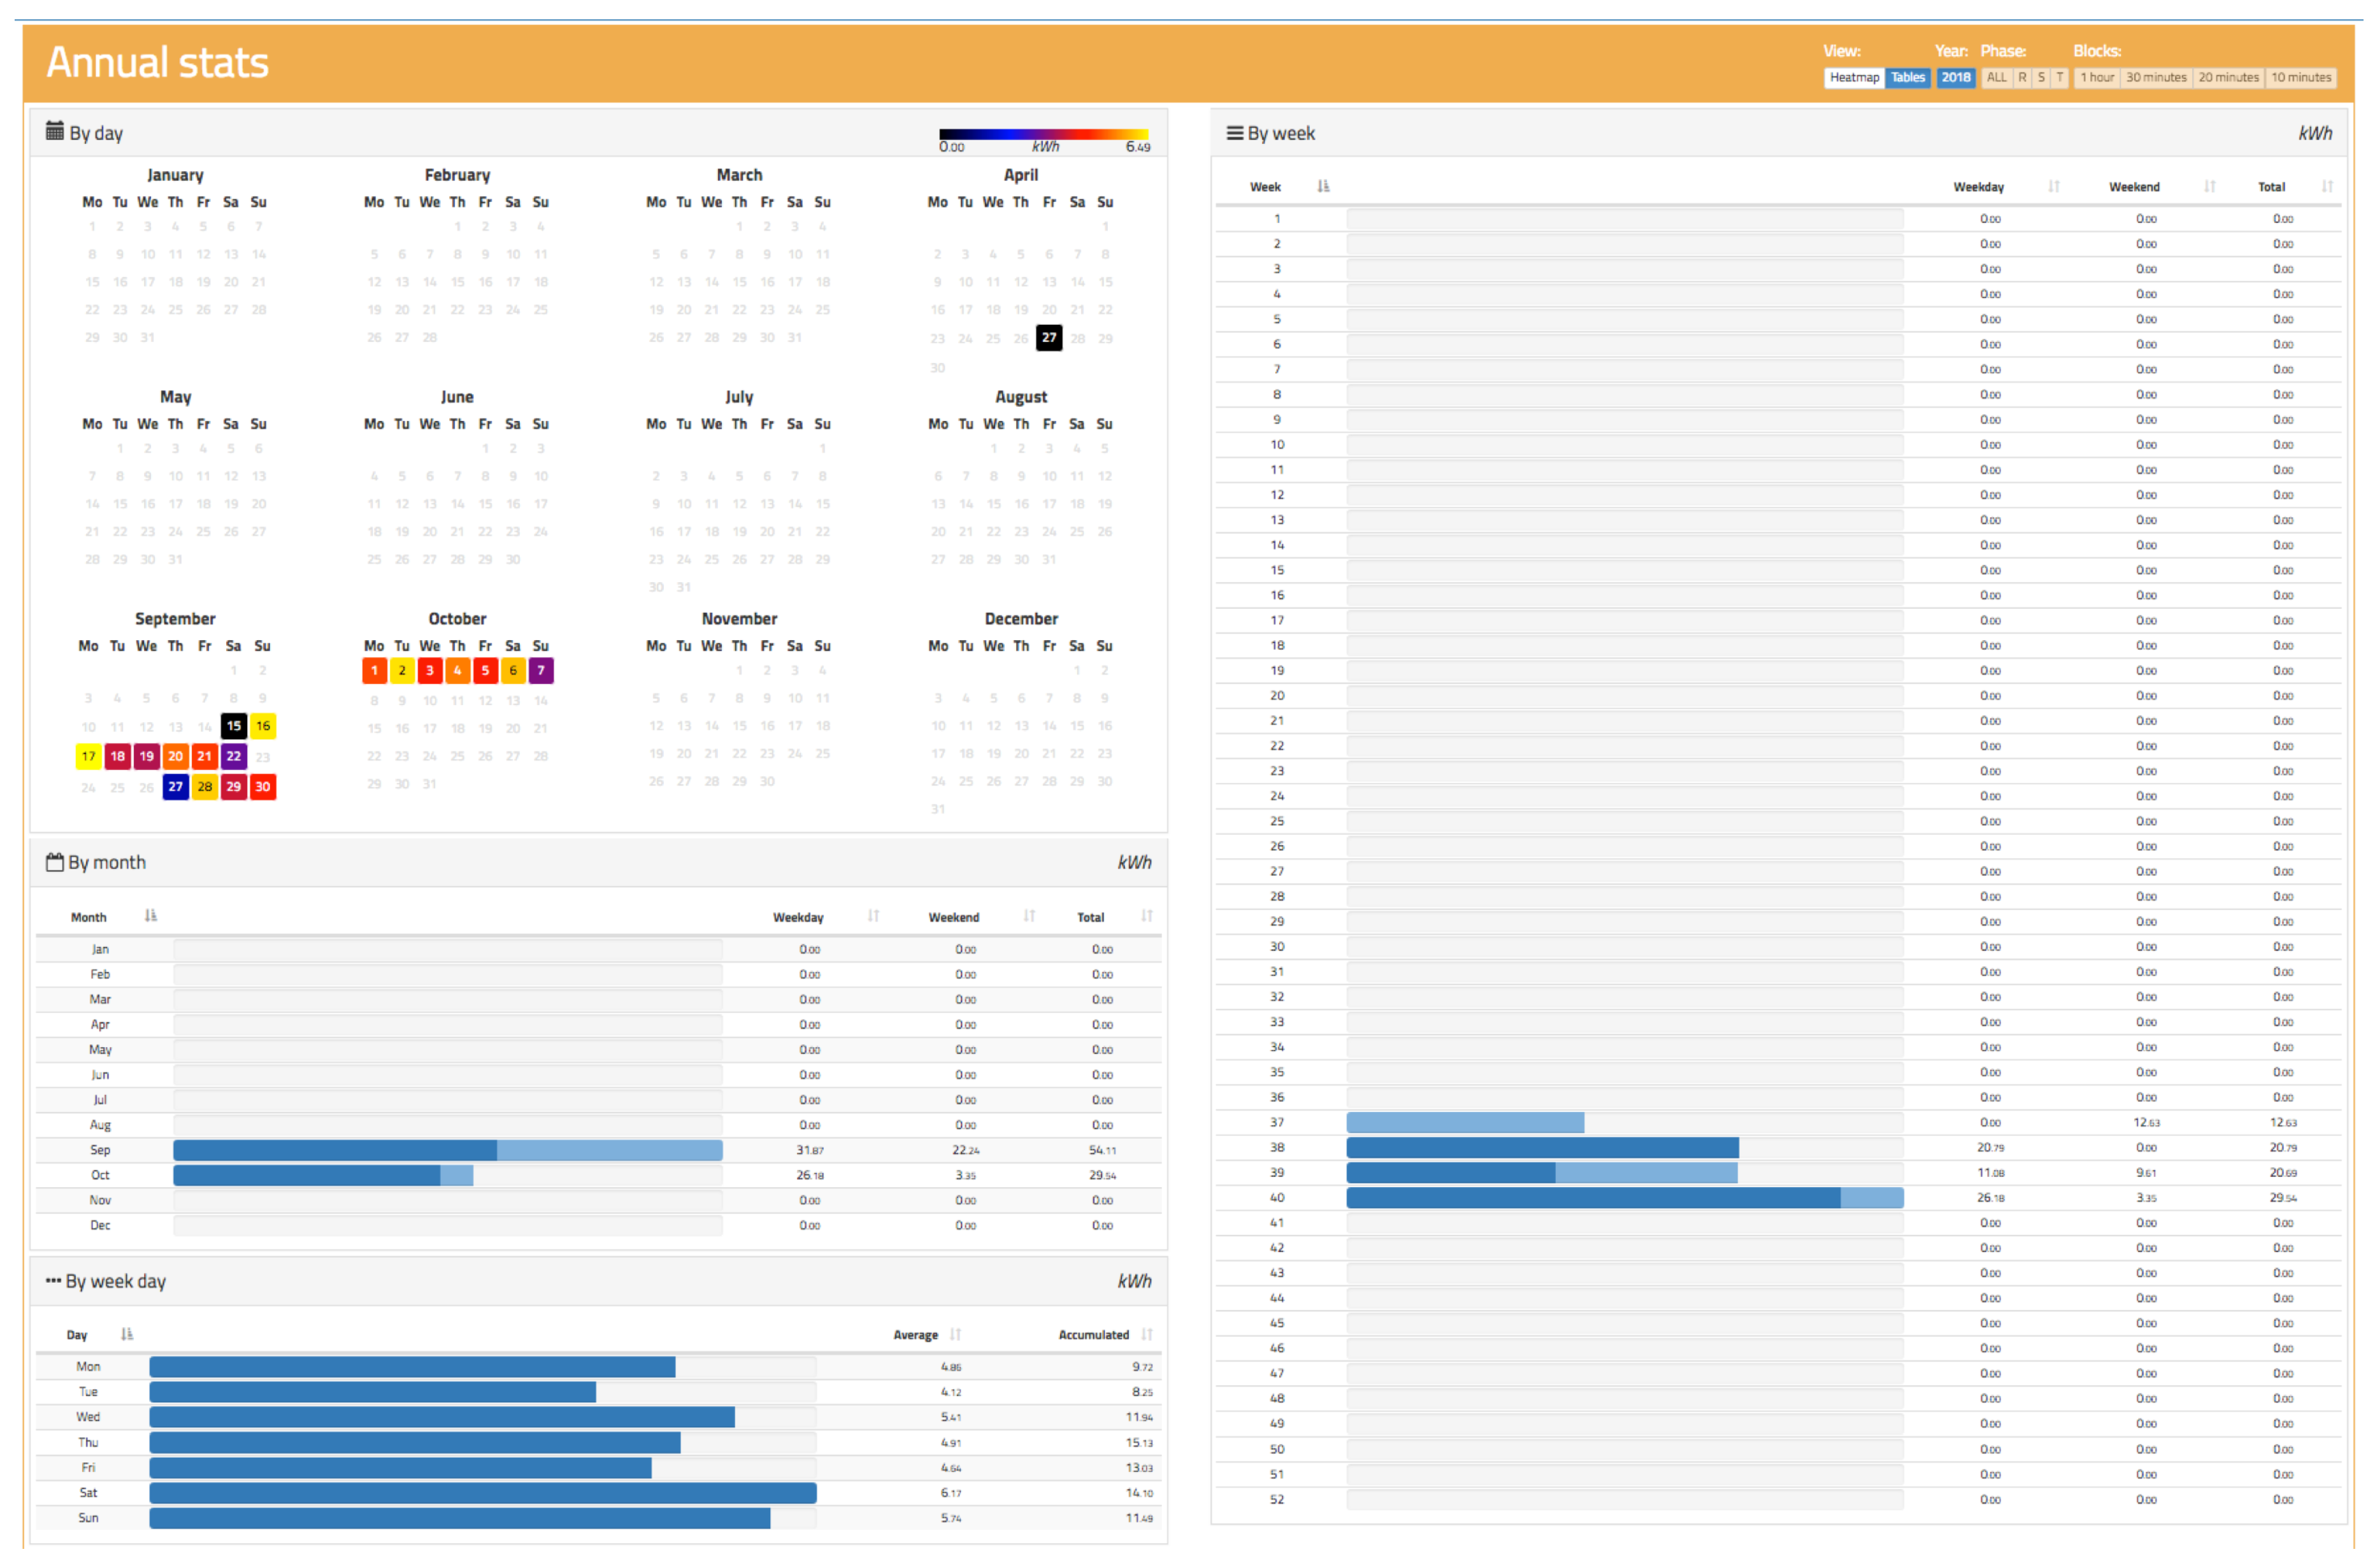
Energy consumption and generation in four quadrants
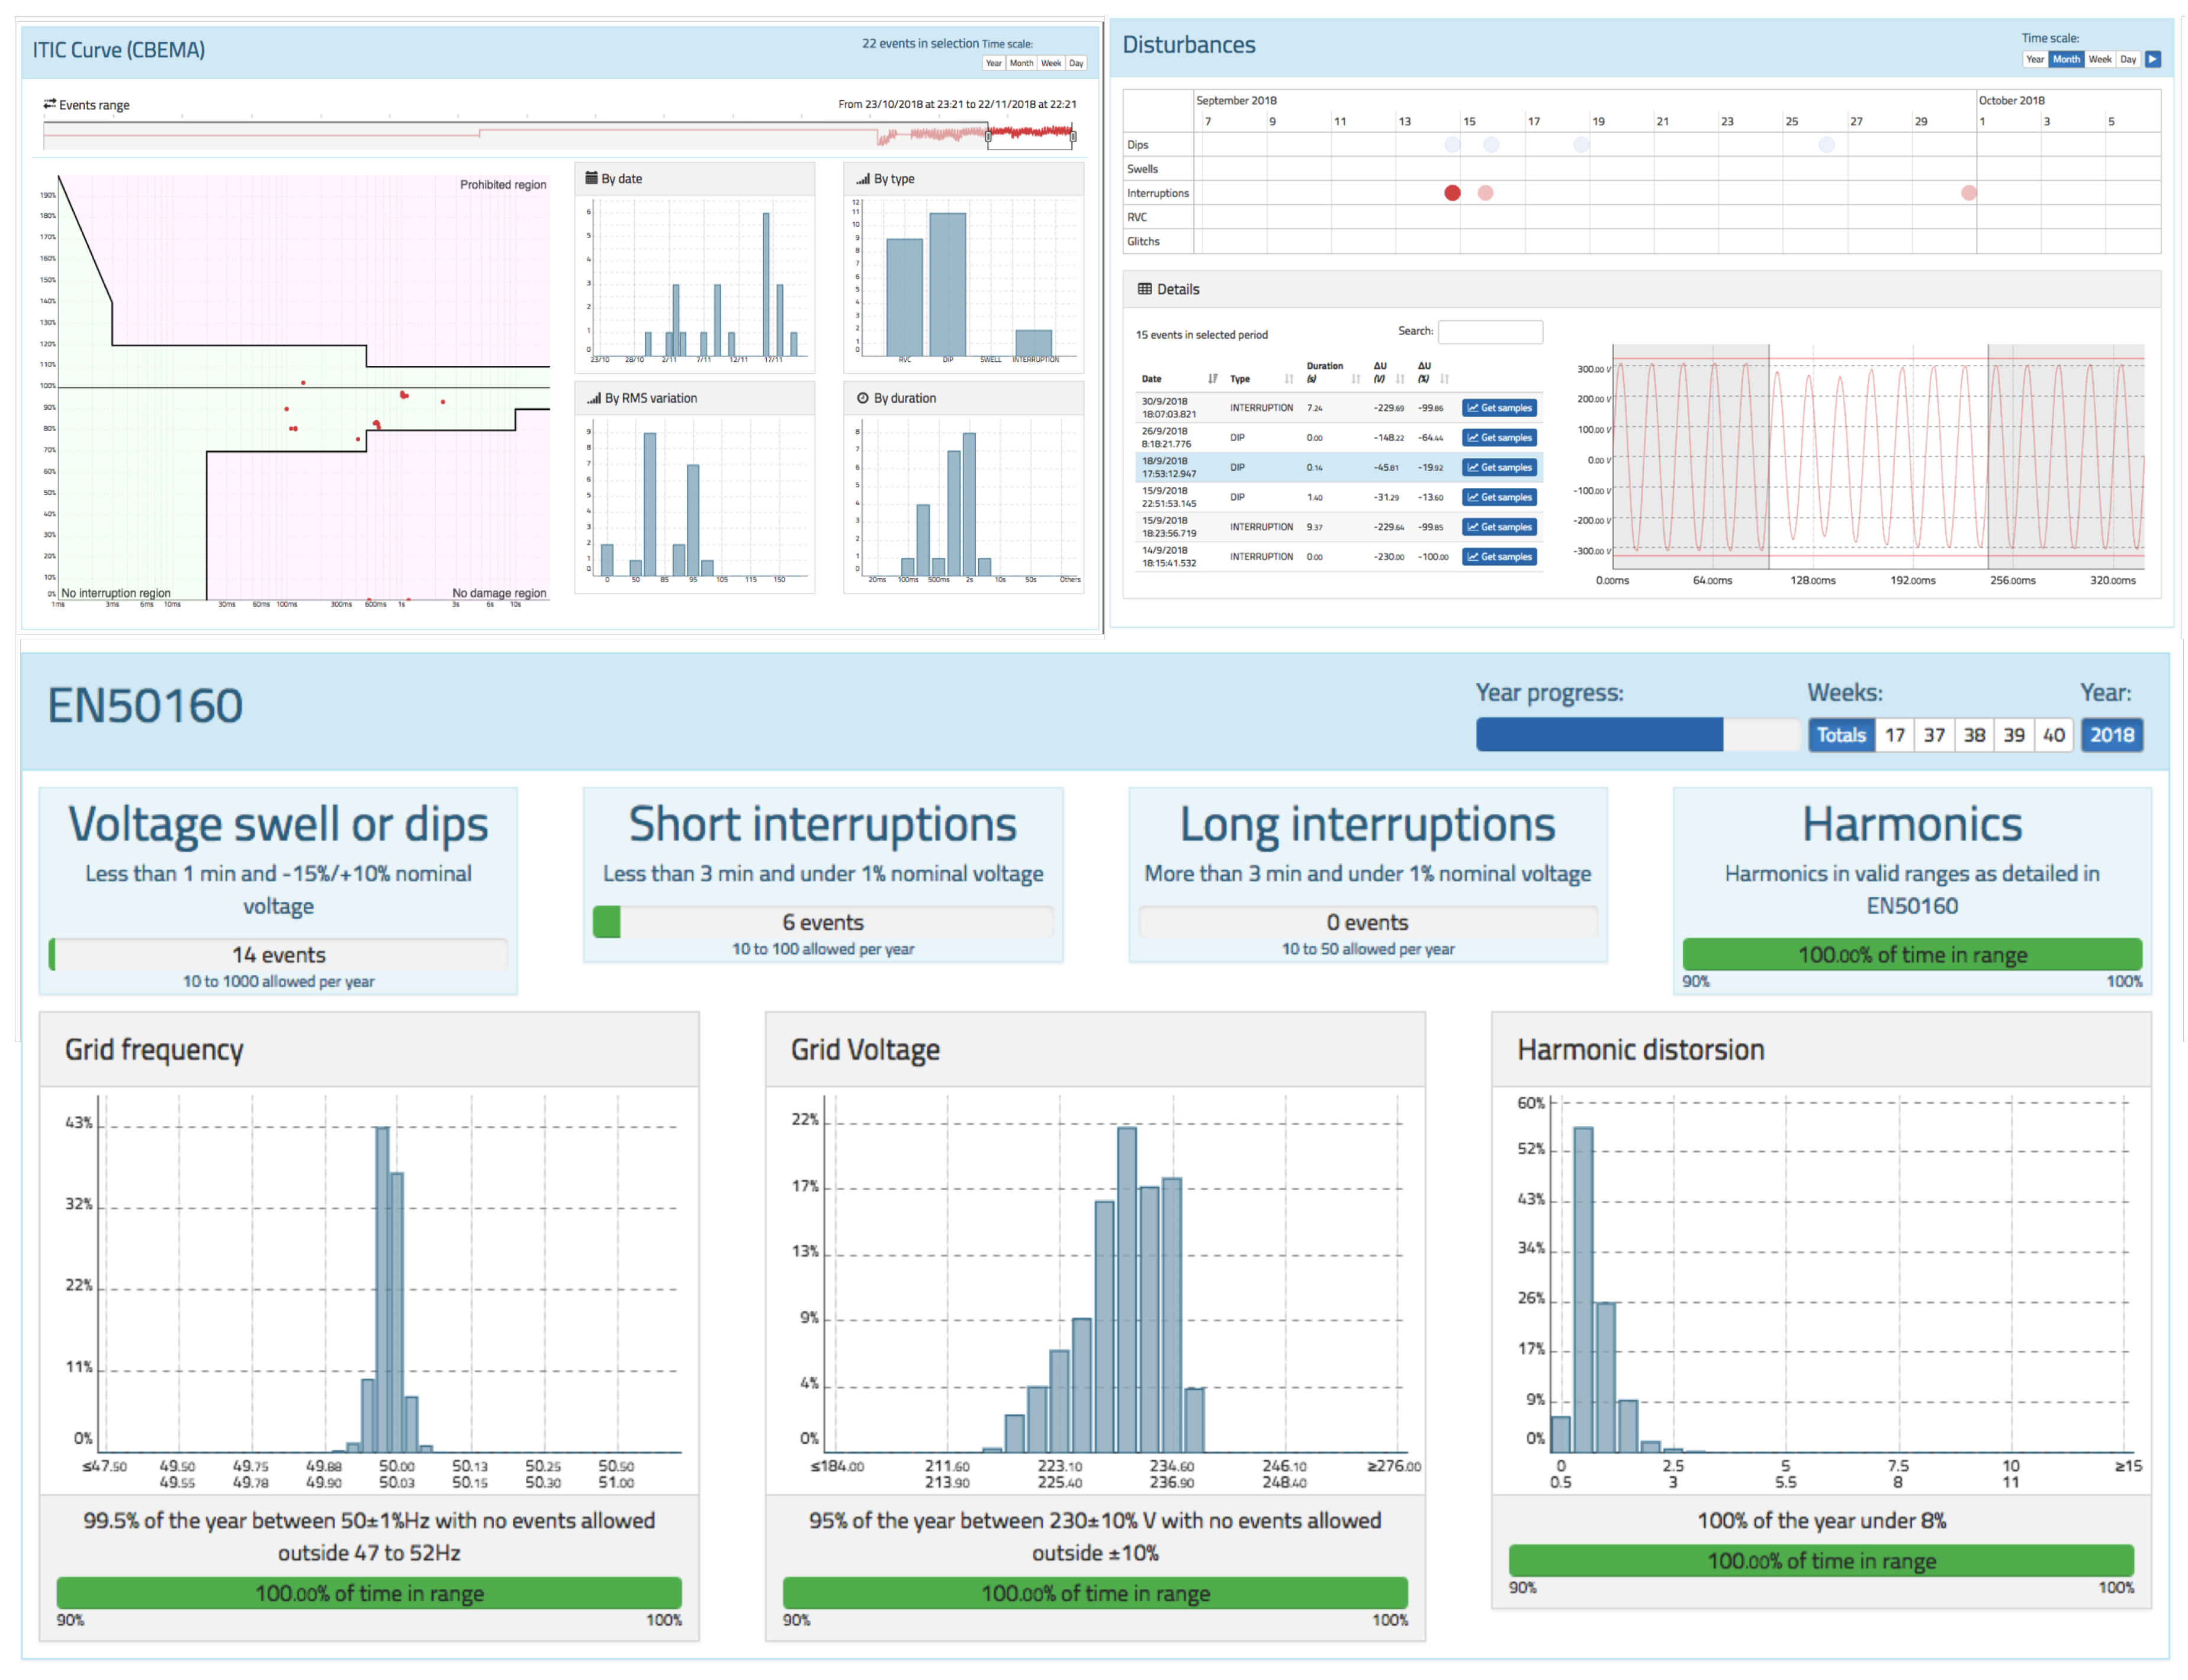
Operation in accordance with international standards IEC 61000-4-30 and EN-50160
Aggregation for the voltage channel of 3 s, 1 min, 10 min, and 1 h as extra aggregation for energy metering purposes
Alert system and event management (ITIC/CBEMA, frequency, etc.)
Cutting-edge HTML, Javascript, and CSS3 technologies for a user-friendly dashboard interface
API for third-party integration using JSON
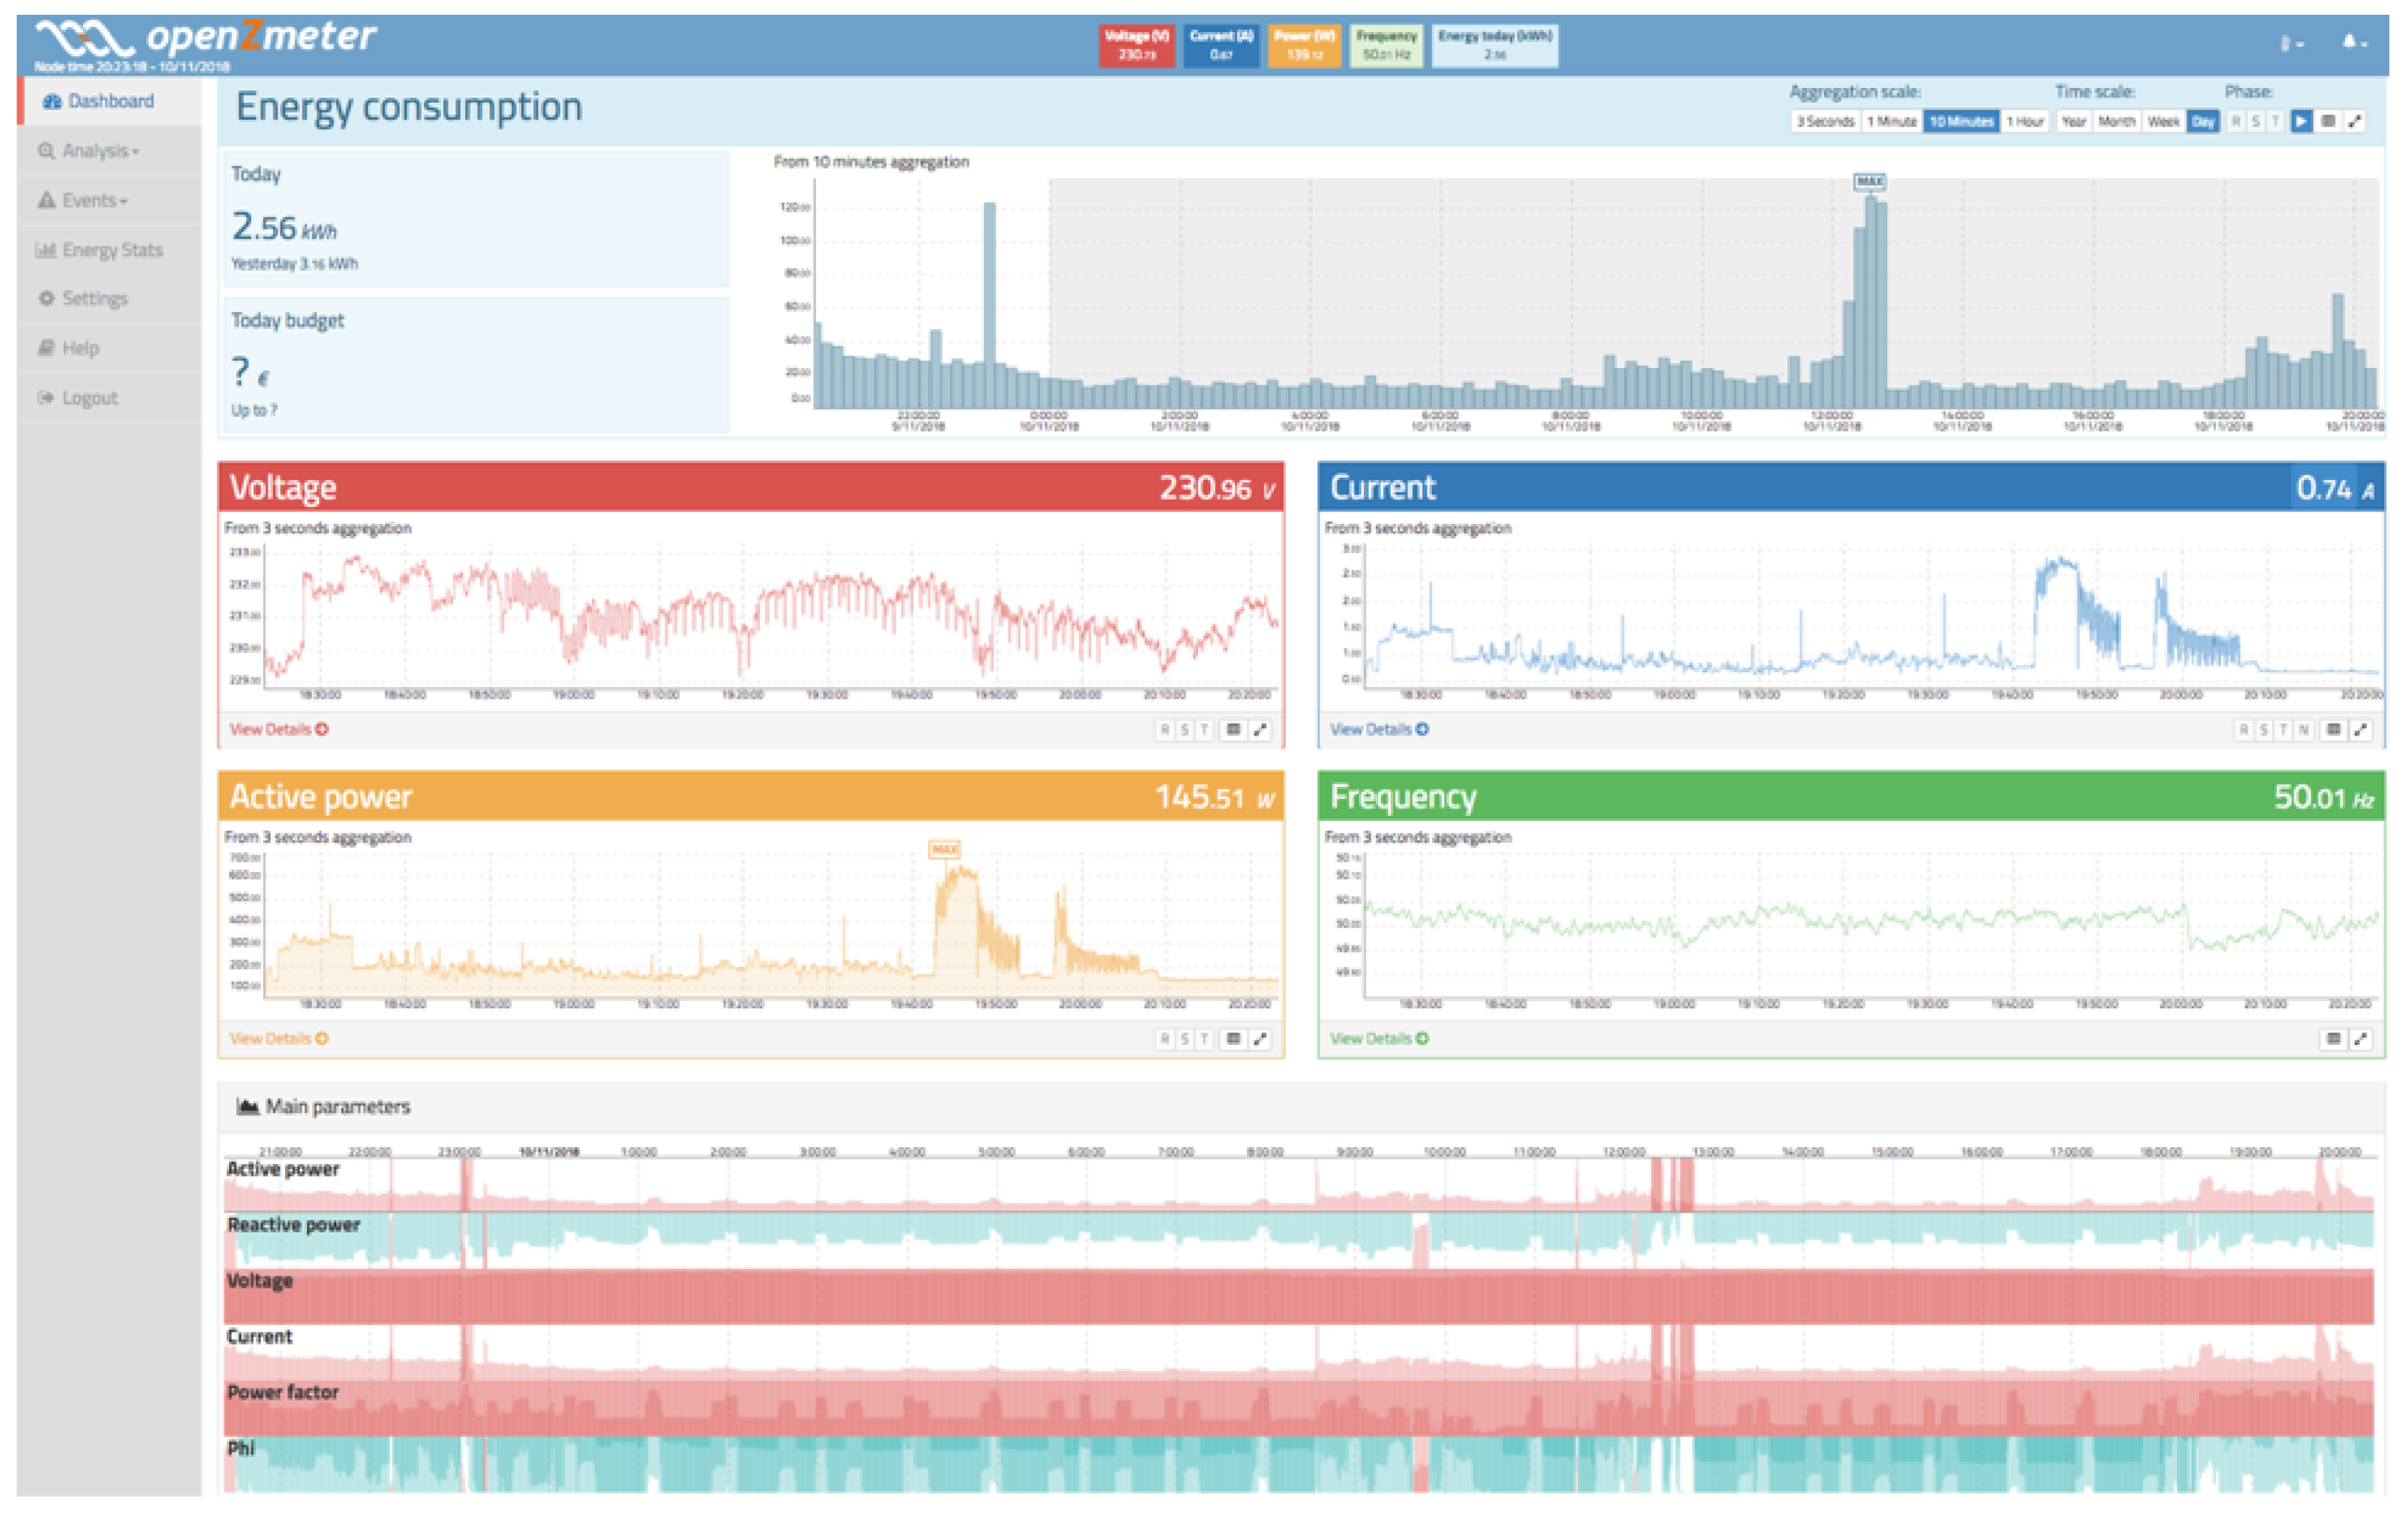
Figure 6 shows a main view of the real-time PQ monitoring and smart metering software.
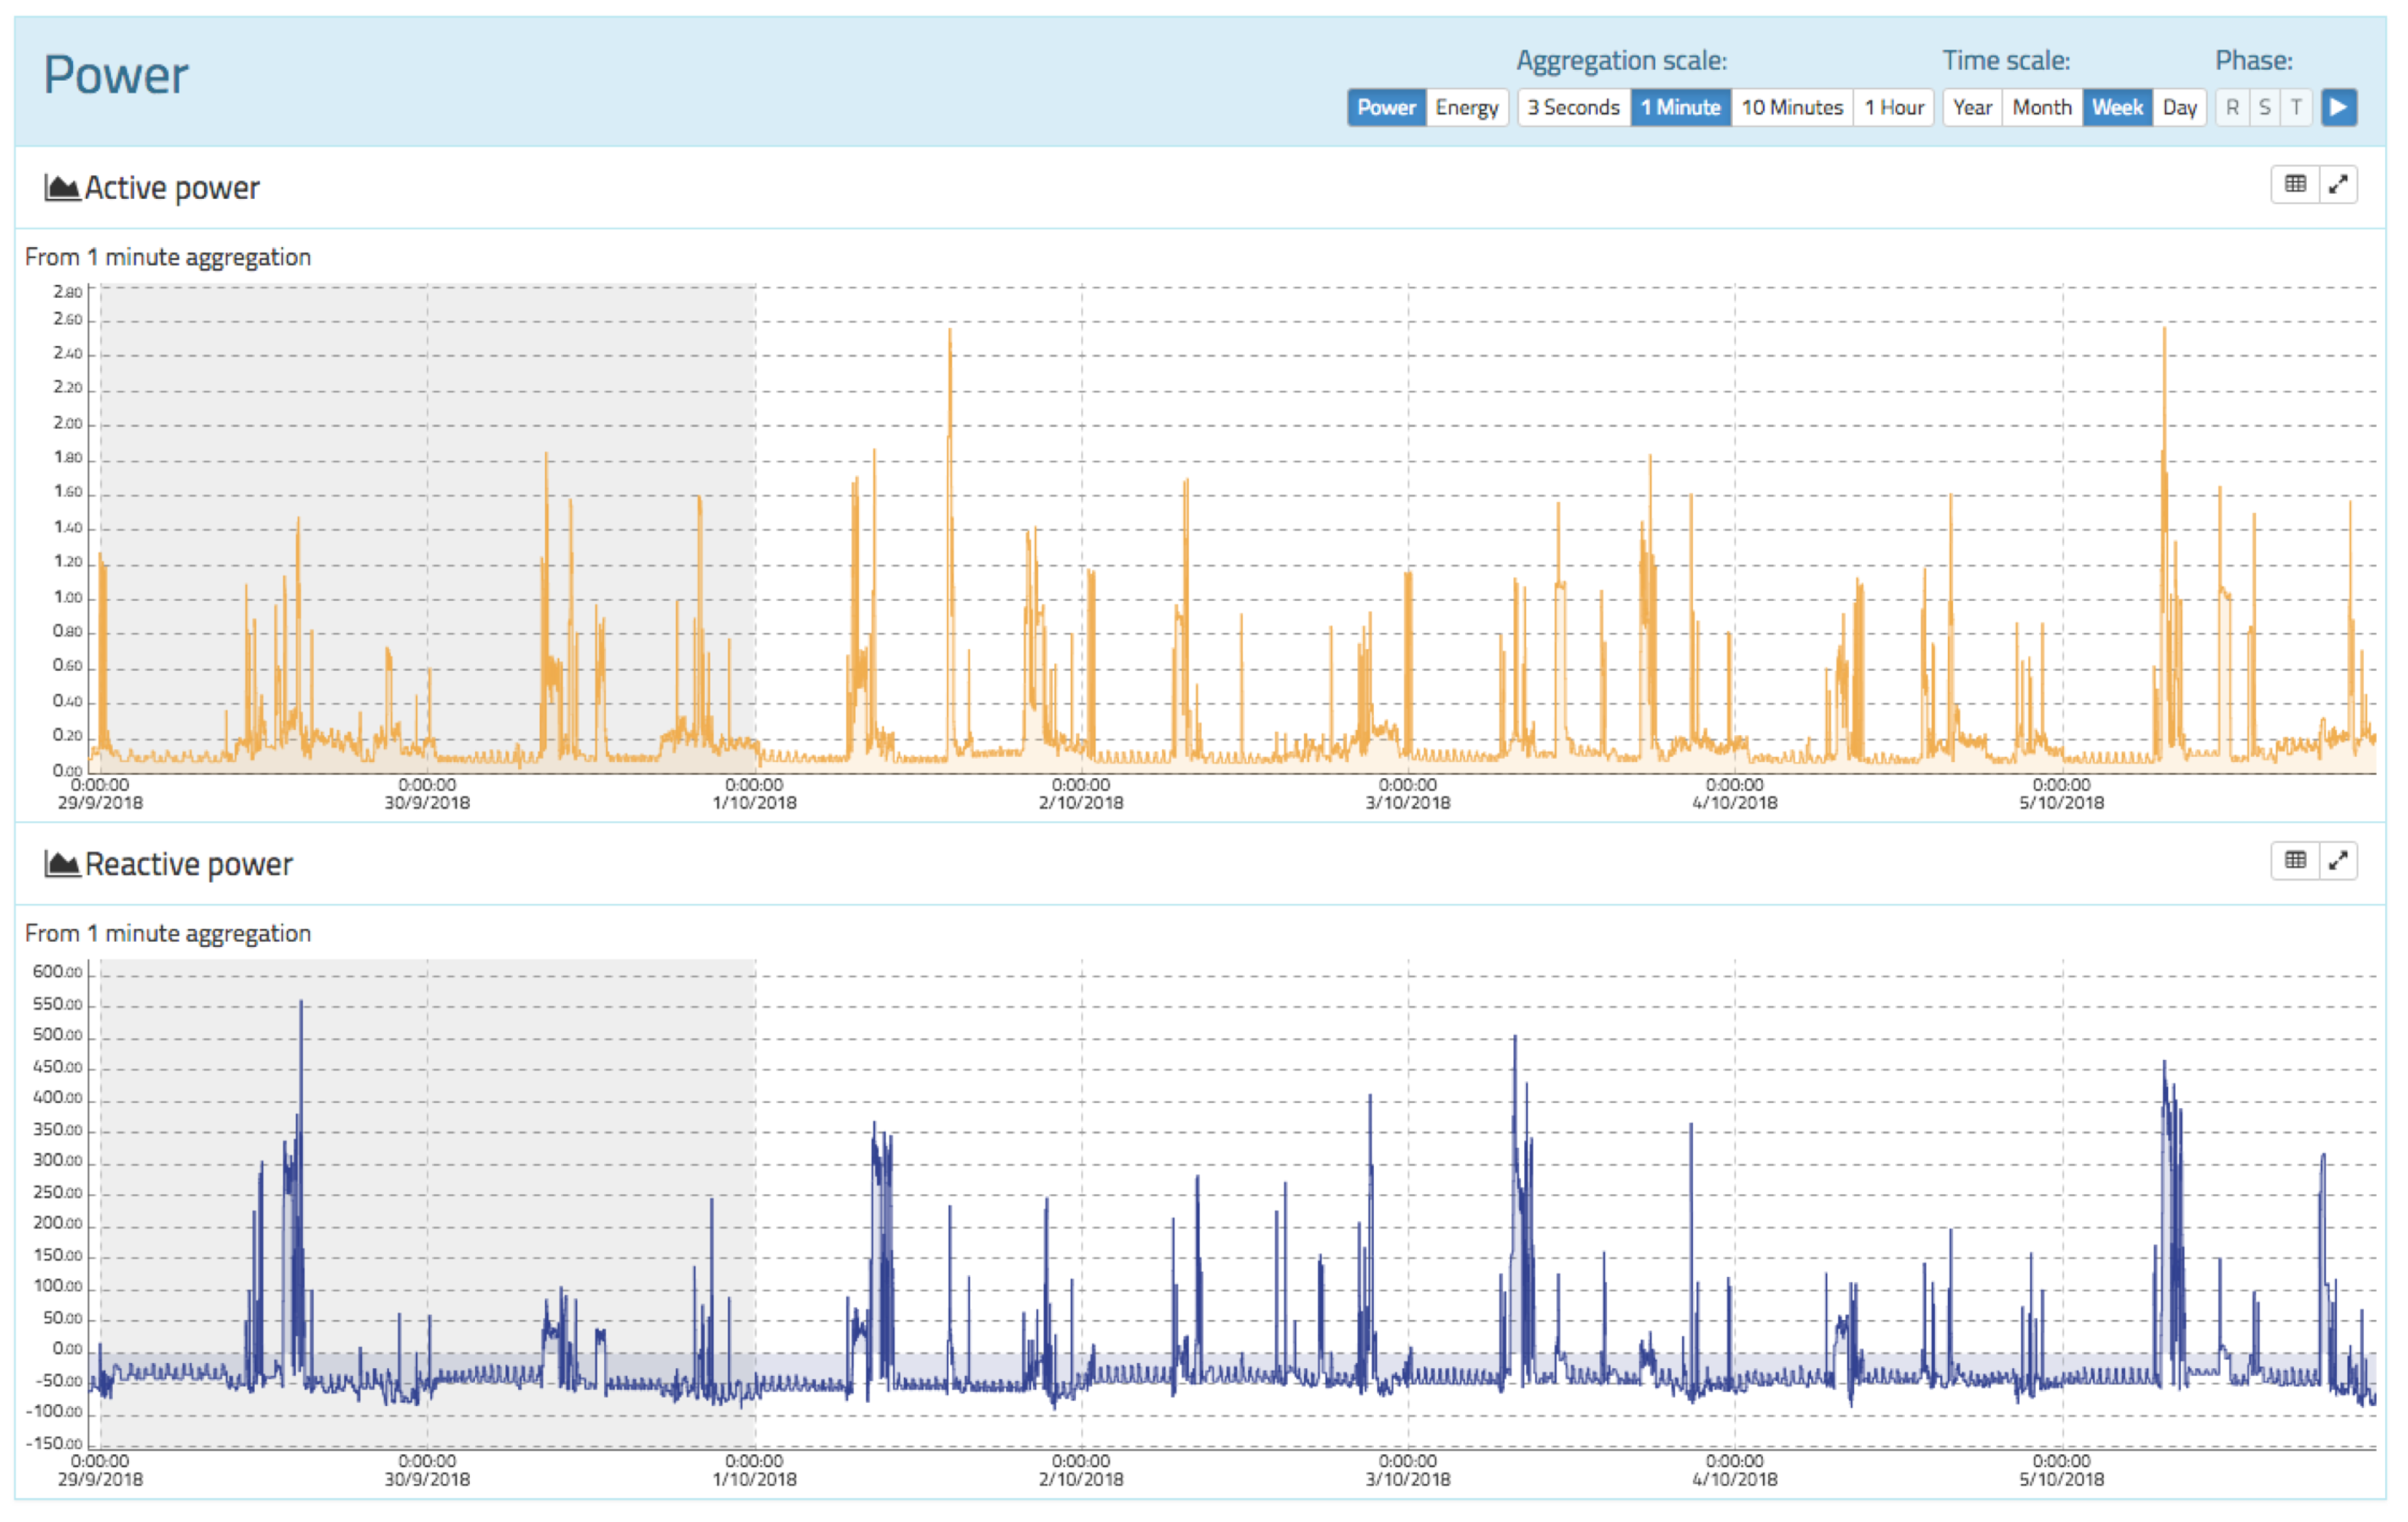
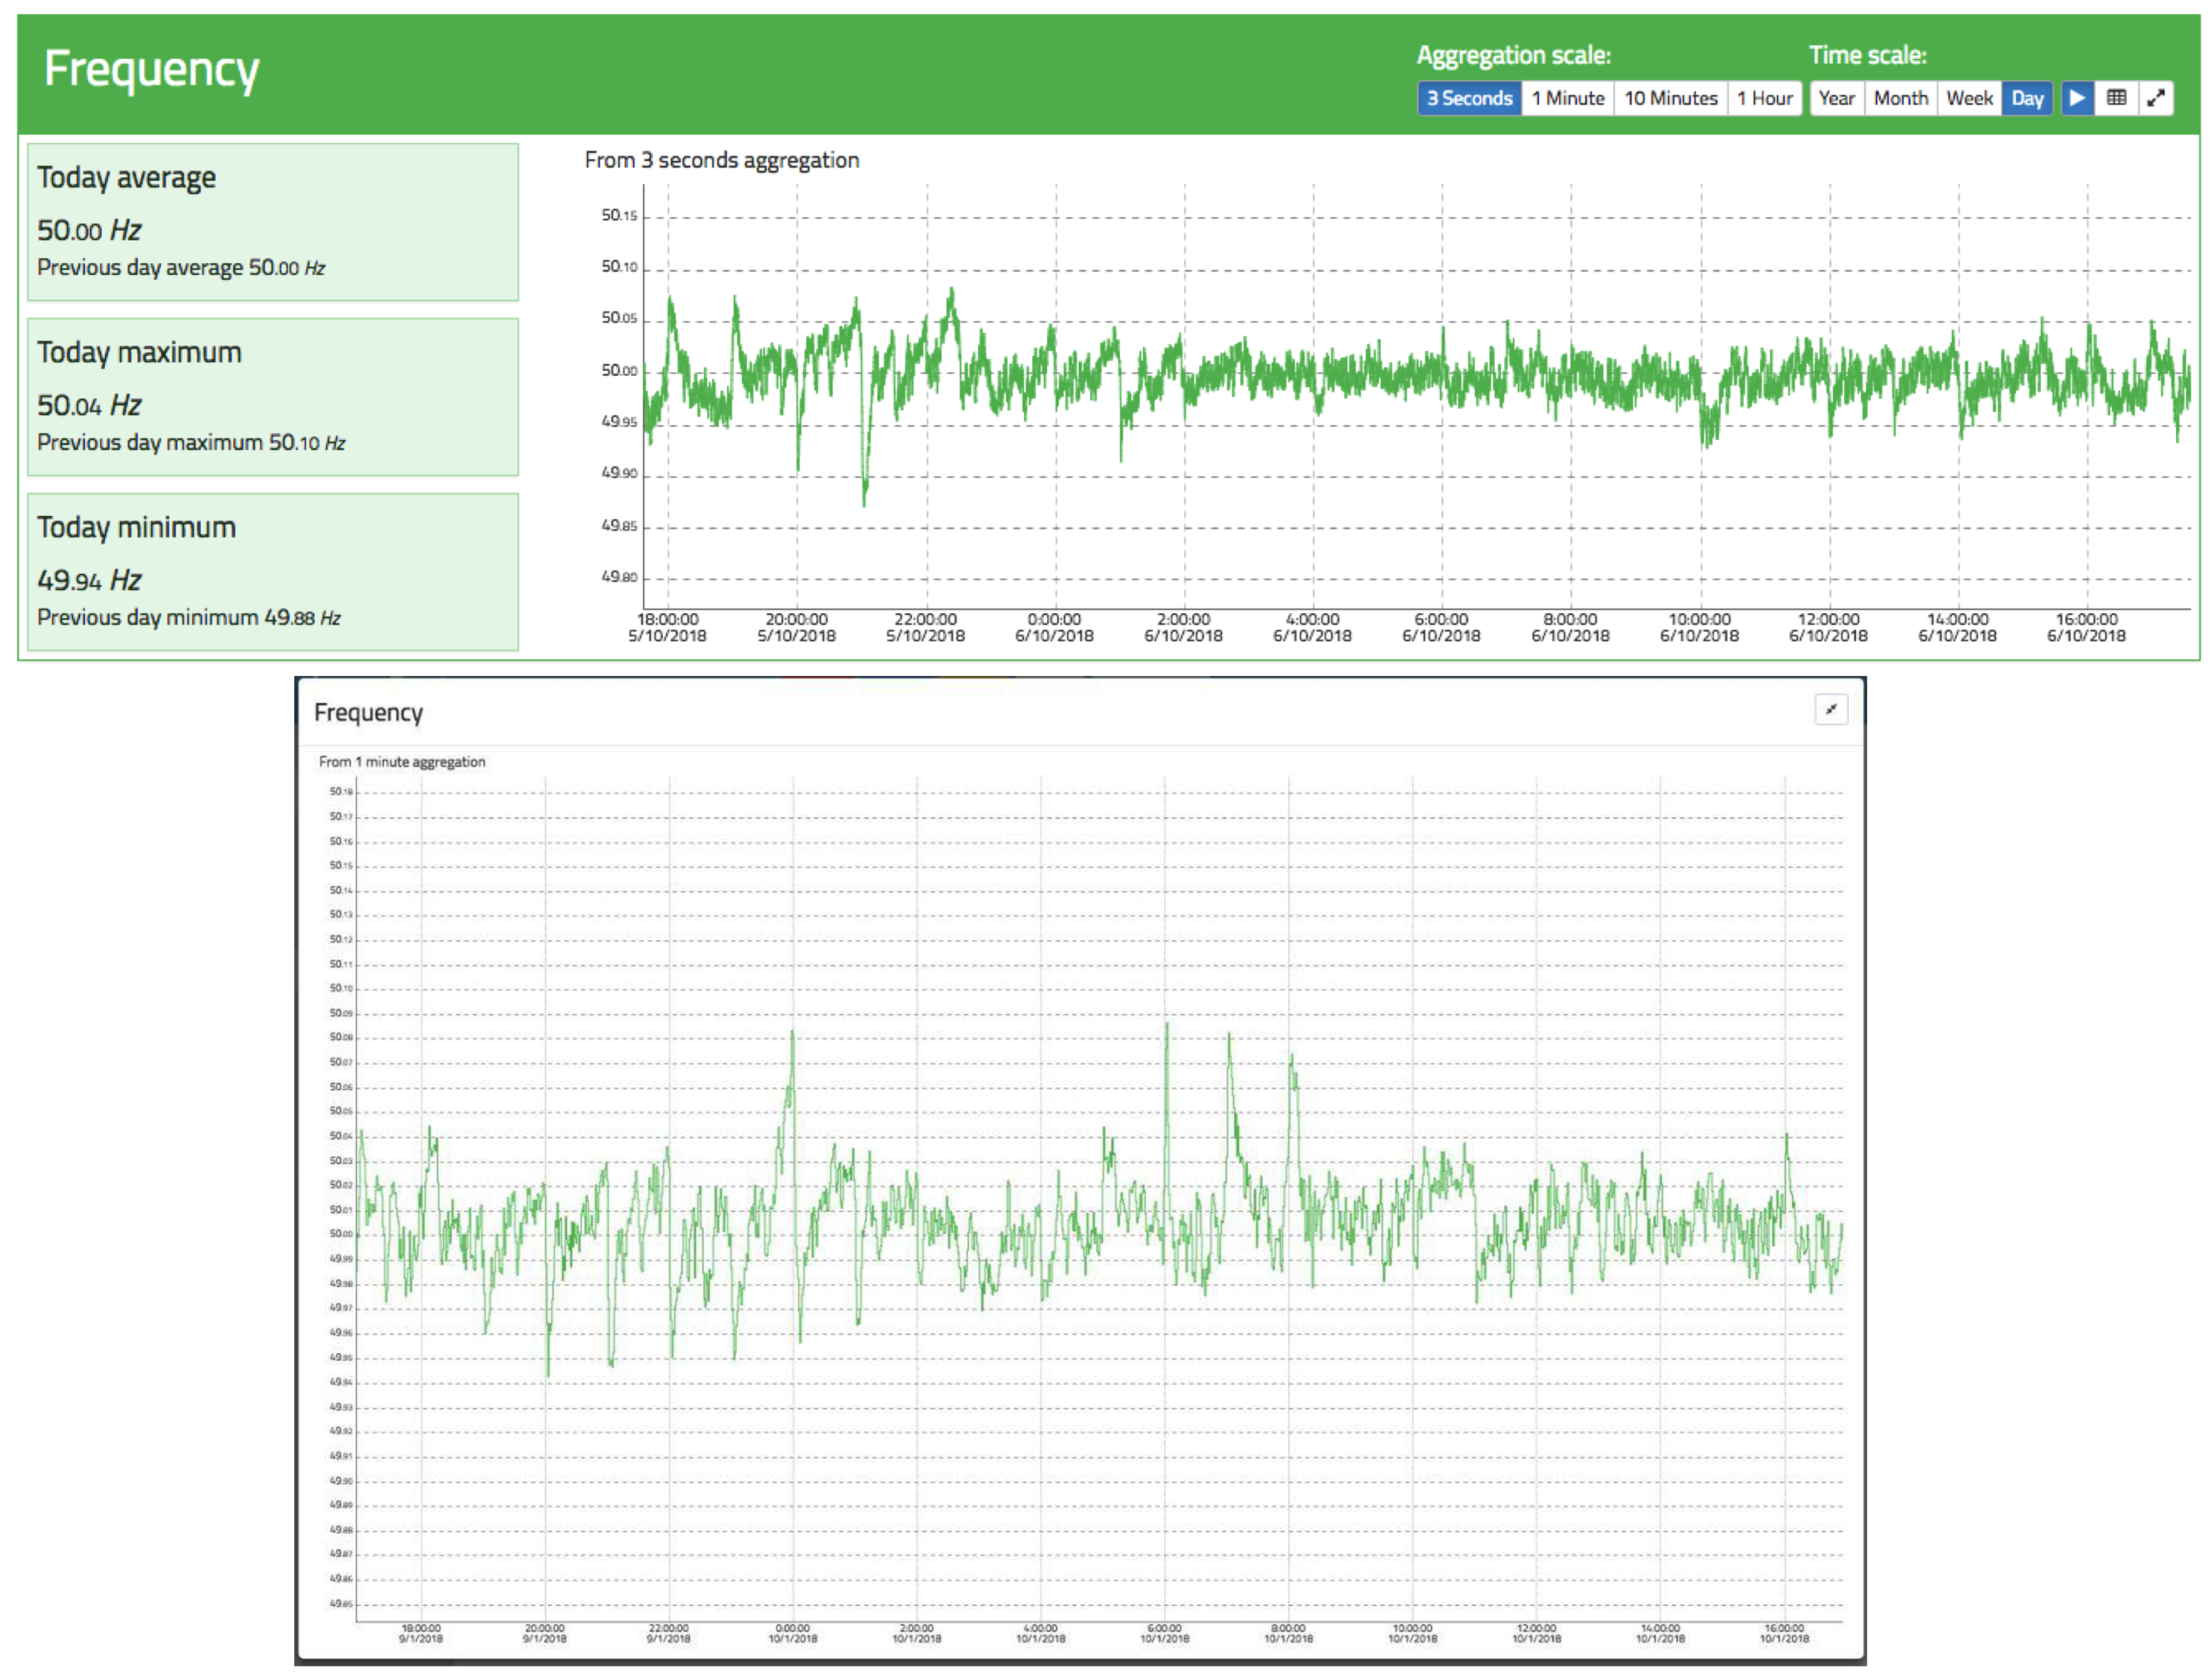
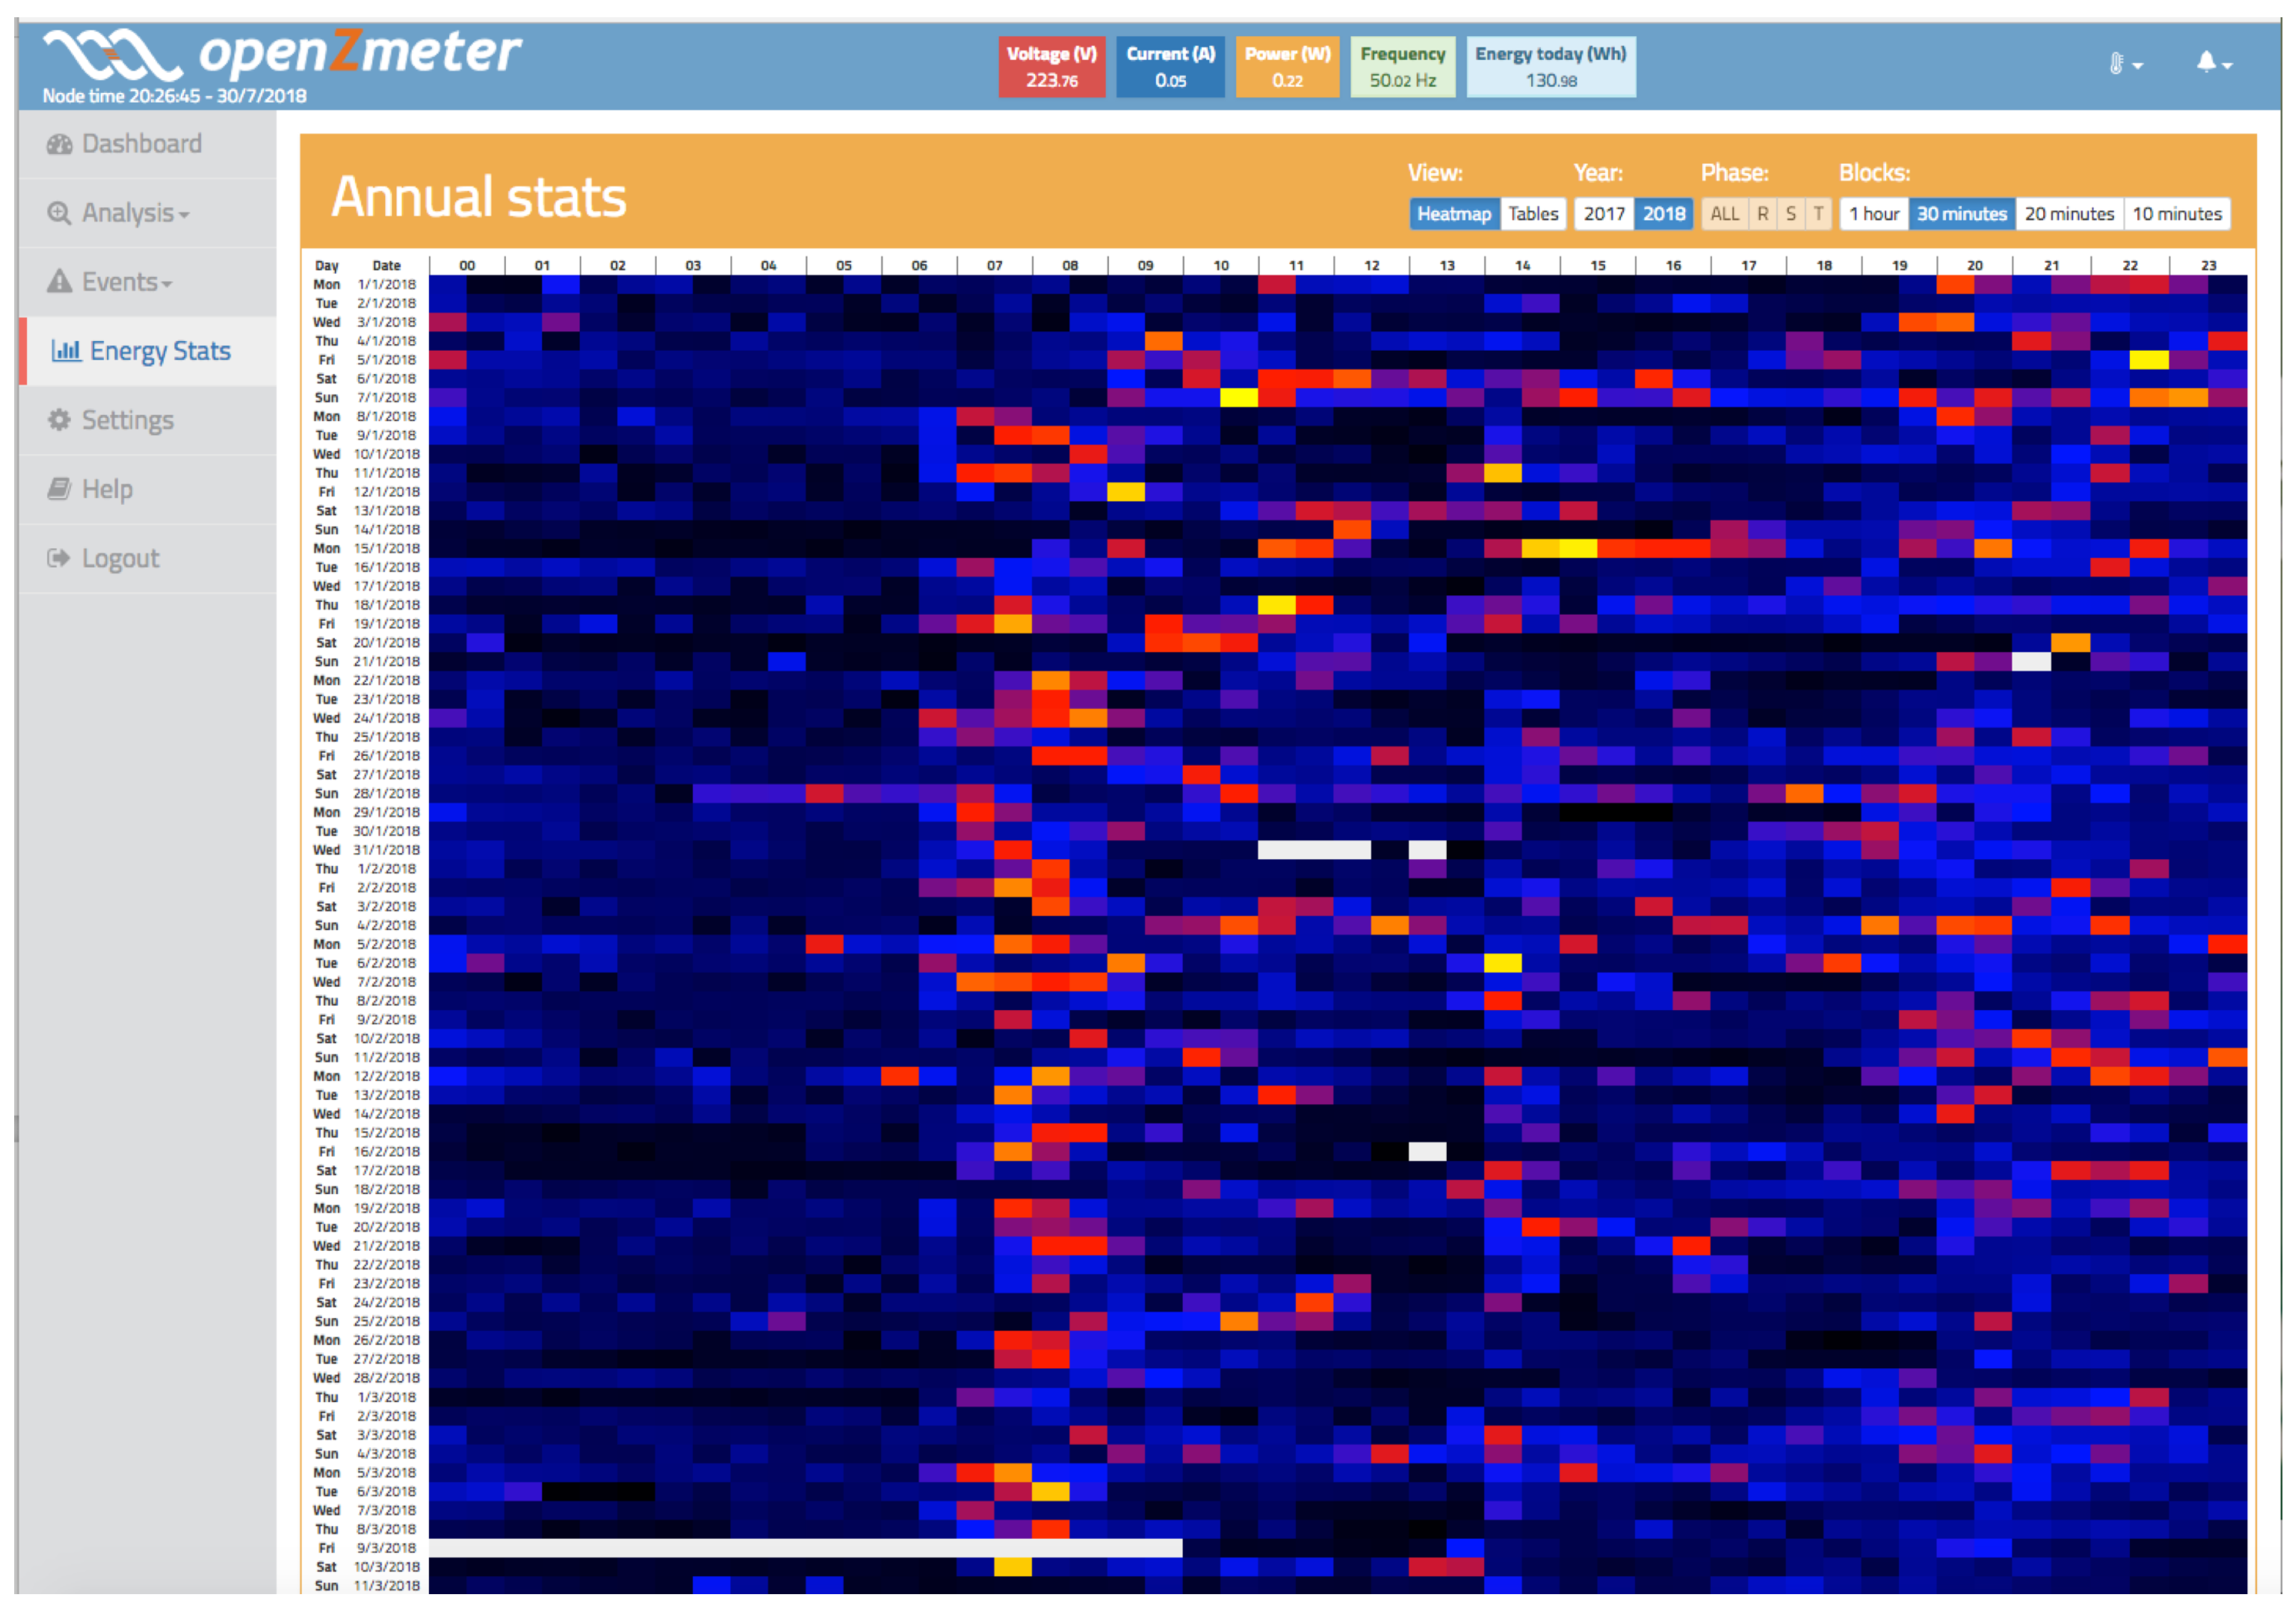
The parameters are displayed in real time and are presented using an intuitive dashboard, where the data are refreshed dynamically using cutting-edge web technologies such as HTML5, CSS3, and Javascript. Five blocks are plotted for active energy consumption, RMS voltage, RMS current, active power, and grid frequency. Each plot can be maximized for better inspection. All blocks are plotted using a 3 s aggregation interval over the previous 2 h to obtain fine-grained resolution. In addition, the energy block has a more advanced selector in order to choose other resolutions or aggregations. All blocks except for the energy block are synchronized to display information for the same time frame. The rest of the web interface is divided into six sections: voltage, current, power, frequency, voltage events, and energy stats.
Per IEC61000-4-30, the preferred time interval window is 10 cycles of the voltage waveform, i.e., 200 ms for a perfect 50 Hz European grid signal. Using this time interval allows harmonic calculations to be synchronous to all other values such as RMS and Total Harmonic Distortion (THD). In the case of a 60 Hz grid, 200 ms is equivalent to 12 cycles.
Harmonics are calculated using an adapted version of the well-known and stable open-source FFTW3 implementation [
47] up to the 50th order for both voltage and current. The data are stored in the local database each 200 ms, and it is possible to retrieve aggregated data using custom methods implemented in the software. Interharmonics components were minimized thanks to the implemented digital filters, which remove artifacts and allow for precise frequency measurement based on zero-crossing techniques.
External time synchronization was implemented to achieve accurate timestamps by means of network time protocol (NTP) time servers. Accuracy is specified at ±20 ms for 50 Hz and ±16.7 ms for 60 Hz instruments with a 10 min interval sync to clock and a 2 h interval sync to clock. To ensure compliance with standard specifications, an efficient NTP implementation was deployed using the Chrony package for Linux [
48].
4. Conclusions
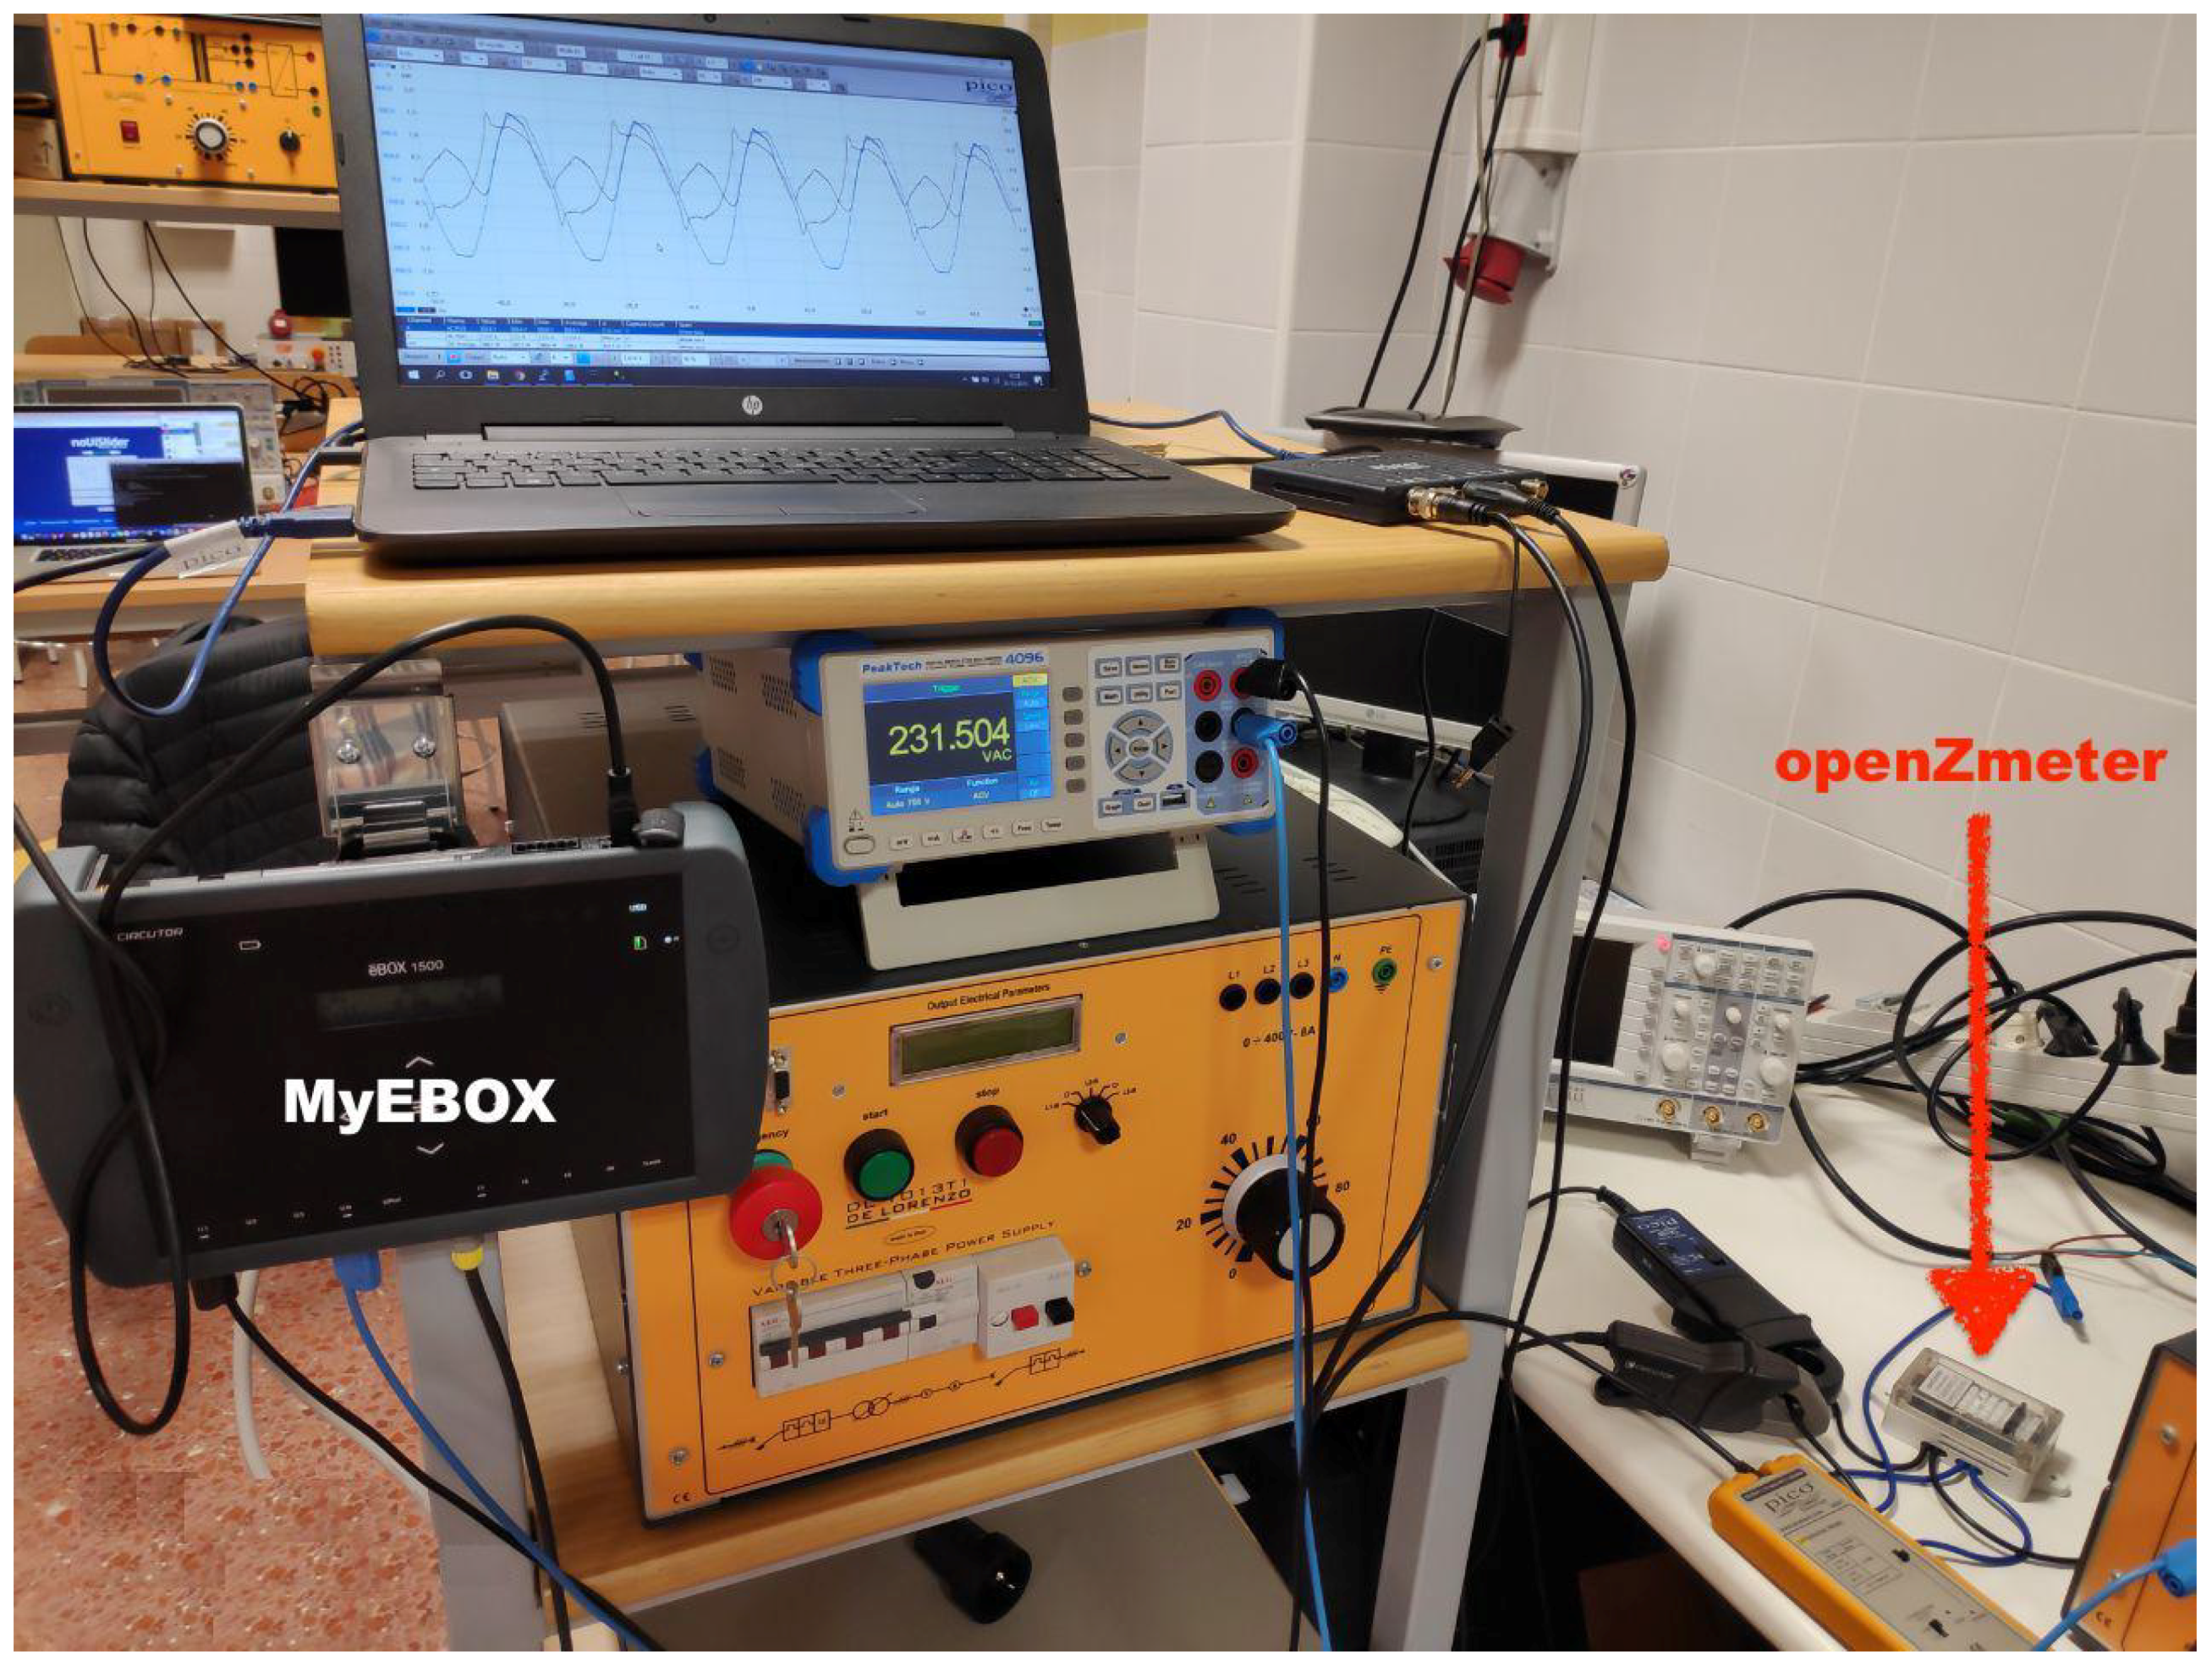
Nowadays, most electrical installations are monitored using commercial devices that are often expensive and difficult to handle for non-expert users. The main contribution of this research is the description of the oZm hardware, a low-cost, open-source, Internet-based multipurpose network analyzer and smart meter that has been designed, manufactured, and implemented for power quality and energy metering and submetering of electrical installations. The advanced design of oZm ensures reliable and accurate energy consumption and power quality measurements under a wide range of operating conditions in a single handy device. It can be used by anyone to analyze and visualize power consumption measurements and power quality events that comply with international standards such as IEC 61000-4-30 and EN-50160. Given its small size and large variety of current probes, it can be easily installed at any electrical installation, i.e., it can be used both as bulk metering or as metering/submetering for individual units or appliances. A comparison with commercial devices is also carried out. The characteristics and operation of oZm have been compared with MyEBOX-1500, an advanced commercial and certified power quality and energy meter. The results obtained in the laboratory show similar readings with minimal deviation. This comparison clearly shows that oZm is able to measure and record high precision RMS voltages, currents, frequency, and power quality events in different scenarios. Finally, other important contribution of the paper is to present and display a large number of measurements with an user-friendly interface that can be customized according the particular needs.
The acquired data is stored in a local PostgreSQL database, which is accessible using the network of the campus and a browser from any connected device. The main dashboard is accessible using the http protocol through an https secure layer. The potential benefits of oZm for domestic or industrial applications were demonstrated by the set of advanced measures it performs. The system proposed can be used for smart-grid studies and for advanced technique development such as non-intrusive load monitoring and machine learning applied to power quality. Moreover, the device is very easy to install and use by nonspecialized staff.
Although not all definitions of international standards IEC 61000-4-30 and EN-50160 were implemented, oZm is a constantly evolving project supported by the community. Research teams from several universities aim to complete and fulfill the requirements imposed by these standards. As a future work, we are now working on the development of a three-phase version of oZm.

 ,
, 


