3.1. Adsorption on SiSe Monolayer
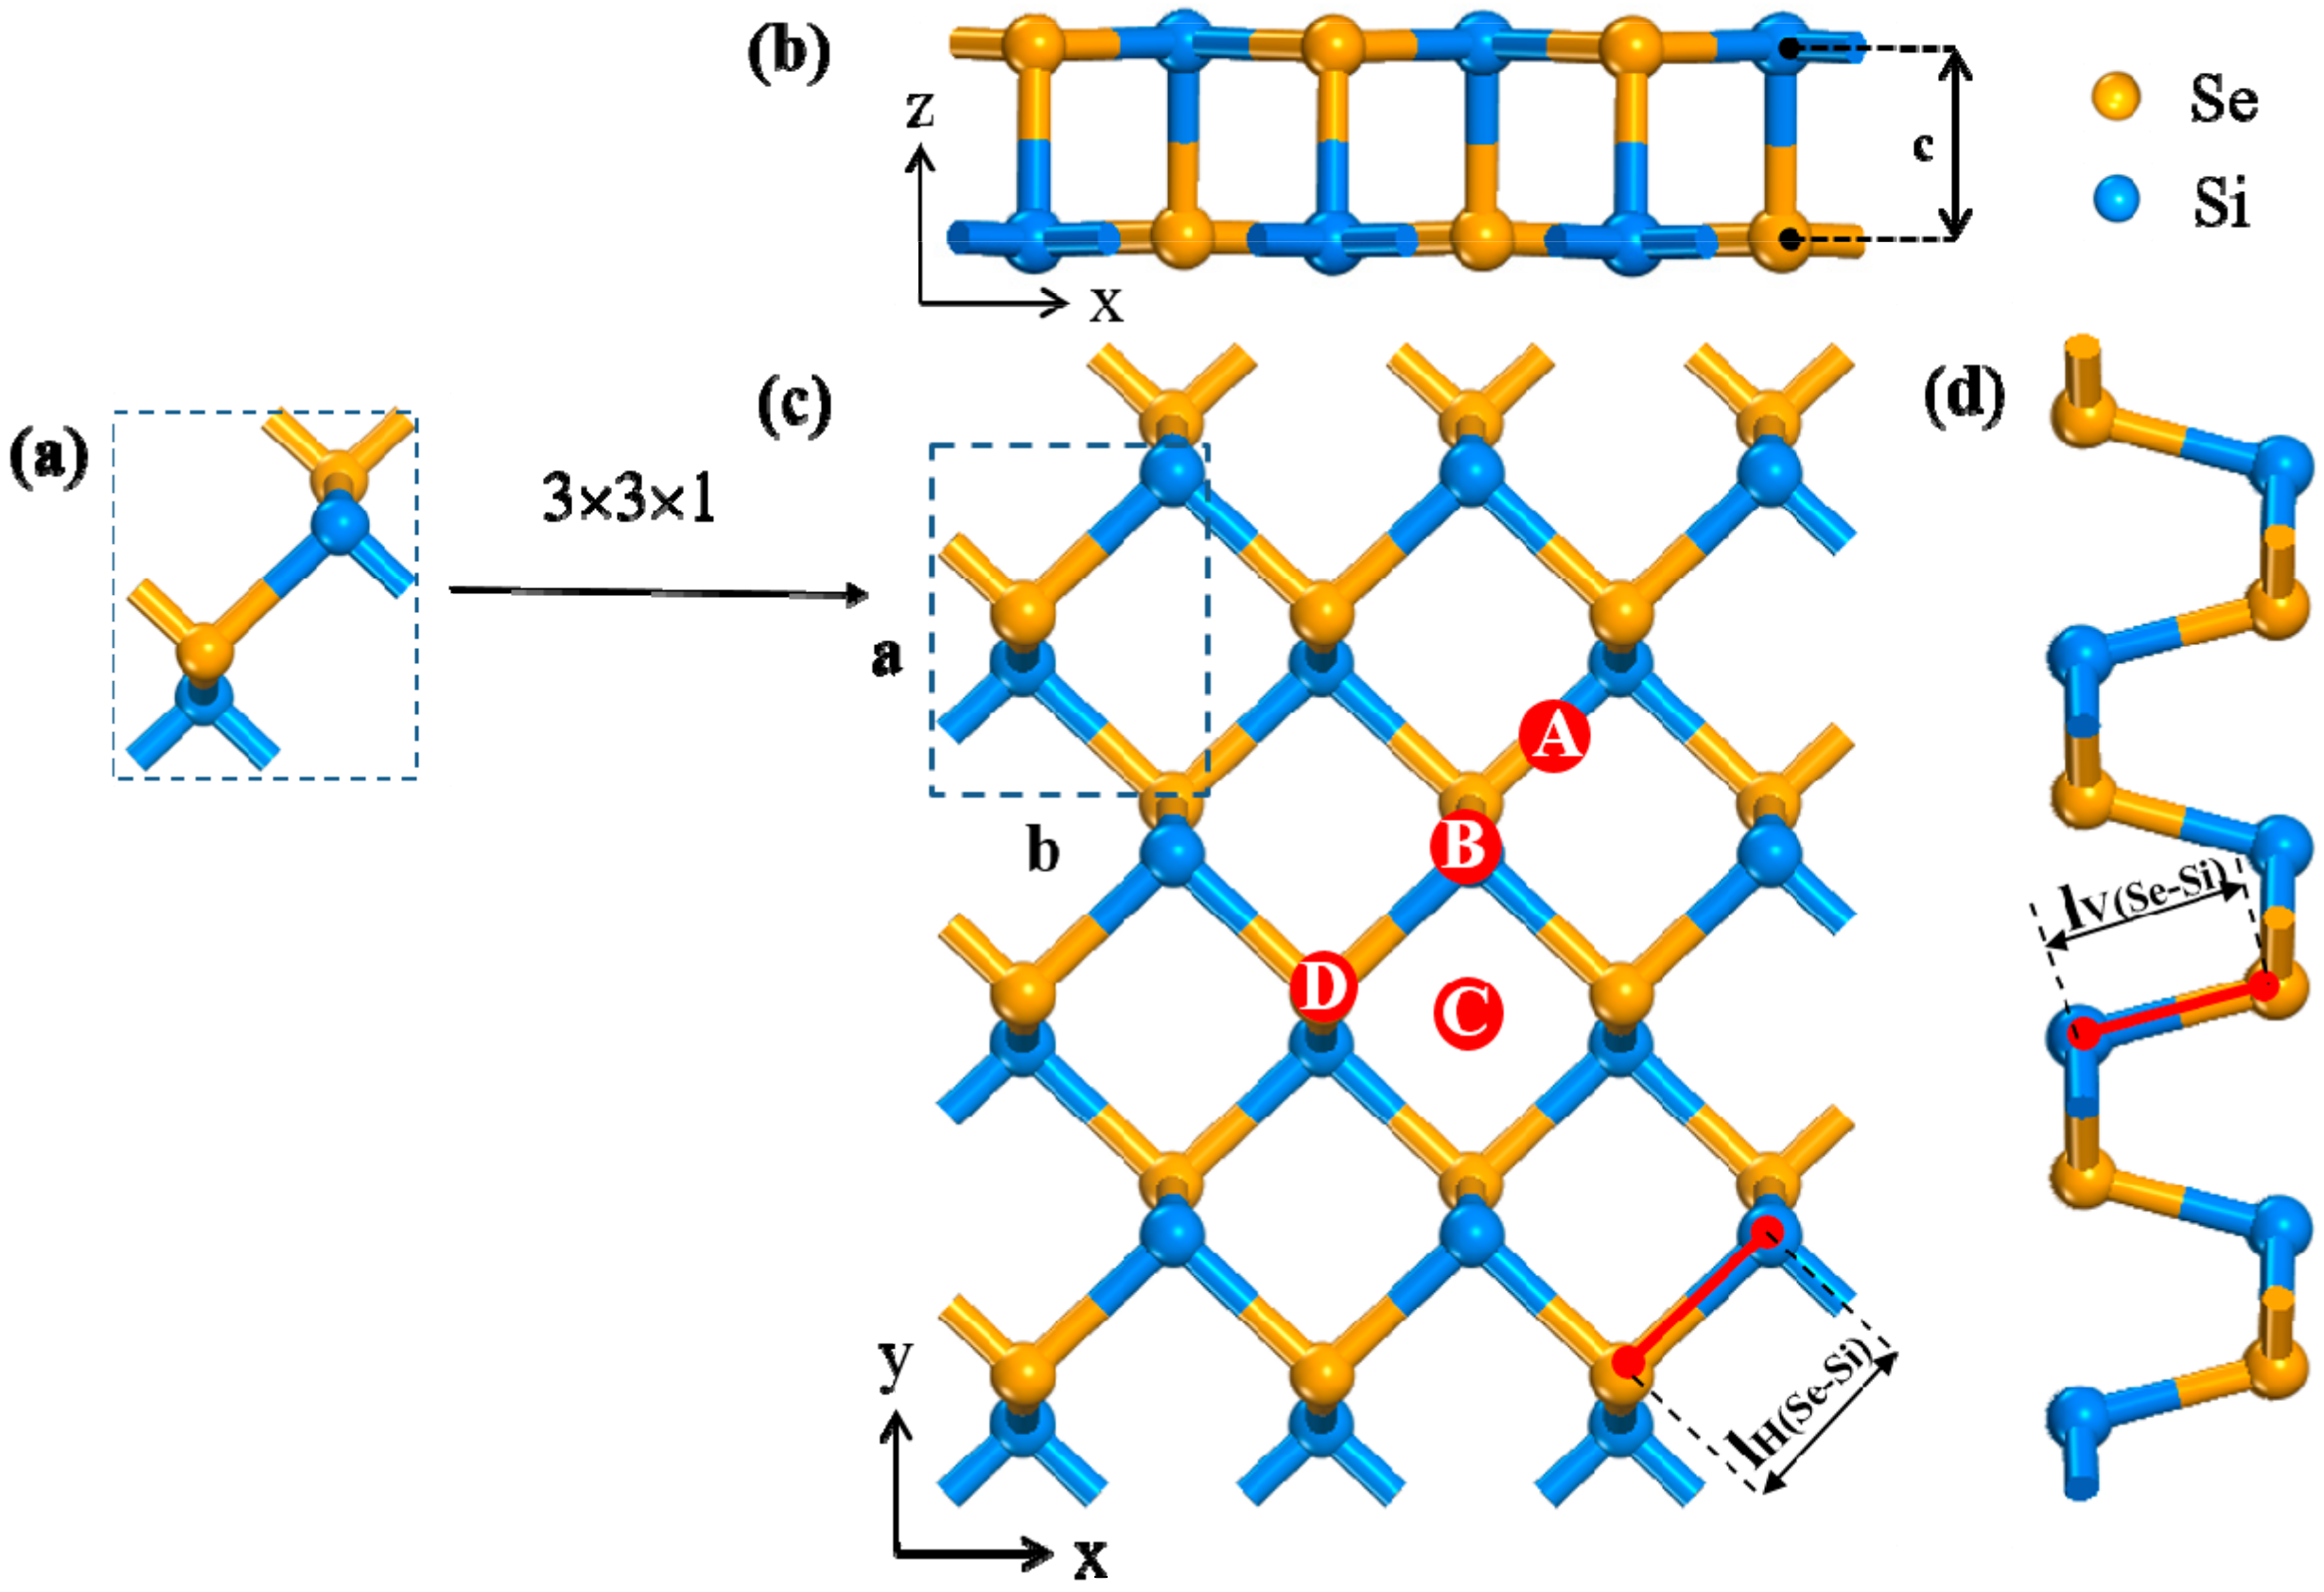
It begins with the geometry optimization of unit cell of SiSe. Then 3 × 3 × 1 surface cell is constructed, including 9 Si atoms and 9 Se atoms in the surface cell. After full relaxation, the lattice constant of the armchair direction is 3.650 Å (marked “a” in
Figure 1), and the lattice constant of the zigzag direction is 4.647 Å (marked “b” in
Figure 1) [
38], which is similar to the structure of black phosphorus (4.57 Å and 3.51 Å respectively) [
45]. The covalent bond length between Si-Se is tested to be 2.495 Å in horizontal direction (marked “l
H(Se-Si)” in
Figure 1) and 2.467 Å in vertical direction (marked “l
V(Se-Si)” in
Figure 1), which is consistent with previous values [
36]. Then, in analyzing the optimal adsorption position displayed in
Figure 1, four different adsorption positions are considered, including the “A” position (right above Si-Se bond), the “B” position (on the top of the Si atom), “C” position (right above the center of the honeycomb area), and the “D” position (on the top of the Se atom). The different molecular orientations are also considered in
Figure S1. All calculations and analyses are based on systems that the gas molecules at 3 Å away from four sites [
43]. After the four configurations converged, we select one configuration with the largest absolute value of the adsorption energy as the object of the next calculation, which is listed in
Figure S2. Similarly, other adsorption systems are calculated in the same way. The optimized site of each adsorption system is shown in
Table 1.
To discuss the difference in adsorption of different gases on SiSe monolayer, the adsorption energy and distance are calculated (see
Table 1). After full relaxation, NO and NO
2 configurations manifest the biggest adsorption energy (|−0.734| eV and |−0.735| eV, respectively) with the shortest adsorption distance (1.835 Å and 1.995 Å) among all the systems. In addition, the Se-Si bond enlarges to 2.608 Å in the vertical direction and 2.409 Å in the horizon direction, which are attributed to the strong interaction with the substrate. By contrast, compared with other gas configurations, CO, O
2, CO
2, and H
2S molecules have repulsive interaction with the substrate, judged from their increased adsorption distance than the initial state. Other gas molecules like H
2O are preliminarily considered as weak interaction with the substrate based on low adsorption energy. Specially, NH
3 and SO
2 configurations have moderate adsorption energy values (|−0.414| eV and |−0.489| eV, respectively). The distance between adsorbates and adsorbents is reduced to 2.471 Å and 2.733 Å, respectively. The Si-Se bond is slightly distorted, whose adsorption mechanisms are obscure and need further analysis.
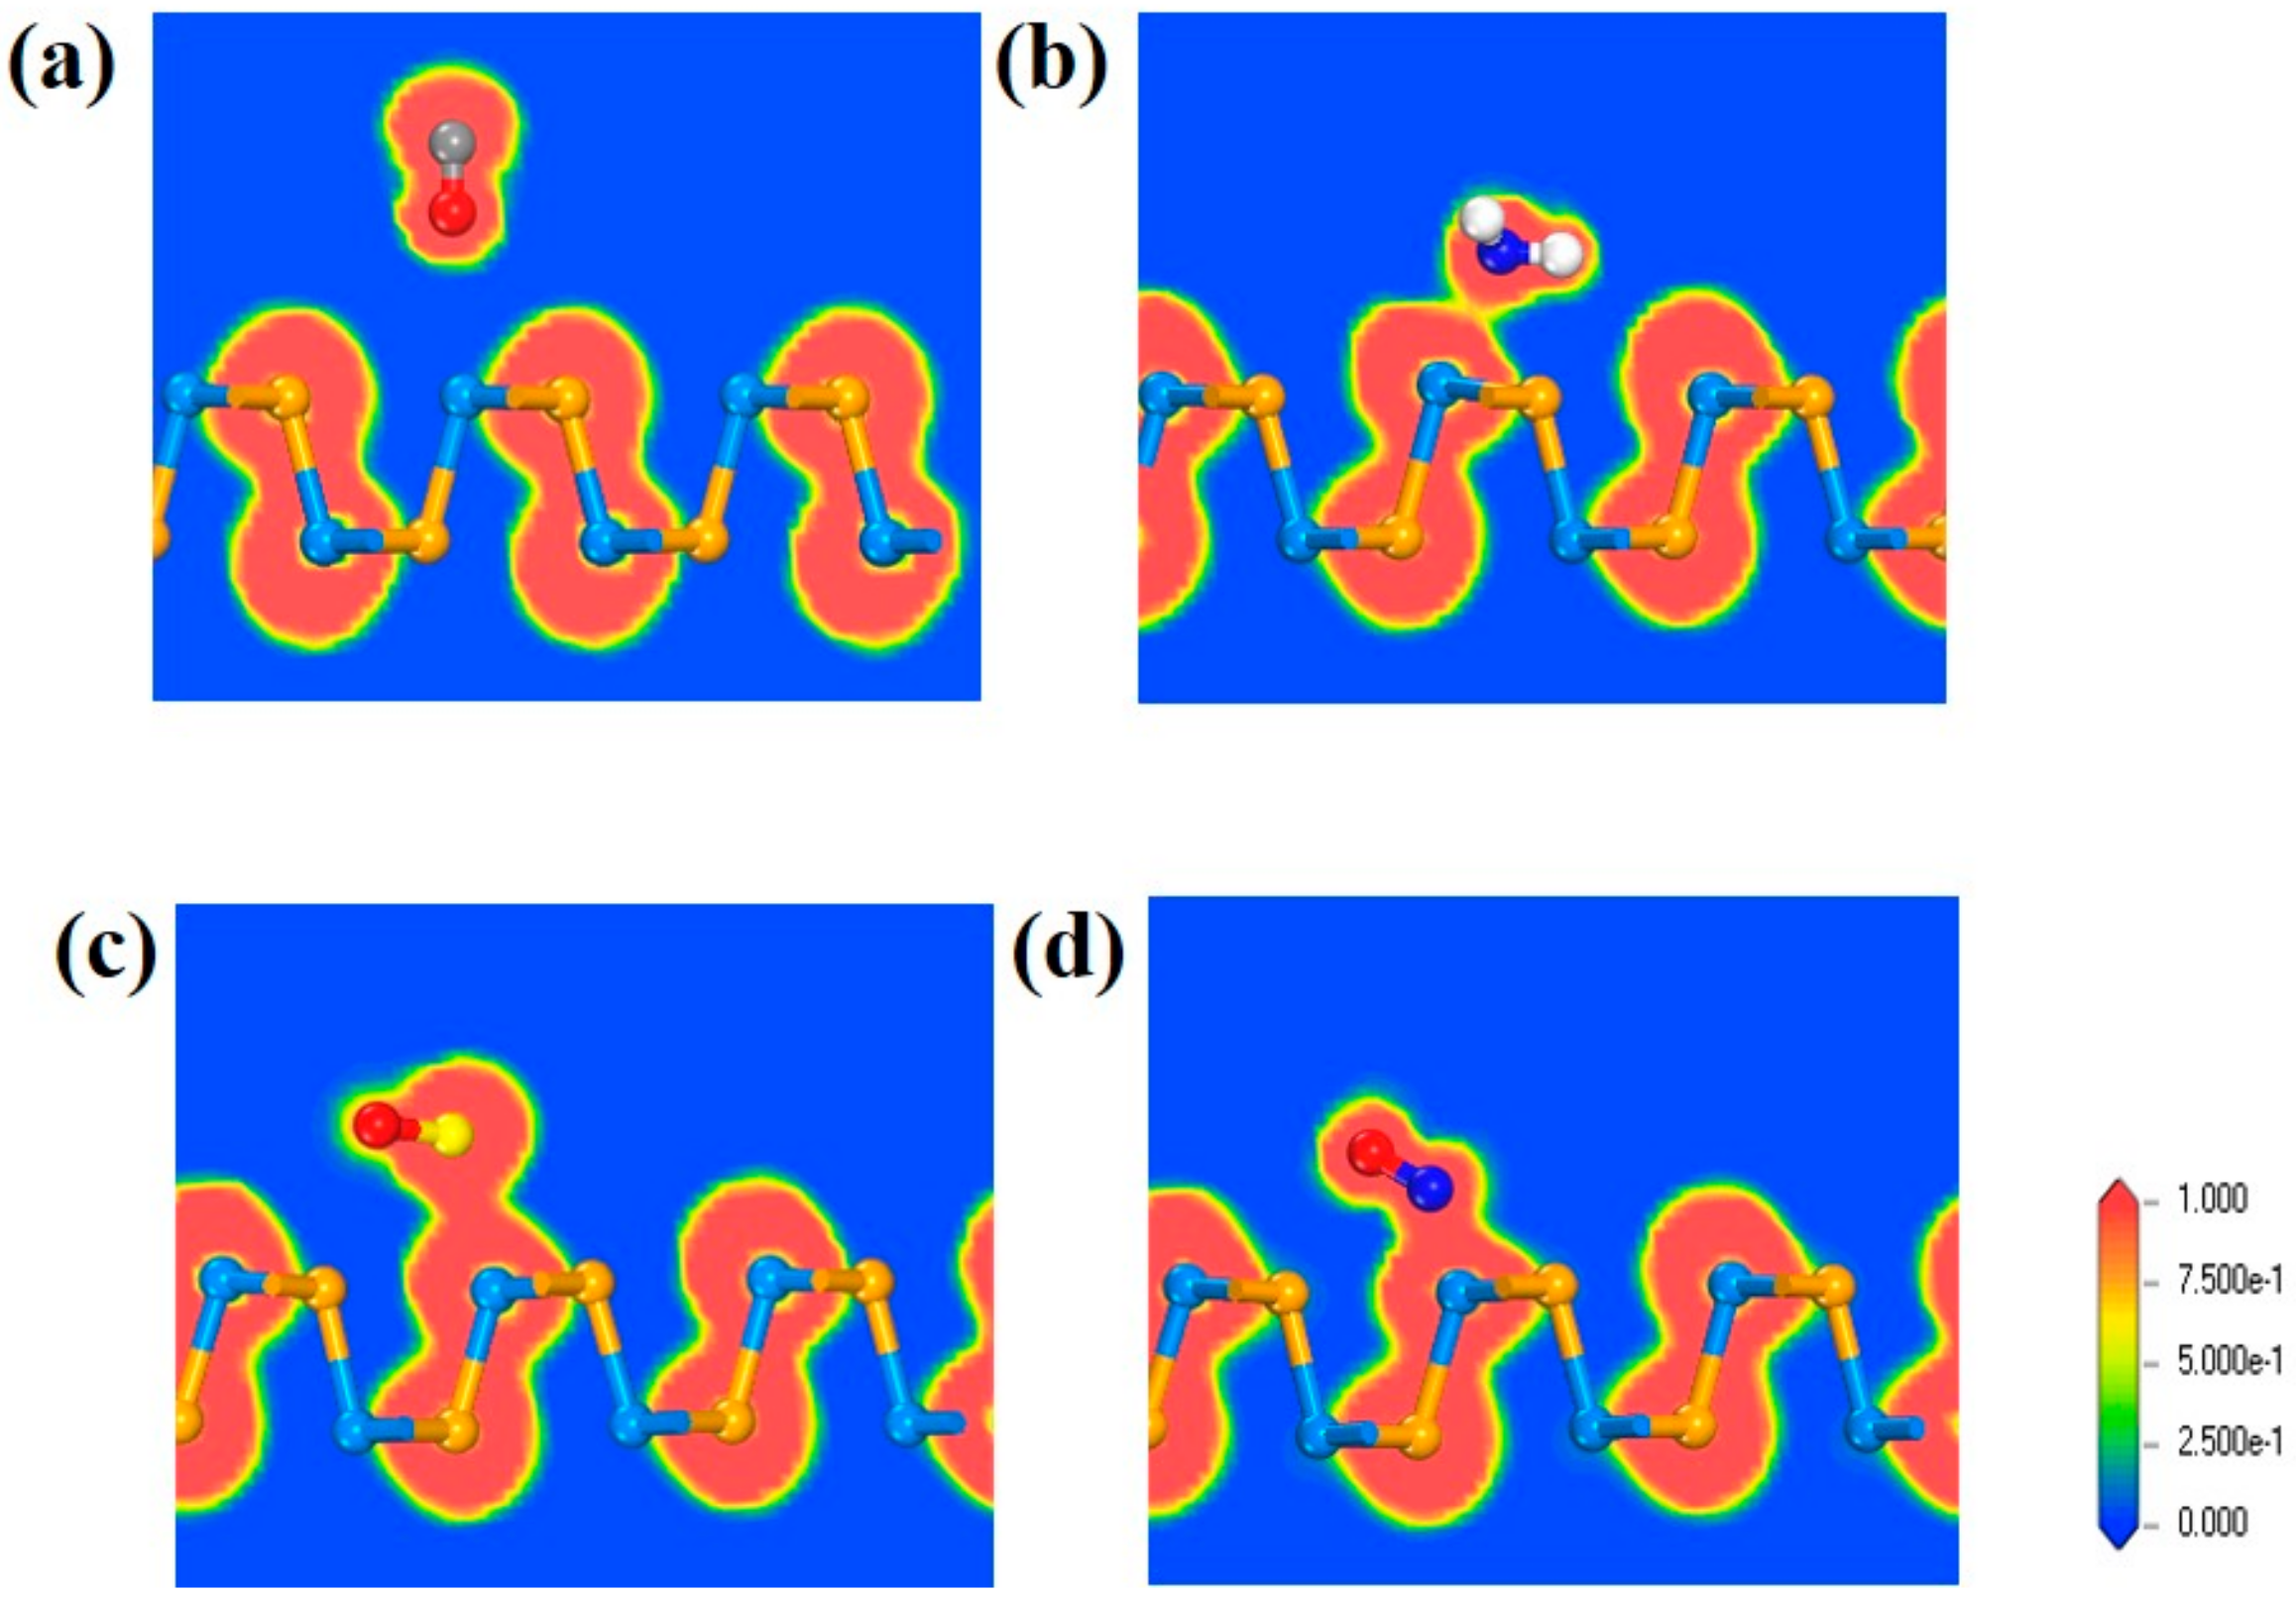
In order to clarify the interaction between molecules and SiSe monolayer, the CDD map and ΔQ are calculated to see the charge distribution of gas molecules with the substrate qualitatively and quantitatively. We have listed some typical CDD maps that reflect the different degrees of interaction between the substrate and the gas molecules. The incremental tendency of adsorption strength is displayed from
Figure 2a to
Figure 2f. In
Figure 2a, the CO configuration has substantially no accumulation and consumption of charge at the interface with a little ΔQ, and the same situation happens in the CO
2 configuration (see
Figure S3). In other systems, such as O
2, CH
4 etc., the substrate and the gas have a weaker charge rearrangement as shown in
Figure 2b, which manifests the stronger interaction with the substrate than CO configuration. Yet the interaction is still much smaller. In
Figure 2c,d, the range of charge redistribution of NH
3 configuration and SO
2 configuration are distinctly expanded. The charge is more severely depleted on the NH
3 molecule, while the accumulation on the SO
2 molecule is more serious, indicating that there is a strong interaction between the gas molecules and the substrate. Correspondingly, ΔQ of these two systems is an order of magnitude larger than other six weak systems mentioned above. In the
Figure 2e,f, the interaction between NO and NO
2 structures still maintain the strongest position—the maximum range of charge rearrangement and a significant charge accumulation consumption. It shows, apparently, the loss of charge locates on the substrate, while the increase in charge is concentrated on the gas molecules, where charge is transferred from the gas molecule to the SiSe monolayer. In addition, the stronger interaction matches bigger charge transfer value (|-0.258| e) in NO
2 configuration. It is worth noting that charge transfer of SO
2 molecule shows an abnormal change (|-0.238| e), increasing sharply compared to the NH
3 molecule, even bigger than the NO molecule (|-0.220| e), which implies a different adsorption type from NH
3 configuration.
Associated with ELF map in
Figure 3a, it is clear to notice that the value of ELF between CO and SiSe substrate is close to 0. There are hardly any electrons between CO molecule and SiSe substrate, which means no electron sharing and no covalent bonds exist in these two components. The same situation also occurs in systems like CH
4, H
2O, H
2S, and O
2 (see
Figure S4), which shows that these gas configurations are all physically adsorbed. In
Figure 3b, the value of ELF in the border of NH
3 and SiSe monolayer is nearly 0.5, revealing that most electrons are still highly concentrated on the gas molecules and substrate, very little are delocalized in edge of junction. That is to say there exist very few electrons between NH
3 and SiSe monolayer and it is not sufficient to form chemical bonds. On the contrary, it is distinct to see that electron densities of S and Si atoms are connected together and electrons are highly located between them in
Figure 3c. It is highly possible to form S-Si covalent bond in the system. In the case of NO
2 system in
Figure 3d, the serious orbital overlaps between N atoms and Si atoms displays that they are bonded together, which reflects the chemical adsorption of NO and NO
2 again.
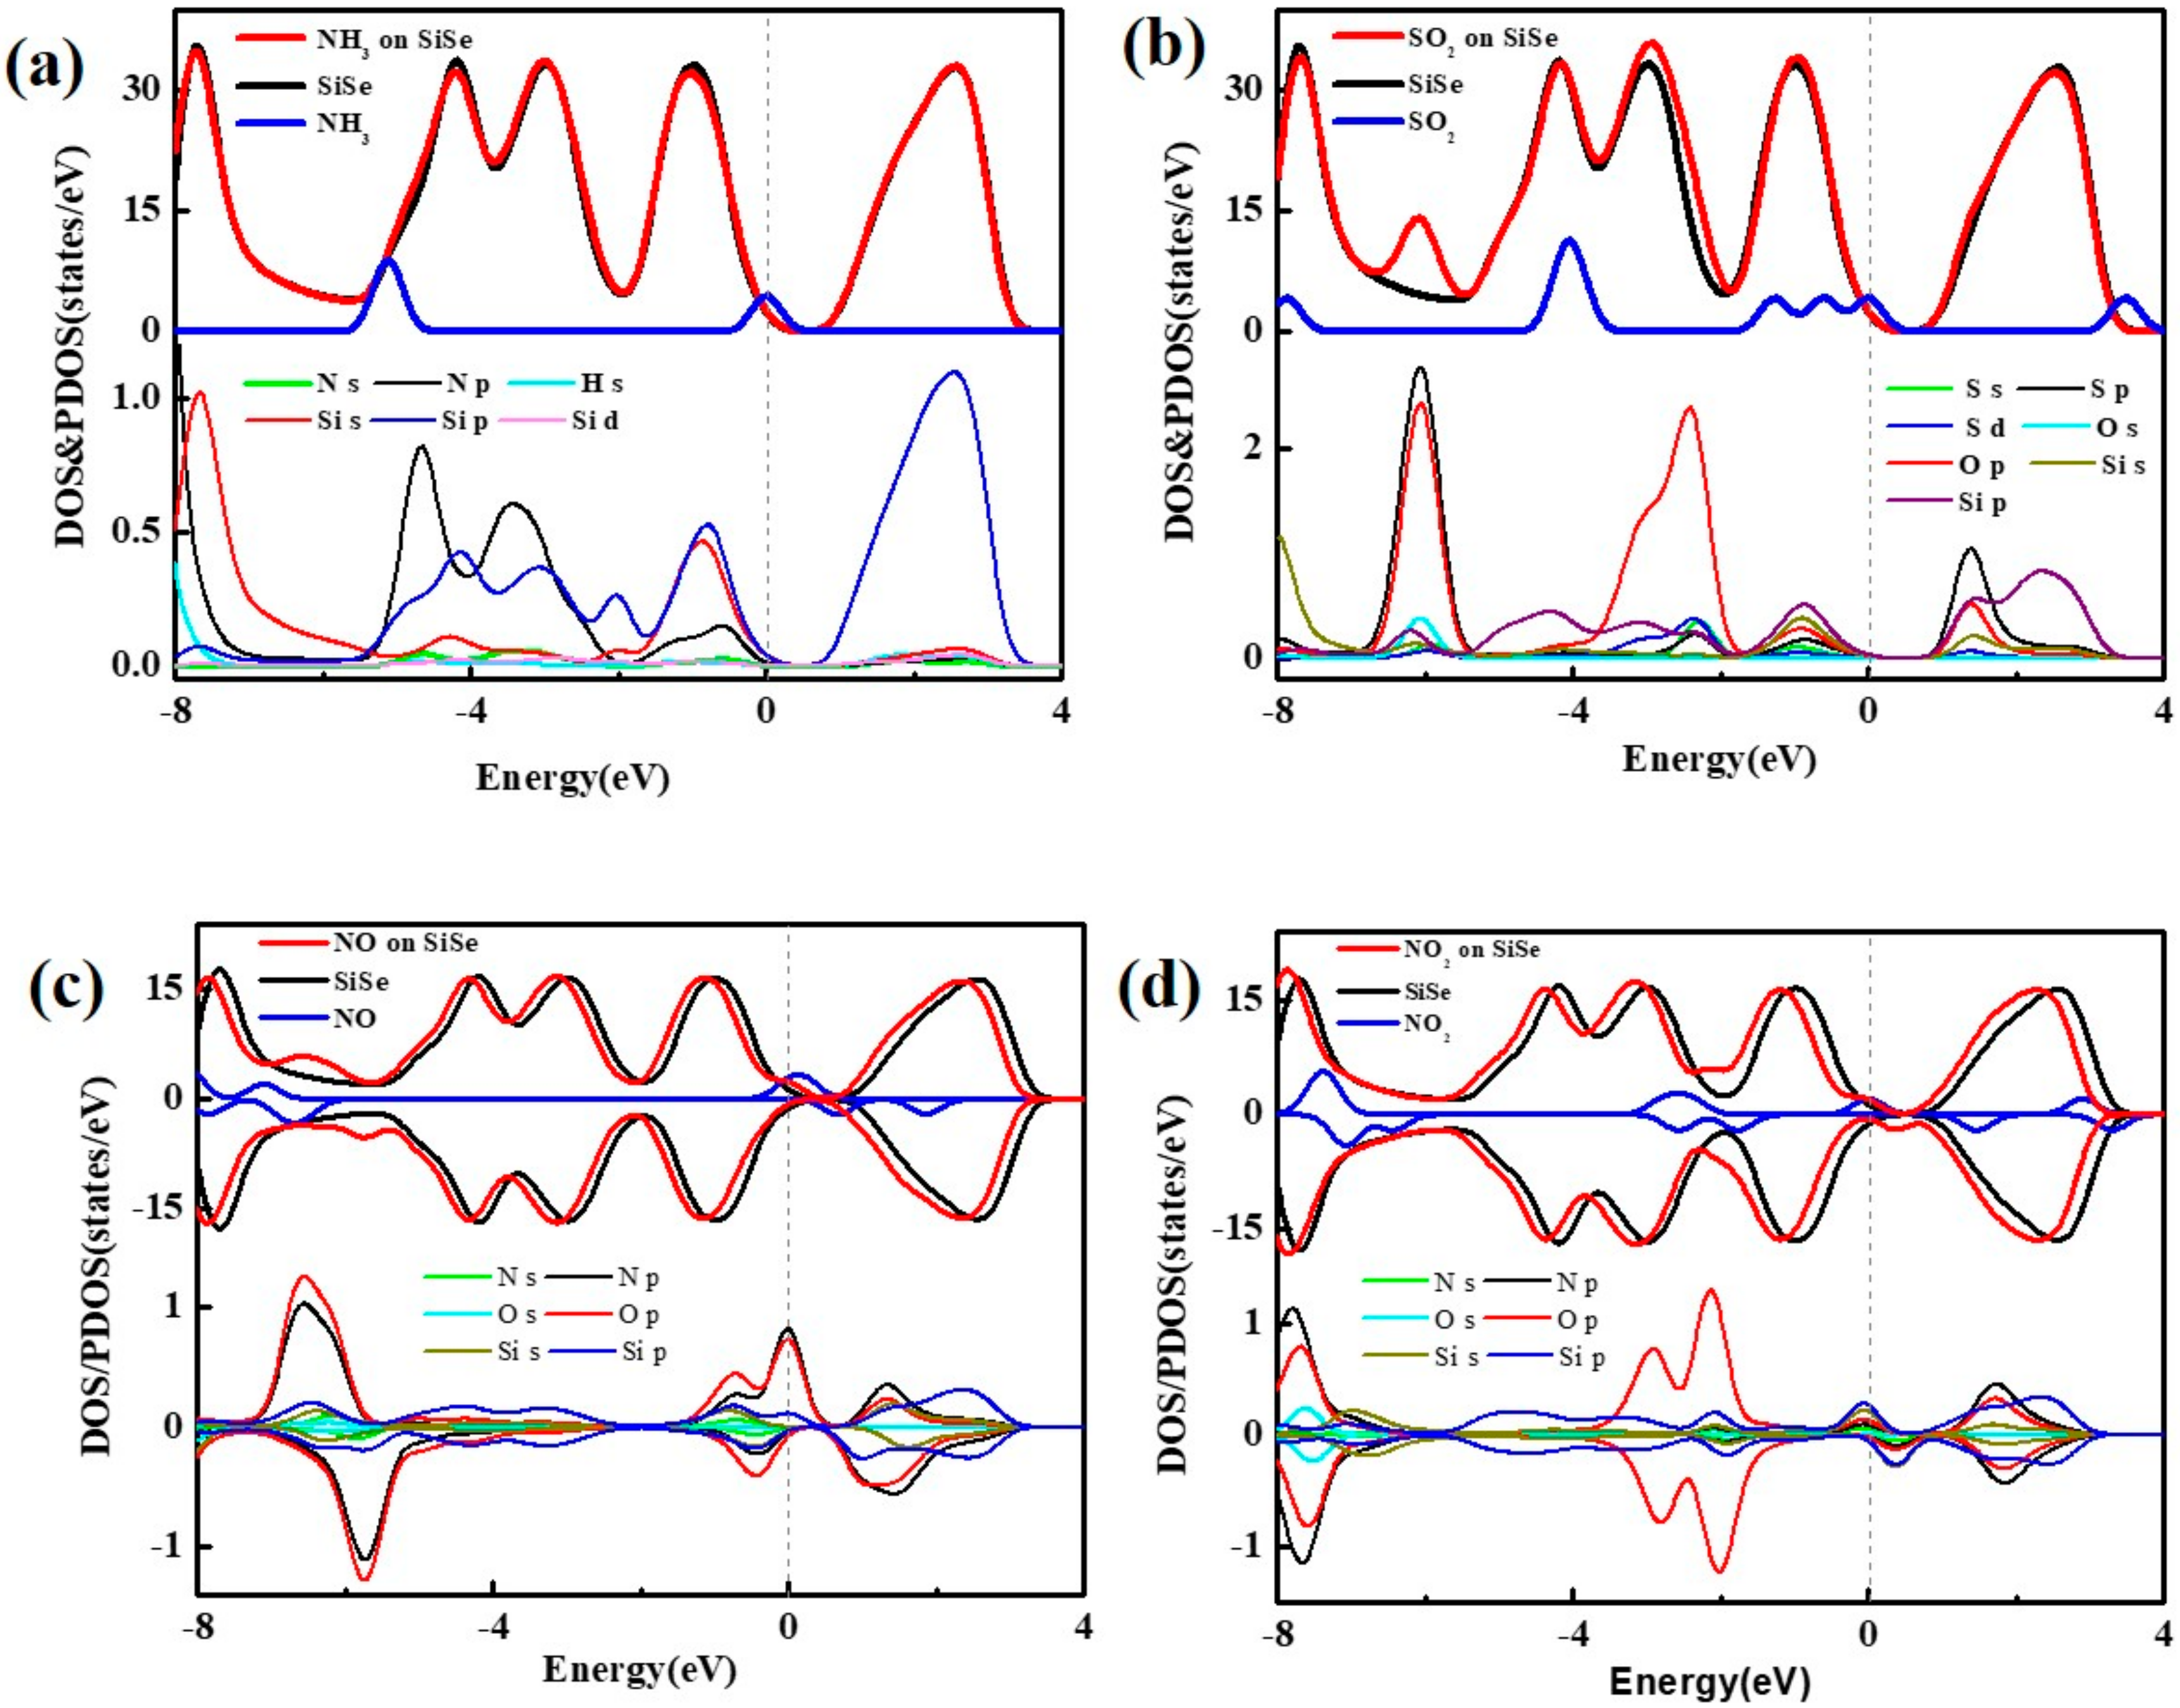
To further confirm the adsorption type, the DOS and PDOS (total and partial densities of states) are calculated.
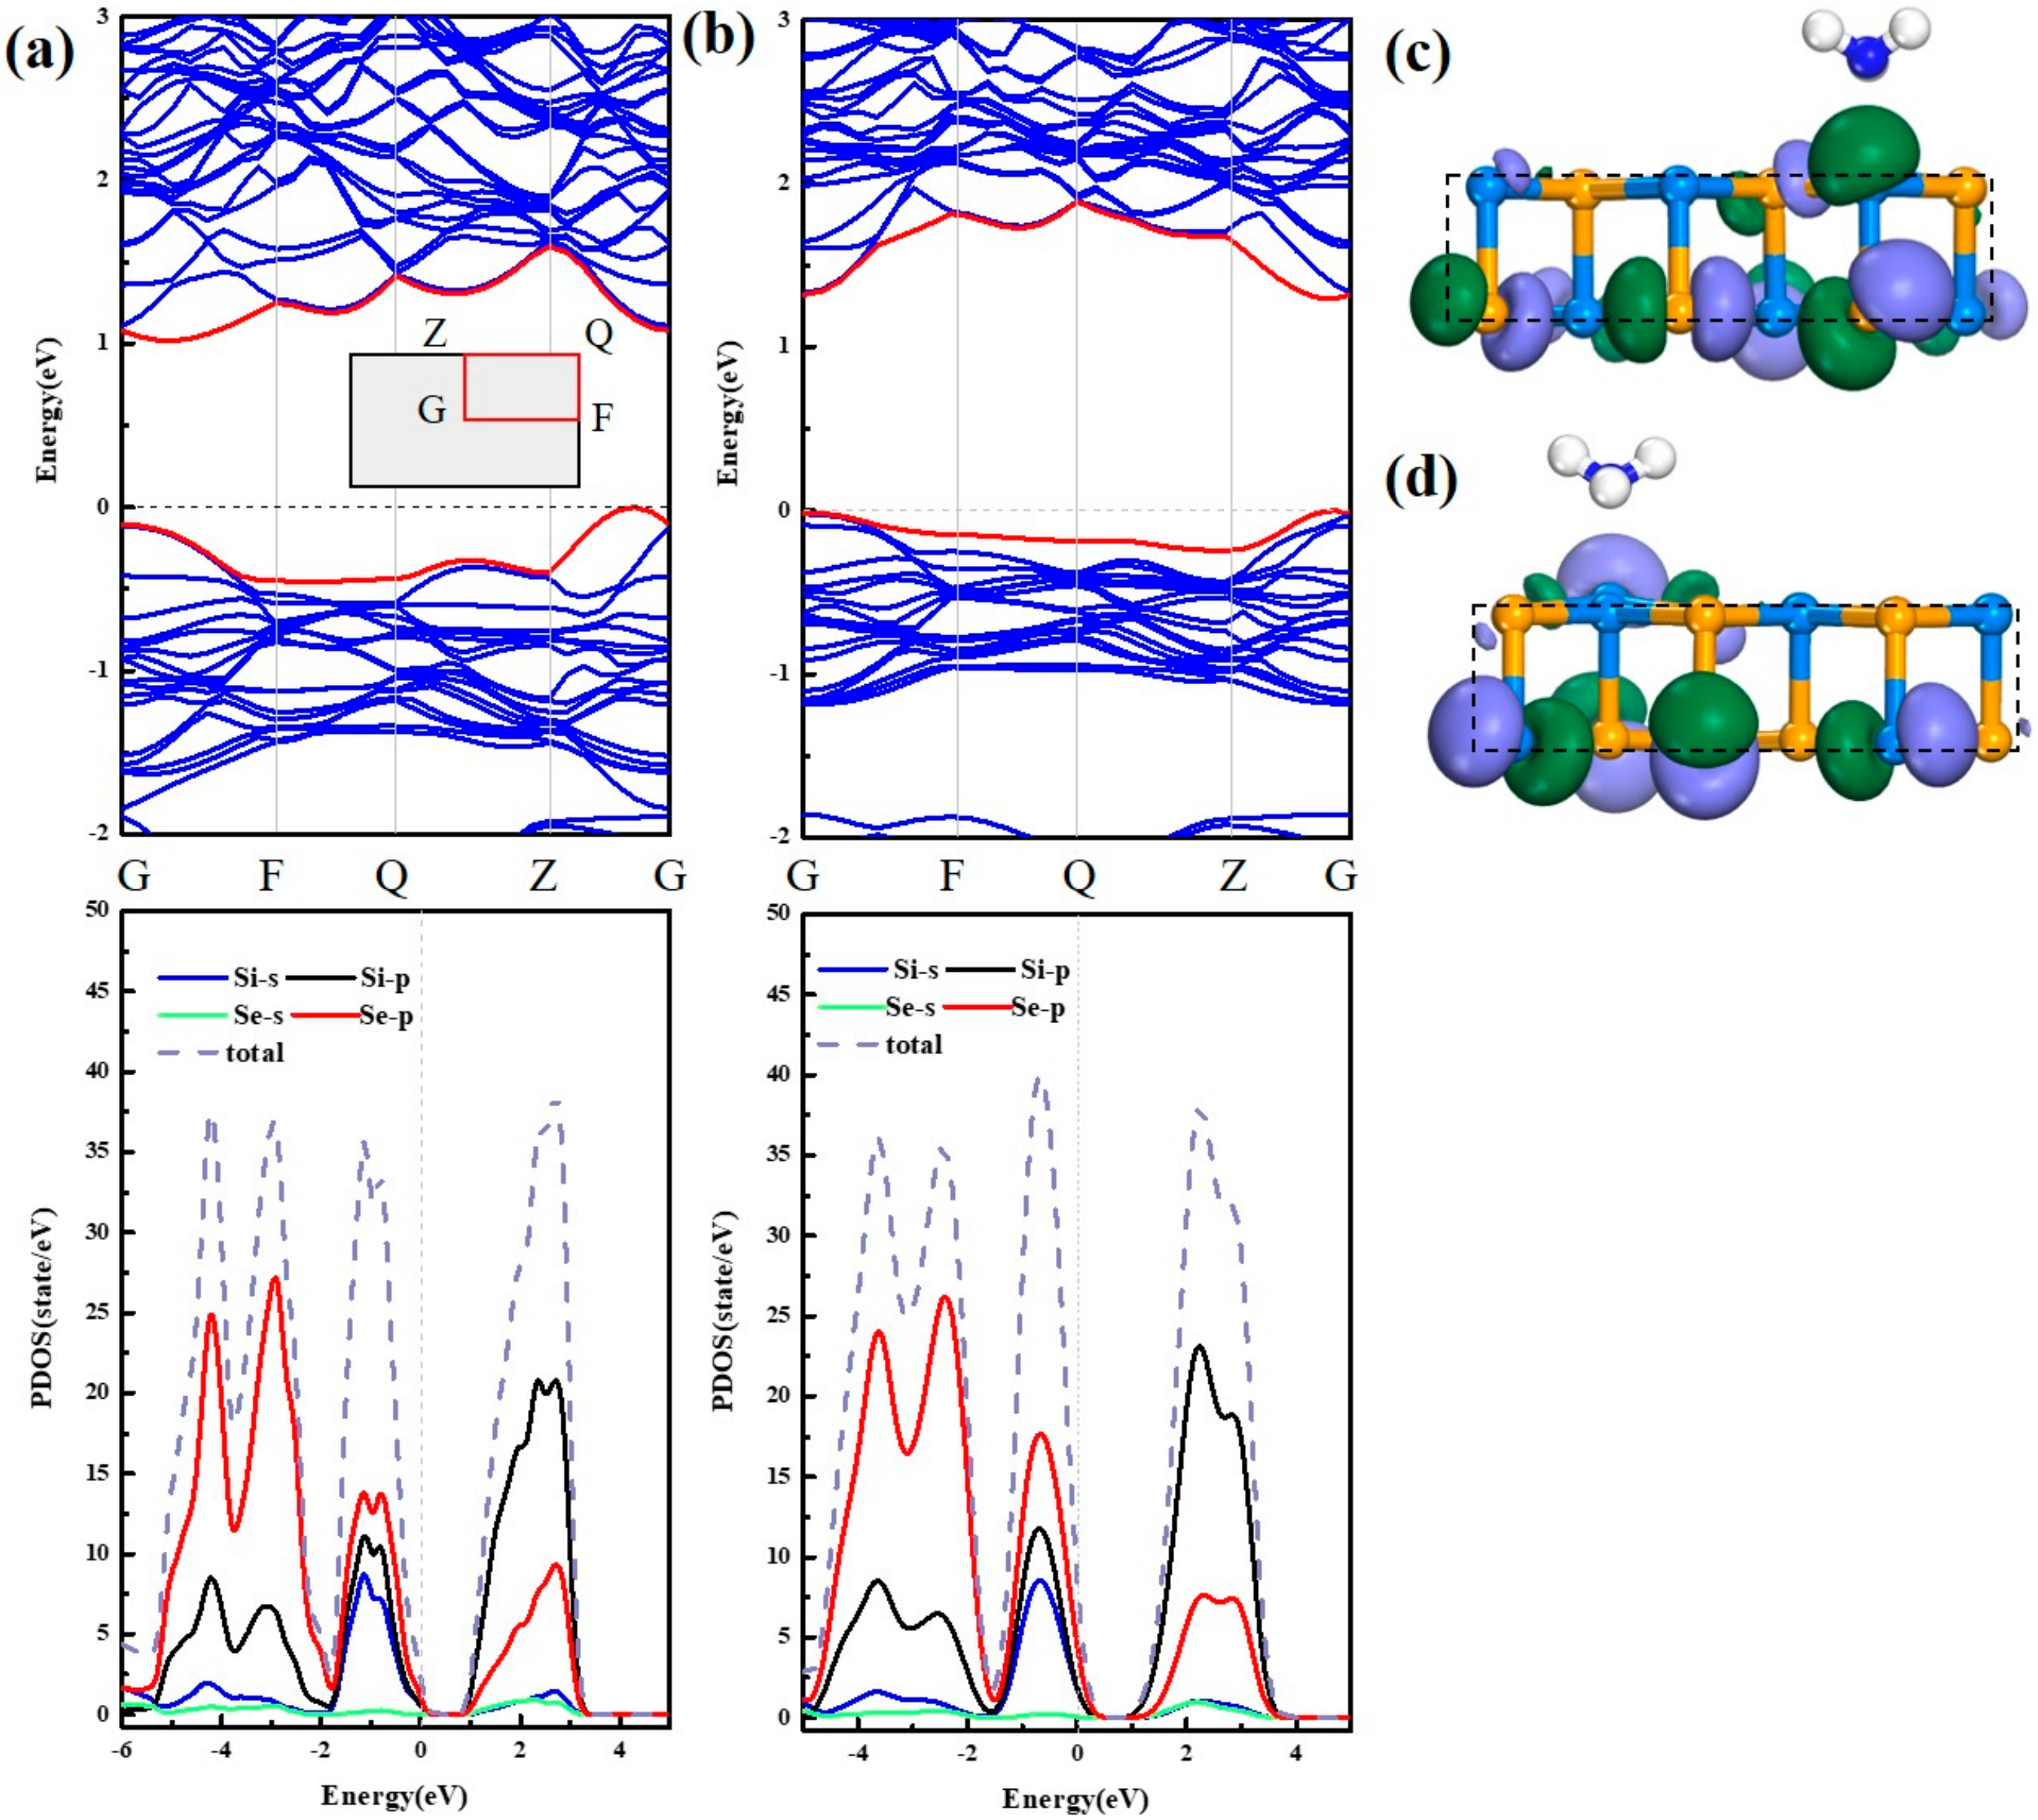
Figure 4a shows plainly that DOS of pristine SiSe substrate is almost changeless near Fermi level before and after the NH
3 is adsorbed on it. The big difference appears at around −5 eV in the valence band far away from Fermi level. In PDOS, it is obvious to find that there is no orbital overlap between NH
3 molecule and SiSe monolayer near CBM (Conduction Band Minimum) or VBM (Valence Band Maximum). Hence physical adsorption occurs in NH
3 and SiSe monolayer. In next
Figure 4b, the DOS of SiSe is slightly offset after SO
2 is adsorbed on SiSe near Fermi level from -2 eV to -3 eV, and the peaks of orbitals between S atom and Si atom are overlapped at the energy of -1 eV in the valence band and 1 eV in the conduction band. From
Figure 4c,d, between −8 eV to 4 eV, the DOS of pristine SiSe monolayer is different from the adsorbed systems. The original electrical properties are destroyed when the NO
2 is adsorbed on substrate. The chemical bond is formed with the more serious orbitals’ hybridization, combined with the above analysis.
In total, the high selectivity is displayed based on above analysis associated with the electronic analysis: the interaction between the NH
3 gases and the SiSe monolayer is the strongest physical adsorption property with moderate adsorption energy (−0.414 eV), which is larger than previous researches [
4,
19,
27], and makes it possible for SiSe monolayer to adsorb NH
3 and easily desorb. SO
2, NO or NO
2 gases on the SiSe monolayer show the chemisorption property. The chemical reaction with substrate makes it difficult to reuse. The rest of the gases have very weak interaction with SiSe monolayer. They are all not suitable as a gas sensor based on the SiSe monolayer.
3.3. Adsorption Mechanism of SO2 Under Stress
Since the adsorption of SO
2 molecule by the SiSe monolayer is very close to the adsorption of NH
3, it is hoped that the adsorption of SO
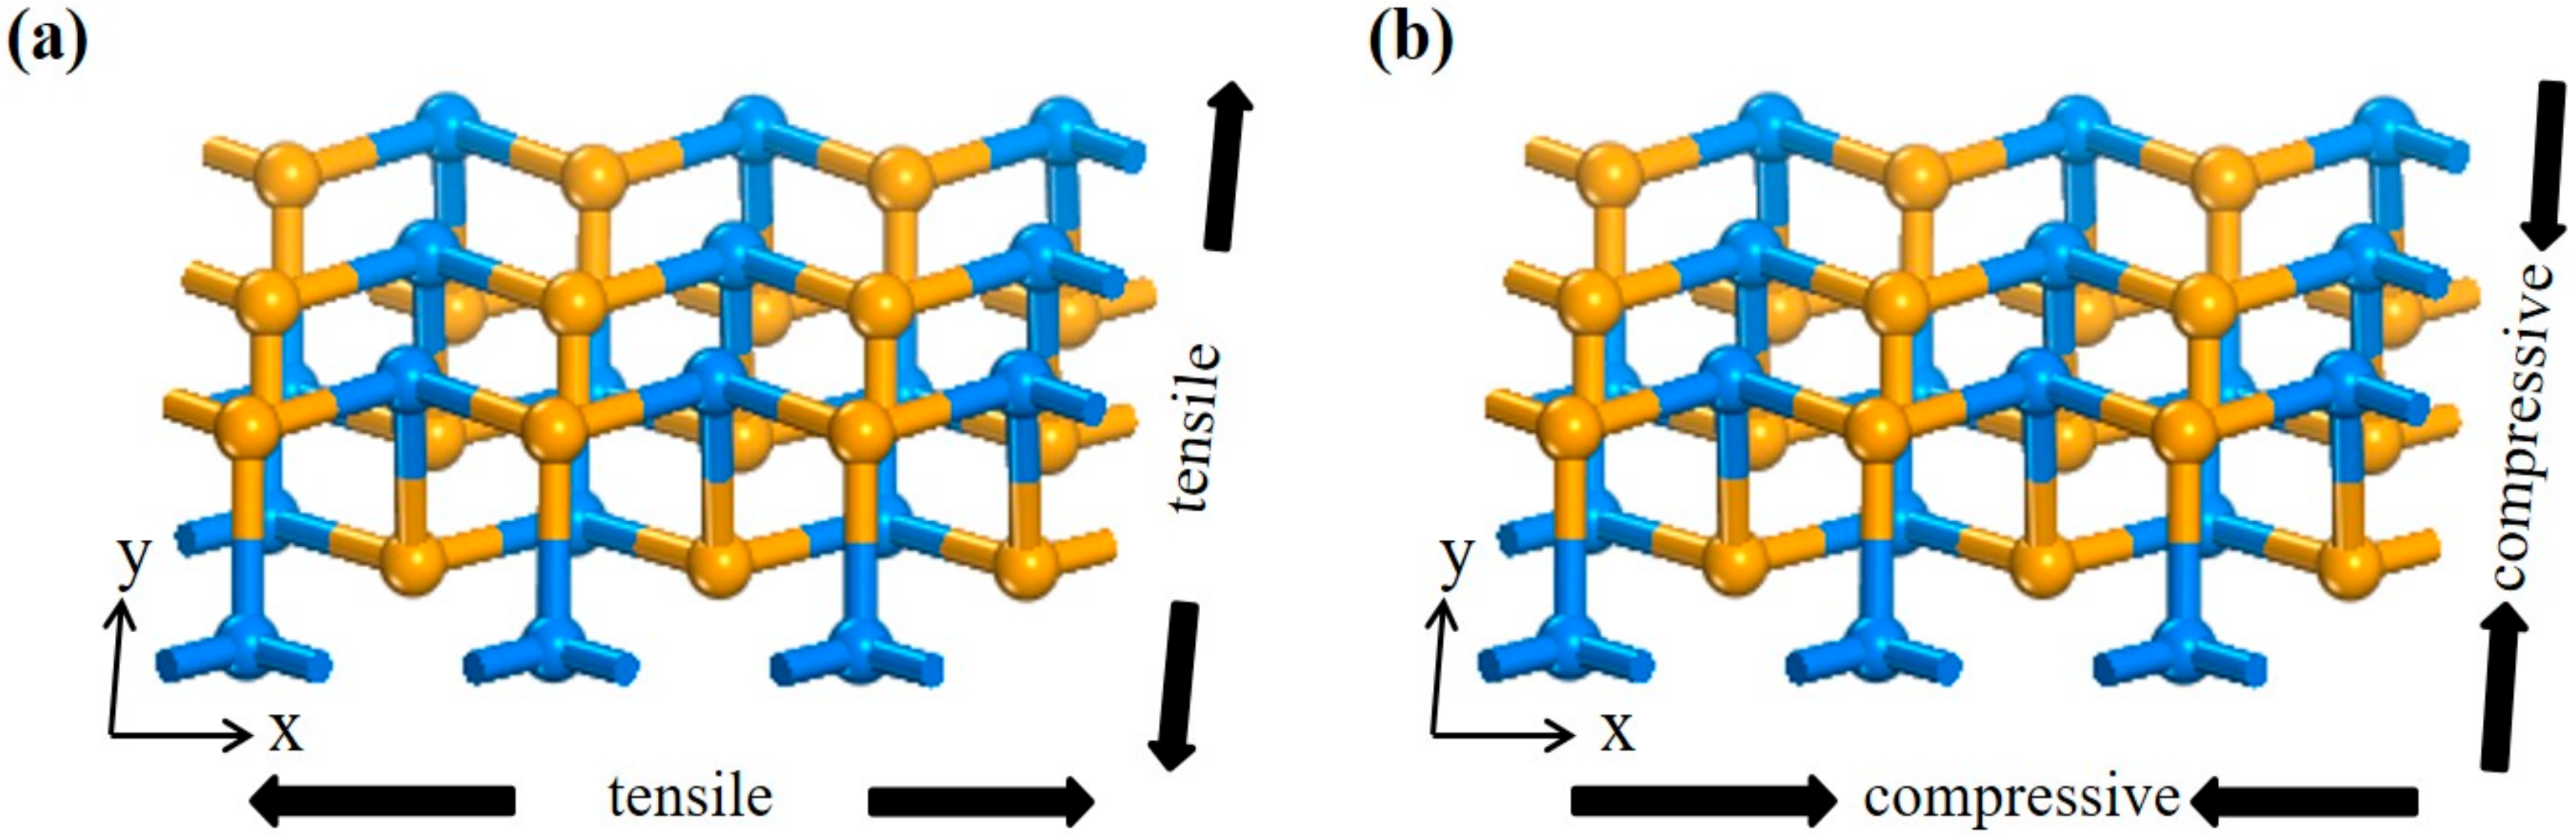
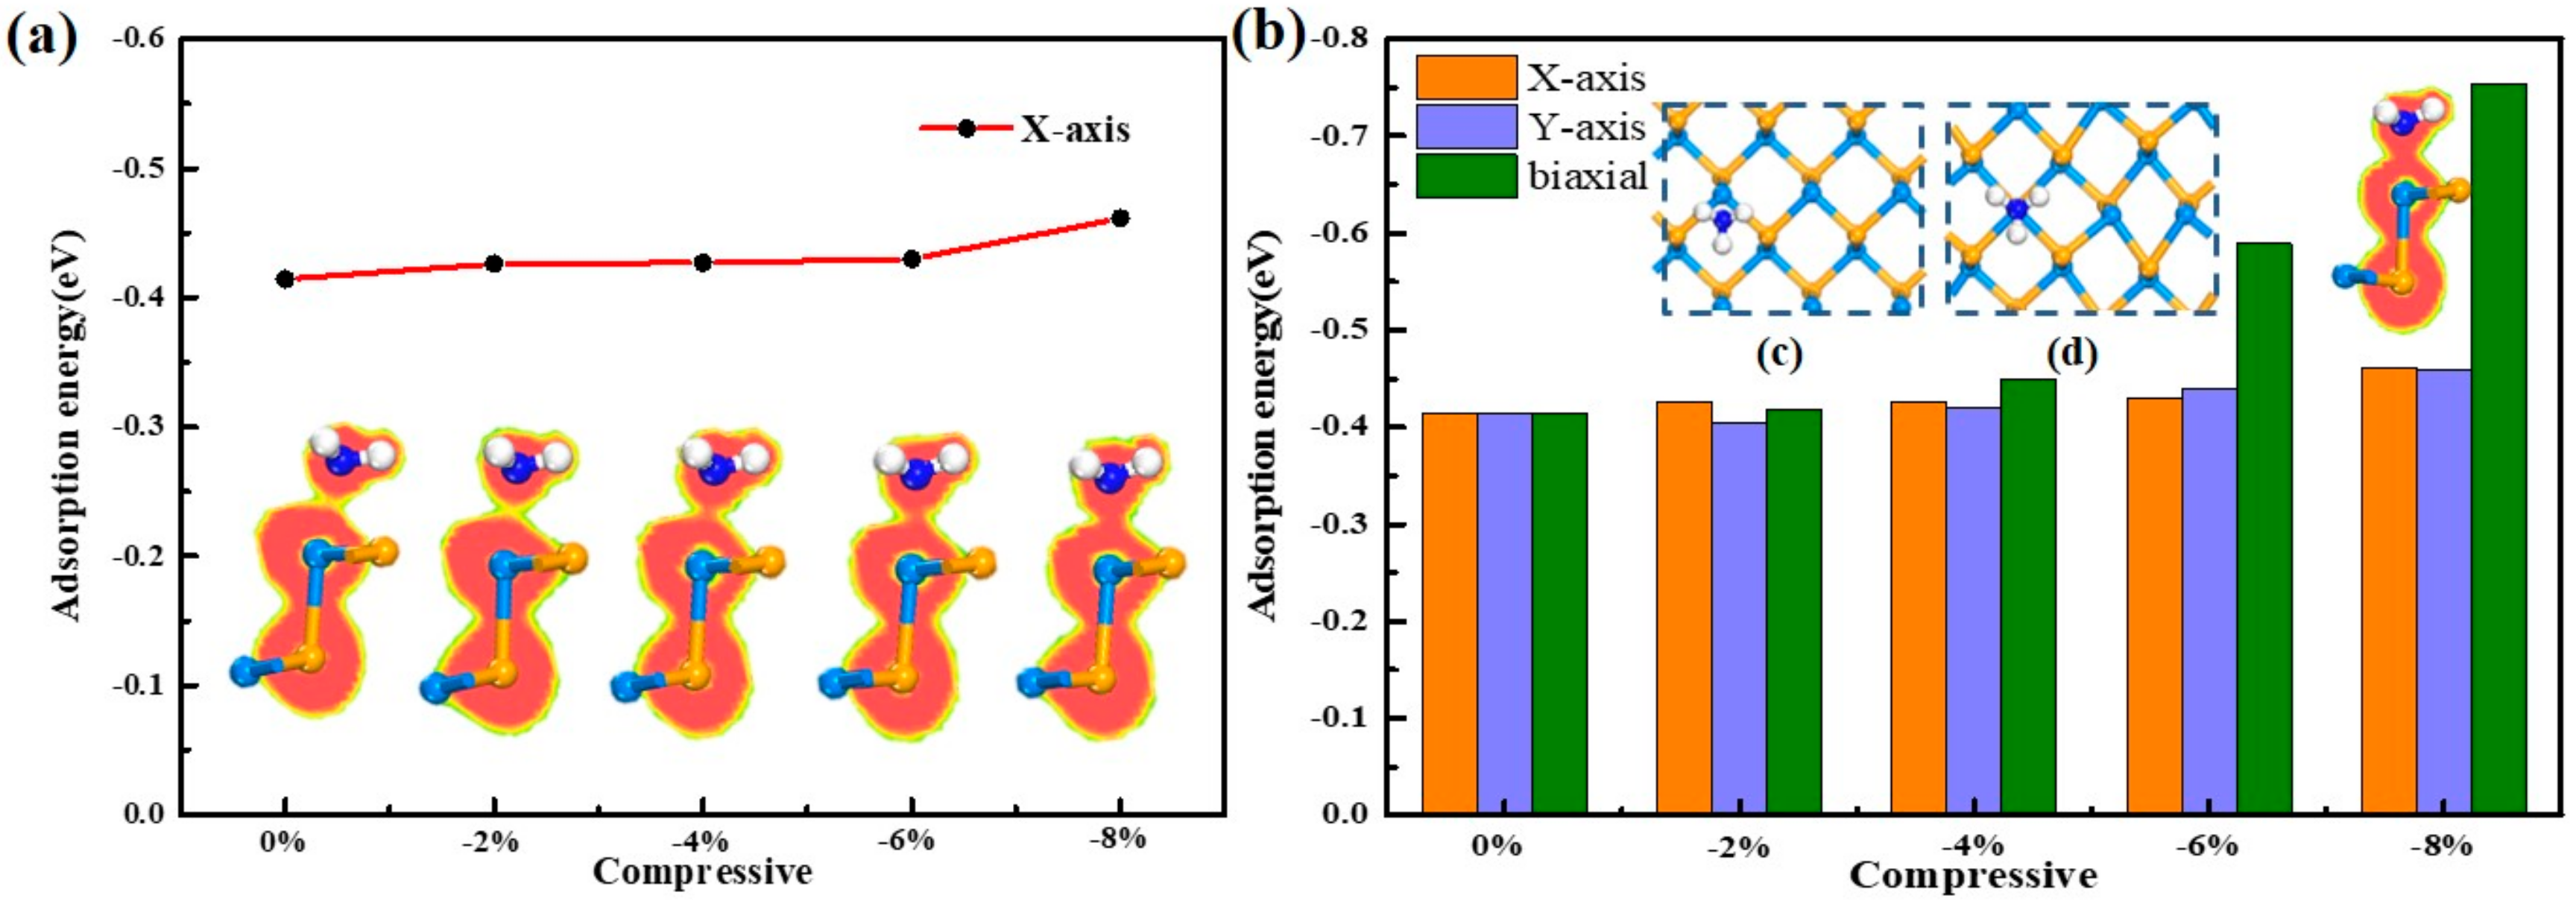
2 molecule can be improved by stress, too. Similarly, stress is applied to the substrate from the X-axis, the Y-axis, and the XY-biaxial direction, respectively, and then the SO
2 molecule is adsorbed. The trend of adsorption strength is also the same as NH
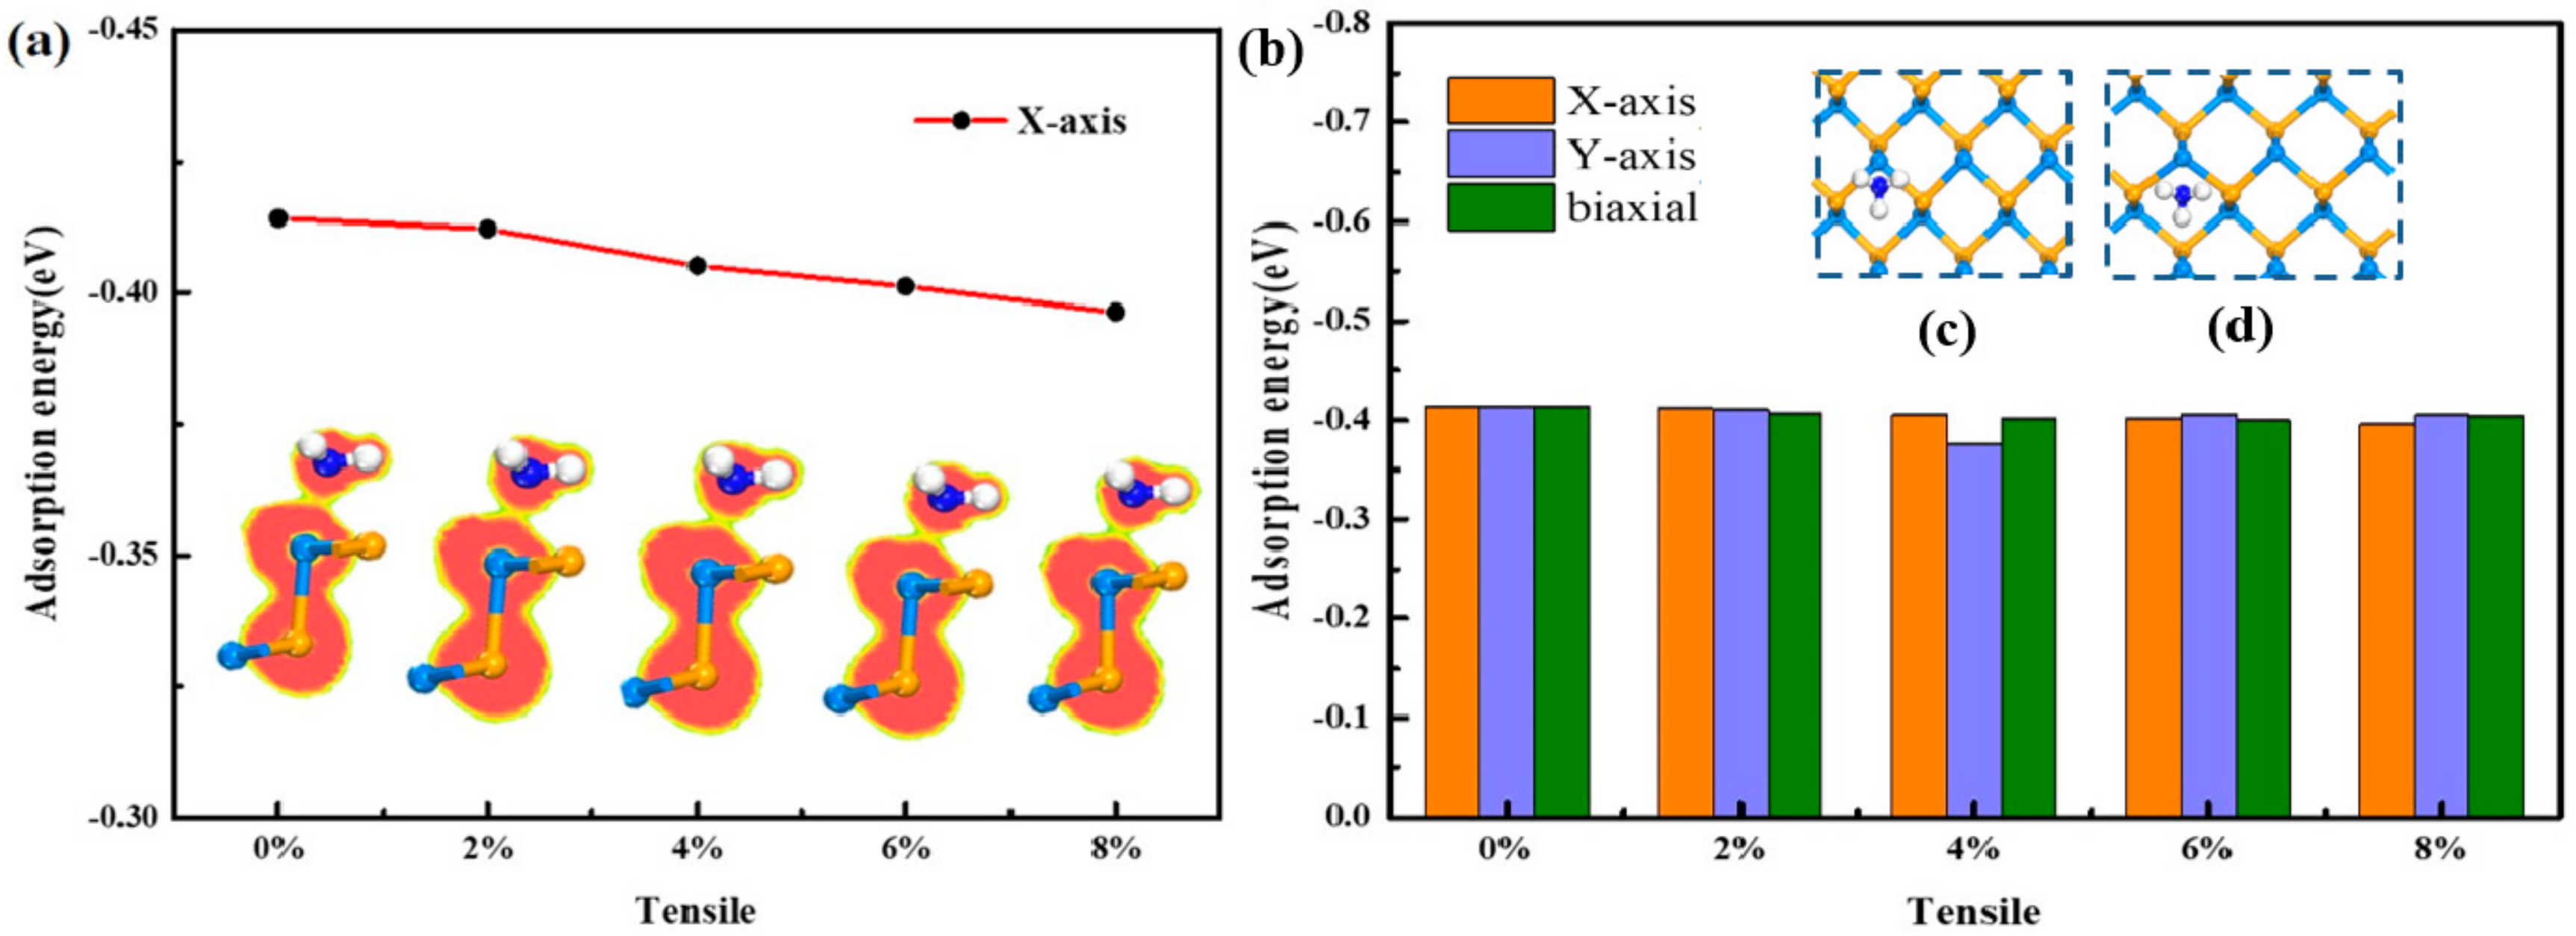
3 configuration: the increase of the tensile force causes the decrease of adsorption energy and the ΔQ, while the increase of the pressure causes the increase of adsorption energy and the ΔQ. It has been previously analyzed that the adsorption of SO
2 by the substrate with free-stress is chemisorption, and if the stretching method is employed to reduce the interaction between the substrate and the gas, it is possible to improve the adsorption of SO
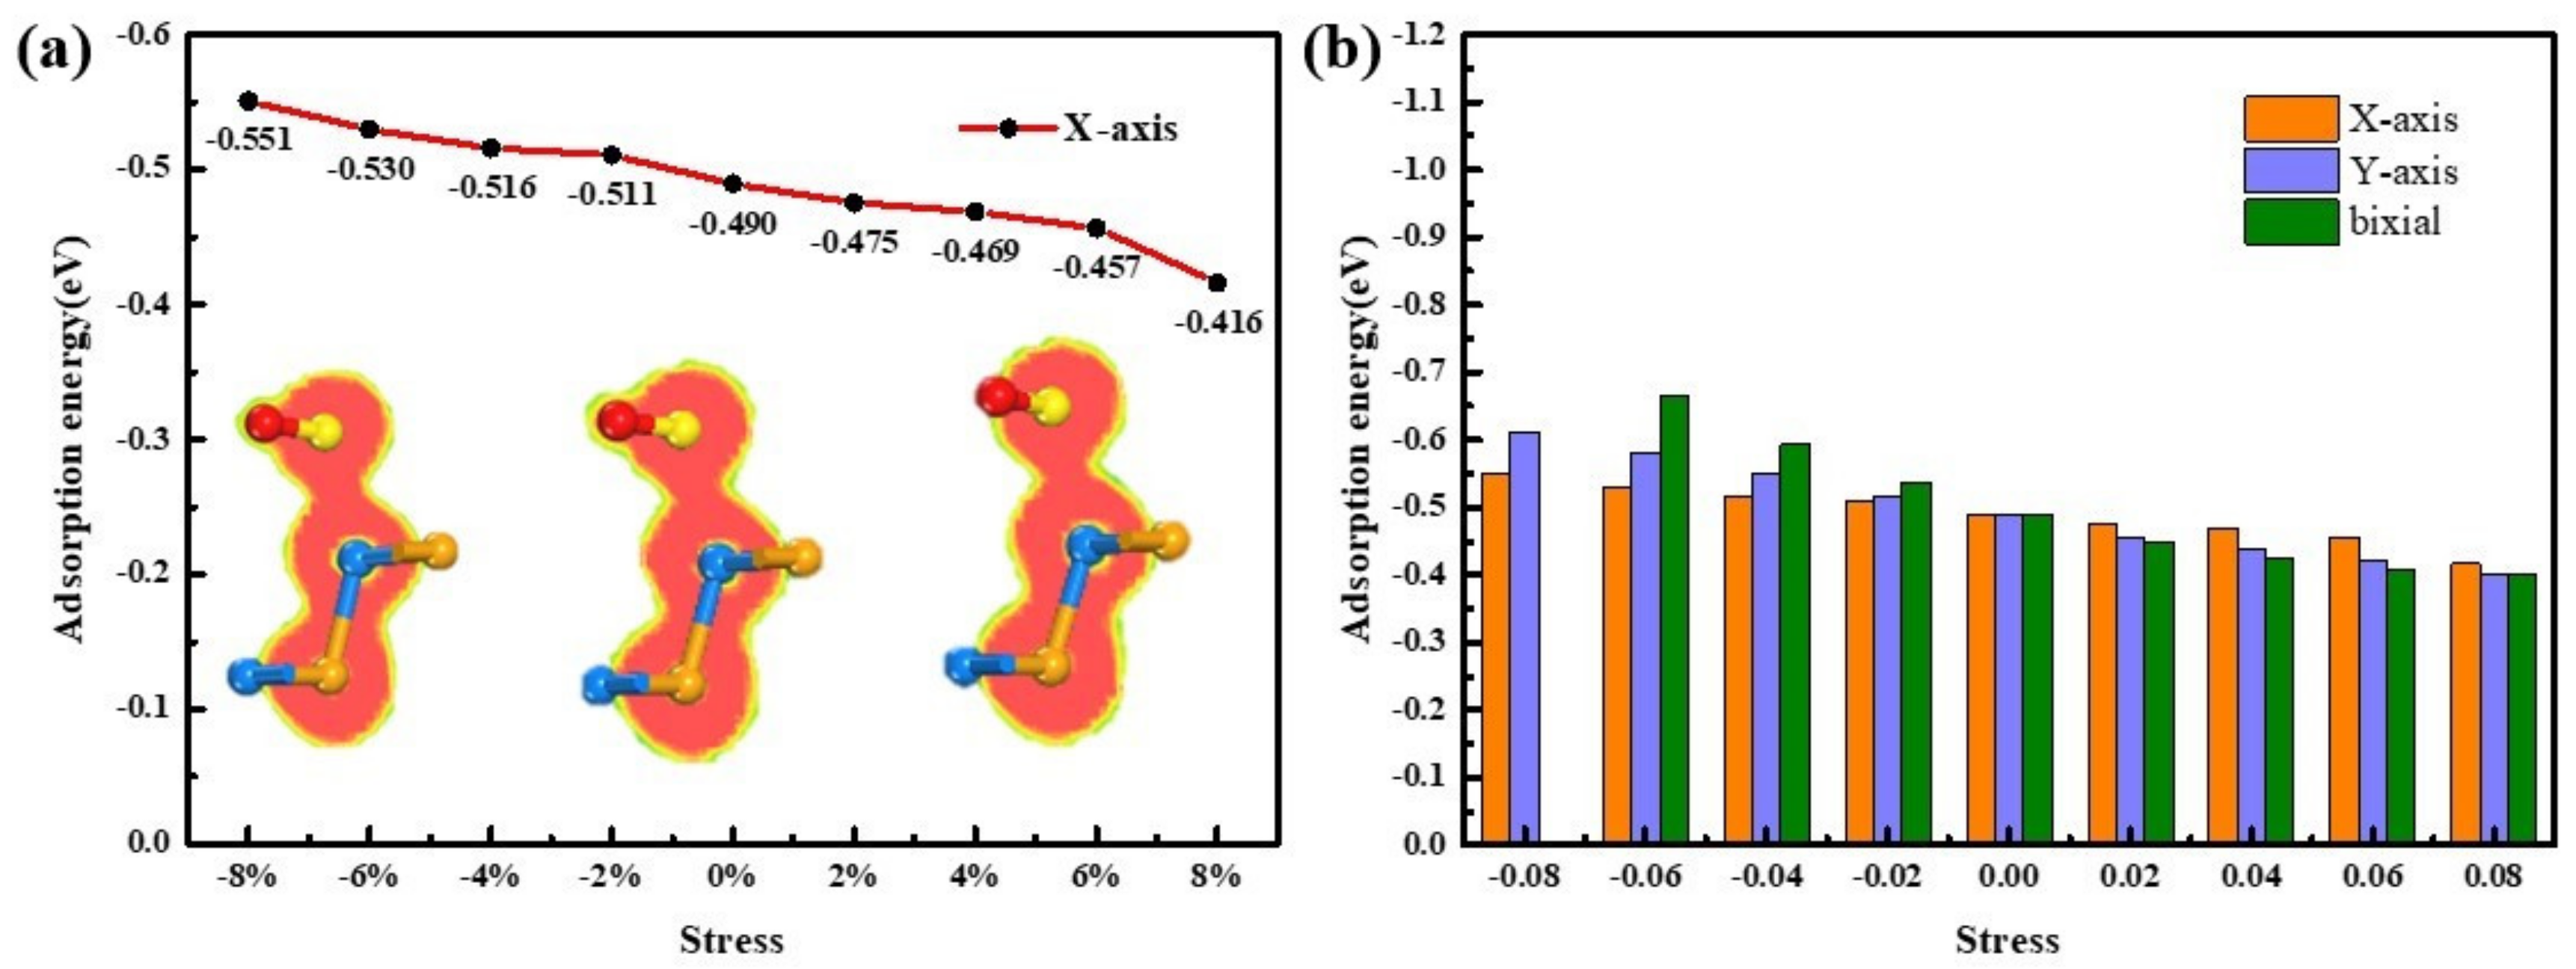
2 molecule for gas sensor. Furthermore, the ELF of SO
2 with 8% stress added to the SiSe monolayer is explored. When the tensile stress of X-axis is increasing, the adsorption energy reduces by |0.073| eV and the ΔQ reduces by 0.32 e, showing a declining interaction between the substrate and molecule. However, the region of electron localization between the Si atom and the S atom still overlaps largely in
Figure 9a, proving that chemisorption is still present. Although the adsorption energy and the transfer charge reduce more under the tensile stress of Y-axis or biaxial, such as the adsorption energy reaches |−0.400| eV and the ΔQ reaches |−0.208| e under biaxial stretching, but the ELF slice still demonstrates the hybridization between two parts. It is to say that the stress cannot adjust the adsorption of SO
2 to an optimum state.
On account of the small difference in adsorption of NH
3 and SO
2 based on SiSe substrate. It is necessary to discuss the co-adsorption mechanism of SO
2 and NH
3 gas on SiSe monolayer [
50]. We consider three possible adsorption manners according to the actual situation: adsorption of SO
2 and NH
3 simultaneously (referred to as SO
2 and NH
3/SiSe), adsorption of SO
2 followed by adsorption of NH
3 (referred as SO
2-NH
3/SiSe) and adsorption of NH
3 followed by adsorption of SO
2 (referred as NH
3-SO
2/SiSe). The results of the calculation are shown in the
Table 5 and
Table S2. Under these three cases, the substrate exhibits a different strength for gas adsorption. In the case of SO
2 and NH
3/SiSe, the adsorption abilities to the SO
2 molecule and the NH
3 molecule both increase from the data analysis in the table. The ΔQ of NH
3 rises to |0.241| e, which is |0.063| e larger than initial. Meanwhile the ΔQ of SO
2 is 0.046 e larger than original. Both the distances between the molecules and substrate are shortened, with the NH
3 reduced more seriously. It is easy to find that the same situation occurs in NH
3-SO
2/SiSe. Hence, the co-adsorption of NH
3 in the case of SO
2 and NH
3/SiSe and NH
3-SO
2/SiSe shows no sign of decline. Differently, when the SiSe monolayer first adsorbs the SO
2 molecule and then adsorbs the NH
3 molecule, the ΔQ of SO
2 decreases with the adsorption distance of SO
2 increases comparing to the SO
2/SiSe system, indicating that the interaction between the SO
2 molecule and substrate is weakened. The adsorption of NH
3 gas is improved comparing to NH
3/SiSe system, which may due to the reason that electronegativity of the N atom is greater than S atom. The N and Si atom are more likely to get or lose electrons than the S and Si atom.

 and
and 


