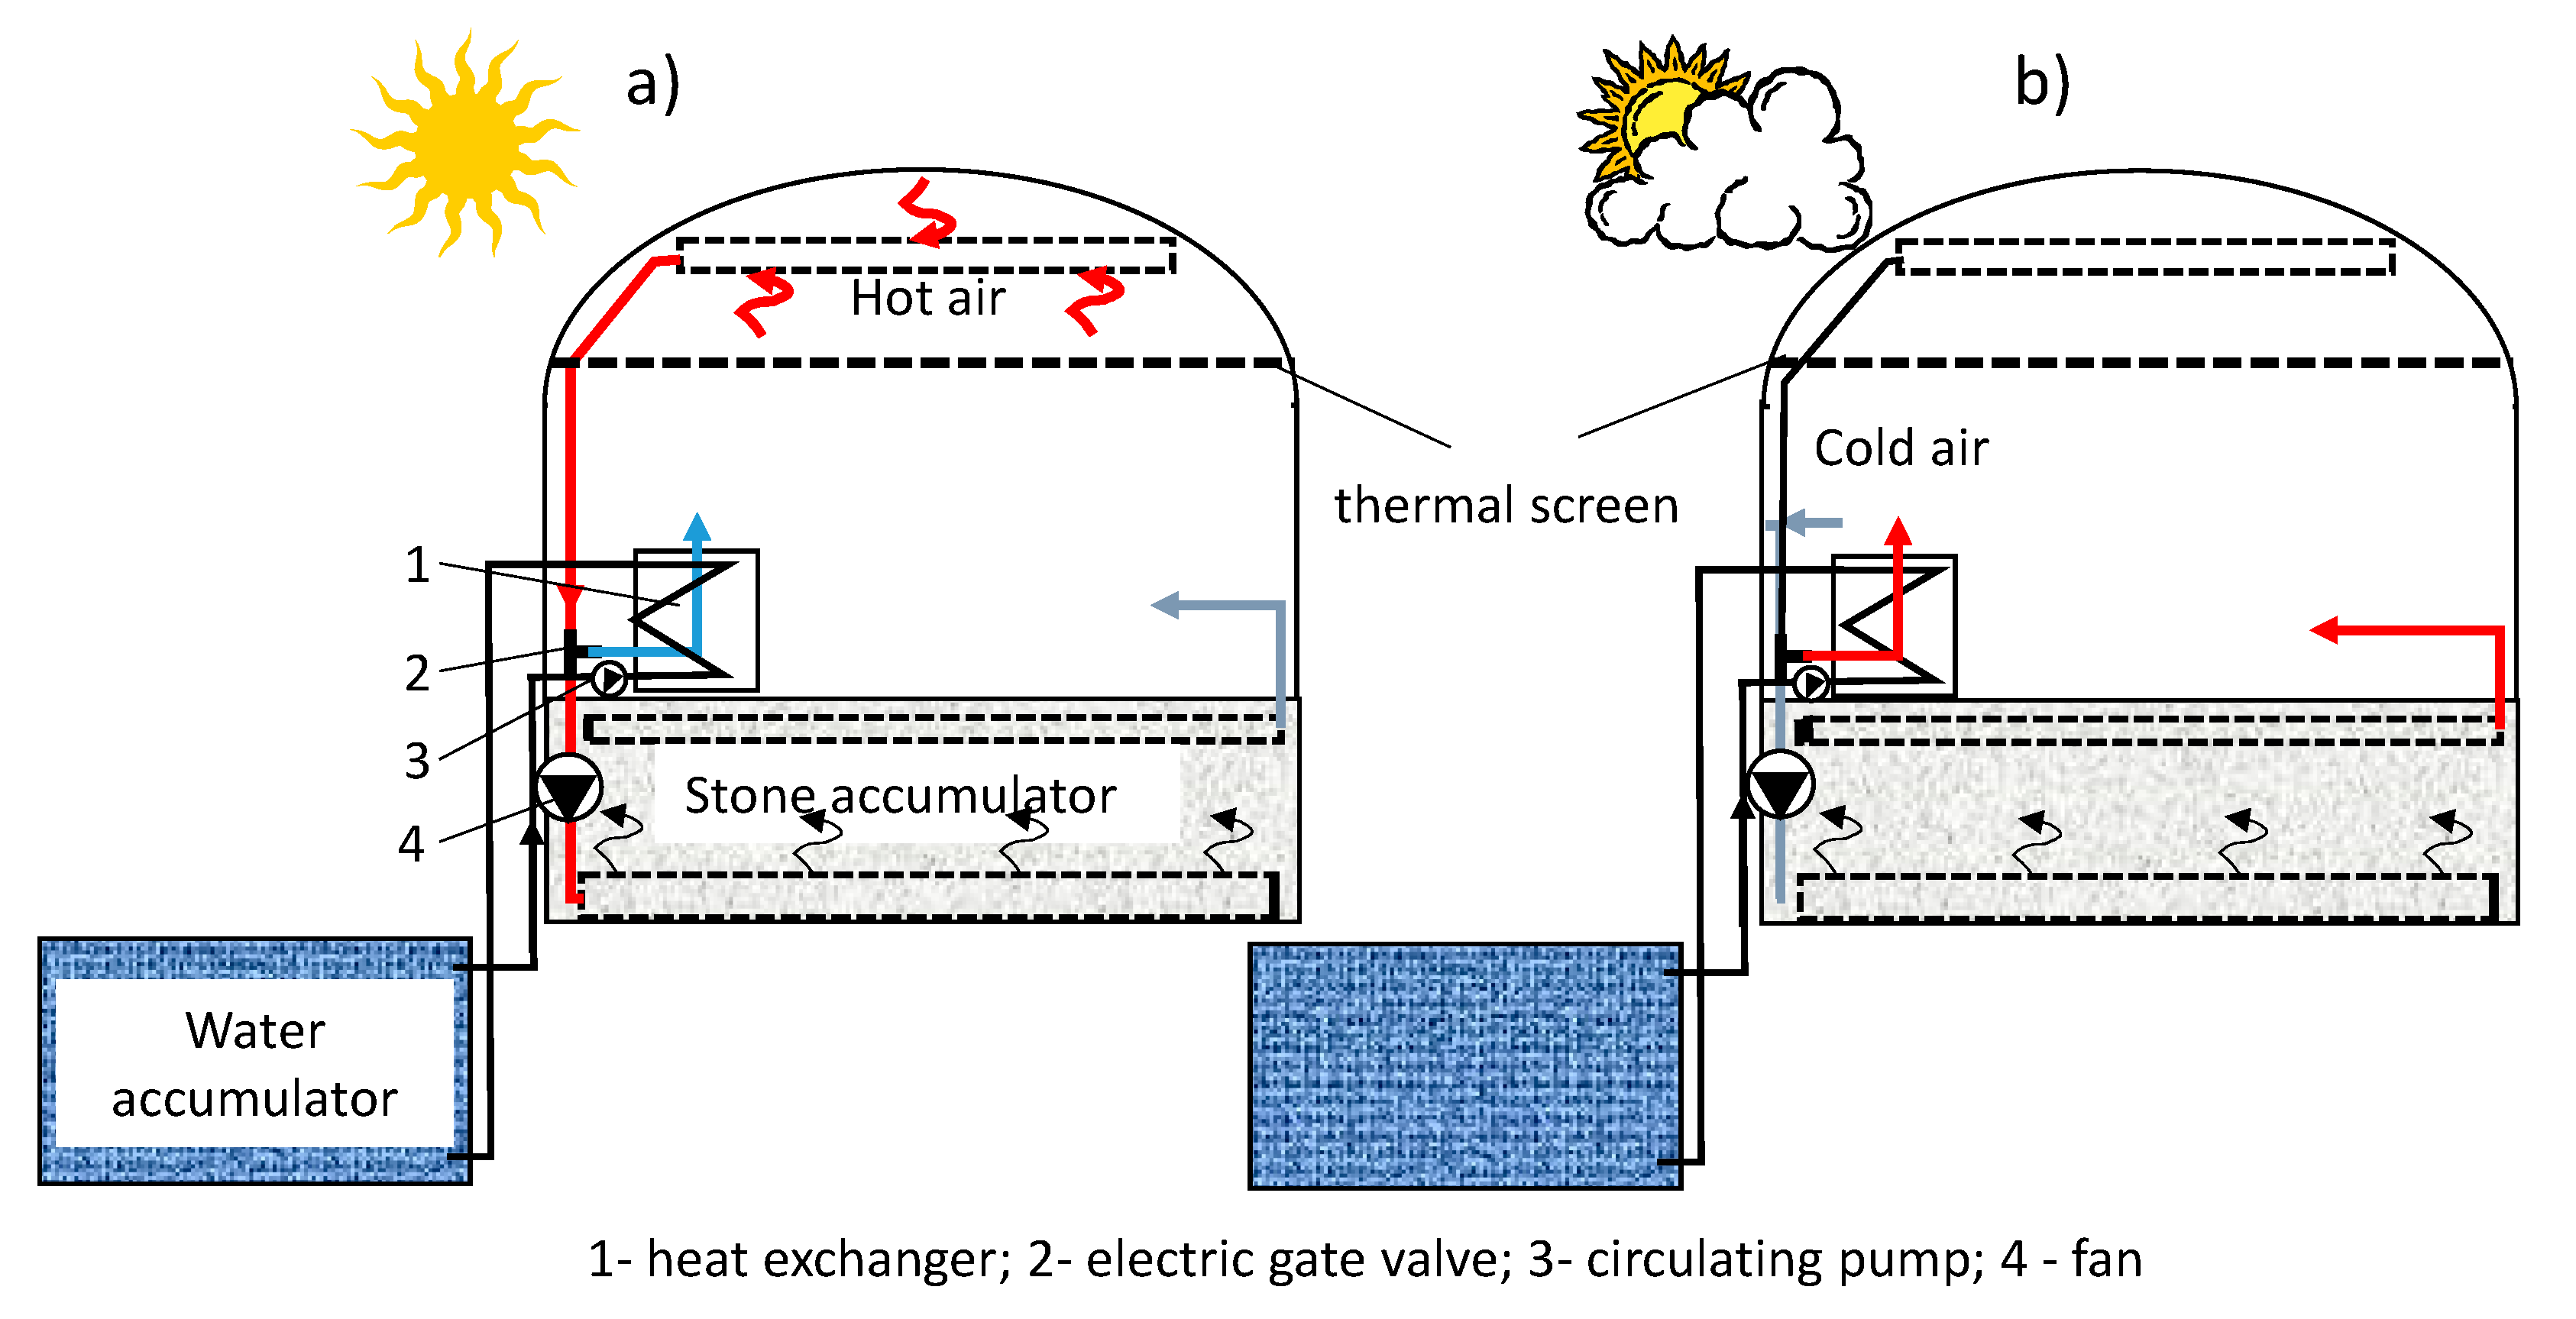
3.1. Stone-Bed Accumulator
Heat storage efficiency tests were carried out at the following input parameter ranges. For accumulator charging, 0.1 < τ < 23.6 hrs; 11.5 < TINS < 29.3 °C; 23.1 < RHINS < 90.9%; 3.7 < Va < 6.1 m/s, 470 < Pe_ch < 1180 W. For accumulator discharging, 0.2 < τ < 20.1 hrs; 6.6 < TINS < 22.2 °C; 73.1 < RHINS < 95.2 %; 4.6 < Va < 6.4 m/s, 830 < Pe_disch < 1250 W.
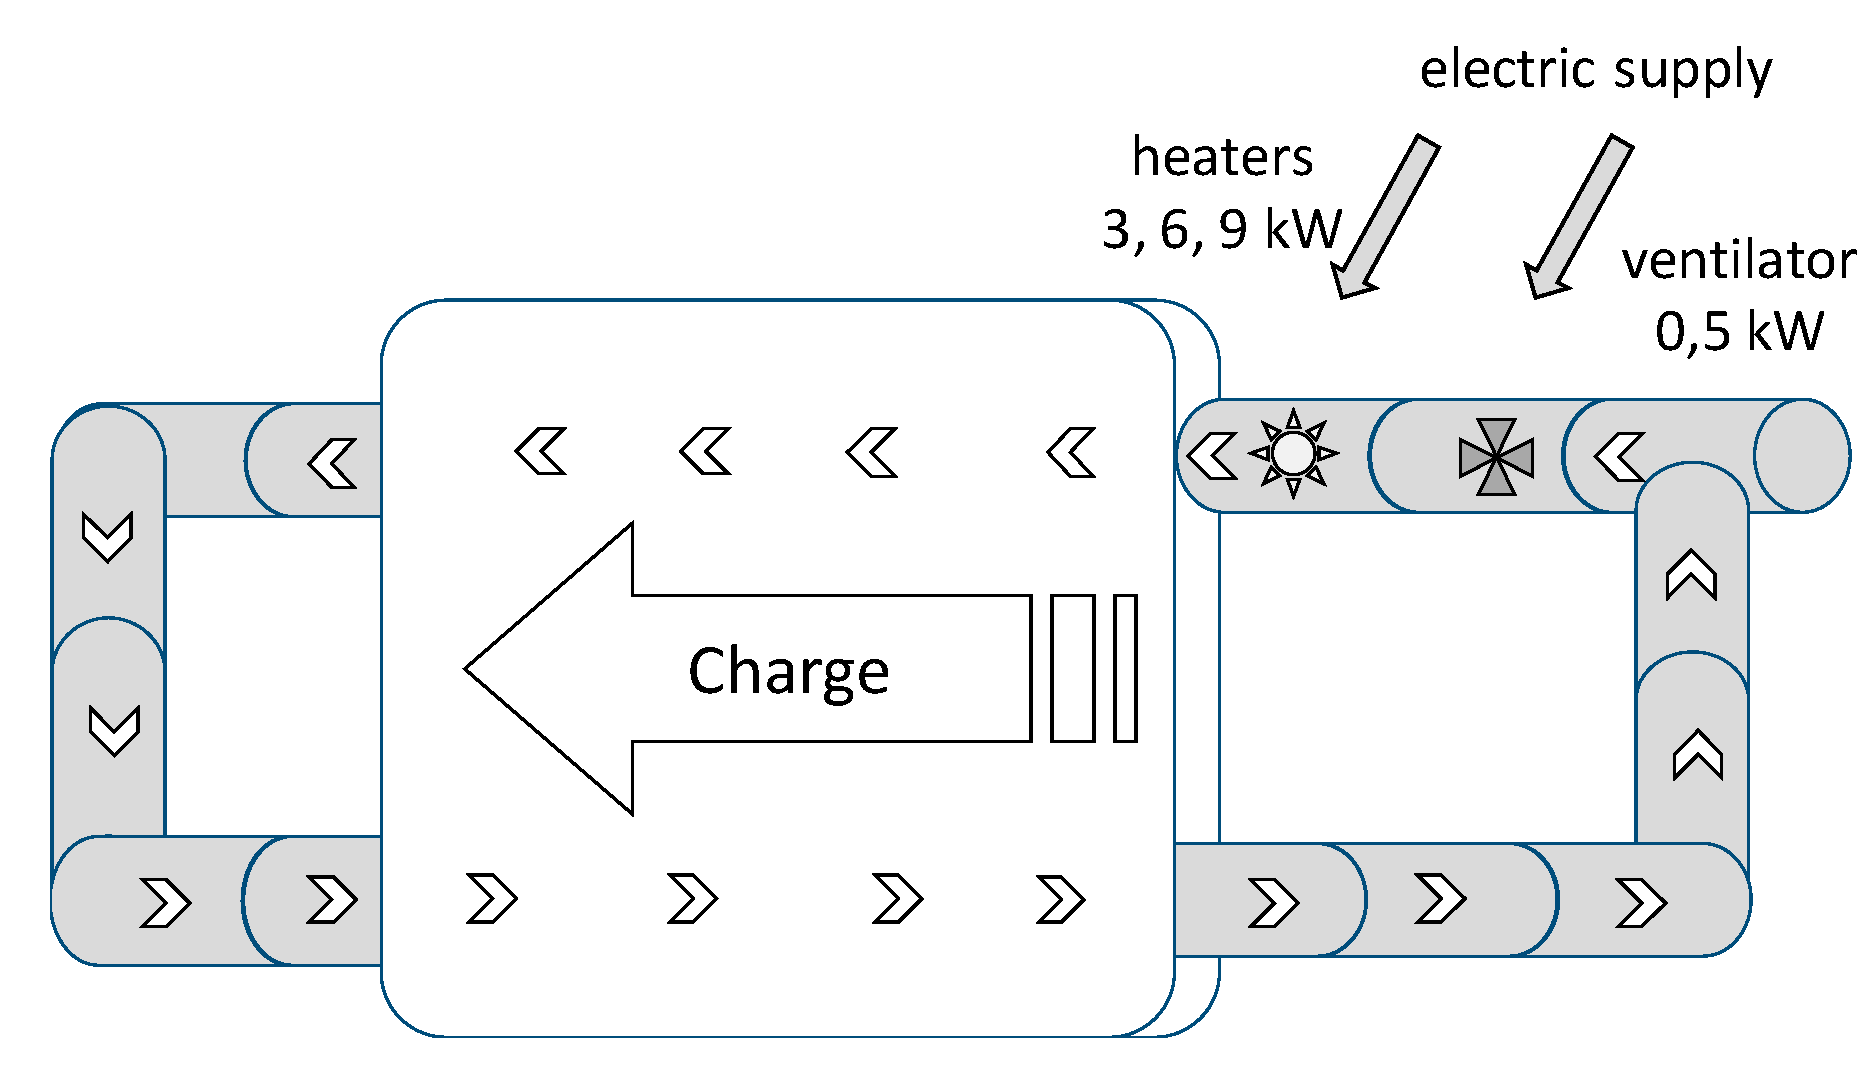
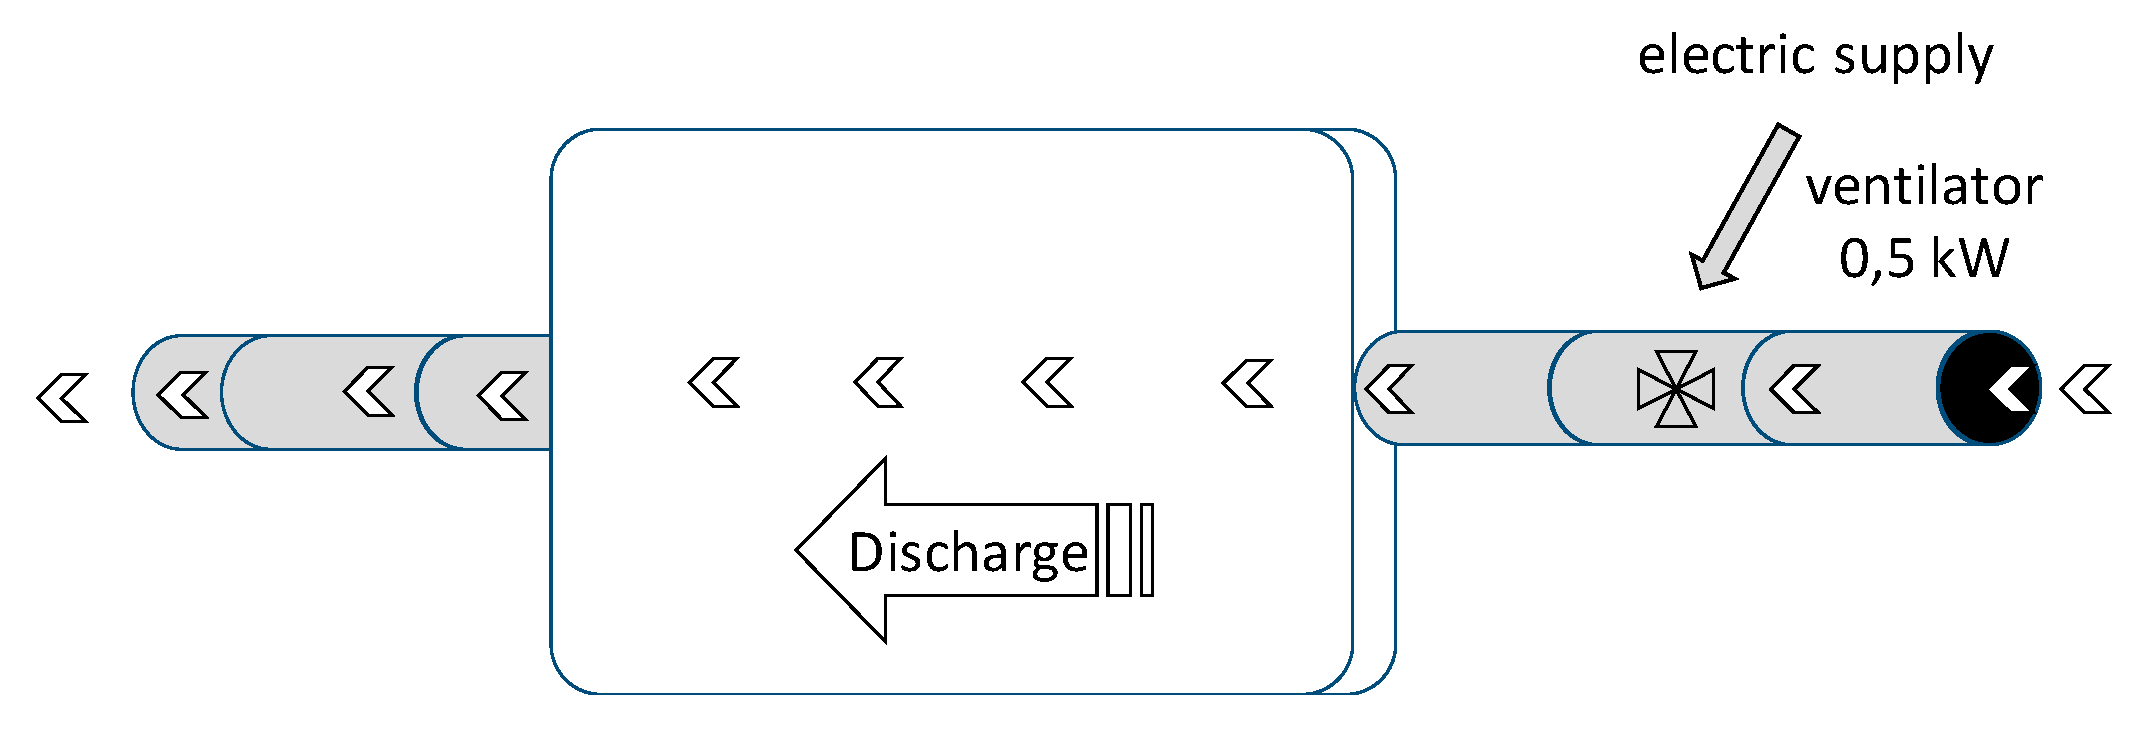
The PCM accumulator system operation included charging and discharging periods. Charging times ranged from 1.9 to 10.3 h and discharging times ranged from 2.5 to 11 h.
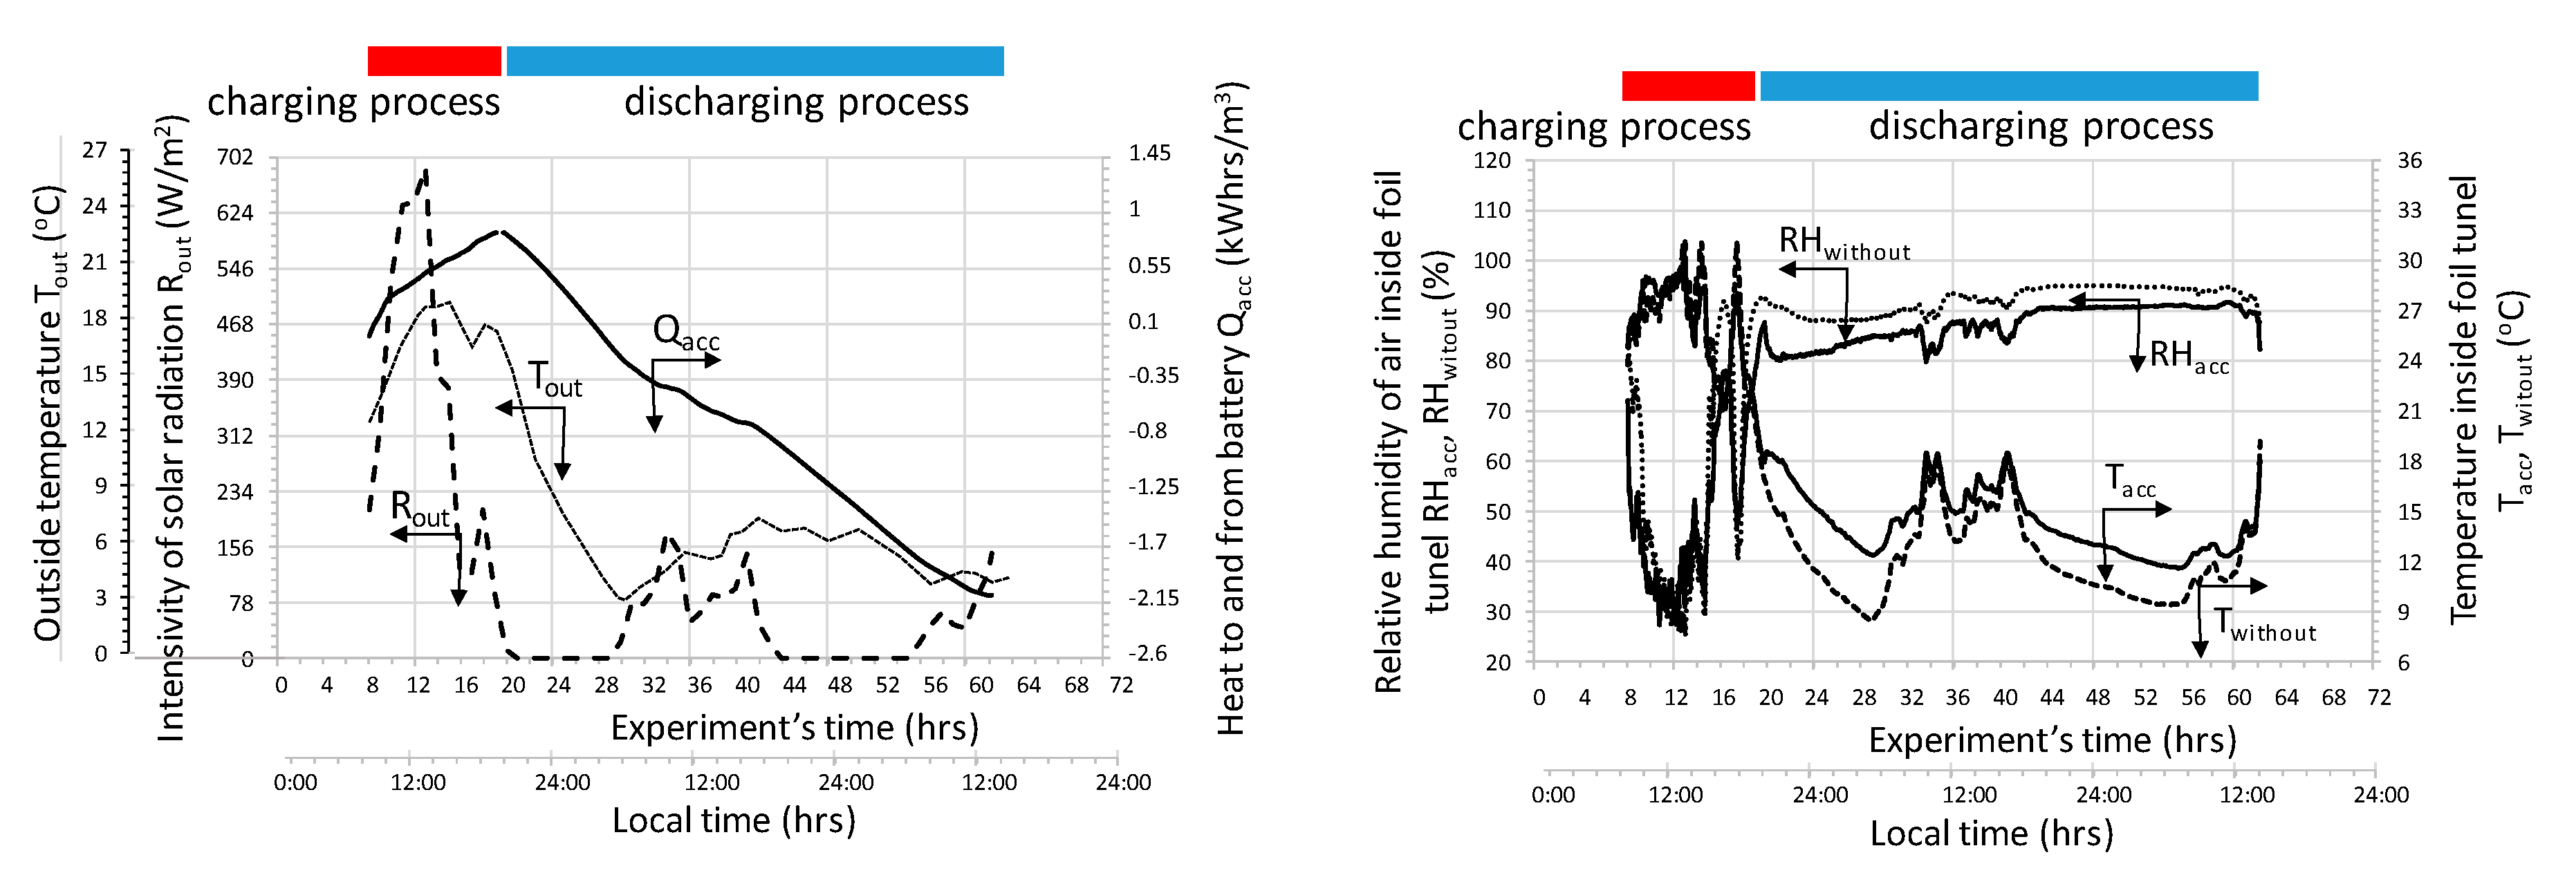
Figure 9 shows an example of the changes of measured and calculated parameters during one full cycle of accumulator charging and discharging.
During the charging cycle, the total amount of solar radiation energy was 4.17 kWh. Whilst charging (the cycle time was nearly 11 hours), the total amount of heat stored in the accumulator (calculated per 1m3 of the bed) was 0.84 kWh/m3. In the discharge cycle (cycle duration was approximately 43 h), about 2.9 kWh / m3 was fed into the tunnel with plants. The greater amount of heat delivered to the tunnel with plants, compared to the amount of heat stored during accumulator charging, was at the expense of lowering the final bed temperature.
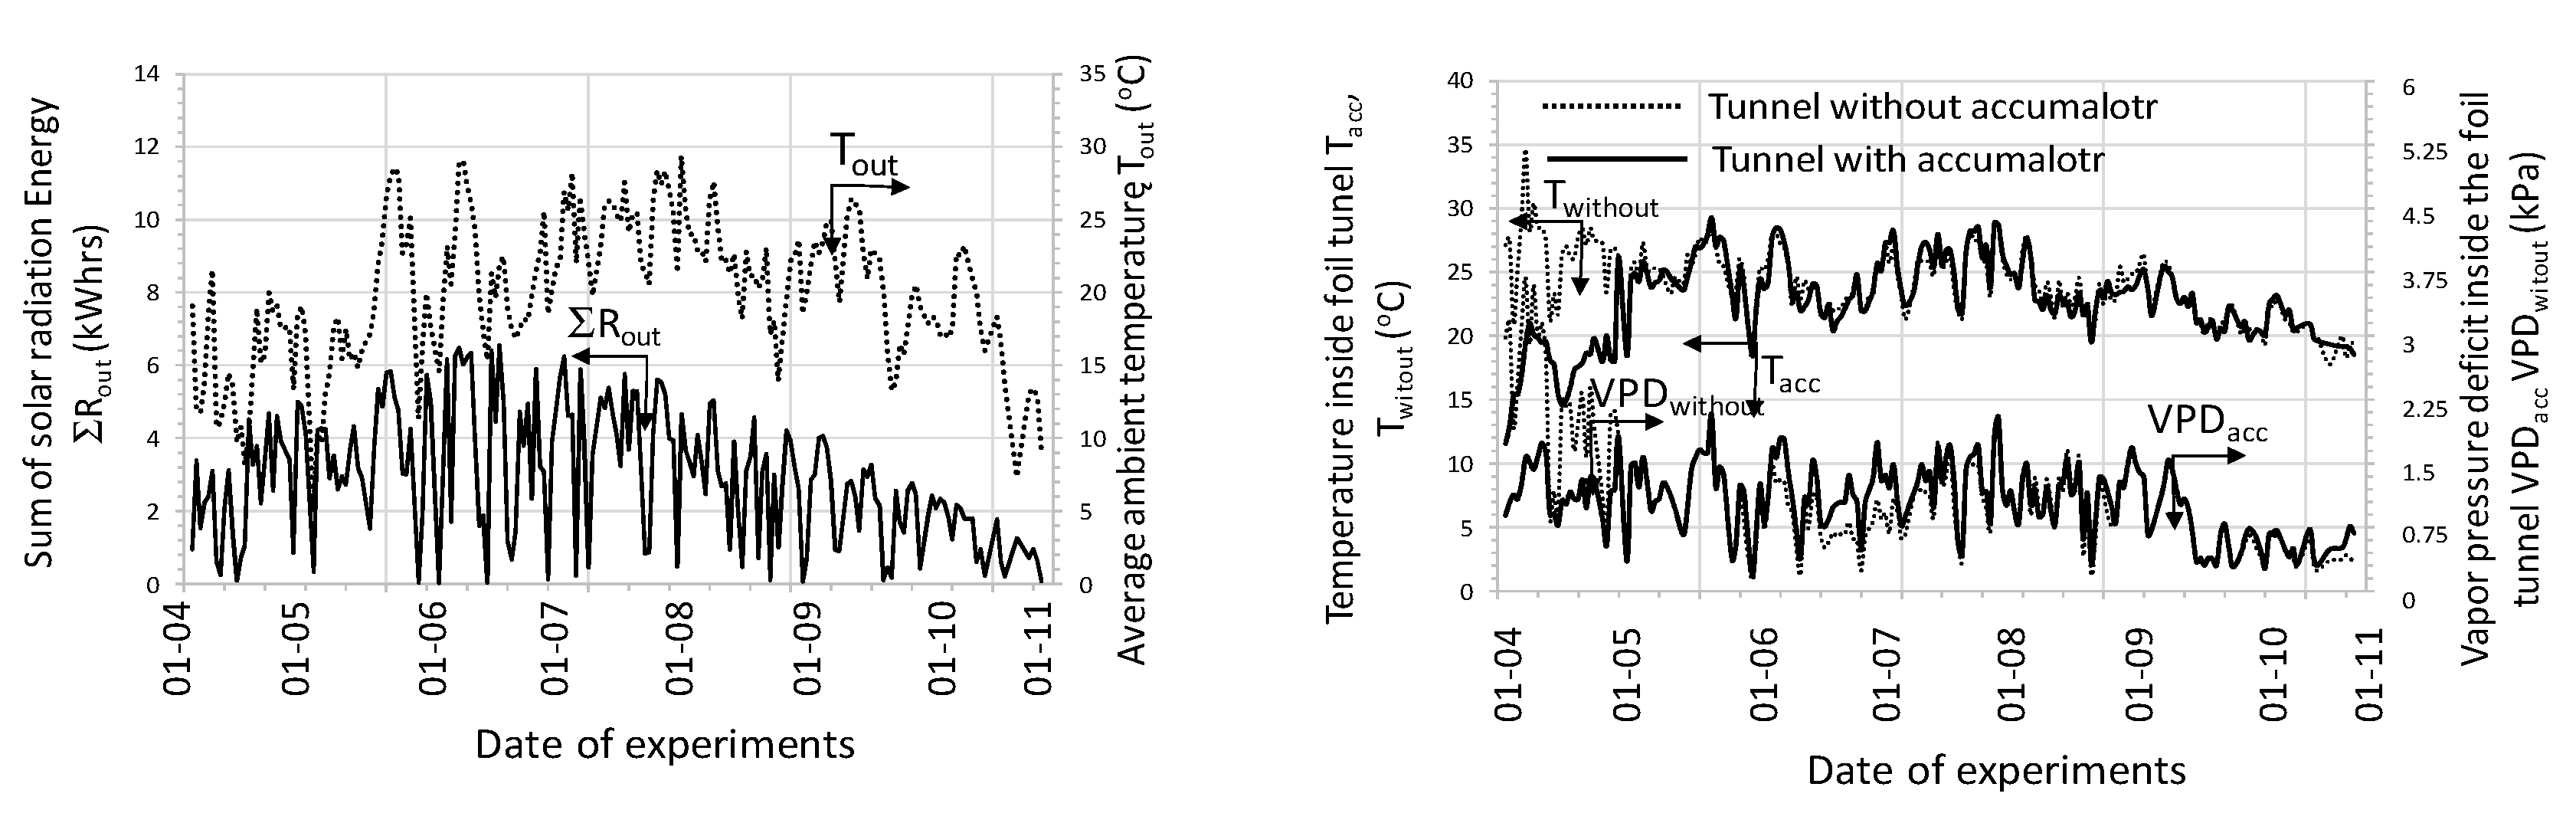
Figure 10 illustrates the charge and discharge cycles in which the total amount of solar radiation in the cycle was 5.5 kWh.
The charging cycle was approximately 11.5 h. During charging, nearly 0.91 kWh/m3 of heat was stored in the accumulator, while during discharge 1.2 kWh/m3 of heat was supplied to the tunnel. As before, the increased amount of heat results from a lower bed temperature at the end of accumulator discharge when compared to the onset of charging.
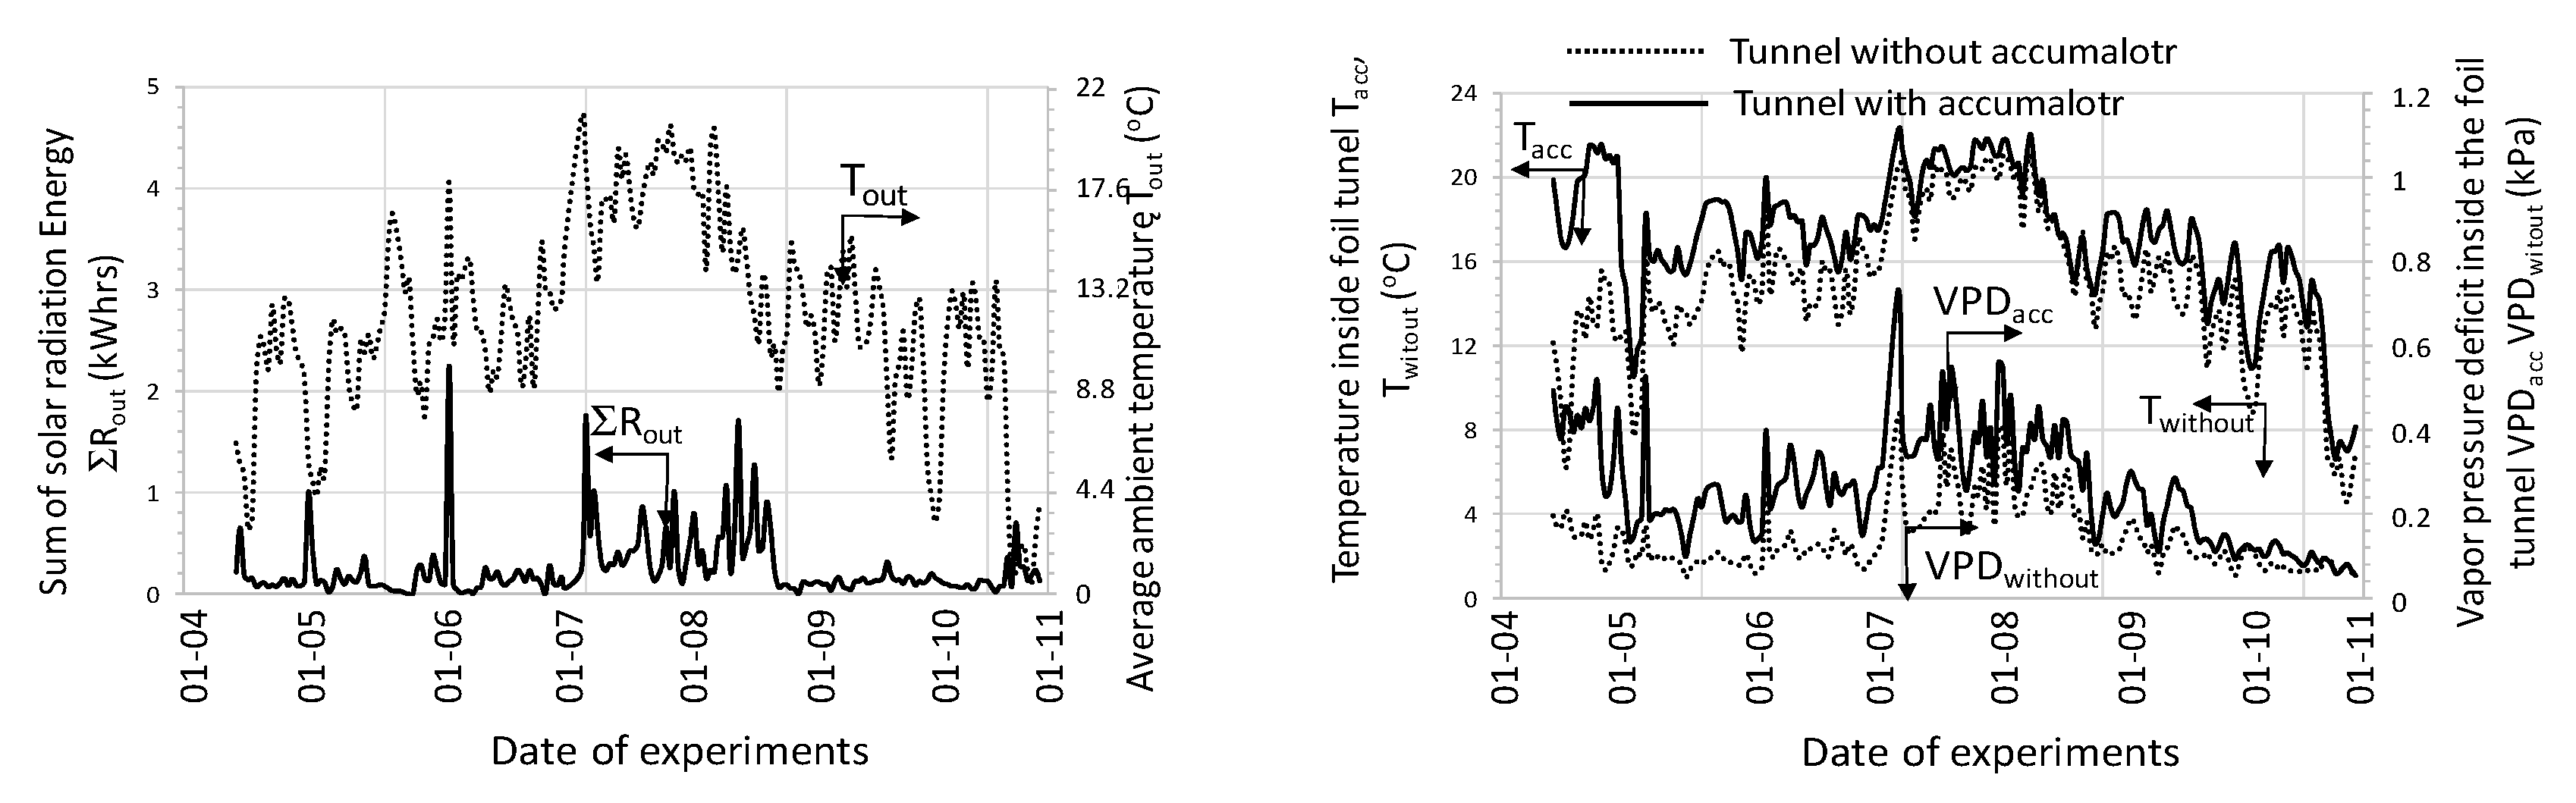
As shown in the graph (
Figure 11), the air passing through the bed of the accumulator’s bed is dehumidified while the accumulator is being charged and humidified when it is discharged. The total amount of water removed from the interior of the tunnel (
mtot) when charging the accumulator depends on the temperature of the injected air. As it results from the course of the presented relationships at the beginning of the charging process, the amount of water mass stored in the accumulator bed increased intensively, while with the heating of the bed the air drying rate decreases and even to the extent that humidification of exhaust air occurs. This trend was observed for both analyzed cases.
In order to generalize the relationships obtained, the analyses were carried out for all 392 cycles and the obtained graphical relationships of the measured and calculated quantities were depicted in
Figure 12,
Figure 13 and
Figure 14.
The analysis showed that throughout the entire season from 0.003 to 1.27 kWh of heat was supplied to the inside of the plastic tunnel (area 150 m2) from 1 square meter of accumulator surface during one cycle. Taking into account the accumulator area (the active area in both processes was about 70 m2) and the number of cycles, 7.09 MWh of heat was supplied to the interior of the tunnel. This is equivalent to combustion of almost 1.74 tons of coal, assuming a boiler efficiency of 0.7 and a calorific value of 5.83 kWh / kg. During both operations, the process of humidifying and drying the air stream occurred. The average amount of water vapor removed from the flowing air as a result of its condensation at the flowing air-bed interface (in the charging process) was 0.03 kgH20/cycle per 1 m2 of accumulator surface. When discharged, exhaust air was humidified, and its average value was 0.17 kgH20/cycle/m2. The mechanism of increasing humidity in the exhaust air results directly from the evaporation of water vapor in contact with air at a lower temperature than the temperature of the stone bed. To sum up, it can be stated that the dominating process during the accumulator charging was dehumidification, while during the discharge process it was humidified.
Figure 15 presents selected changes in the COP coefficient as a function of solar radiation intensity and the amount of air forced in for the accumulator charging process (a) and as a function of the temperature and amount of air forced in during its discharge (b).
As can be seen in both cases, when the air stream increases, the efficiency of the processes analyzed decreases. In the examined conditions, the range of changes in the COP coefficient was, for the charging process, from 0.1 to 9.0 and for the discharge process within the range of 0.2 to 9.8.
Figure 16 presents the course of the COP coefficient for successive charging and direct discharging cycles (the coefficient was calculated from Equation (6)).
Research shows that the COP coefficient decreases as the temperature and stream of injected air increase. In the experimental conditions, the average value of this coefficient was COP = 1.71. Based on the results obtained by the non-linear estimation method using the quasi-Newton method, with a significance factor of α = 0.05, an equation was found for the COP coefficient as a function of mean temperature of the injected air and air stream. This equation takes the form:
for the ranges of input variables, 13.3 < T
in_avg < 25.1 °C; 9.41 < q
unit < 21.84 dm
3/(m
2∙s), where T
in_avg—mean temperature of the air forced into the accumulator in the processes of its charging and discharging (°C); q
unit—stream of injected air per the accumulator surface unit (dm
3/(m
2∙s)).
3.2. Water Accumulator
The analysis of the test results is presented in graphs for three independent cycles.
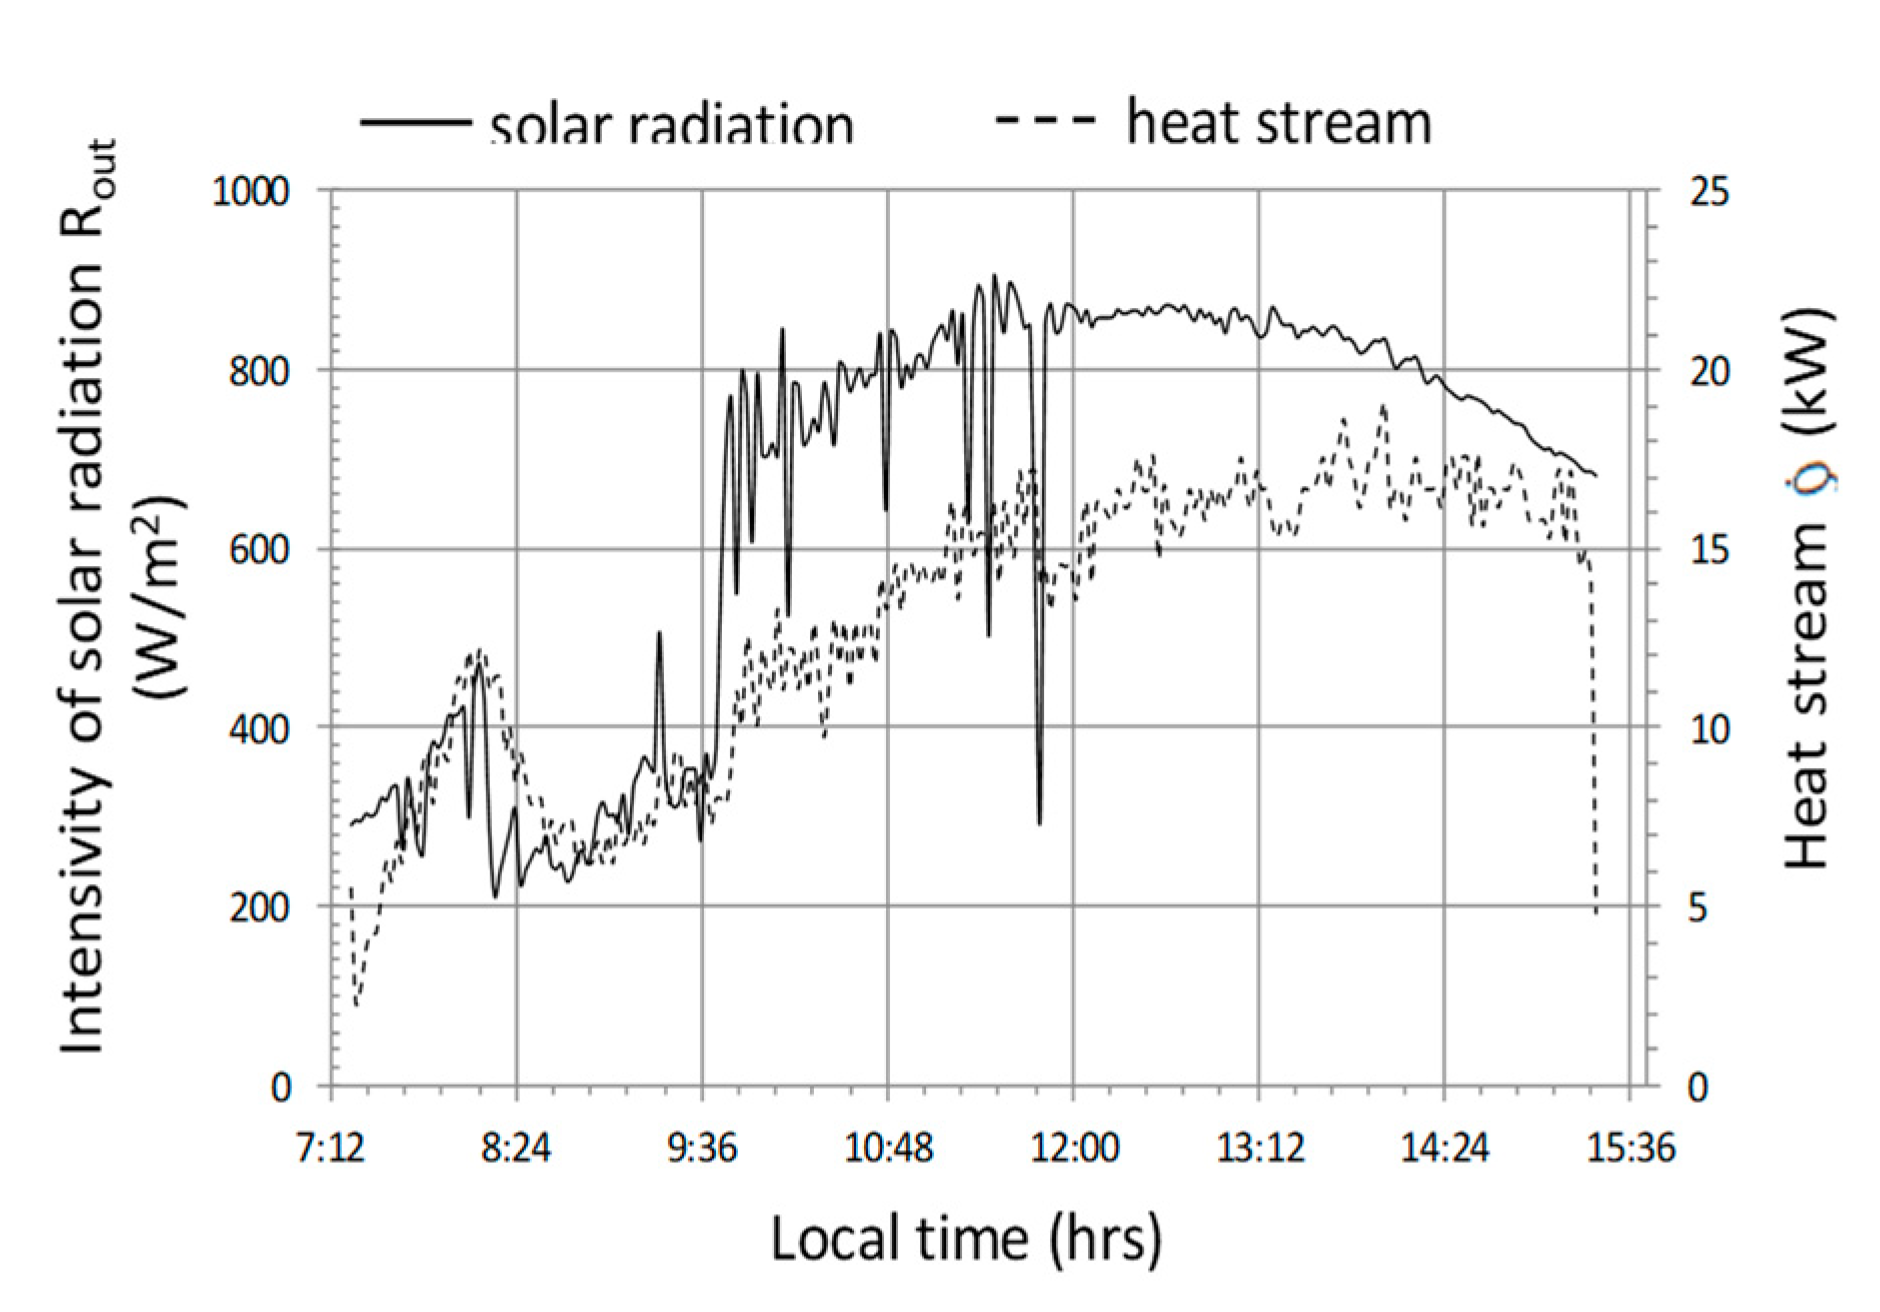
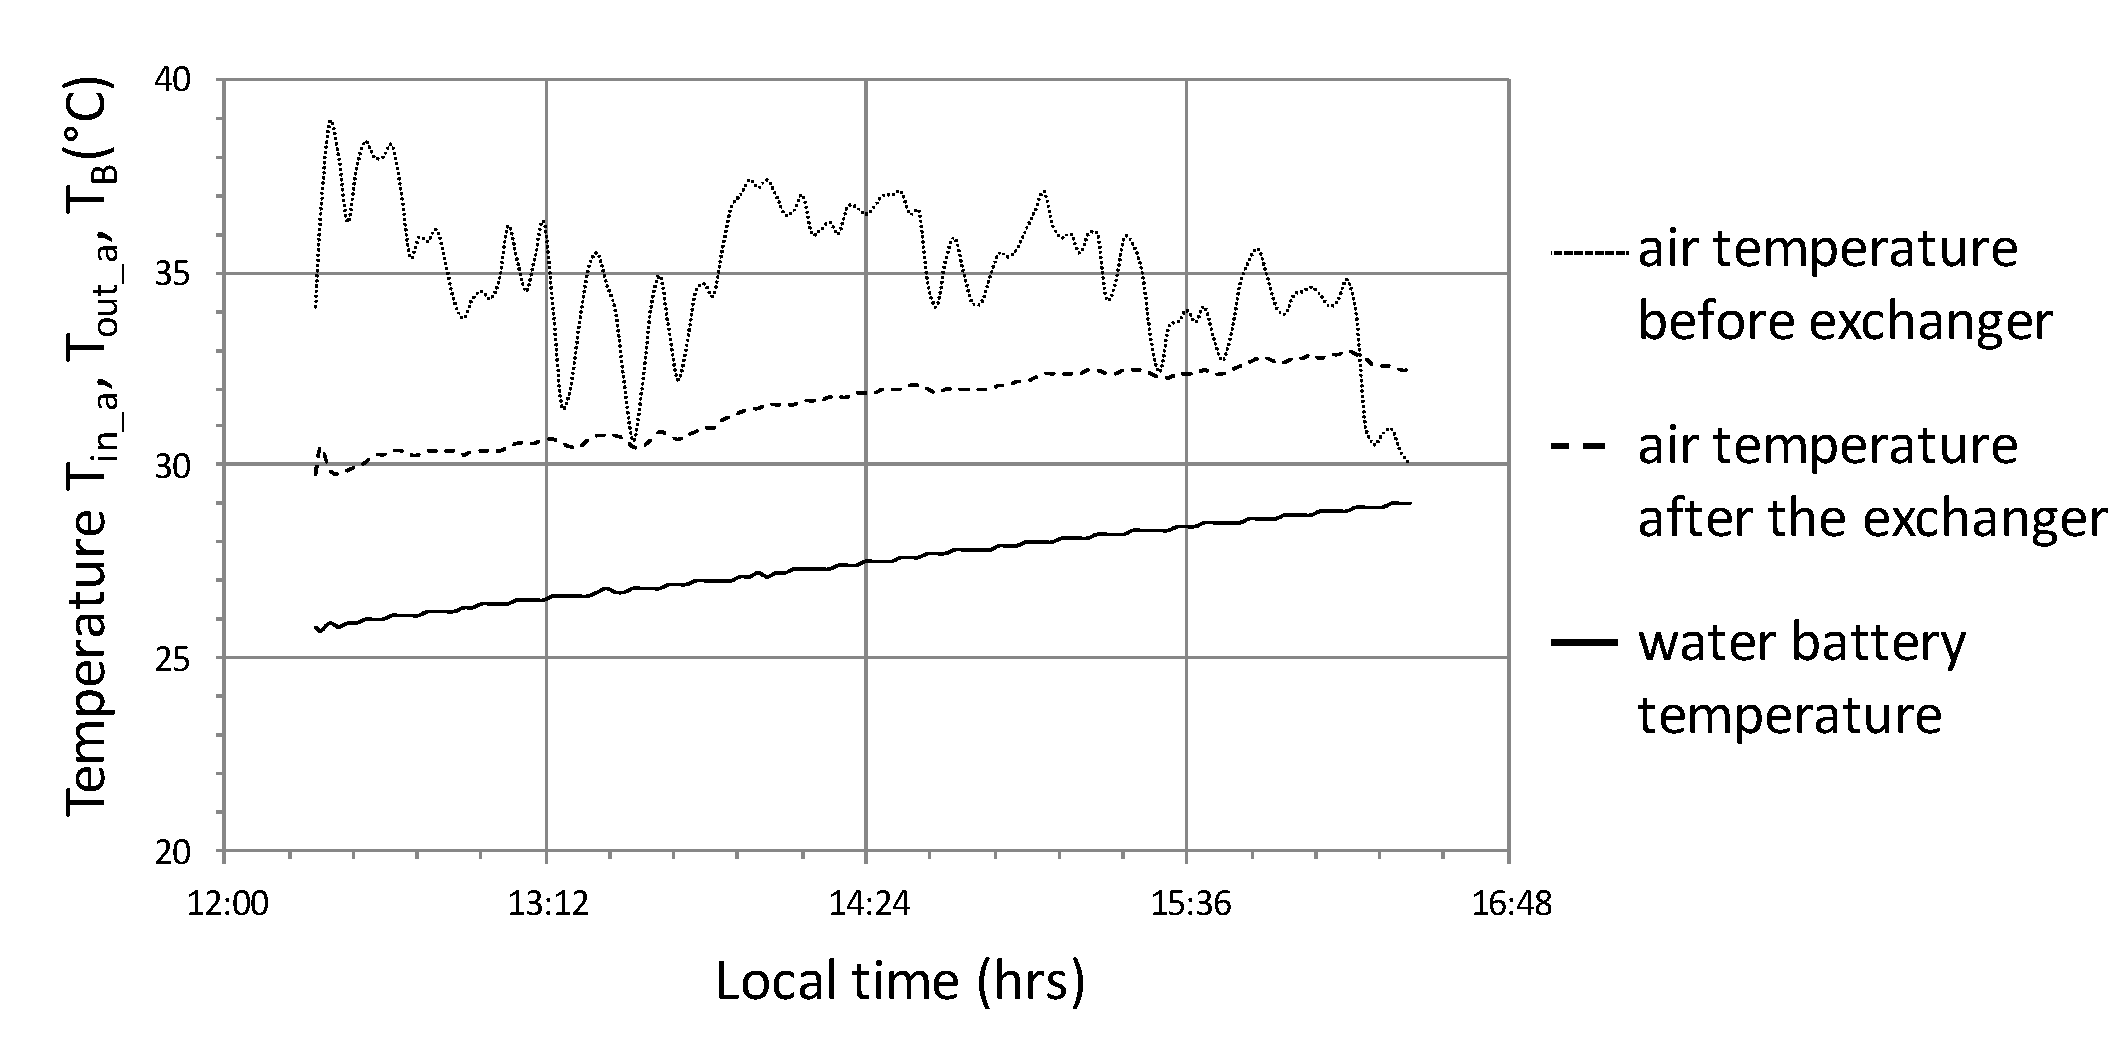
Figure 17 presents the operating parameters of the analyzed heat storage system for the cycle with the following average values—R
out_a = 655 W/m
2, T
in_aa = 36 °C, T
out_aa = 26 °C, T
B_a = 20.2 °C,
= 13 kW (where, index a stands for the average value of the parameter which was calculated in accordance with equation 3), COP = 4.6. This cycle was chosen because it lasted 8 h and was the longest in the analyzed data set from the period of 7 months. In this cycle, solar radiation reaching the object was stable, without major interference, on a typical cloudless day with a maximum at 12:30 of 860 W/m
2. The course of the instantaneous heat flow
is correlated with the intensity of solar radiation, which can be clearly seen in the period of operation from 10:00 to 13:00 (
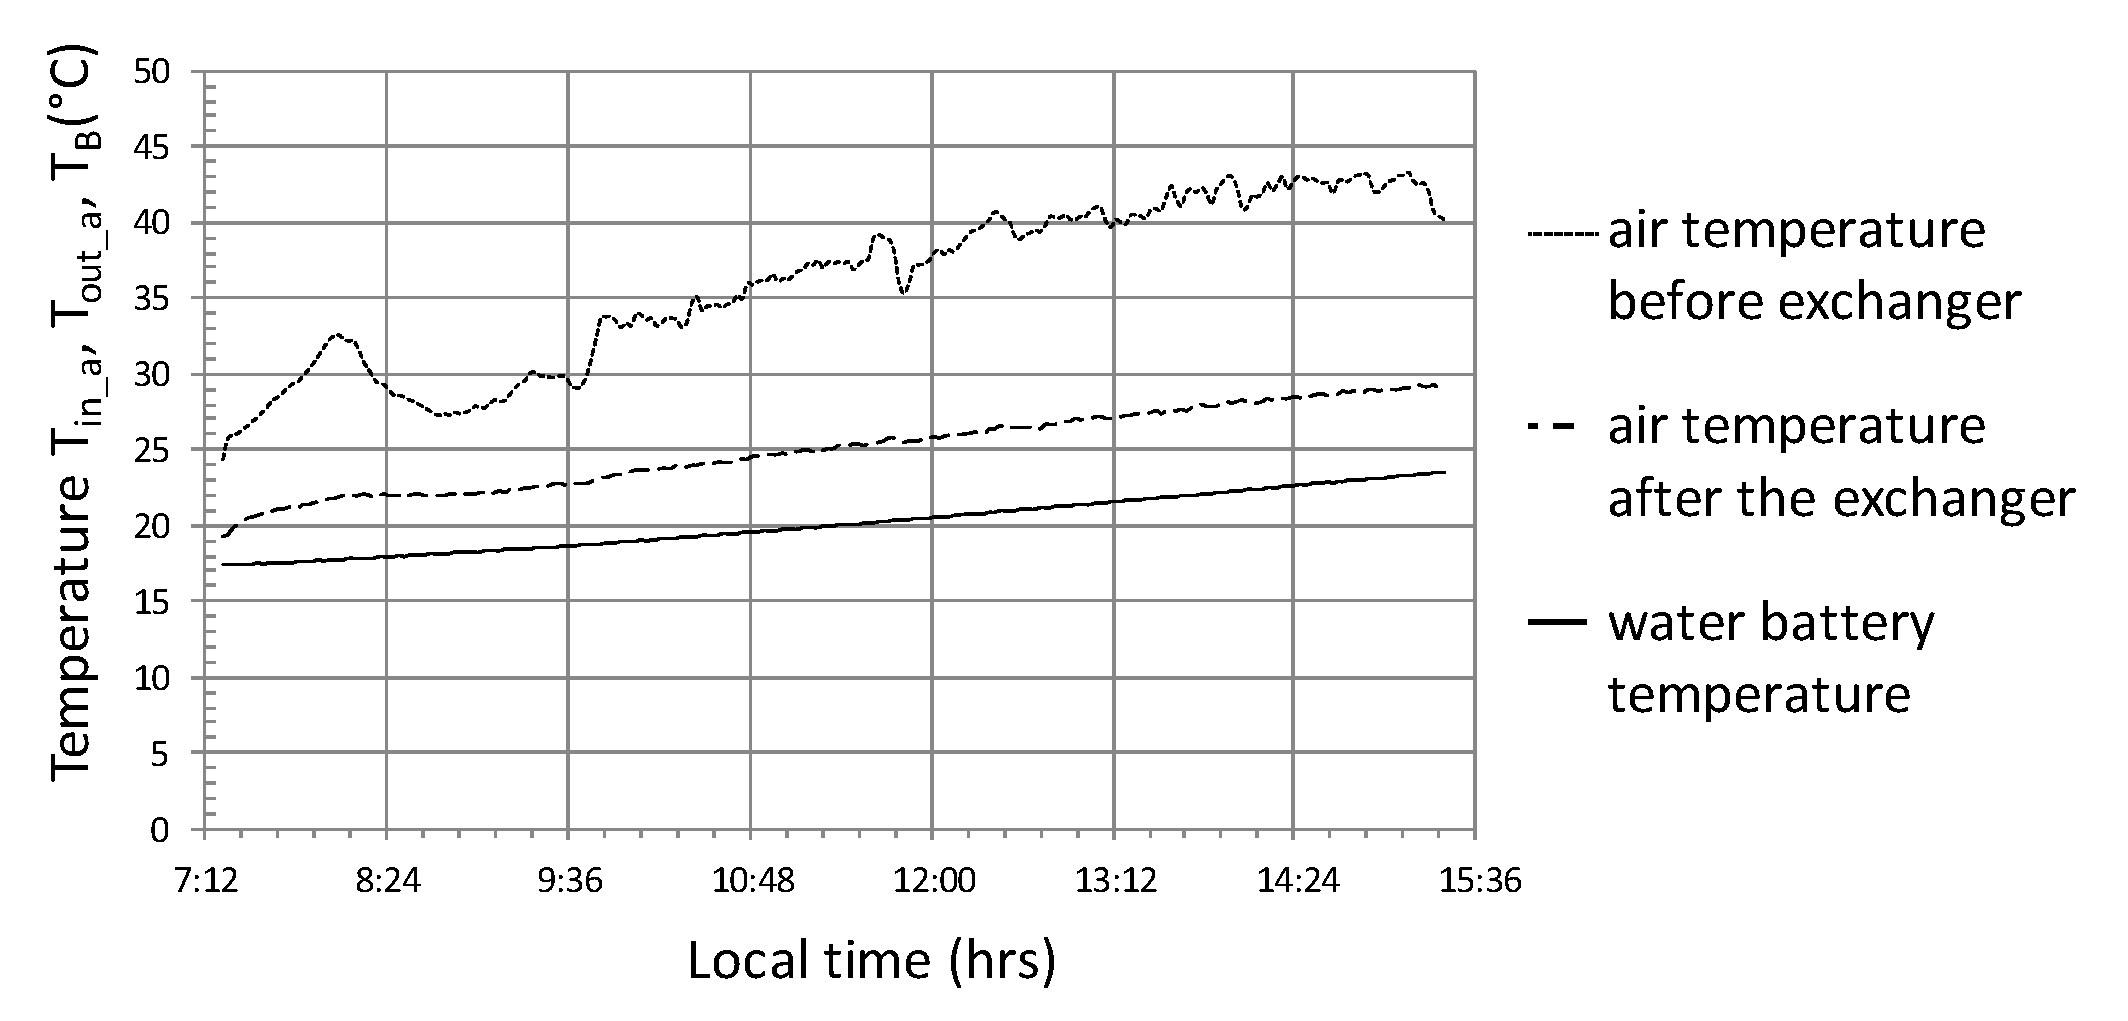
Figure 17). The maximum value of this stream is at 14:00 and is 17.5 kW. The end of the system operation in this cycle is characterized by a sharp drop in power, which, in conjunction with the temperature course (
Figure 18) may indicate a forced shutdown of the heat storage system in the water accumulator. An important phenomenon is smoothing the temperature of the air leaving the heat exchanger (
Figure 18) in relation to the temperature course of the air entering this heat exchanger. The water temperature T
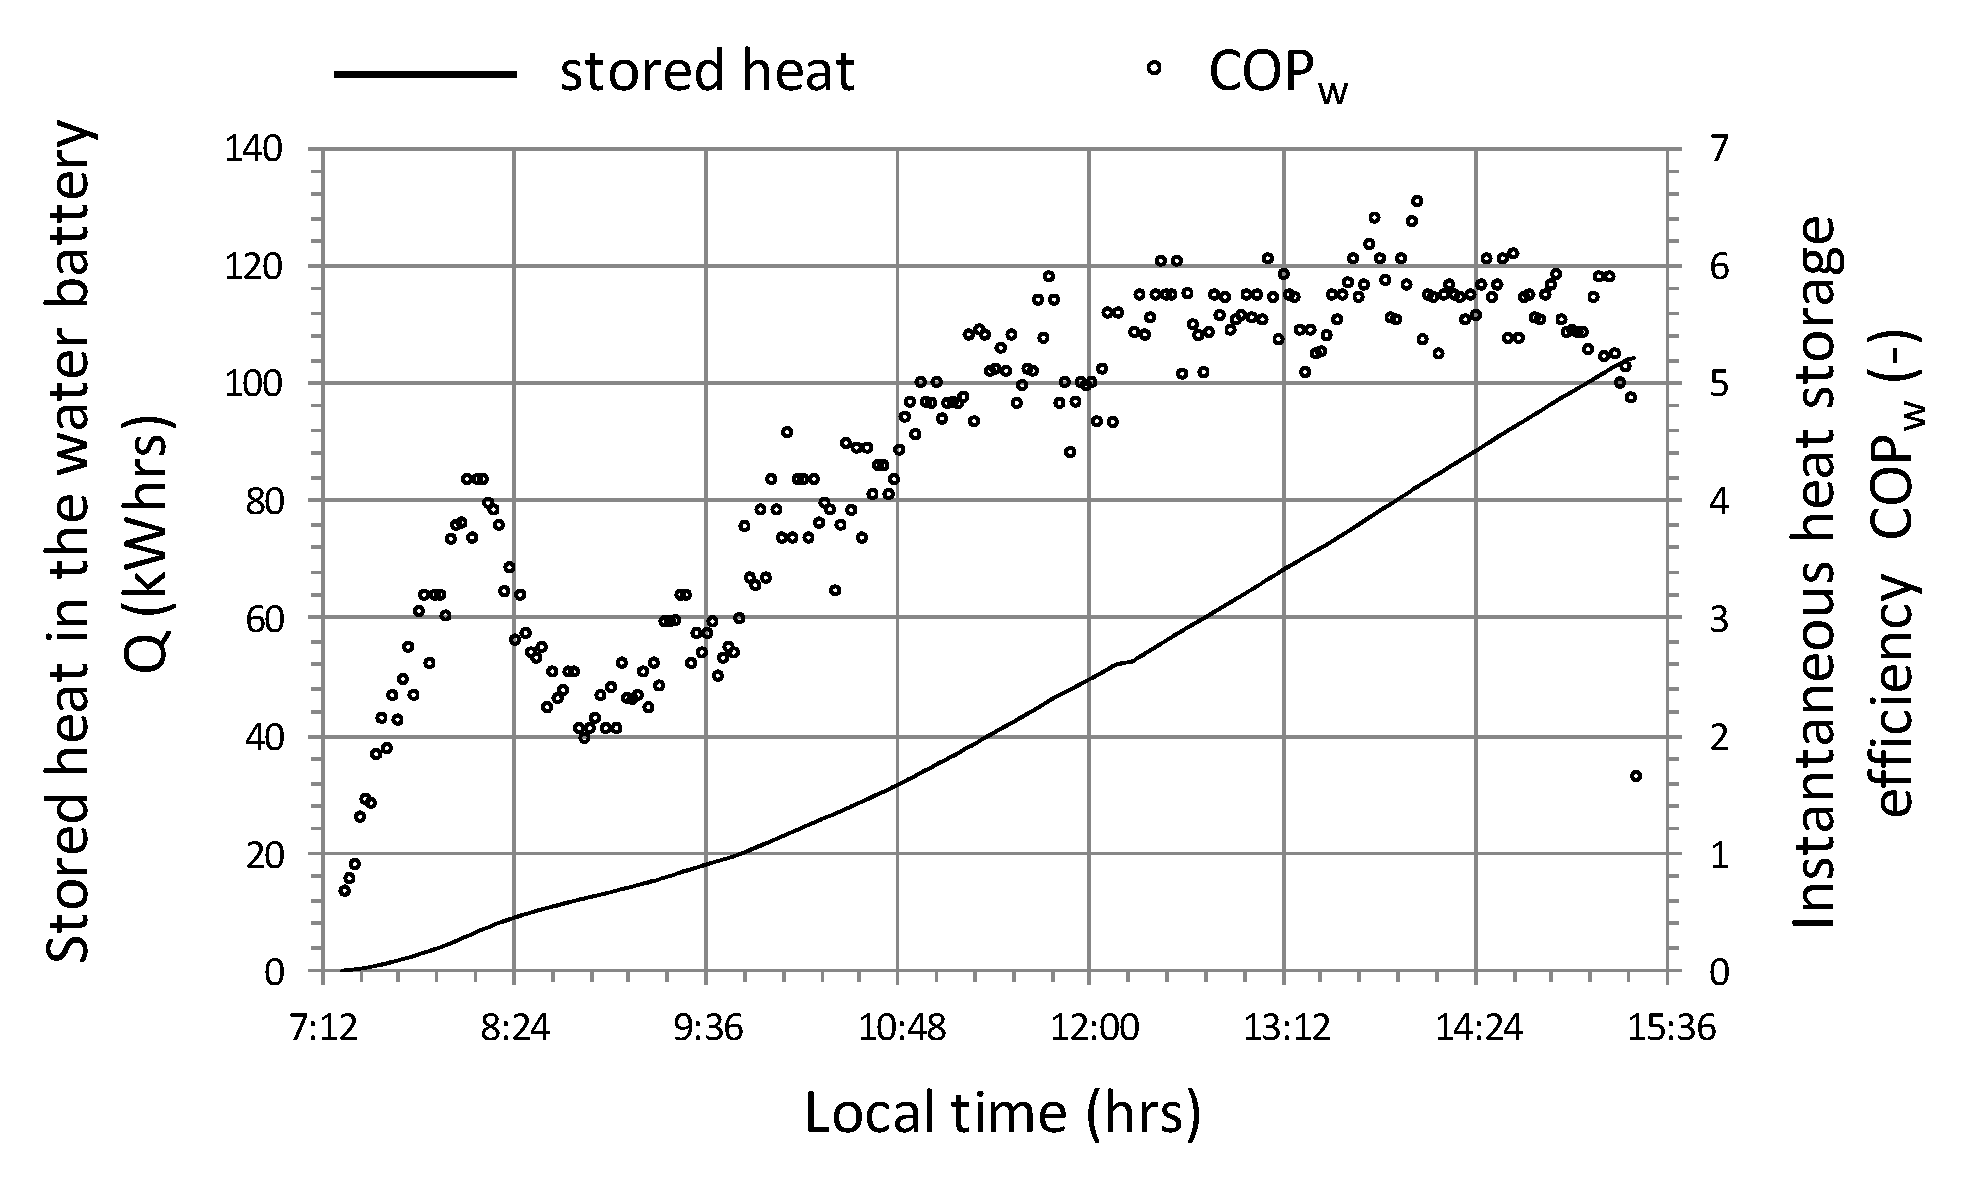
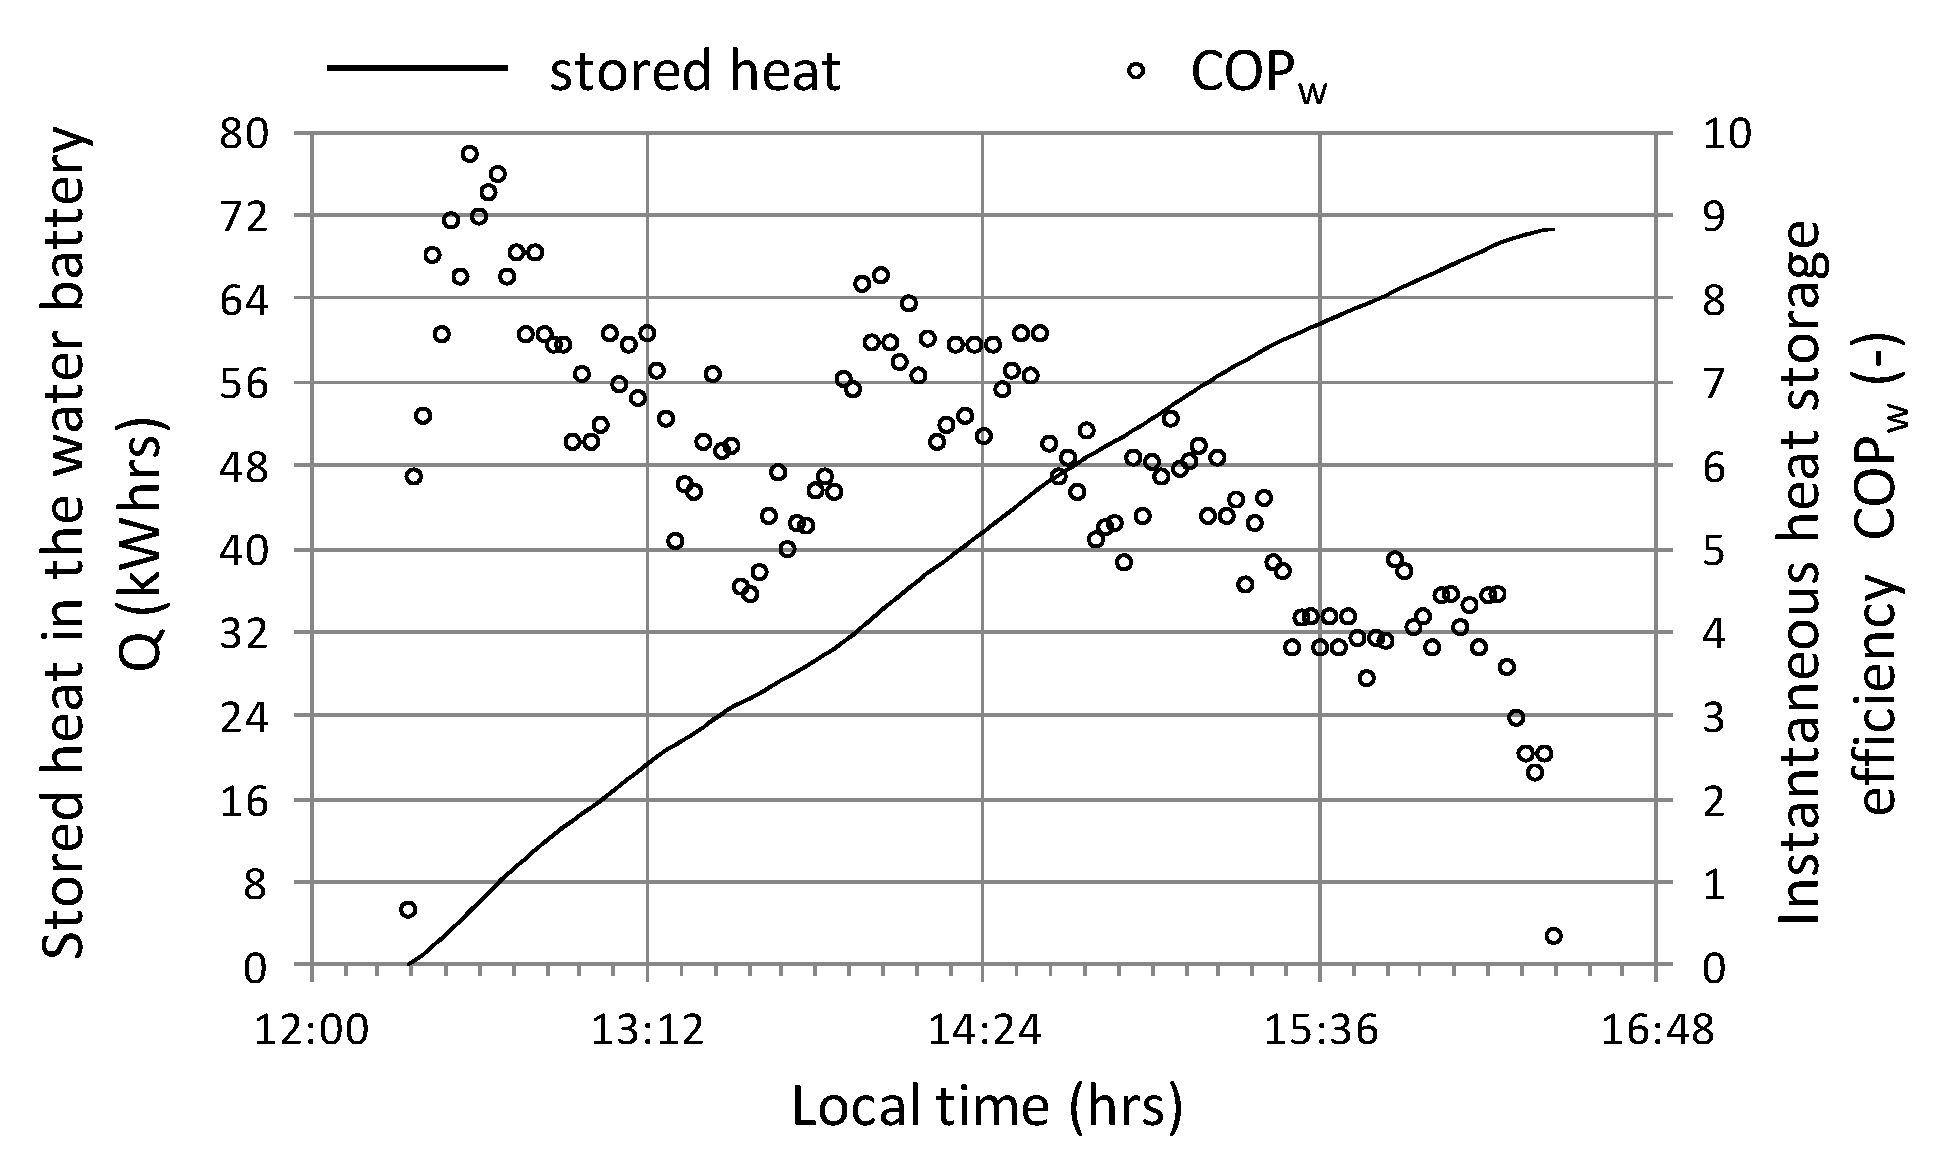
B in the accumulator increases from 17.5 to 23 °C, which equates to a storage of 105 kWh of heat (
Figure 18).
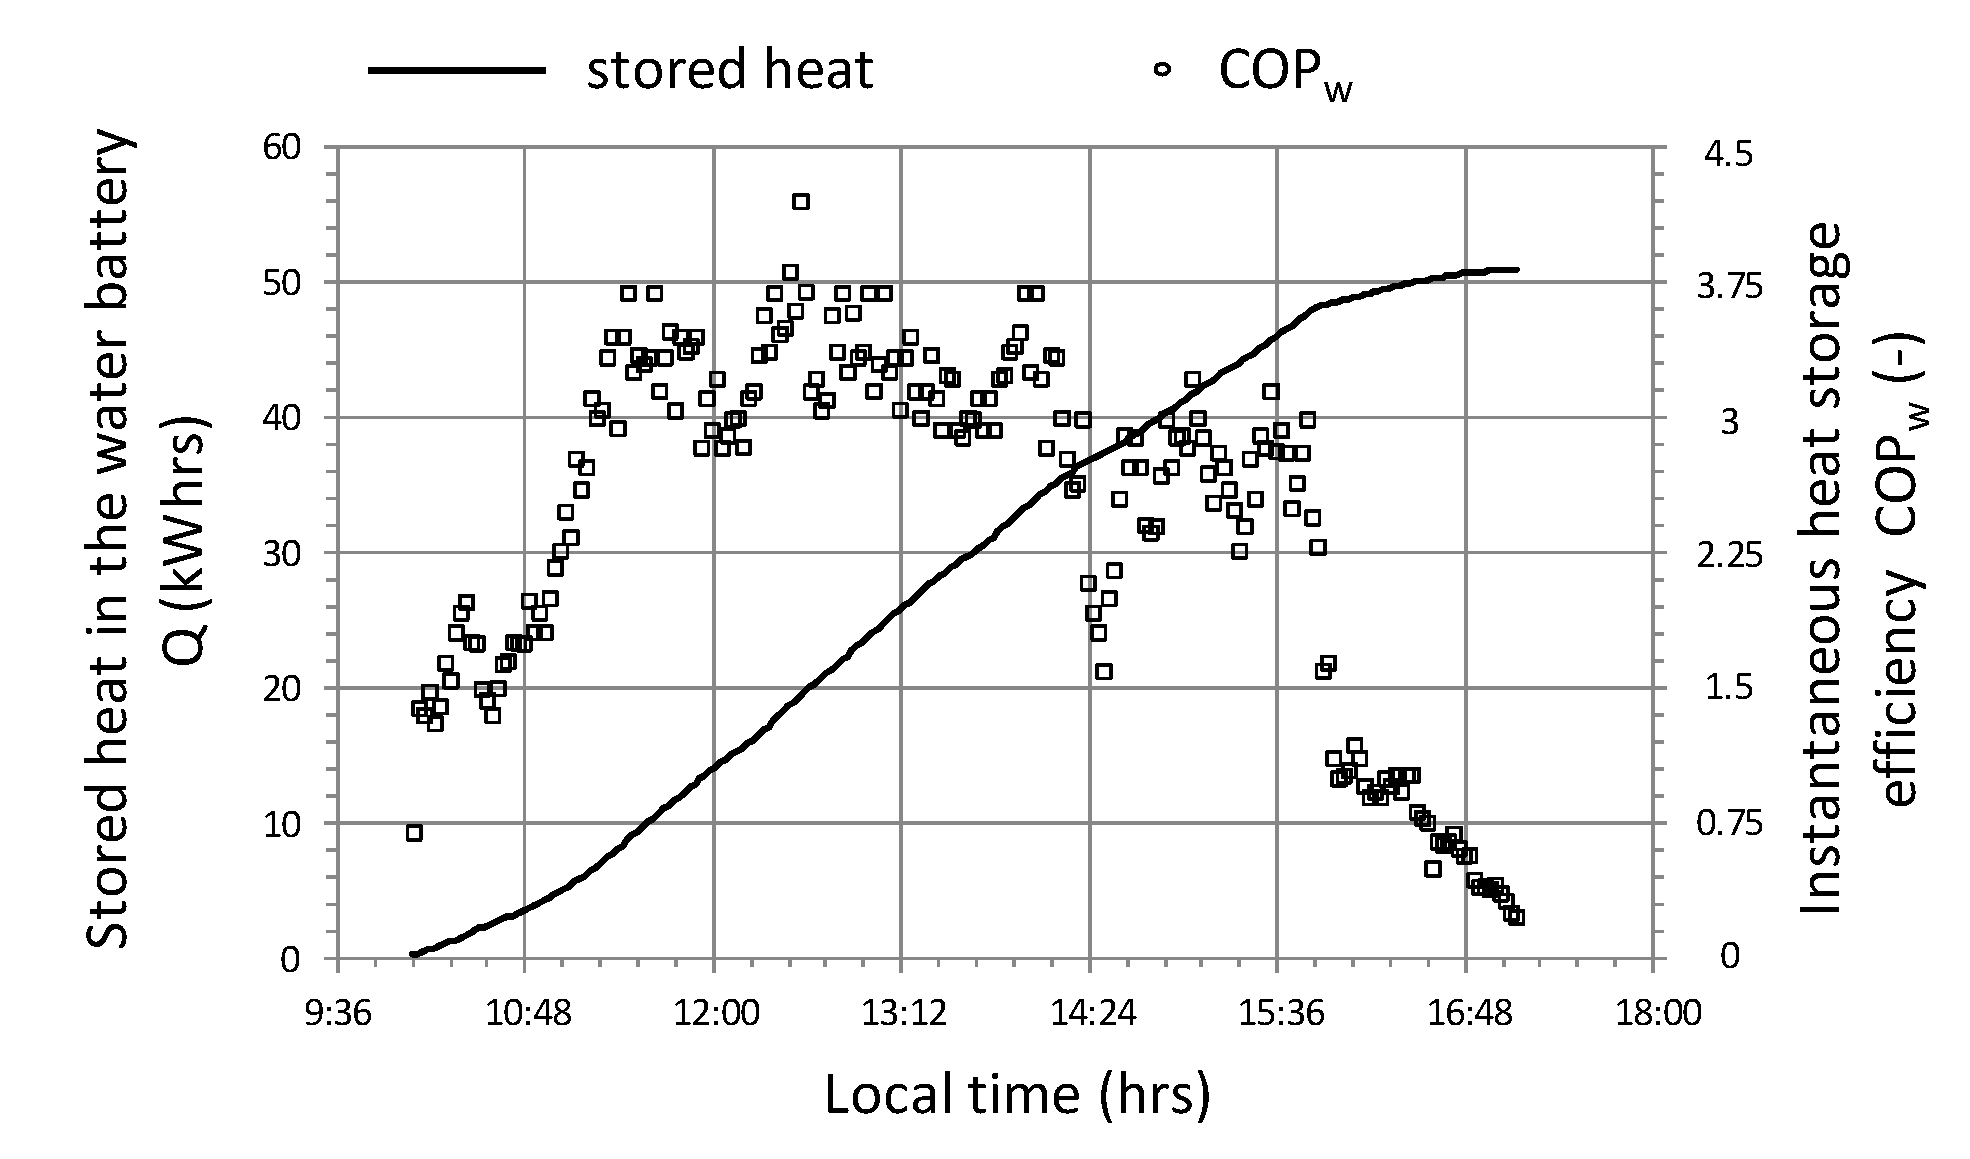
Attention should be paid to the course of the instantaneous energy efficiency coefficient (COP
w) shown in the graph (
Figure 19), which in this case is clearly correlated with the intensity of solar radiation R
out (
Figure 17). Based on the analysis of the presented cycle, it can be concluded that the system should not be turned on if the difference in temperature of air T
in_a inside the tunnel and water in the accumulator T
B is lower than 10 °C (
Figure 17 and
Figure 19), because energy efficiency COP
w in this range is less than 2. In addition, in this cycle, the maximum energy efficiency of the heat storage system was observed at 6 with a temperature difference (T
in_a − T
B) = 20 and solar radiation intensity R
out = 800 W/m
2.
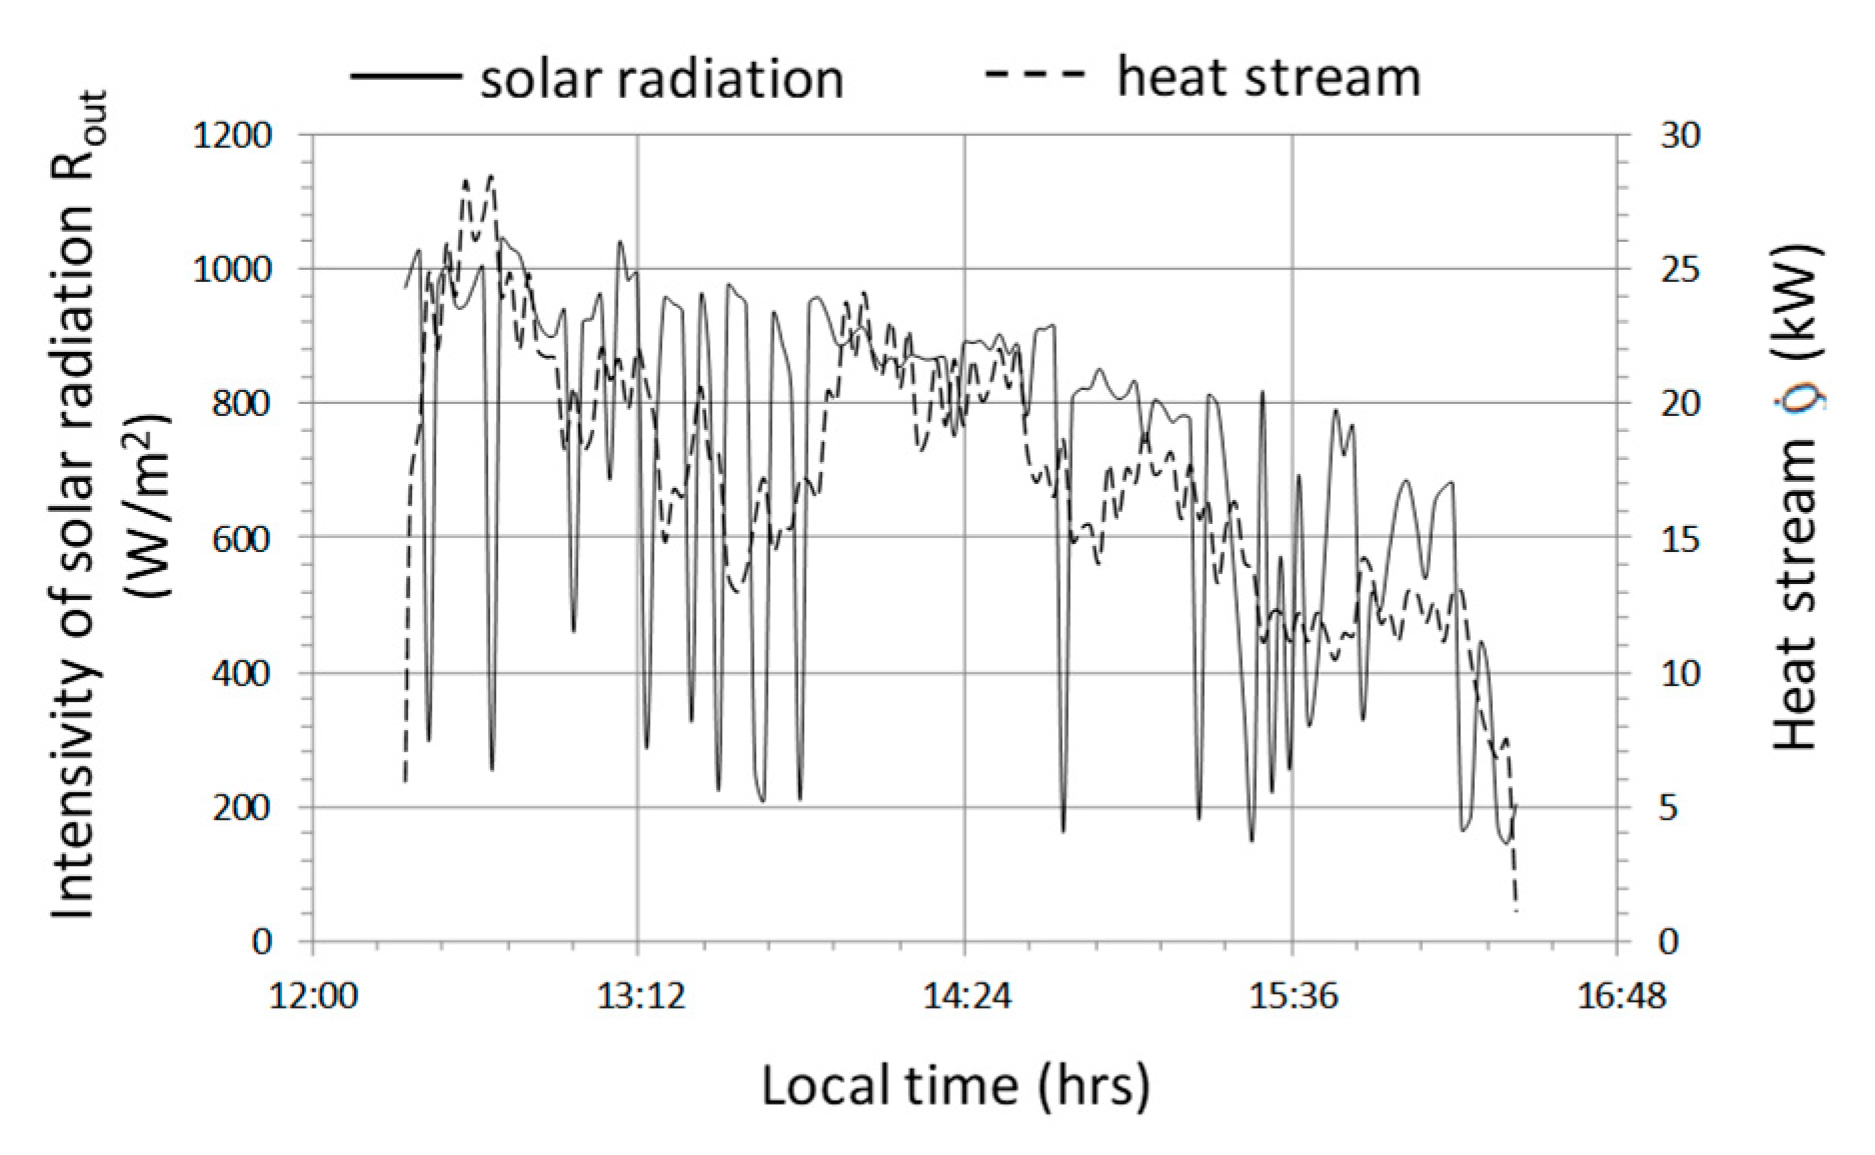
The next cycle selected for analysis (No. 2) was characterized by the following average values—R
out_a = 730 W/m
2, T
-in_aa = 35 °C, T
out_aa = 31.0 °C, T
B_a = 27.4 °C,
= 17 kW, COP = 5.96. The charts (
Figure 20,
Figure 21 and
Figure 22) present selected operating parameters of the examined system for a cycle that lasted over 4 hours and was two times shorter than cycle No. 1. In cycle No. 2, solar radiation reaching the tunnel was subject to quite rapid changes at relatively high maximum instantaneous values exceeding 1000 W/m
2. Temporary short-term cloud cover was present for no longer than a few minutes; however, it was characterized by a significant decrease in solar radiation to the value of 200 W/m
2 (
Figure 20). On the other hand, the course of the instantaneous heat flow
was subject to greater changes in the range of 27 to 10 kW, the effect of which can be noticed in the form of heat impact after switching on the system, which lasted about 15 min (
Figure 21) and resulted from the fact that the system was turned on after heating the tunnel additionally during the period of greatest radiation. The time course of the temperature in the water accumulator T
B and the temperature of the air leaving the exchanger T
out_a steadily increased with rapid changes in the inlet air temperature T
in_a (
Figure 21).
In the example of temperature courses, one can notice the positive effect of a significant heat capacity of the heat exchanger, which, among others permits operating continuity with rapid changes in solar radiation. The effects of heat shock as well as the high heat capacity of the air-water heat exchanger system are clearly marked on the course of the instantaneous energy efficiency (
Figure 22), where values reach the dynamic maximum at level 9 and decrease quite quickly with quite considerable scatter. The graph (
Figure 21) shows premature shutdown due to the fact that the inlet temperature T
in_a is lower than the temperature of the air outlet T
out_a from the heat exchanger, despite the fact that the system works with an efficiency of over 2.
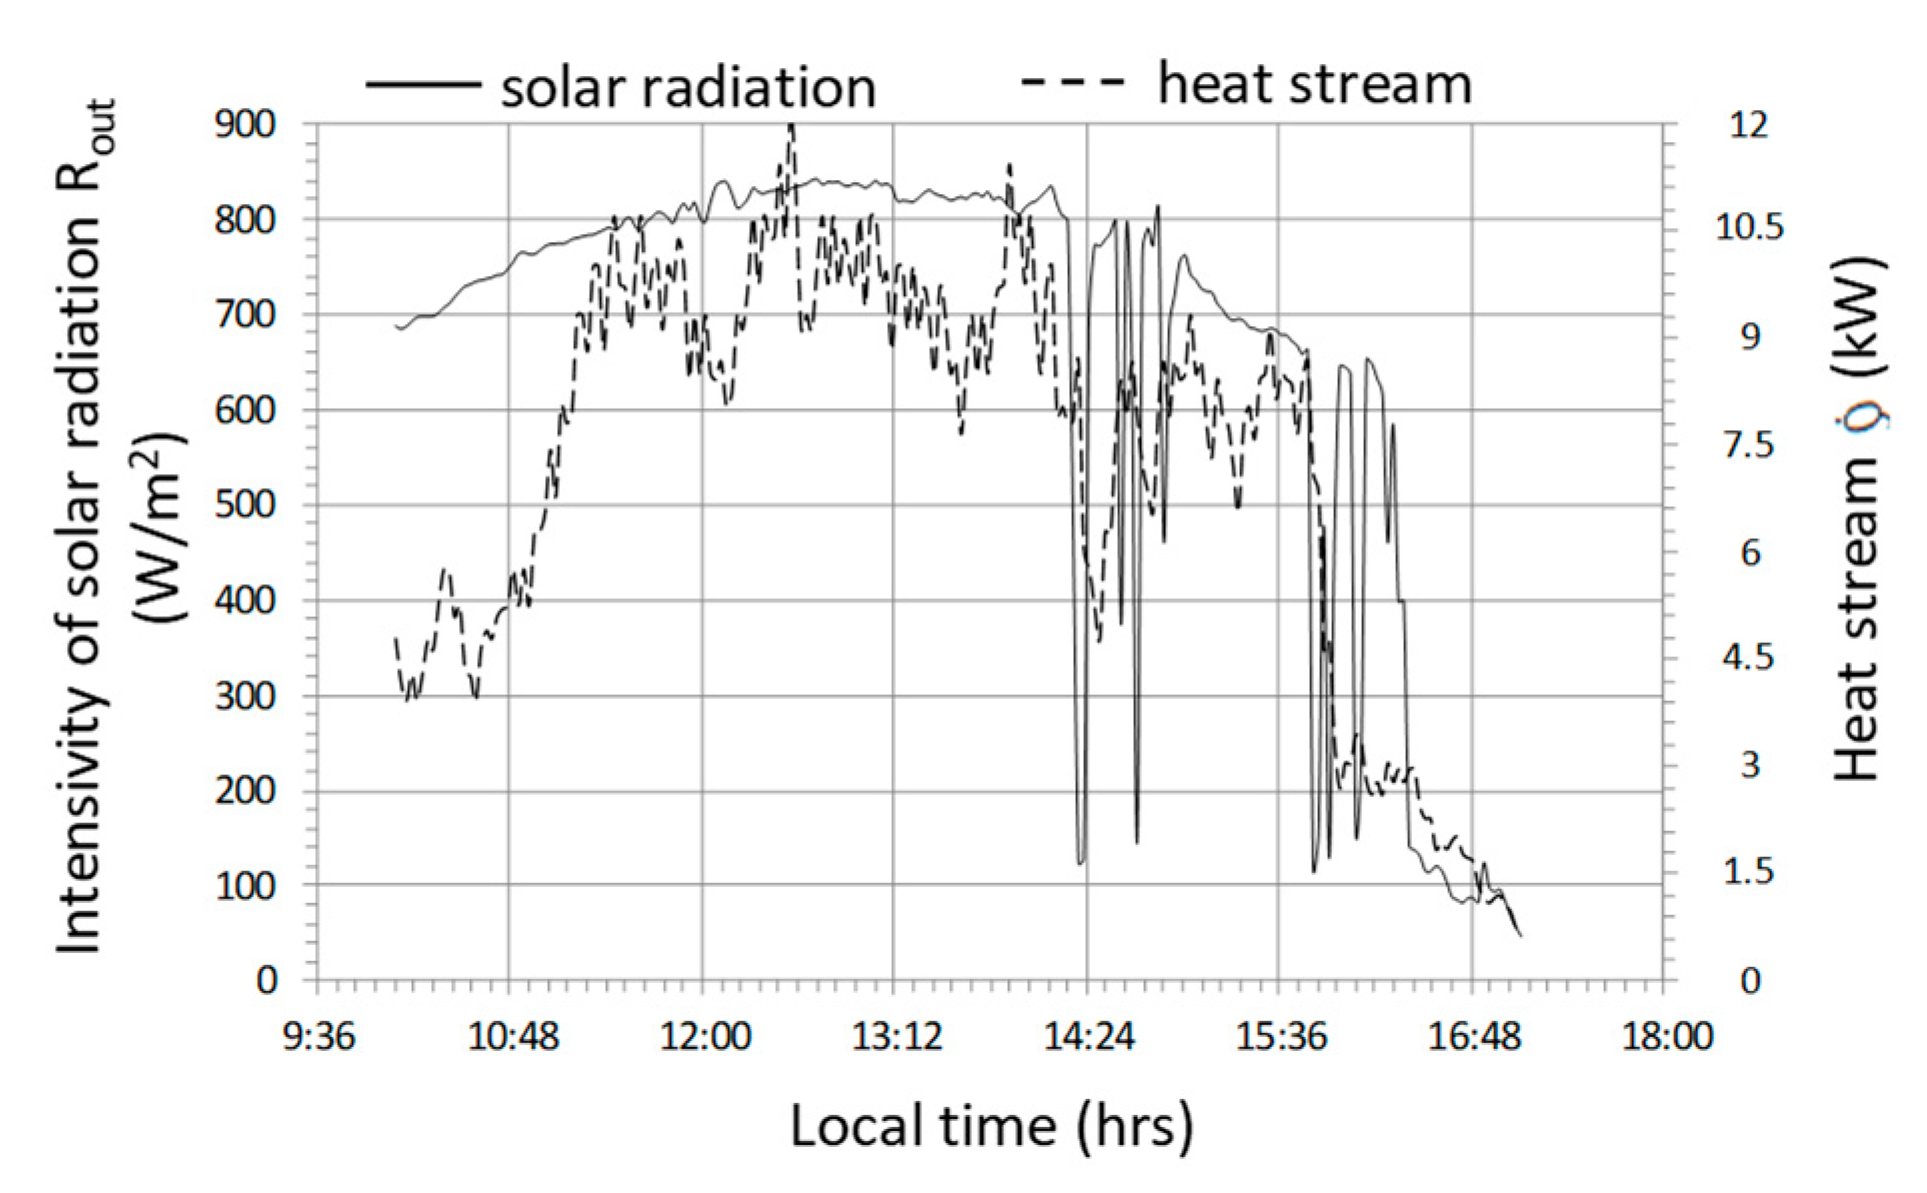
The last cycle selected for detailed analysis as part of the case study is the cycle marked No. 3 (
Figure 23,
Figure 24 and
Figure 25) which is characterized by the following average values of selected parameters—R
out_a = 660 W/m
2, T
in_aa = 43.7 °C, T
out_aa = 36.4 °C, T
B_a = 27.4 °C,
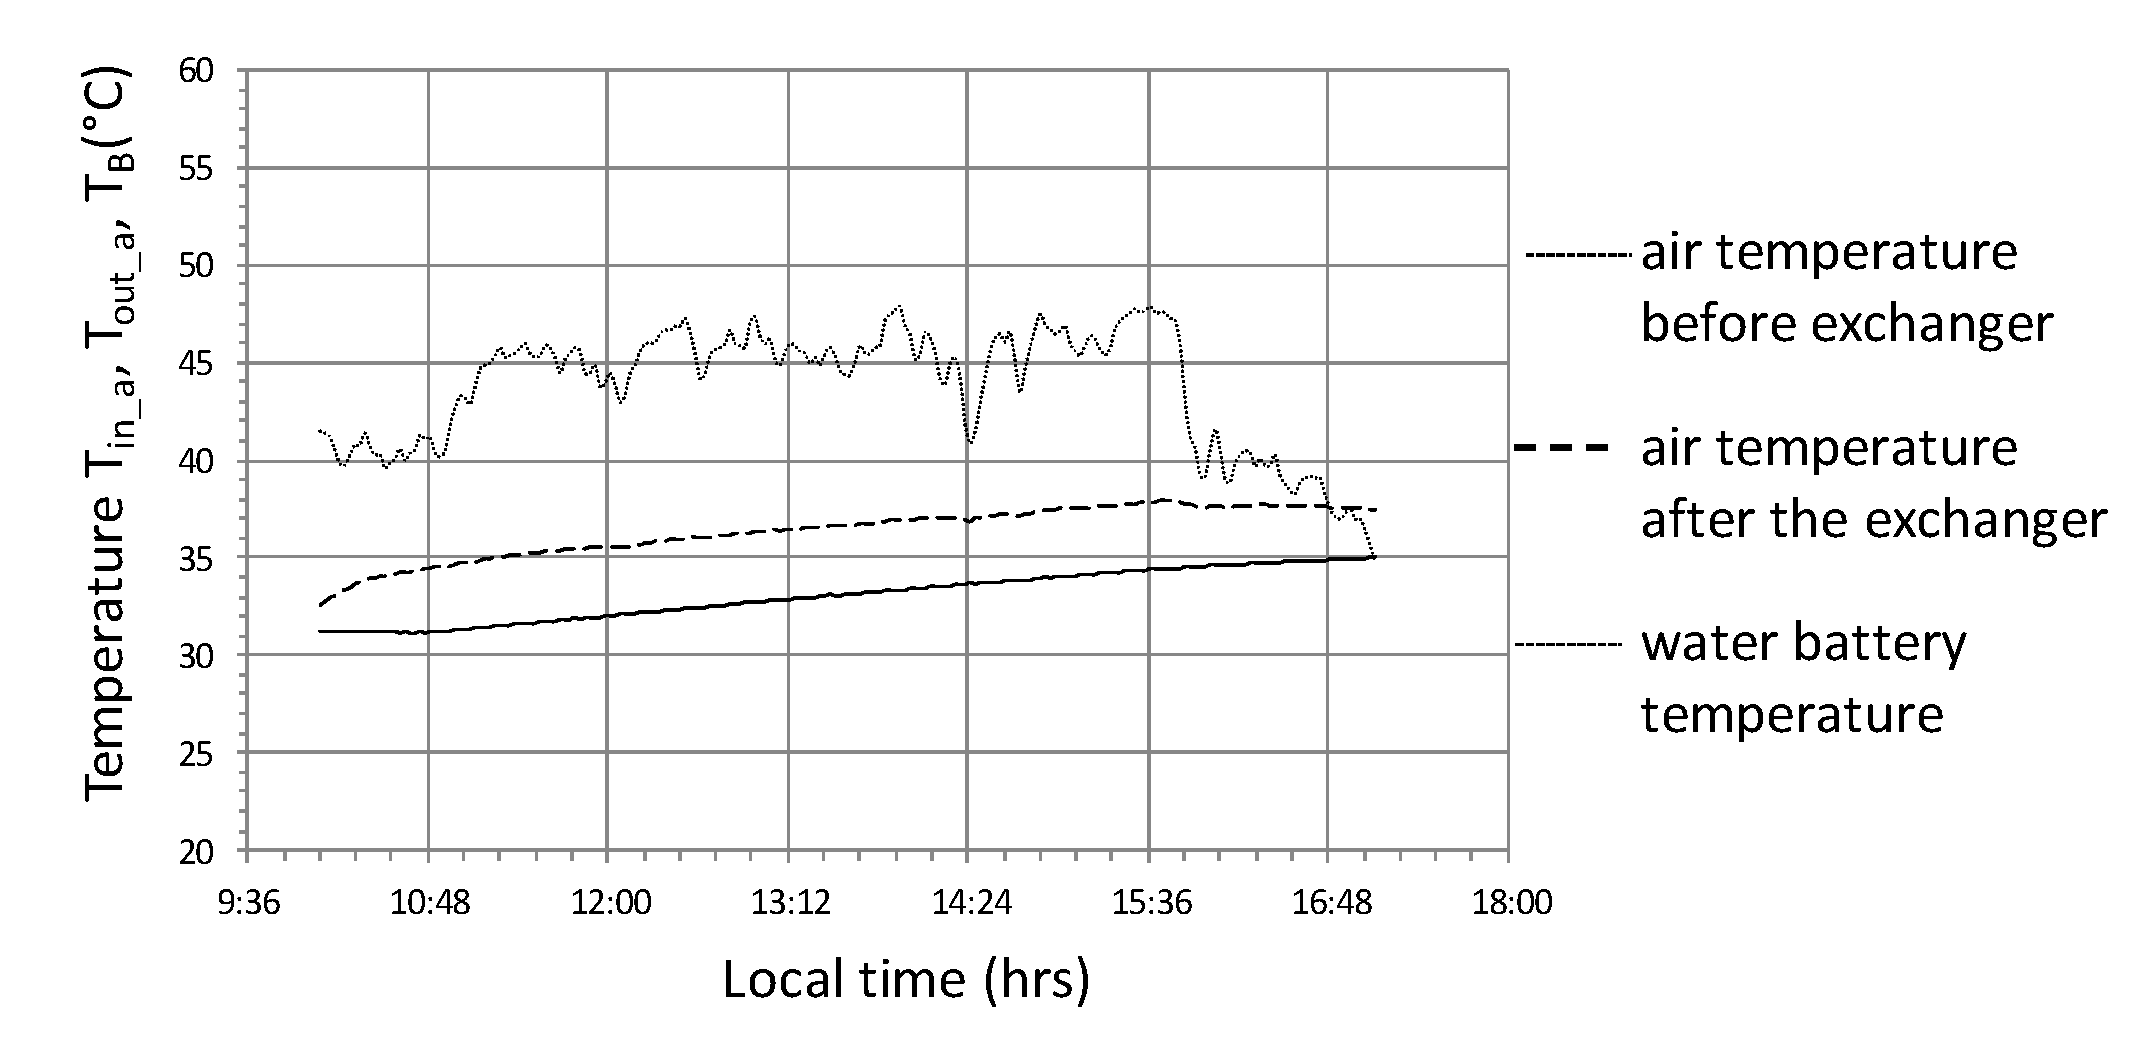
= 7.2 kW, COP = 2.74. The analyzed cycle No. 3 was selected because of the low energy efficiency with relatively high operating parameters and duration comparable to cycle No. 1 but with a shift of three hours towards the later daytime interval.
During changes in solar radiation (
Figure 23) quite rapid changes of heat flux occur, with a significant reduction in value from 10.5 to 1.5 kW. The system became more sensitive, which was affected by the limited effects of heat capacity. The result of a significant reduction in the thermal efficiency of the system is the relatively high temperature of the water accumulator T
B, which in this cycle varies between 31.5 ÷ 35 °C (
Figure 24). High accumulator temperature also induces high temperatures of other parameters T
in_a i T
out_a with low differences in these temperatures, for example, T
out_a—T
B is the lowest of the analyzed cycles and does not exceed 3.5 °C. Although the temperature 45 °C at the fan inlet is the highest of the cycles observed, the thermal efficiency
remains unaffected as there is no condensation effect of the water vapor in the air flowing through the air-water exchanger. Relatively smaller temperature differences, in particular T
out_a—T
B and a reduction of the condensation effect, contribute to the fact that the highest observed COP
w does not exceed the value of 3.5 (
Figure 25) and at lower solar radiation intensities they fall below the value of 1, which means that the heat storage process is completely impractical.
The presented analysis shows that the work of the experimental greenhouse heat storage system is effective provided that a complex control system is used that could analyze not only the temperature difference, for example, Tin_a—TB but also the heat flux transferred to the accumulator.
Another aspect highlighted by the research was the calculation of the COP coefficient for the entire system work cycle, that is, from activation to shutdown. 62 work cycles were analyzed and were presented in energy efficiency charts depending on the solar energy R
out_a flux (
Figure 26) and the temperature difference T
in_aa−T
B_a (
Figure 27). From the presented graphical relationship (
Figure 26) one can notice a visible relationship between the COP coefficient and the solar radiation flux, however the developed model is poorly fitted. The impact of temperature difference T
in_aa−T
B_a on the energy efficiency of the heat storage system is much stronger. The developed exponential model explains the phenomenon satisfactorily, which is confirmed by the R
2 = 0.74.
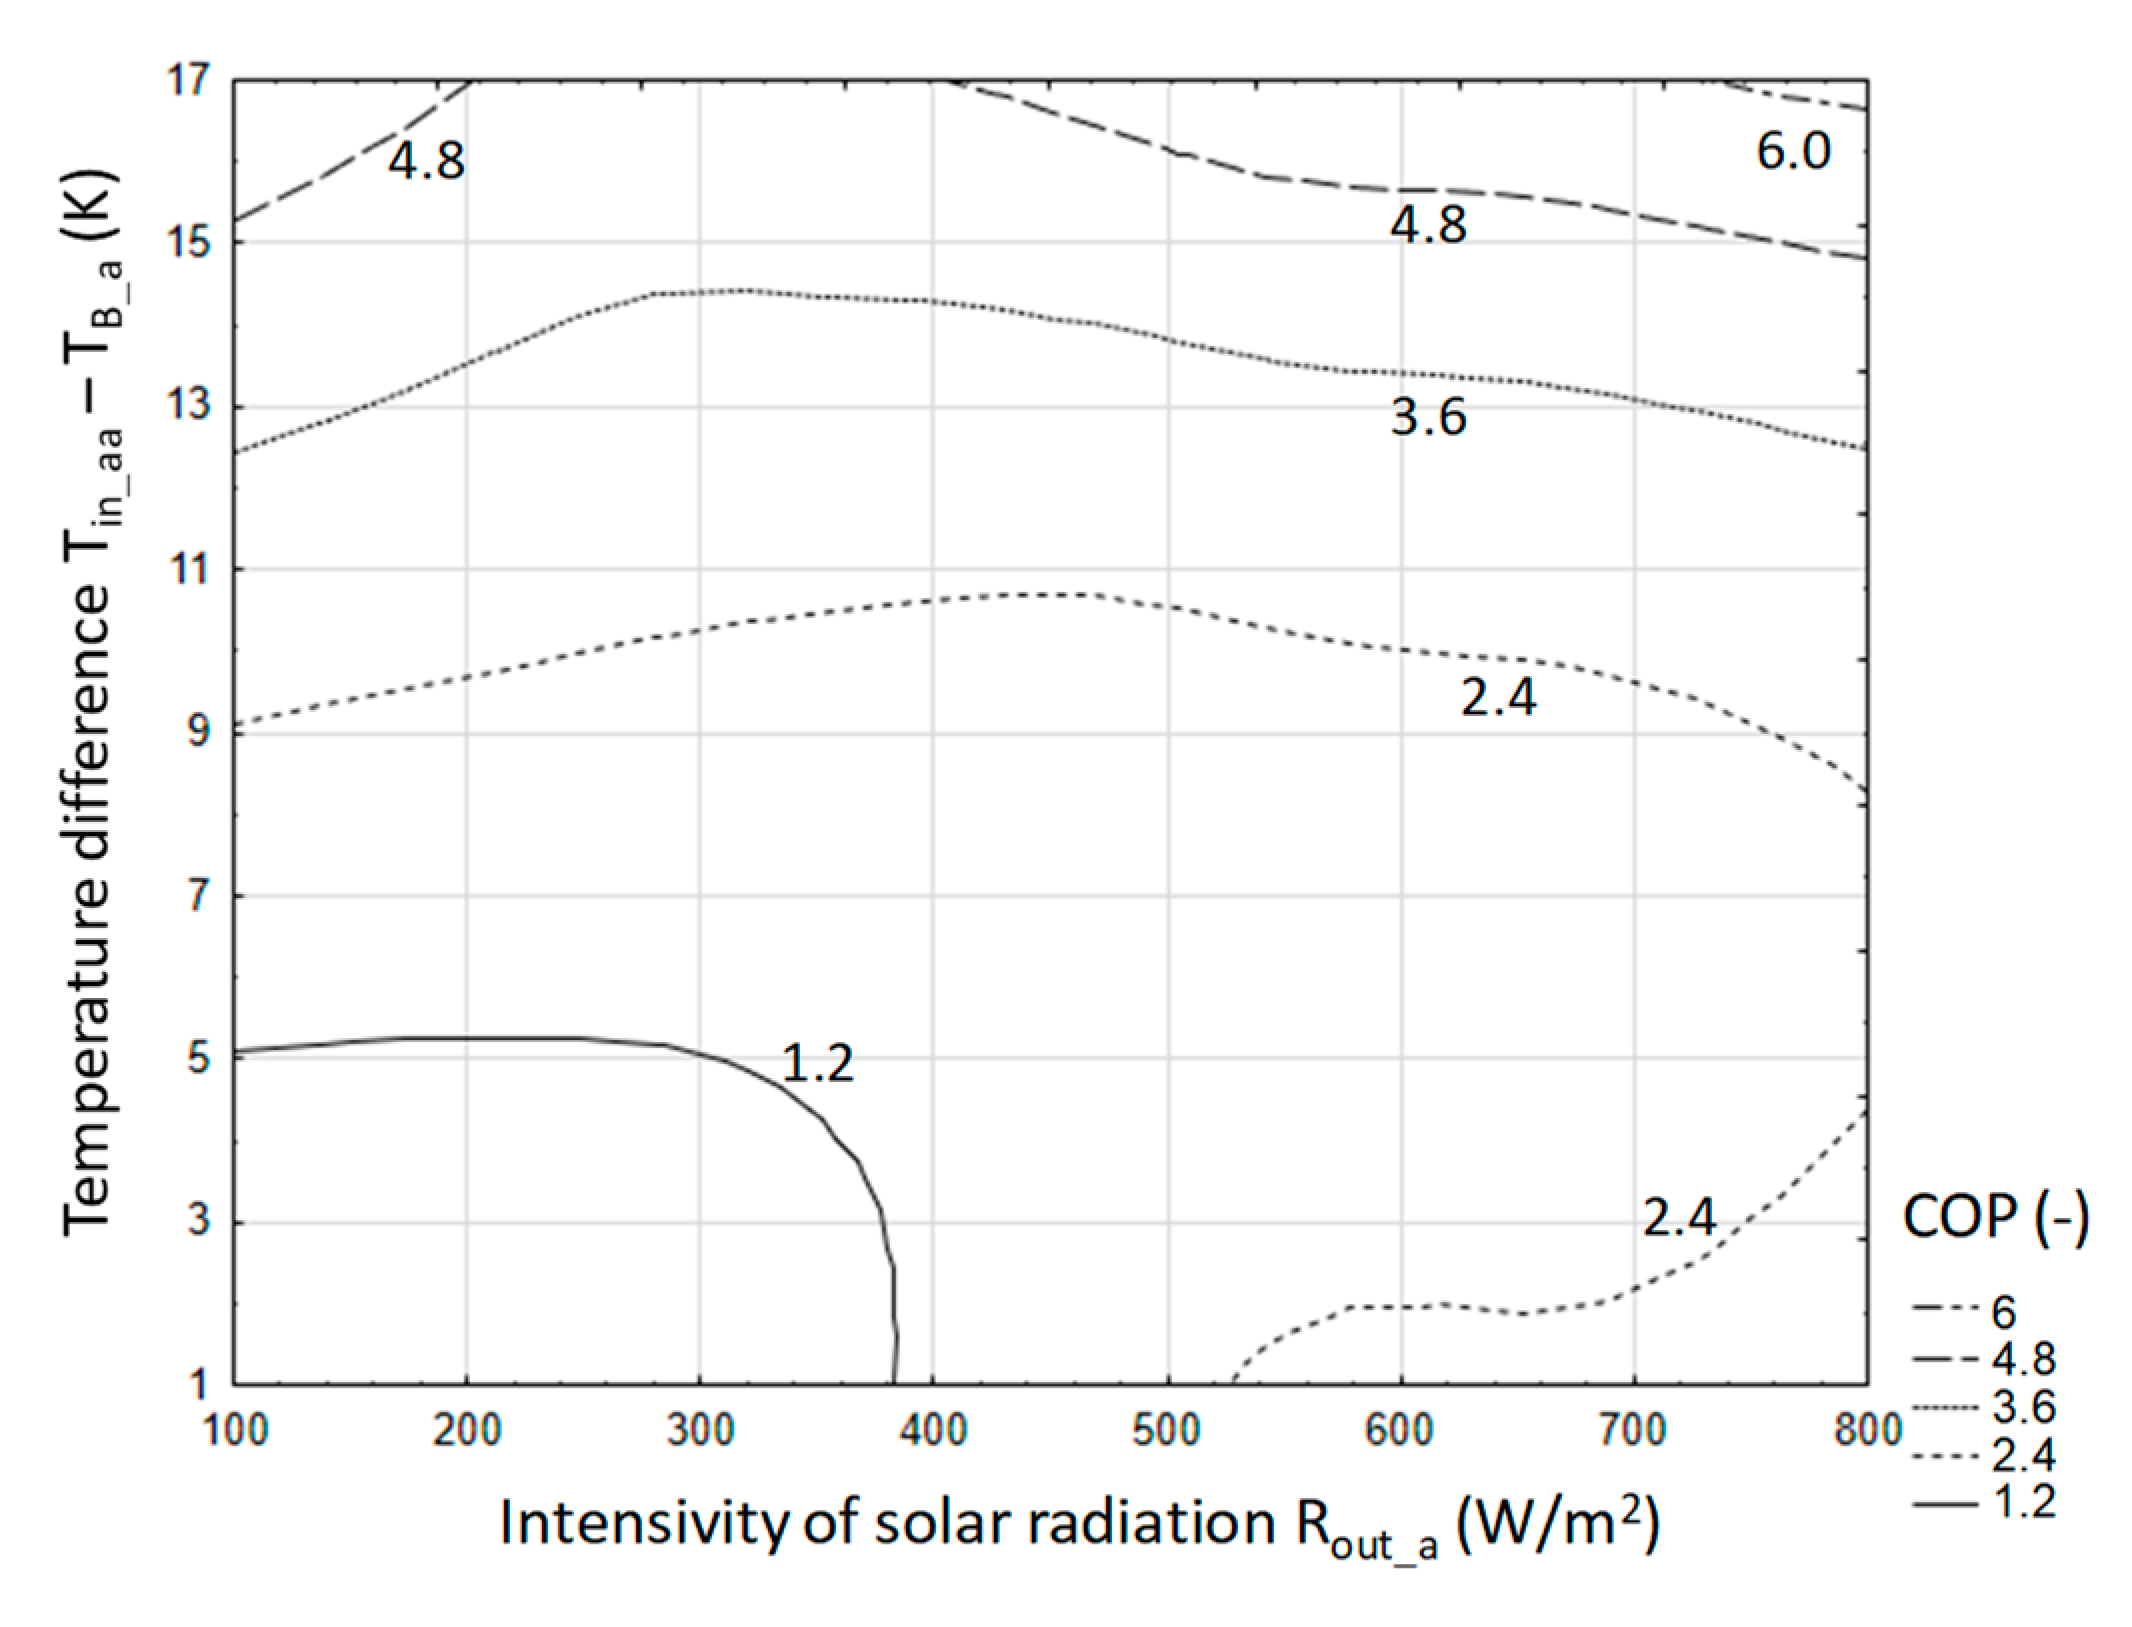
In order to develop the relationship that best describes the phenomenon, estimation of multiple non-linear regression was performed. The developed model was presented an Equation (17) and its graphical interpretation in a contour plot (
Figure 28).
where
Tin_aa—air temperature at the exchanger inlet (°C);
TB_a—water accumulator temperature (°C);
Rout_a—intensity of solar radiation (W/m²).
For the developed model, the calculated error σ is at the level of 0.11.
Assuming that the COP of the storage process cannot be less than 1, then the relationship takes the form:
Inequality is always met if
Tin_aa>
TB_a. However, assuming that the COP will be at a level greater than 3, which is dictated by the efficiency of the national power system, the relationship (18) can be reduced to the form (19):
If we use the approximation 0.341 ≅ 1/3 is used, then the relationship (19) can be reduced to the form (20):
After parameterization of the relationship (19), it was established that the minimum difference Tin_aa − TB_a should be greater than 11 °C, in order to achieve the assumed efficiency (COP = 3) with solar radiation 1000 W/m². It should be noted that the relationship (20) can be used to determine the boundary parameters of the heat accumulation system in a water accumulator for specific production and construction of a greenhouse or foil tunnel.
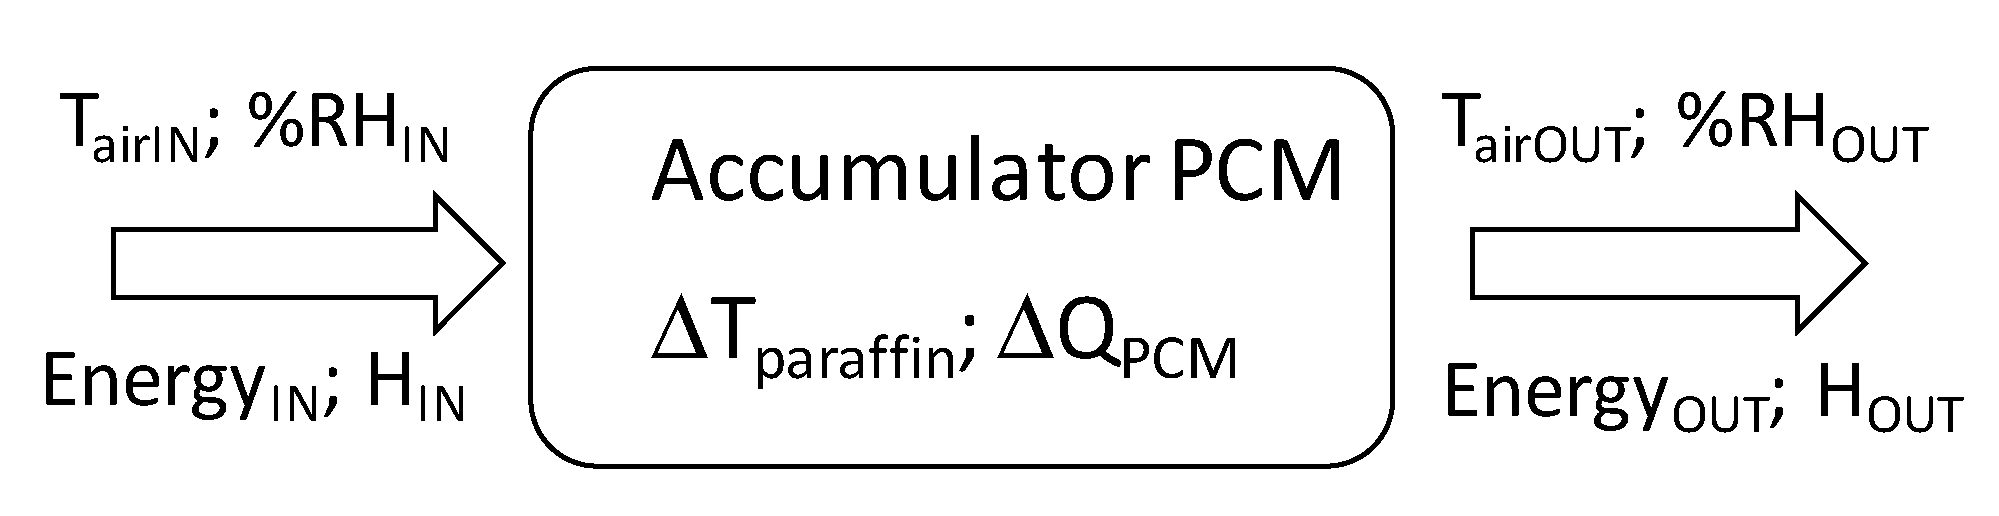
3.3. PCM Accumulator
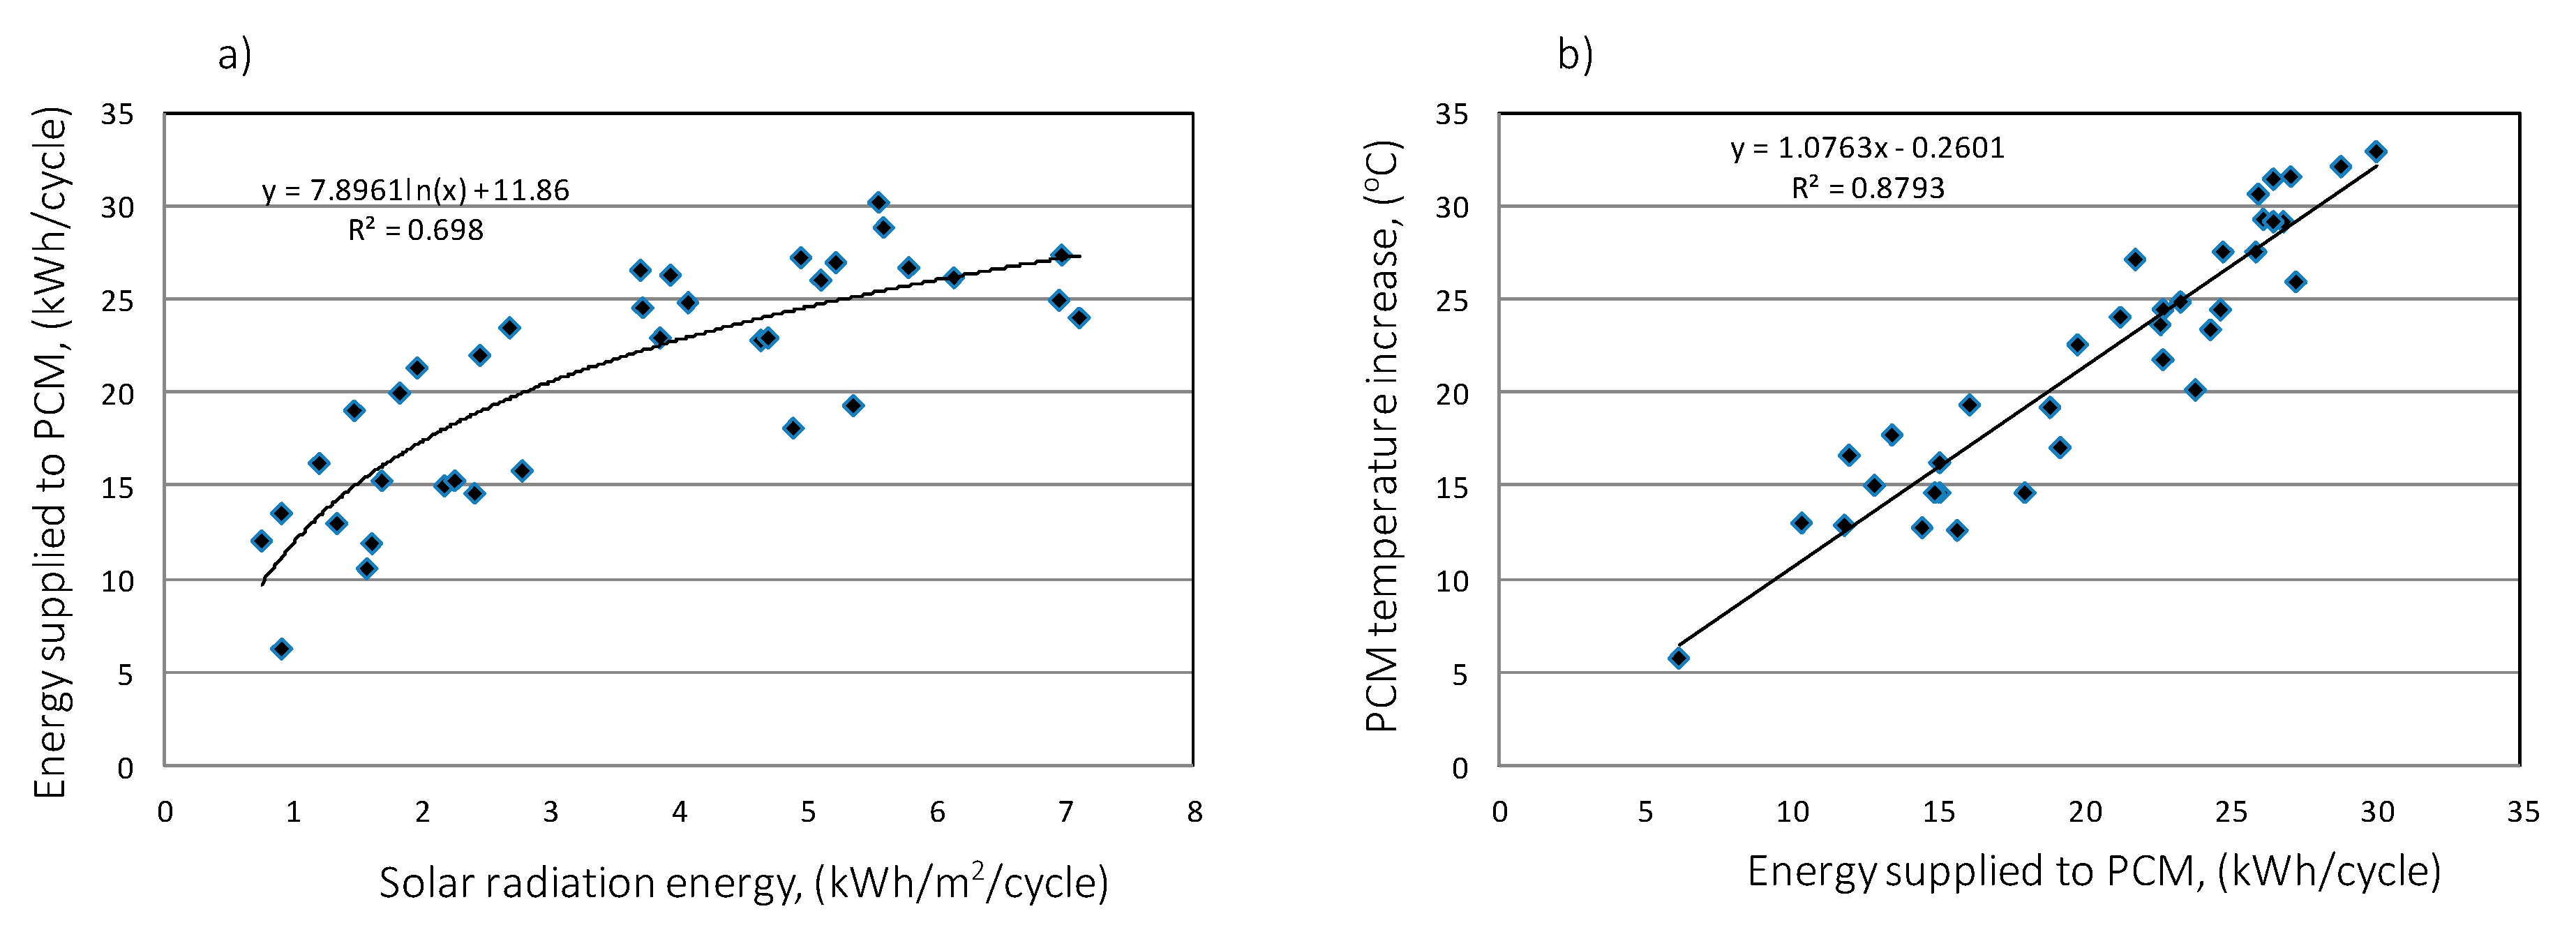
The analysis shows a clear correlation between the charging time and the amount of heat stored in the accumulator bed (
Figure 29a). However, by analyzing the individual accumulator charging cycles in detail, some of them indicate that the energy accumulated in paraffin can be twice as high despite the same cycle time, which is the result of different levels of solar radiation intensity and the ability to collect heat through the accumulator bed.
In the process of accumulator discharging, the amount of heat received depends on the difference in enthalpy of inlet and outgoing air from the accumulator (
Figure 29b). There is a strong relationship between the energy input and output of the accumulator (correlation coefficient 0.93).
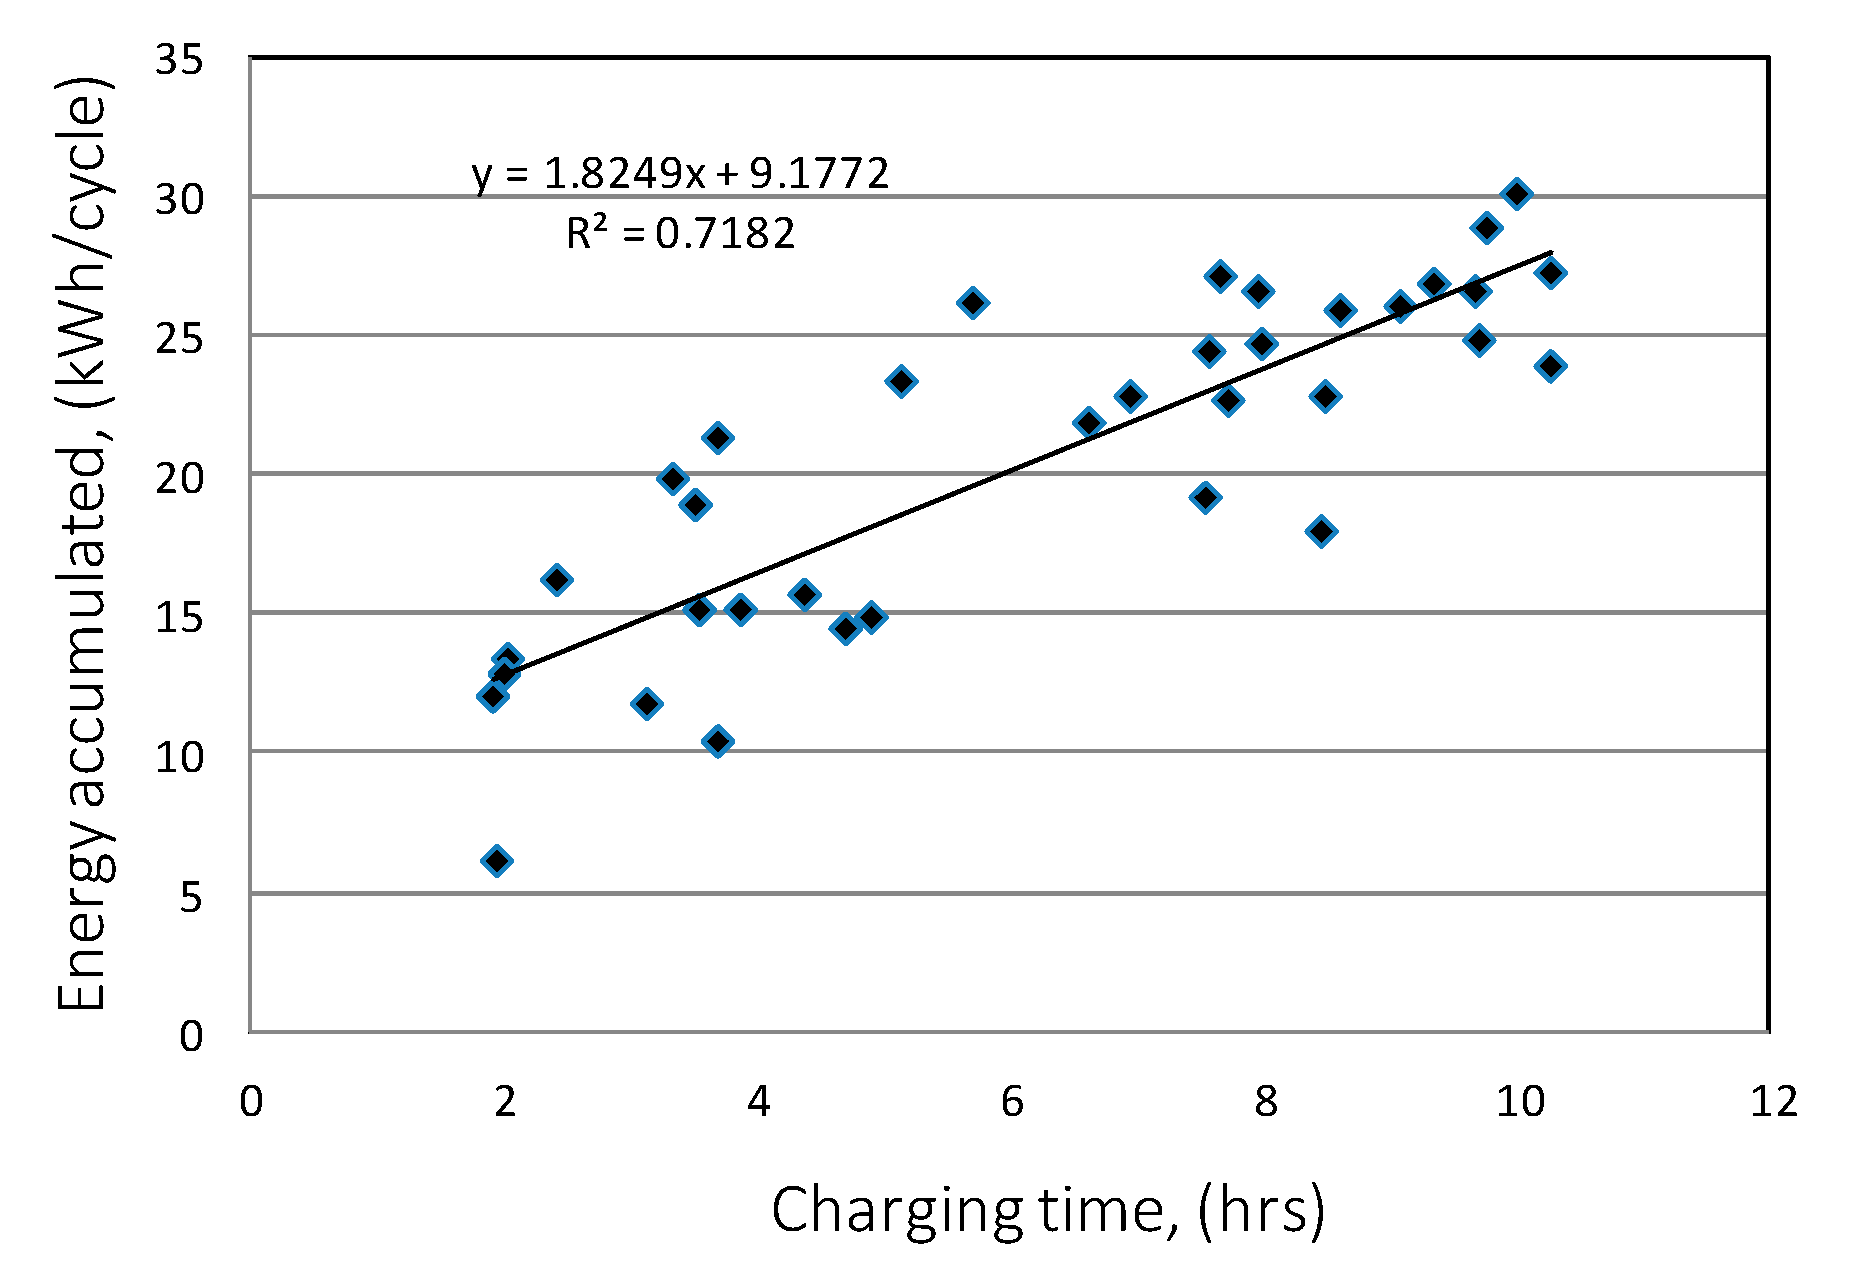
When analyzing the available amount of usable energy from the accumulator in its discharge cycle, it was found that the amount of this energy increases with the duration of the cycle. The graph in
Figure 30 shows the relationship of these parameters. The correlation coefficient was 0.74.
Generally, a greater amount of usable energy available in a paraffin-filled accumulator occurs in the range of higher operating efficiency (
Figure 31). However, there is no clear relationship between these parameters. This means that for a certain amount of available heat, the accumulator can work with varying degrees of efficiency.
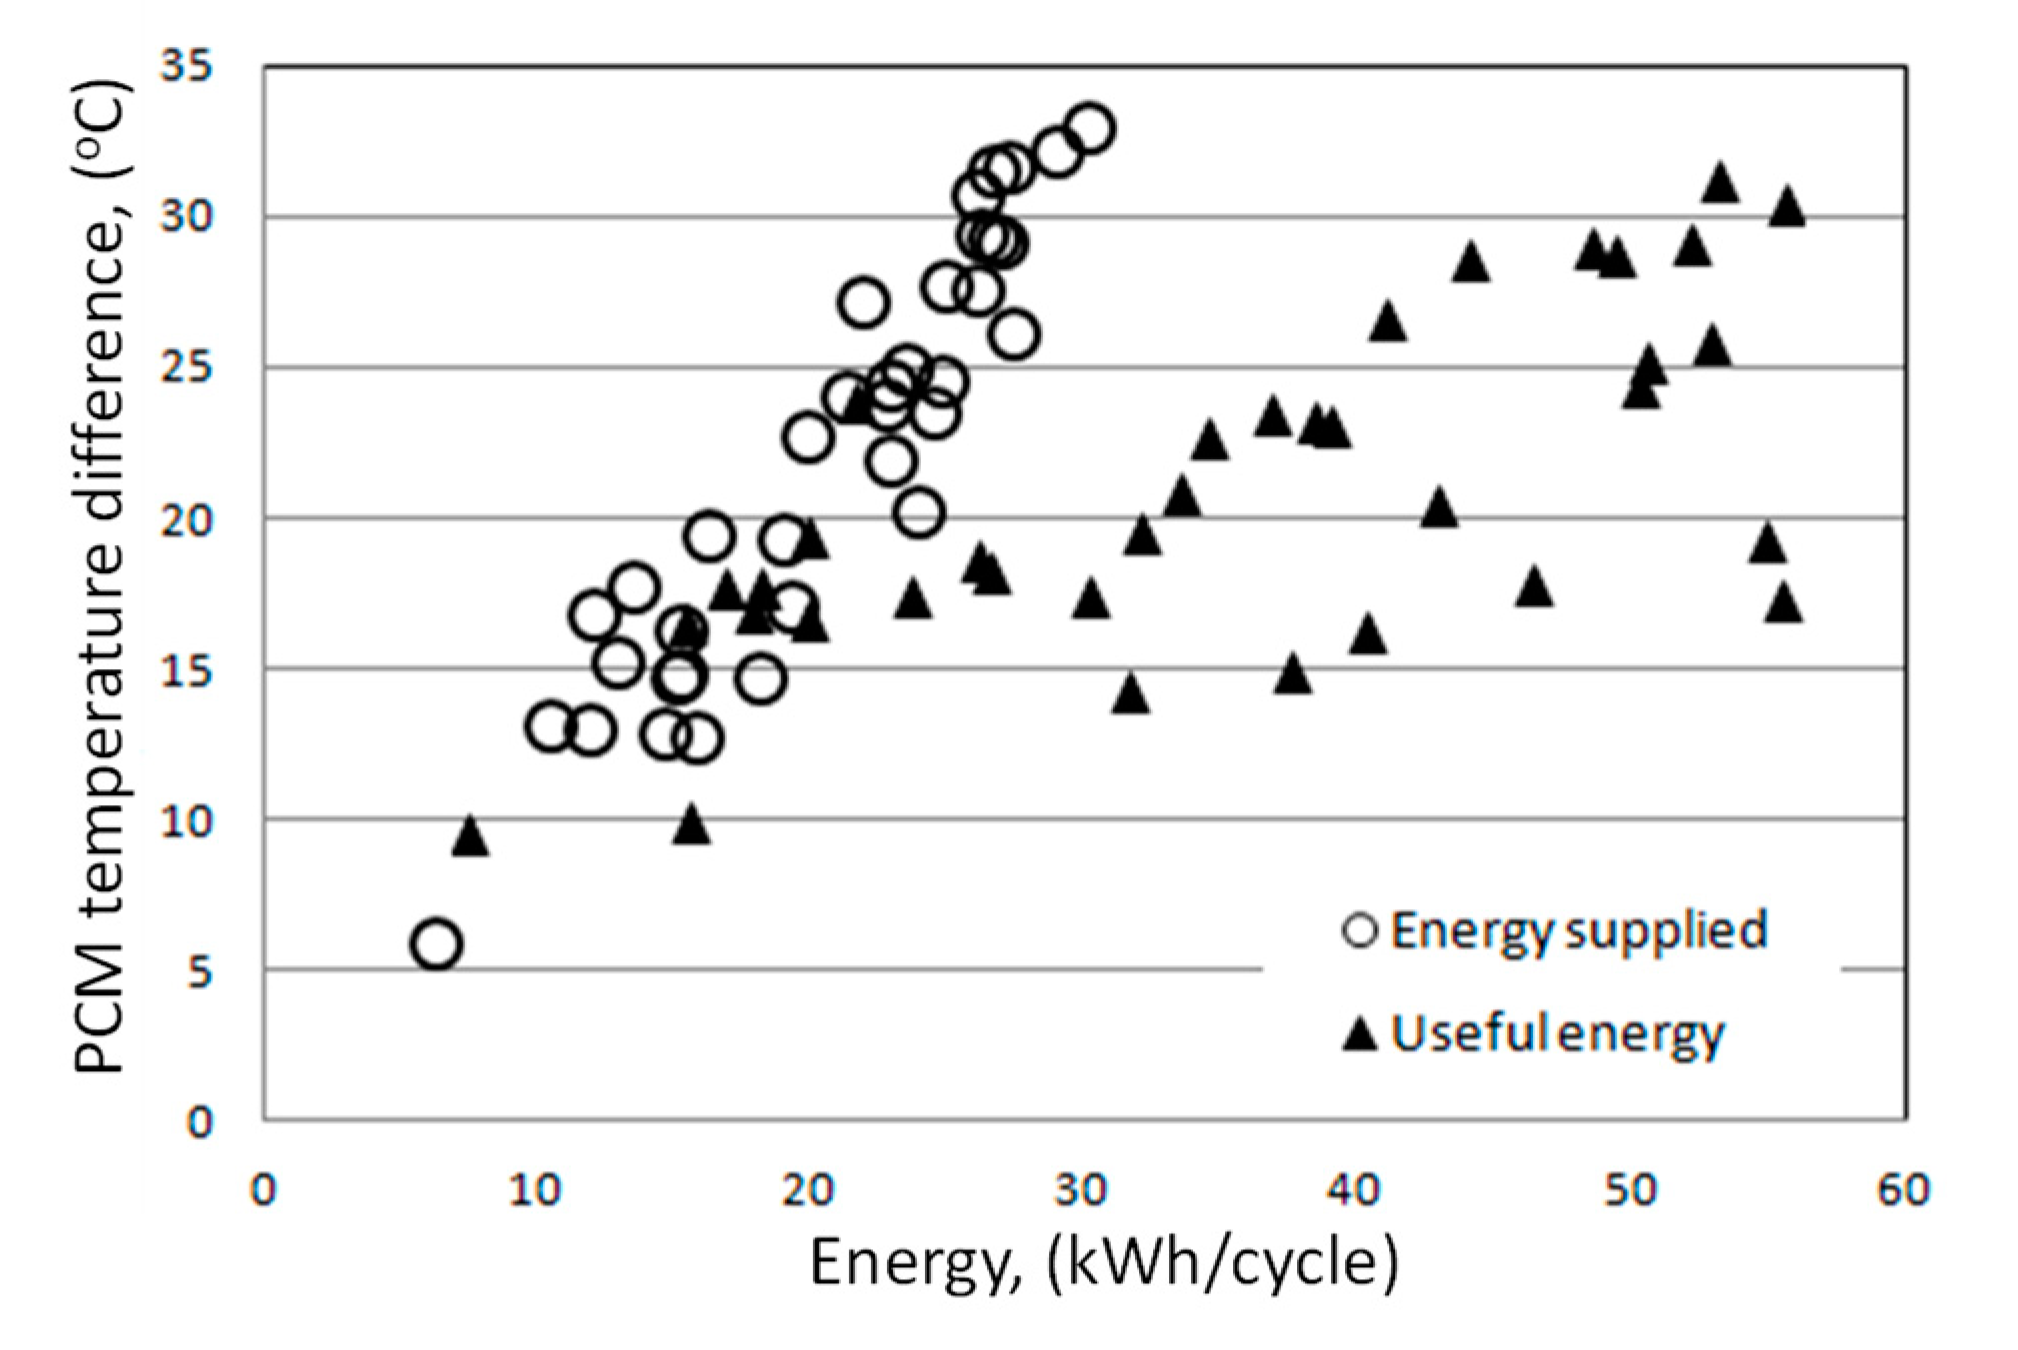
The analysis of the impact of supplied and usable energy on changes in the paraffin temperature in the accumulator bed shows that the energy supplied in the charging process gives a higher increase in bed temperature (
Figure 32). This is the result of a larger temperature difference between warm air and paraffin. In addition, when using the difference in paraffin temperature, the range of temperature changes in the bed should be taken into account. This applies in particular to the use of such heat storage due to specific heat and/or specific heat and latent heat of the paraffin phase change.
This is clearly seen in the discharge process, where for a similar difference in paraffin temperature the useful energy can be up to three times higher.
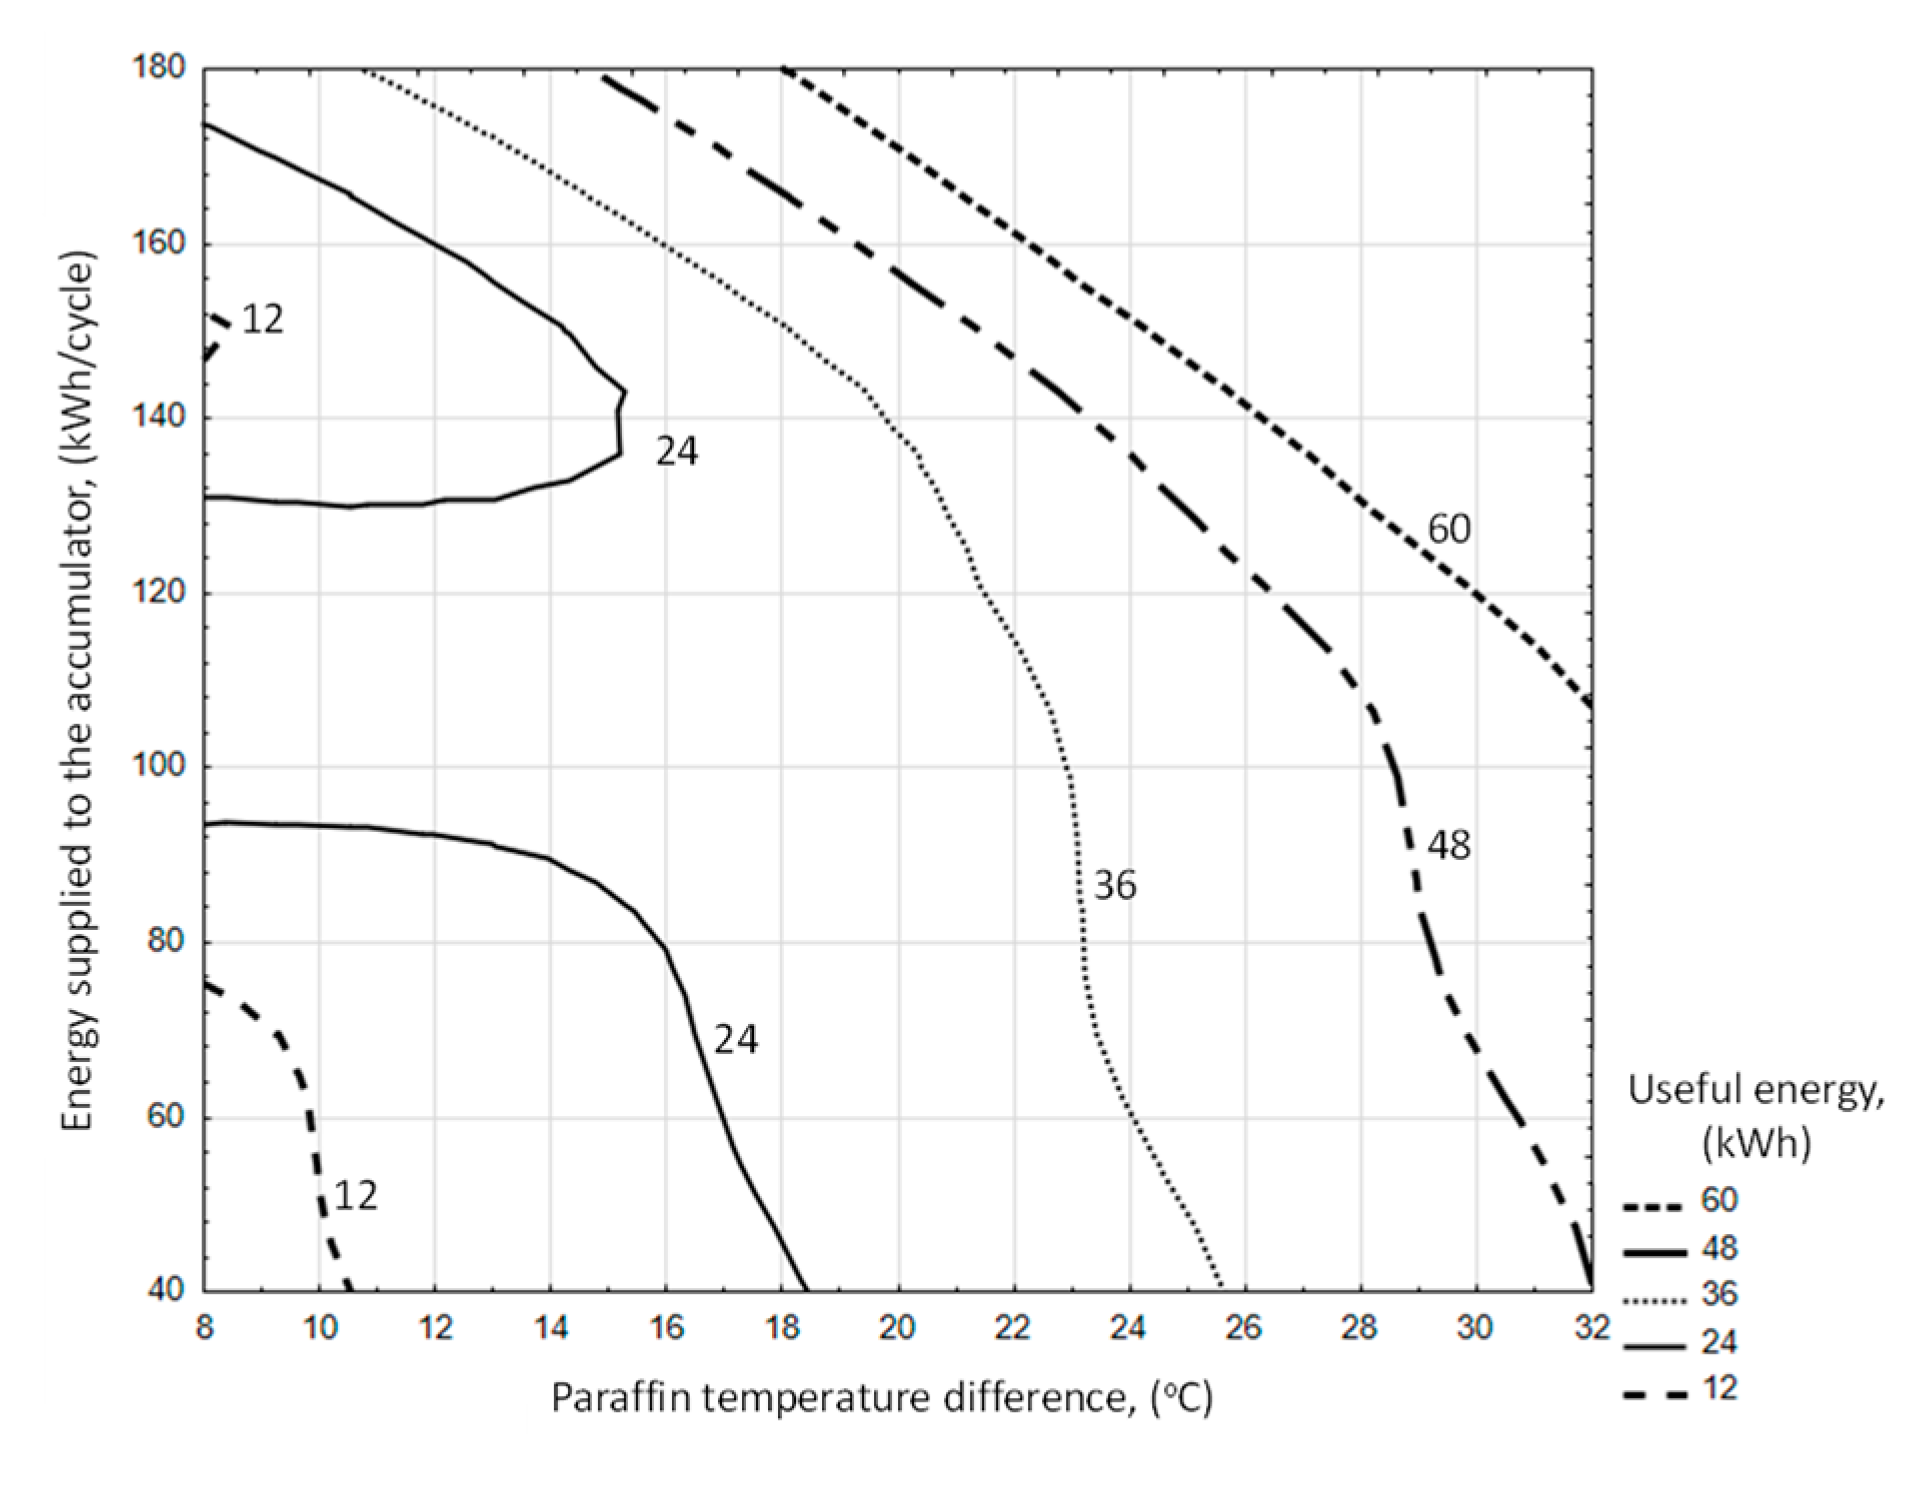
The amount of usable energy available from an accumulator filled with paraffin (
Figure 33) generally increases as a direct result of energy supplied for accumulation along with an increase in the temperature difference of the accumulator bed. Only in the range of low differences in paraffin temperature (from 8 to 16 °C) a different trend was observed. The equation determining the available useful energy (
QE) in the PCM accumulator cycle was determined as a function of the energy supplied to the accumulator and the increase in paraffin temperature, using a linear estimation with the quasi-Newton method. The significance of the parameters was set at a level less than 0.05.
Useful heat from the accumulator (kWh/cycle):
for the ranges of input variables:
The amount of usable energy available from a battery filled with paraffin (
Figure 34) increases with increasing battery efficiency and with increasing temperature difference of the battery bed. The equation used to ascertain the available useful energy in the PCM accumulator cycle was determined as a function of accumulator efficiency (
Eff) and paraffin temperature increase (Δ
tparaffin), using a linear estimation with the quasi-Newton method. The significance of the parameters was set at a level less than 0.05.
Useful heat from the accumulator (kWh/cycle):
for the ranges of input variables:
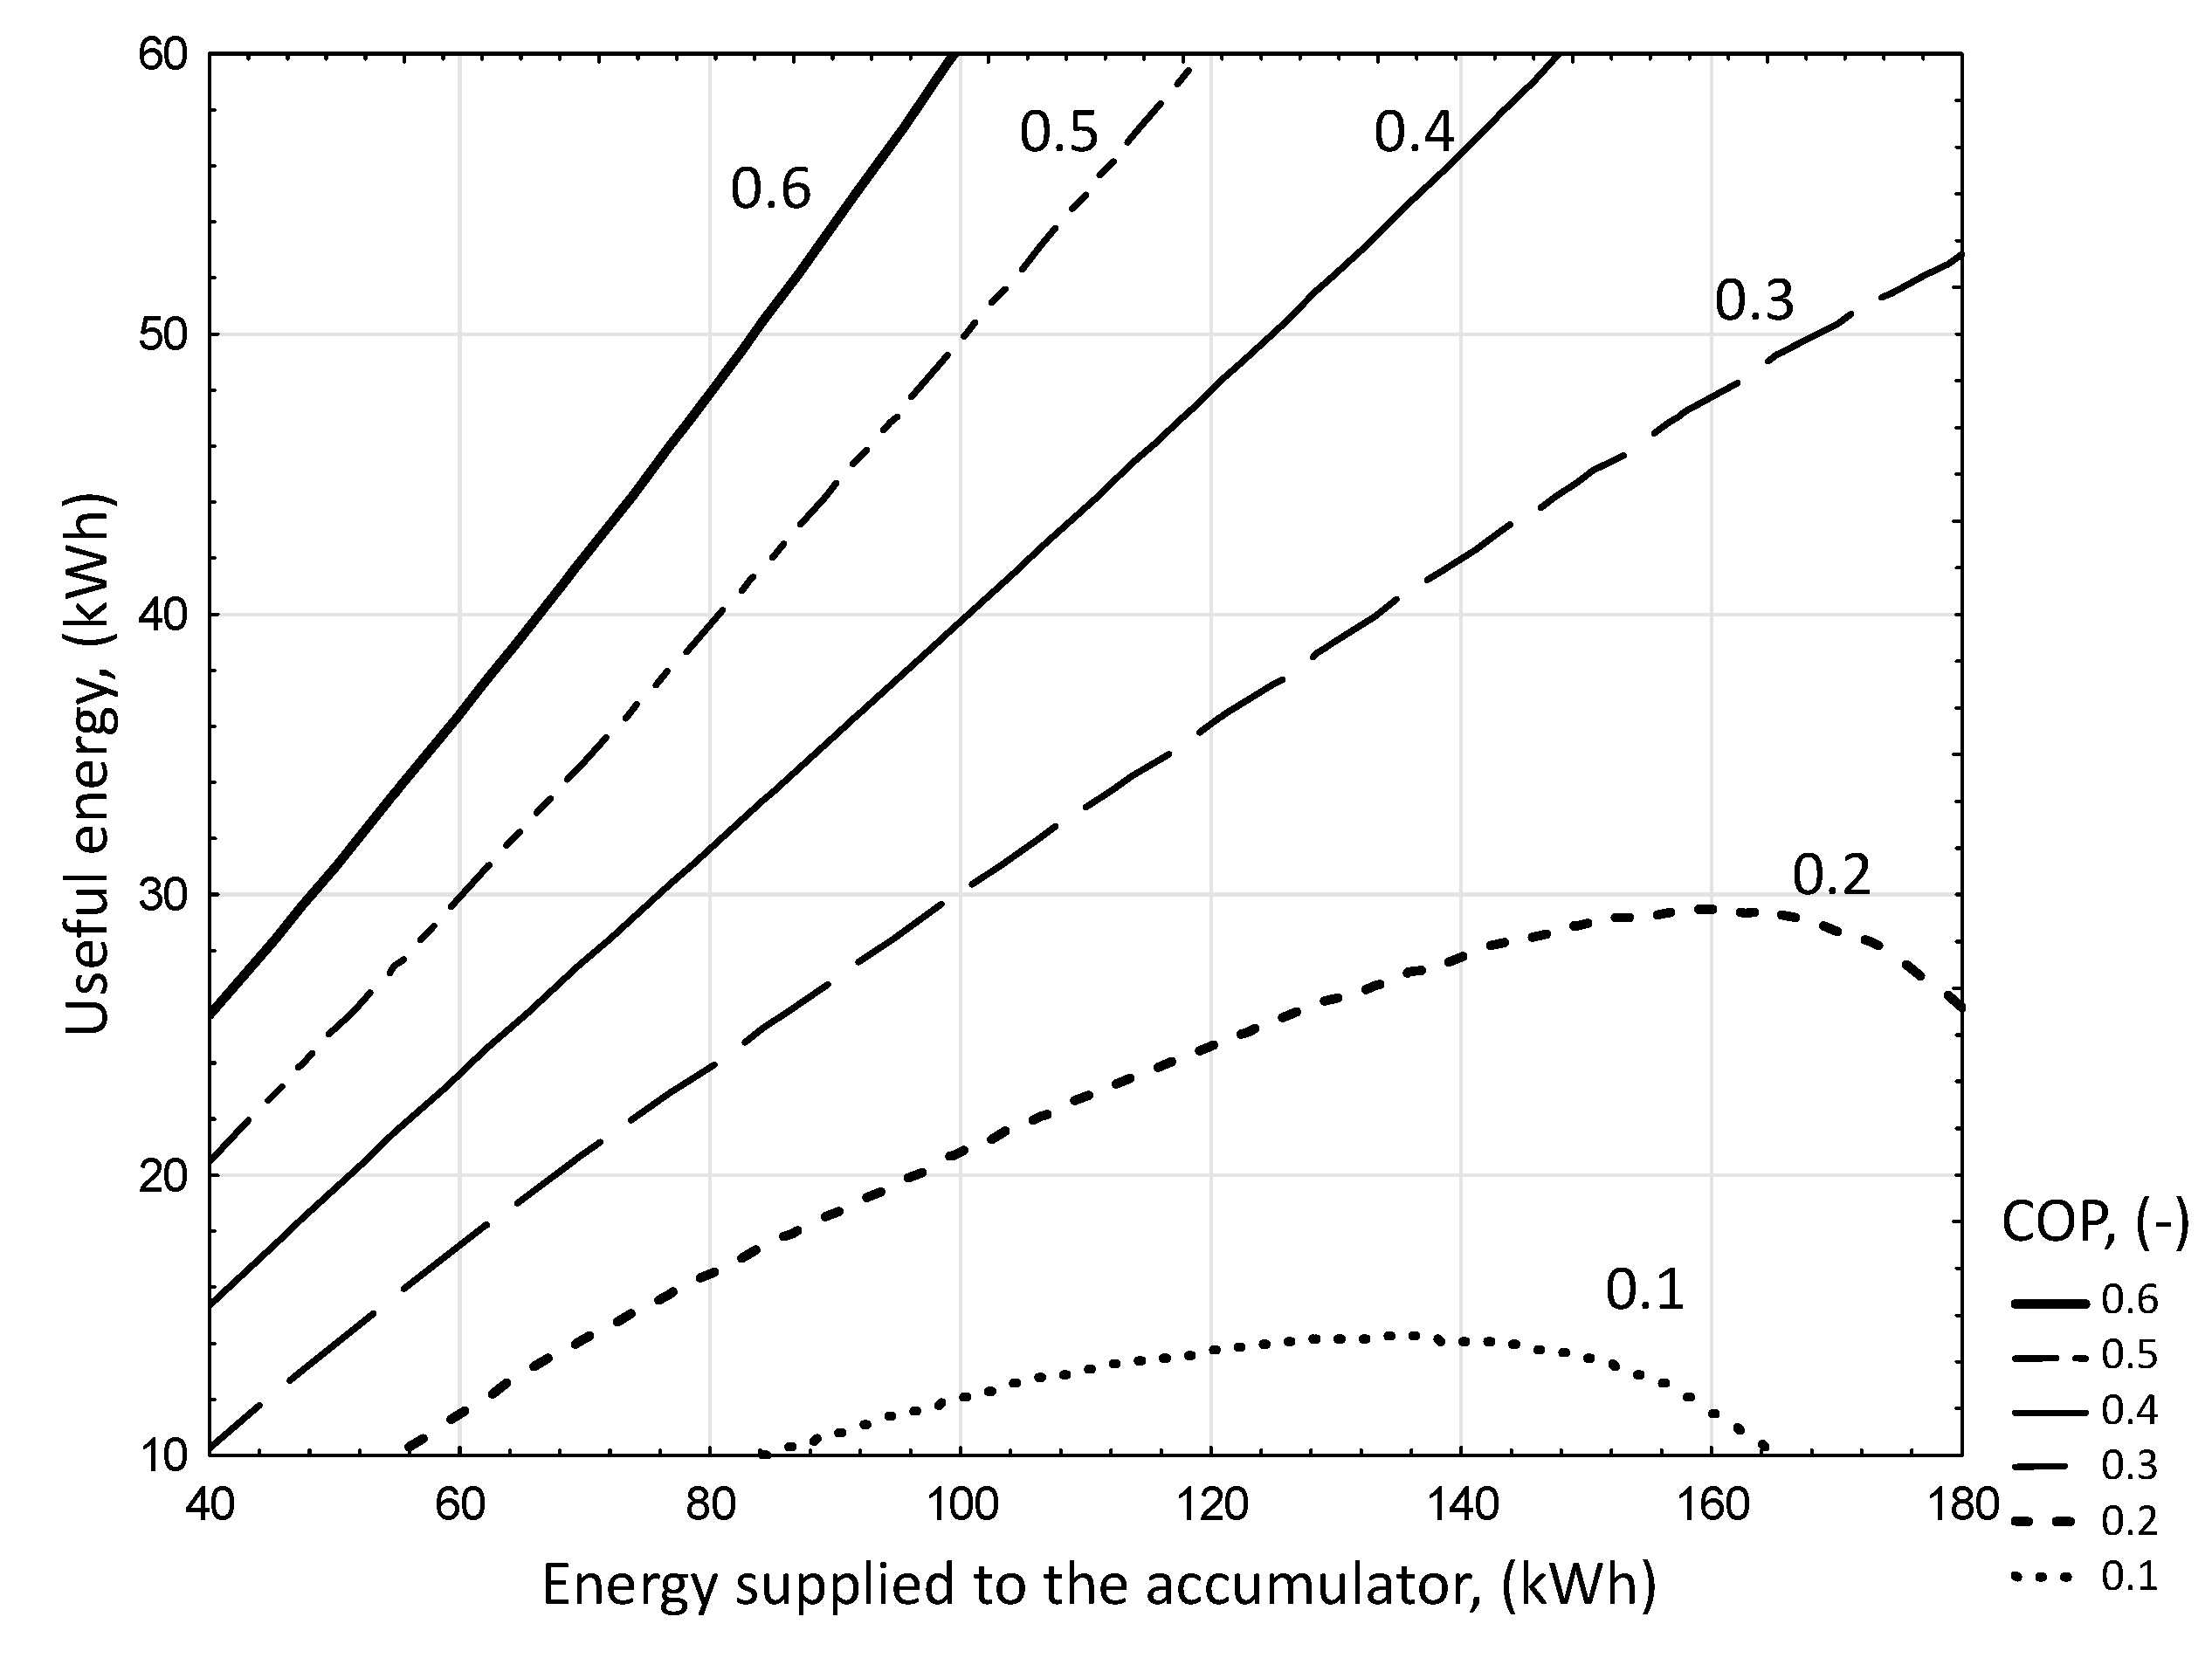
Changes in the COP coefficient taking into account energy supplied to the battery and useful energy (
Figure 35) increases with increasing battery efficiency and with increasing temperature difference of the battery bed. The equation for the efficiency of the PCM accumulator was determined in the function of energy supplied to the accumulator (
ES) and usable energy (
QE), using a linear estimation with the quasi-Newton method. The significance of the parameters was set at a level less than 0.05.
Energetic efficiency index (COP) of the PCM accumulator (-):
for the ranges of input variables:
The efficiency of the PCM accumulator operation during the experiment was between 11.8 and 60.5%. Such a large variation resulted from the thermal range of the accumulator operation. The system achieved lower efficiency in the range of temperatures where only specific paraffin heat was used, whereas accumulator operation in the phase transition temperature range was characterized by higher efficiency.
3.4. Comparison of Analyzed Battery Types
The three types of heat accumulators investigated have been tested in low-temperature bed operation systems, that is, for a stone-bed accumulator 17.3 ÷ 37 °C, for a water accumulator 15 ÷ 37 °C and for a PCM 12.3 ÷ 55.2 °C. The given temperature range limits were extreme values that were reached during the experiment. As one can see, the temperature ranges of accumulator operation were similar, hence there were premises for comparative analysis, which resulted in the accumulator type being the preferred option in terms of heat storage.
The energy efficiency coefficient of performance (COP) defined in the formulas (Equations (6), (11) and (15)) was used as the comparison criterion. This criterion takes into account the amount of heat accumulated in relation to the unit of electricity supplied to the system. With the efficiency of the electricity generation system, which in Poland is 35%, the desired energy effect should be achieved if the COP exceeds 3.0. The COP value results directly from the ratio of the primary fuel used to power plant turbines in relation to the direct use of this fuel for heating purposes. For example, if a power plant consumes 1 kWh of energy contained in the primary fuel within an hour and 0.35 kWh of energy is obtained when converting this energy into electricity, which means that that amount of electricity should contribute to the accumulation of 1kWh of primary energy. In the presented reasoning, the efficiency of the electricity transmission system and the primary fuel energy conversion system at the place of its use for the purposes of the heat accumulator was omitted. The above reasoning applies only to stone-bed and water accumulators, as in the case of the PCM battery, the power was realized by PV panels.
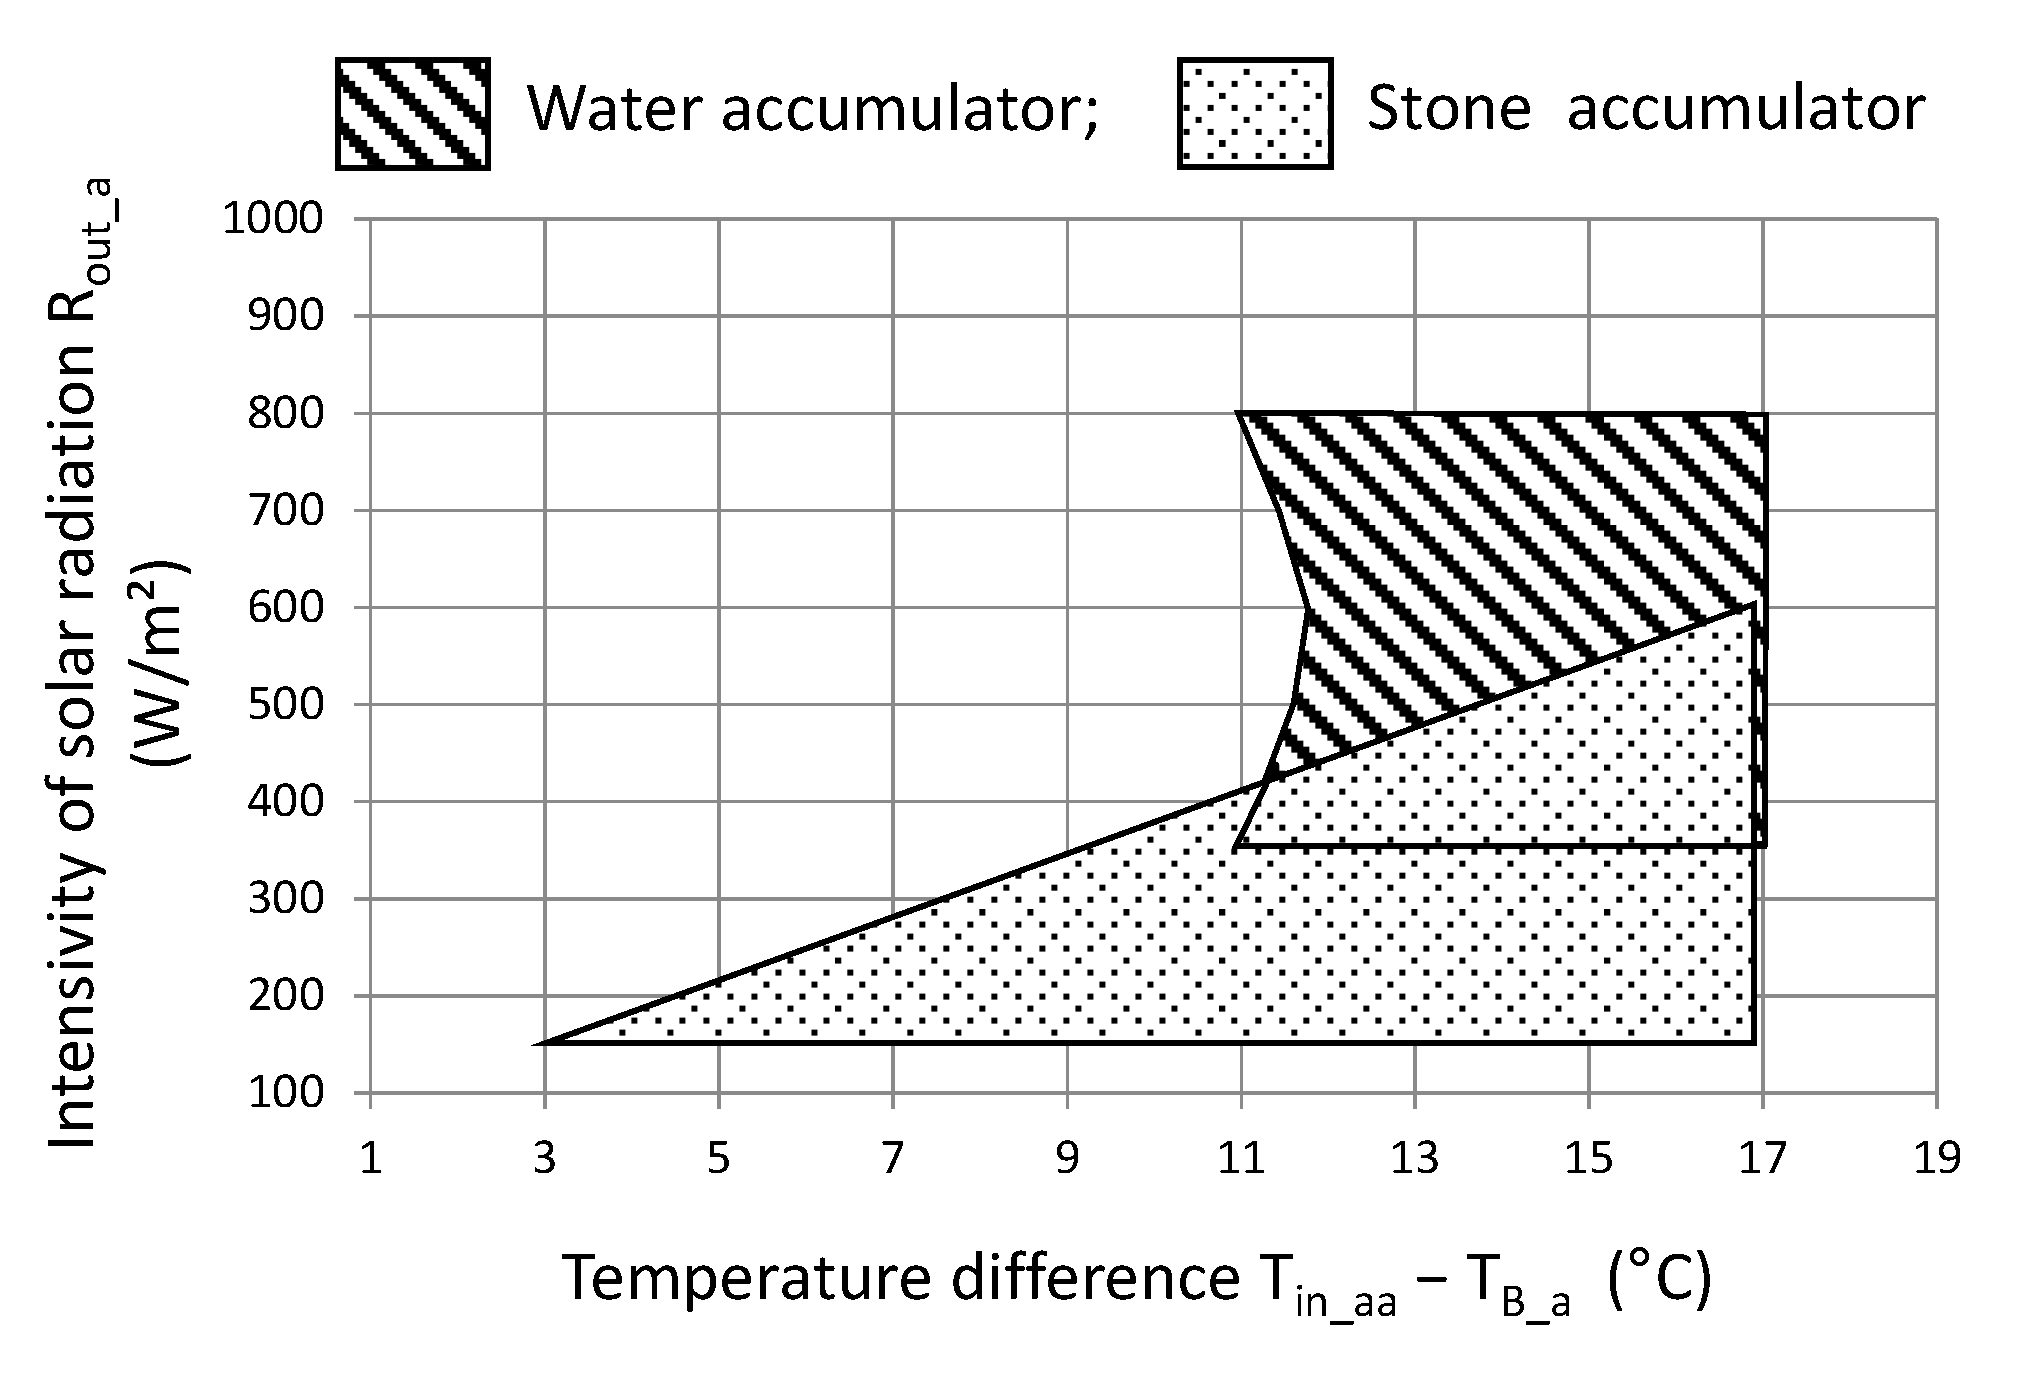
With such a criterion, the work area can be determined in a rectangular coordinate system, that is, the difference between the inlet air temperature and the bed temperature and the intensity of solar radiation. The results are illustrated in
Figure 36.
For a stone-bed accumulator, the desired energy effect can be obtained for a temperature difference (air inlet to the accumulator and bed temperature) in the range of 3 to 11 °C and average solar radiation intensity in the range from 150 to 600 W/m2. However, a water accumulator satisfies this condition if the average temperature difference is above 11 °C and the intensity of solar radiation is greater than 350 W/m². At the same time, the impact of solar radiation intensity is much smaller due to the thermal inertia of the entire accumulation system, especially during short periods of operation. However, the value of solar radiation intensity above 350 W/m² already indicates a significant share of direct radiation in the stream of solar energy reaching the tested object. Energy efficiency at COP = 3 is the lower boundary state required for the local energy system. For the purposes of a comparative assessment of the accumulators in question, the work area was also checked with an energy efficiency of not less than 5. In this respect, both stone-bed and water accumulators can be used. In the case of stone bed, such efficiency was obtained in several measurements, hence there are no grounds for safe inference for engineering practice. However, such a high efficiency can be achieved by a water accumulator, provided that the temperature difference is greater than 15 °C and the average intensity of solar radiation is above 450 W/m², which results in a full share of direct radiation.
The graphical analysis (
Figure 36) also shows a practical premise that in the case of a stone-bed accumulator, this accumulator shows better efficiency at lower parameters, that is, temperature difference and solar radiation intensity. In turn, for a water accumulator, a higher temperature difference and a higher value of solar radiation intensity are recommended.
The PCM phase change accumulator has a much smaller COP and is not comparable with a stone-bed or water accumulator. The COP value for this type of accumulator does not exceed 0.6 and should not be used in thermal systems supporting the heating systems of horticultural facilities. Storage efficiency is influenced not only by the amount of energy acquired but also by the insulation of the tank walls [
44]. The phase change accumulator works well for long-term heat storage. The tests [
45] in which the PCM accumulator was used in the heating installation showed that it is possible not only to store excess heat but also to improve the efficiency of the entire system. In this application of the PCM accumulator, it is necessary to install heaters powered by PV panels. However, this configuration of the system solves the problem of coherence of the energy source, that is, the shift in energy supply and demand.
In both cases, adequate control is extremely important to obtain the maximum COP value. The efficiency of heat storage in a PCM accumulator can be increased by modernizing the material used for the construction of the accumulator and changing its geometry [
46].

 ,
, 


