Article

Anaerobic Digestion Performance: Separate Collected vs. Mechanical Segregated Organic Fractions of Municipal Solid Waste as Feedstock

by
Przemysław Seruga
1,*,
Małgorzata Krzywonos
1,
Anna Seruga
2,
Łukasz Niedźwiecki
3,
Halina Pawlak-Kruczek
3 and
Agnieszka Urbanowska
4
1
Department of Bioprocess Engineering, Wrocław University of Economics and Business, Komandorska 118/120, 53-345 Wrocław, Poland
2
Wrocław University of Economics and Business, Komandorska 118/120, 53-345 Wrocław, Poland
3
Faculty of Mechanical and Power Engineering, Wroclaw University of Science and Technology, Department of Boilers, Combustion and Energy Processes, Wyb. Wyspiańskiego 27, 50-370 Wrocław, Poland
4
Faculty of Environmental Engineering, Chair in Water and Wastewater Treatment Technology, Wroclaw University of Science and Technology, Wyb. Wyspiańskiego 27, 50-370 Wrocław, Poland
*
Author to whom correspondence should be addressed.
Energies 2020, 13(15), 3768; https://doi.org/10.3390/en13153768
Submission received: 19 June 2020 / Revised: 15 July 2020 / Accepted: 20 July 2020 / Published: 22 July 2020
(This article belongs to the Special Issue Bioenergy from Organic Waste)

Abstract

:
The replacement of fossil fuel with renewable energy sources seems as though it will be crucial in the future. On the other hand, waste generation increases year by year. Thus, waste-to-energy technologies fit in with the actual trends, such as the circular economy. The crucial type of generated waste is municipal solid waste, which is in the research area. Regarding the organic fraction of municipal solid waste (OFMSW), anaerobic digestion (AD) allows the recovery of biogas and energy. Furthermore, if it is supported by source segregation, it should allow the recovery of material as fertilizer. The AD process performance (biogas yield and stability) comparison of source-segregated OFMSW (ss-OFMWS) and mechanically sorted OFMSW (ms-OFMSW) as feedstocks was performed in full-scale conditions. The daily biogas volume and methane content were measured to assess AD efficiency. To verify the process stability, the volatile fatty acid (VFA) content, pH value, acidity, alkalinity, and dry matter were determined. The obtained biogas yield per ton was slightly higher in the case of ss-OFMSW (111.1 m3/ton), compared to ms-OFMSW (105.3 m3/ton), together with a higher methane concentration: 58–60% and 51–53%, respectively, and followed by a higher electricity production capacity of almost 700 MWh for ss-OFMSW digestion. The obtained VFA concentrations, at levels around 1.1 g/kg, pH values (slightly above 8.0), acidity, and alkalinity indicate the possibilities of the digester feeding and no-risk exploitation of either as feedstock.

Graphical Abstract

1. Introduction

Climate change, followed by the energy crisis, is one of the most critical issues of our world. Further research devoted to sources of renewable energy may allow us to protect the environment, along with natural resources. It will also enable us to reduce the consumption of fossil fuel [1]. This should lead to sustainability and support the reduction of human impact on other present day challenges, i.e., water table challenges, soil, space, carbon emissions, etc. [2,3] Additionally, waste generation is a major contributor, causing a negative environmental impact [3]. Municipal solid waste (MSW) is found to be the most complicated waste stream [2]; thus, its management system has to be environmentally, economically, and socially acceptable [4].
In the last few decades, waste-to-energy (WtE) technology has been considered as a solution for MSW handling, where energy production has been identified as a potential source to replace fossil fuels in the future [5]. It fits within zero waste and the circular economy (CE). The current policy utilizes circular management to reduce the exploitation of primary resources and to ensure long-term sustainability [6]. An essential part of the CE is the life cycle of products [7]. The circular economy is a model of production and consumption that involves sharing, reusing, repairing, and recycling existing materials and products, extending their life cycle. In practice, the circular economy implies reducing waste to a minimum [6,8].
Regarding WtE and CE, the primary concern remains MSW management. A substantial amount of MSW is generated globally. Only a tiny part is turned into useful resources [9]. About 2.01 billion tons of MSW were produced globally in 2017, and a rising trend is observed. It has been estimated that the yearly generation may rise to 3.40 billion tons by 2050 [10]. Landfilling continues to be the predominant disposal method, irrespective of a country’s income [10,11]. Only in high-income countries do recycling, incineration, and other advanced waste disposal methods account for slightly more than 50% by mass [10]. It is characterized by an 84% collection efficiency and 15% recycling efficiency of collected MSW [9,12]. MSW management efficiency still has to be improved [13].
The main fraction of MSW, representing from 42 to 75% (globally 46%) of total content, is the organic fraction of municipal solid waste (OFMSW) [14,15]. During the last few years, the OFMSW has been widely studied, considering the possibility of energy recovery, including various technologies [16,17]. These technologies can be divided into thermal-based treatments, such as gasification or pyrolysis, and biological processes, such as anaerobic digestion (AD) or composting [5]. Biological treatment is used with higher proportions of the OFMSW, which makes thermal treatment inadequate [5]. Energy recovery via AD is a sustainable process, which could be successfully applied to treating organic waste. It is also an environmentally friendly manner of managing MSW [18,19]. Nonetheless, researchers are facing the optimization of MSW management to improve biogas yield mostly at the laboratory scale, while investigations of existing facilities are limited. The use of the digestate of MSW, for energy purposes, i.e., in hydrothermal carbonization (HTC), could be much more profitable, due to landfilling cost reduction [20], especially when agricultural usage is limited.
Another essential matter facing CE is source segregation. The organic fraction of municipal solid waste segregated based on its source (ss-OFMWS) is thought of as an answer to the non-landfill waste management system [12]. When source-segregated waste is processed, i.e., via AD, not only is biogas recovered, but so is additional value material, in the form of fertilizer, which can be used on crops. If the waste is not segregated by source so that the organic fraction is recovered by the mechanical–biological treatment (MBT) plant, the usage of the product fermented in this manner is limited on soil [21,22]. Therefore, the interest of government and industry in establishing separate collections of MSW should appear. However, changes in the political and management systems, as well as the environmental, economic, and social factors, influence the final effect [23,24,25]. As a result, there has been an increase in the number of industrial-scale facilities geared towards recovering valued materials and energy from non-segregated MSW [23]. MBT includes composting or anaerobic digestion to stabilize the biodegradable fractions as a stage within a sorting and separation process [12]. Source-segregated biowaste has more significant recovery potential, compared to the mechanical sorted organic fraction of municipal solid waste generated from mixed MSW (ms-OFMSW) [26,27]. The segregation at source ensures in the greater safety of treatment process performance, as well as emerging product reuse [26,27]. However, the AD performance with ss-OFMWS still has to be verified, mainly at a full scale with existing regional facilities.
The literature suggests that AD is the best of the many options for the biological treatment of OFMSW with regard to the environment and the economy. However, it should be mentioned that attention should be paid to process efficiency (i.e., biogas yield), together with performance (stability), which is crucial for the full-scale operation. Moreover, the comparison of ss-OFMWS and ms-OFMSW should be made to define the benefits of source segregation, which is more effort for people and generates additional costs for the collection system [11].
This study aims to make a comparison between the AD of separately segregated biowaste and the AD of the mechanically sorted OFMSW, considering process efficiency and performance. The research was performed at full scale, using an operating plant.

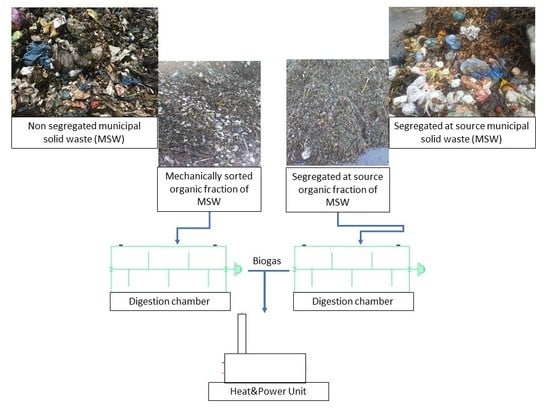
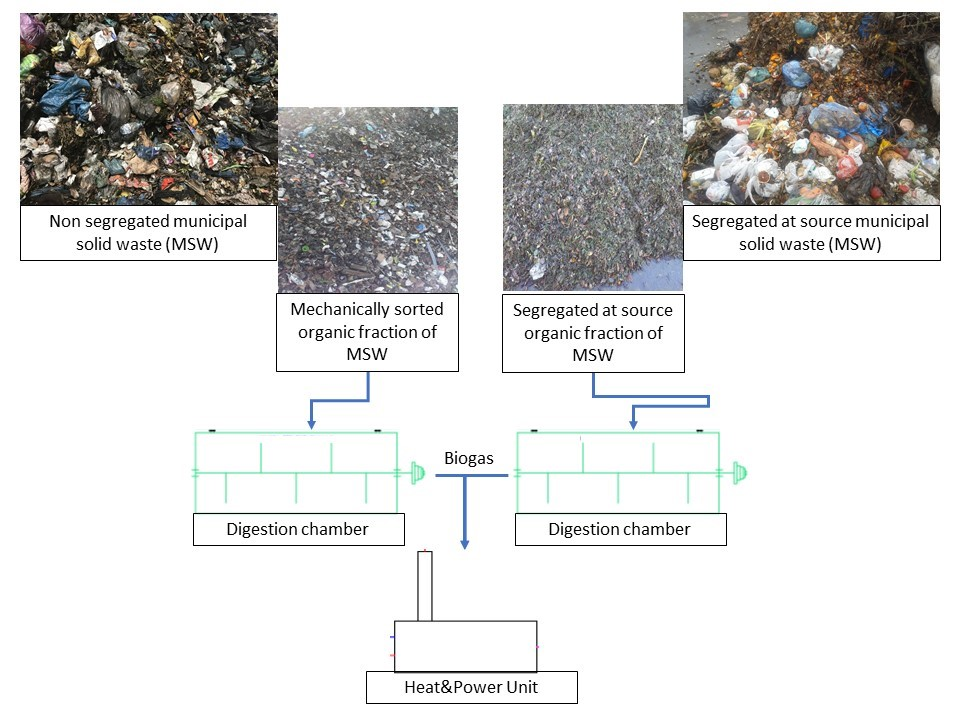
2. Materials and Methods

2.1. The ms-OFMWS Characterization

The ms-OFMWS was separated mechanically using screening (drum screen 60 mm) for glass, stone, and ceramic ballistic separation, as well as ferric and non-ferric metal separation. The separation was carried out at an MBT plant (ZGO Gać, Oława, Poland), located in Lower Silesia, in the southwestern part of Poland, and kept in a 300 m3 buffer before feeding the AD. The composition of the feedstock is presented in Table 1.

2.2. The ss-OFMWS Characterization

The ss-OFMWS was manually sorted (plastic bags, stones, metals, etc., were sorted out) and shredded (TR2A200, O.M.A.R. S. r.l., Italy) to a fraction of about 60 mm. The composition of the feedstock is presented in Table 2.

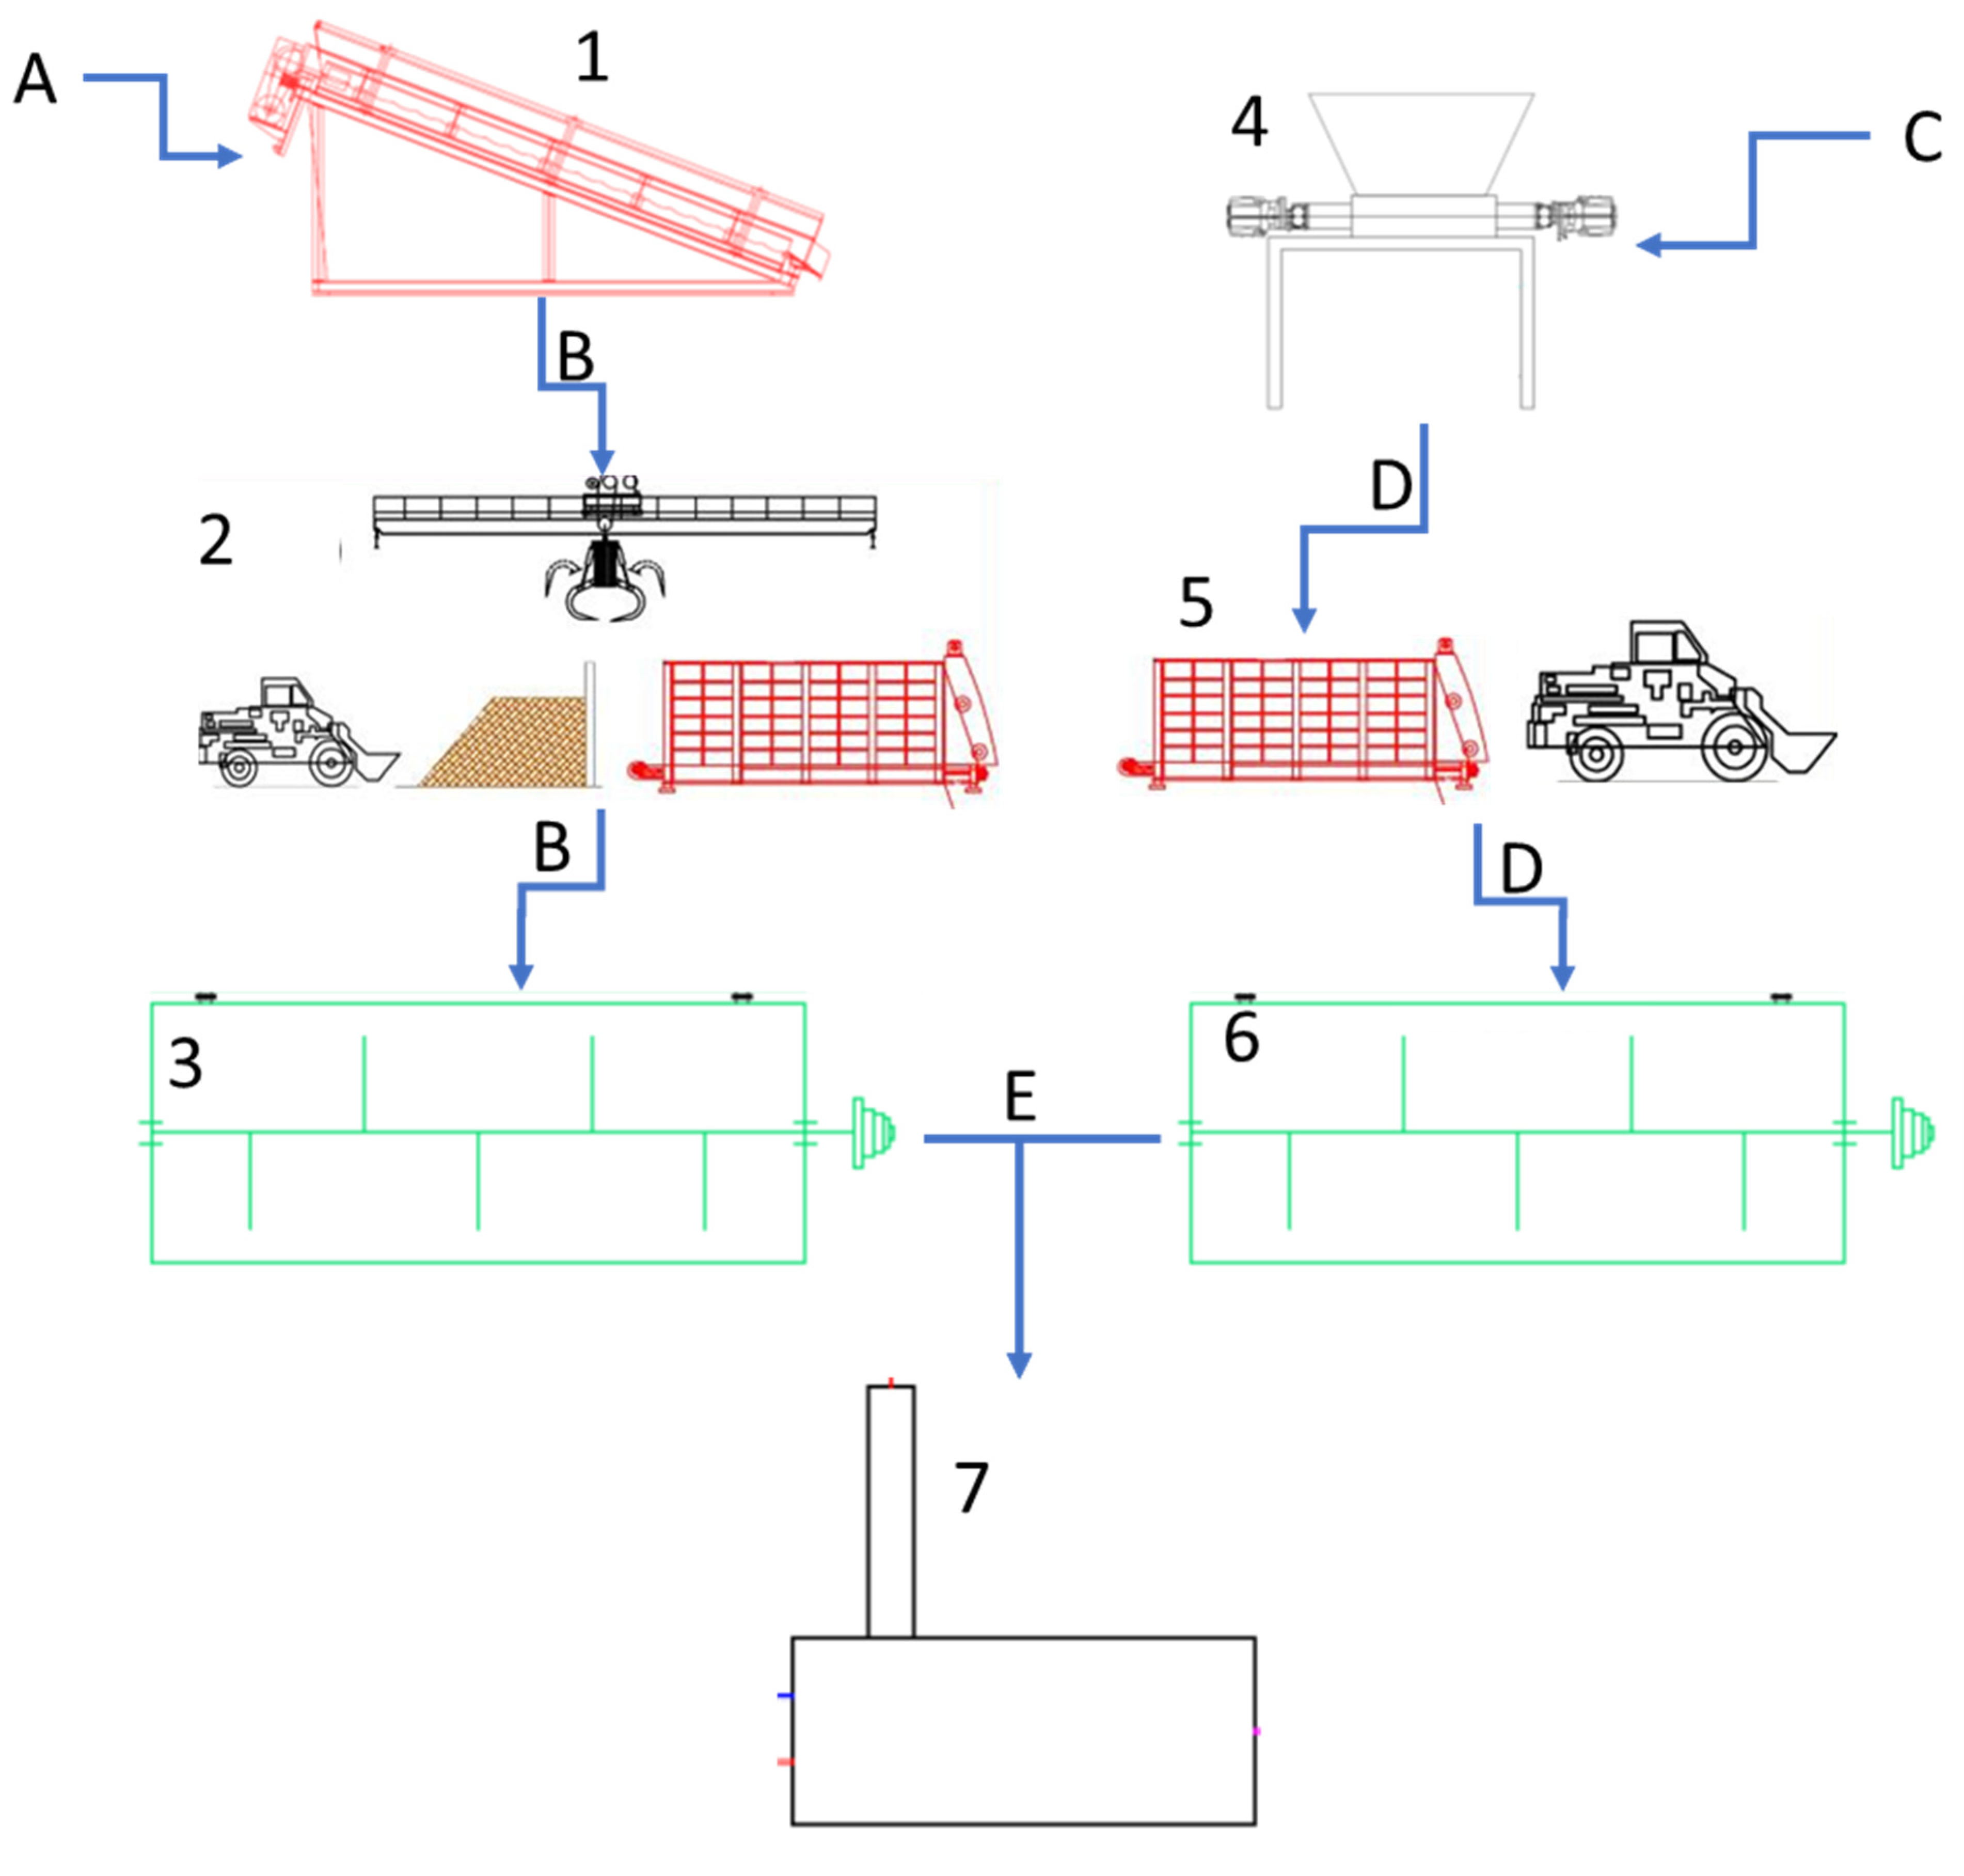
2.3. The AD Full-Scale Research

The study was conducted at an MBT plant (ZGO Gać, Oława, Poland). The plant is located in Lower Silesia, in the southwestern part of Poland. A simplified diagram of the installation is presented in Figure 1.
The anaerobic digestion (AD) processes were conducted in 1500 m3, full-scale Kompogas® separate digester chambers using ms-OFMSW and ss-OFMWS as the feedstocks. The process temperature was maintained at 54 °C. The agitation speed was set at 0.45 rpm, in 300 s operation and 120 s break cycles, with alternating directions. The operating volume (about 1100 m3) in the digester was determined through setting up the extraction pump operation time.
The AD process parameters, such as temperature, digester filling level, biogas yield, input weight, electricity production, etc., were archived every day by the central control system. Moreover, samples from the digester inlet, outlet, and middle section were collected on a weekly basis. To verify the performance and stability of the process, the pH value, dry matter content, acidity, alkalinity, and concentrations of fatty acids (acetic (HAC), propionic (HPR), butyric (HB) with isobutyric (HIB), and valeric (HV) with isovaleric (HIV)) were determined. The flowmeter was used to measure the biogas stream. A biogas analyzer (ADOS Biogas 401) (ADOS GmbH, Aachen, Germany) allowed for determining its composition (the content of methane, hydrogen sulfide, and oxygen), before combustion in the combined heat and power (CHP) units. Average values are reported.

2.4. Analytical Methods

The fatty acid content was determined using gas chromatography (Varian GC 450) (Varian BV, Middelburg, the Netherlands) with a flame ionization detector (FID) detector (H2: 30 mL/min, air: 300 mL/min, He: 30 mL/min) (Varian BV, Middelburg, the Netherlands). Helium (constant flow through a 1 mL/min column) was used as the carrier gas with a 1:30 split.
The pH-metric titration, which was used in compliance with the standard methods, was utilized to determine acidity and alkalinity [28]. The acidity/alkalinity ratio (index R) was also determined.
The standard methods were used to ascertain the suspended solids (SS), dry organic mass, and pH [29].
To determine the composition of the OFMSW, the waste samples were collected over a month. Each sampling day, at about 60 min intervals, 10–15 kg samples were collected to prepare the daily sample. In total, two samples of OFMWS of approx. 100 kg were collected. Before testing, the daily waste samples collected over a week were mixed and averaged. Then the pooled samples were divided by quartering and a representative sample of about 100 kg was selected. The determination of the composition was made in 11 main material fractions: organic waste, paper, plastics, textiles, wood, glass, metals, multi-material waste, hazardous waste, inert waste, other waste. A fine fraction was also isolated. The average values based on the weekly samples are reported.

2.5. Calculation Methods

The average monthly biogas yield was determined using the formula: Y = (Vav/Mav), where Y stands for biogas yield (m3/ton), Vav for the biogas daily volume average over a month (m3), and Mav for daily feeding amount average over a month (tons).

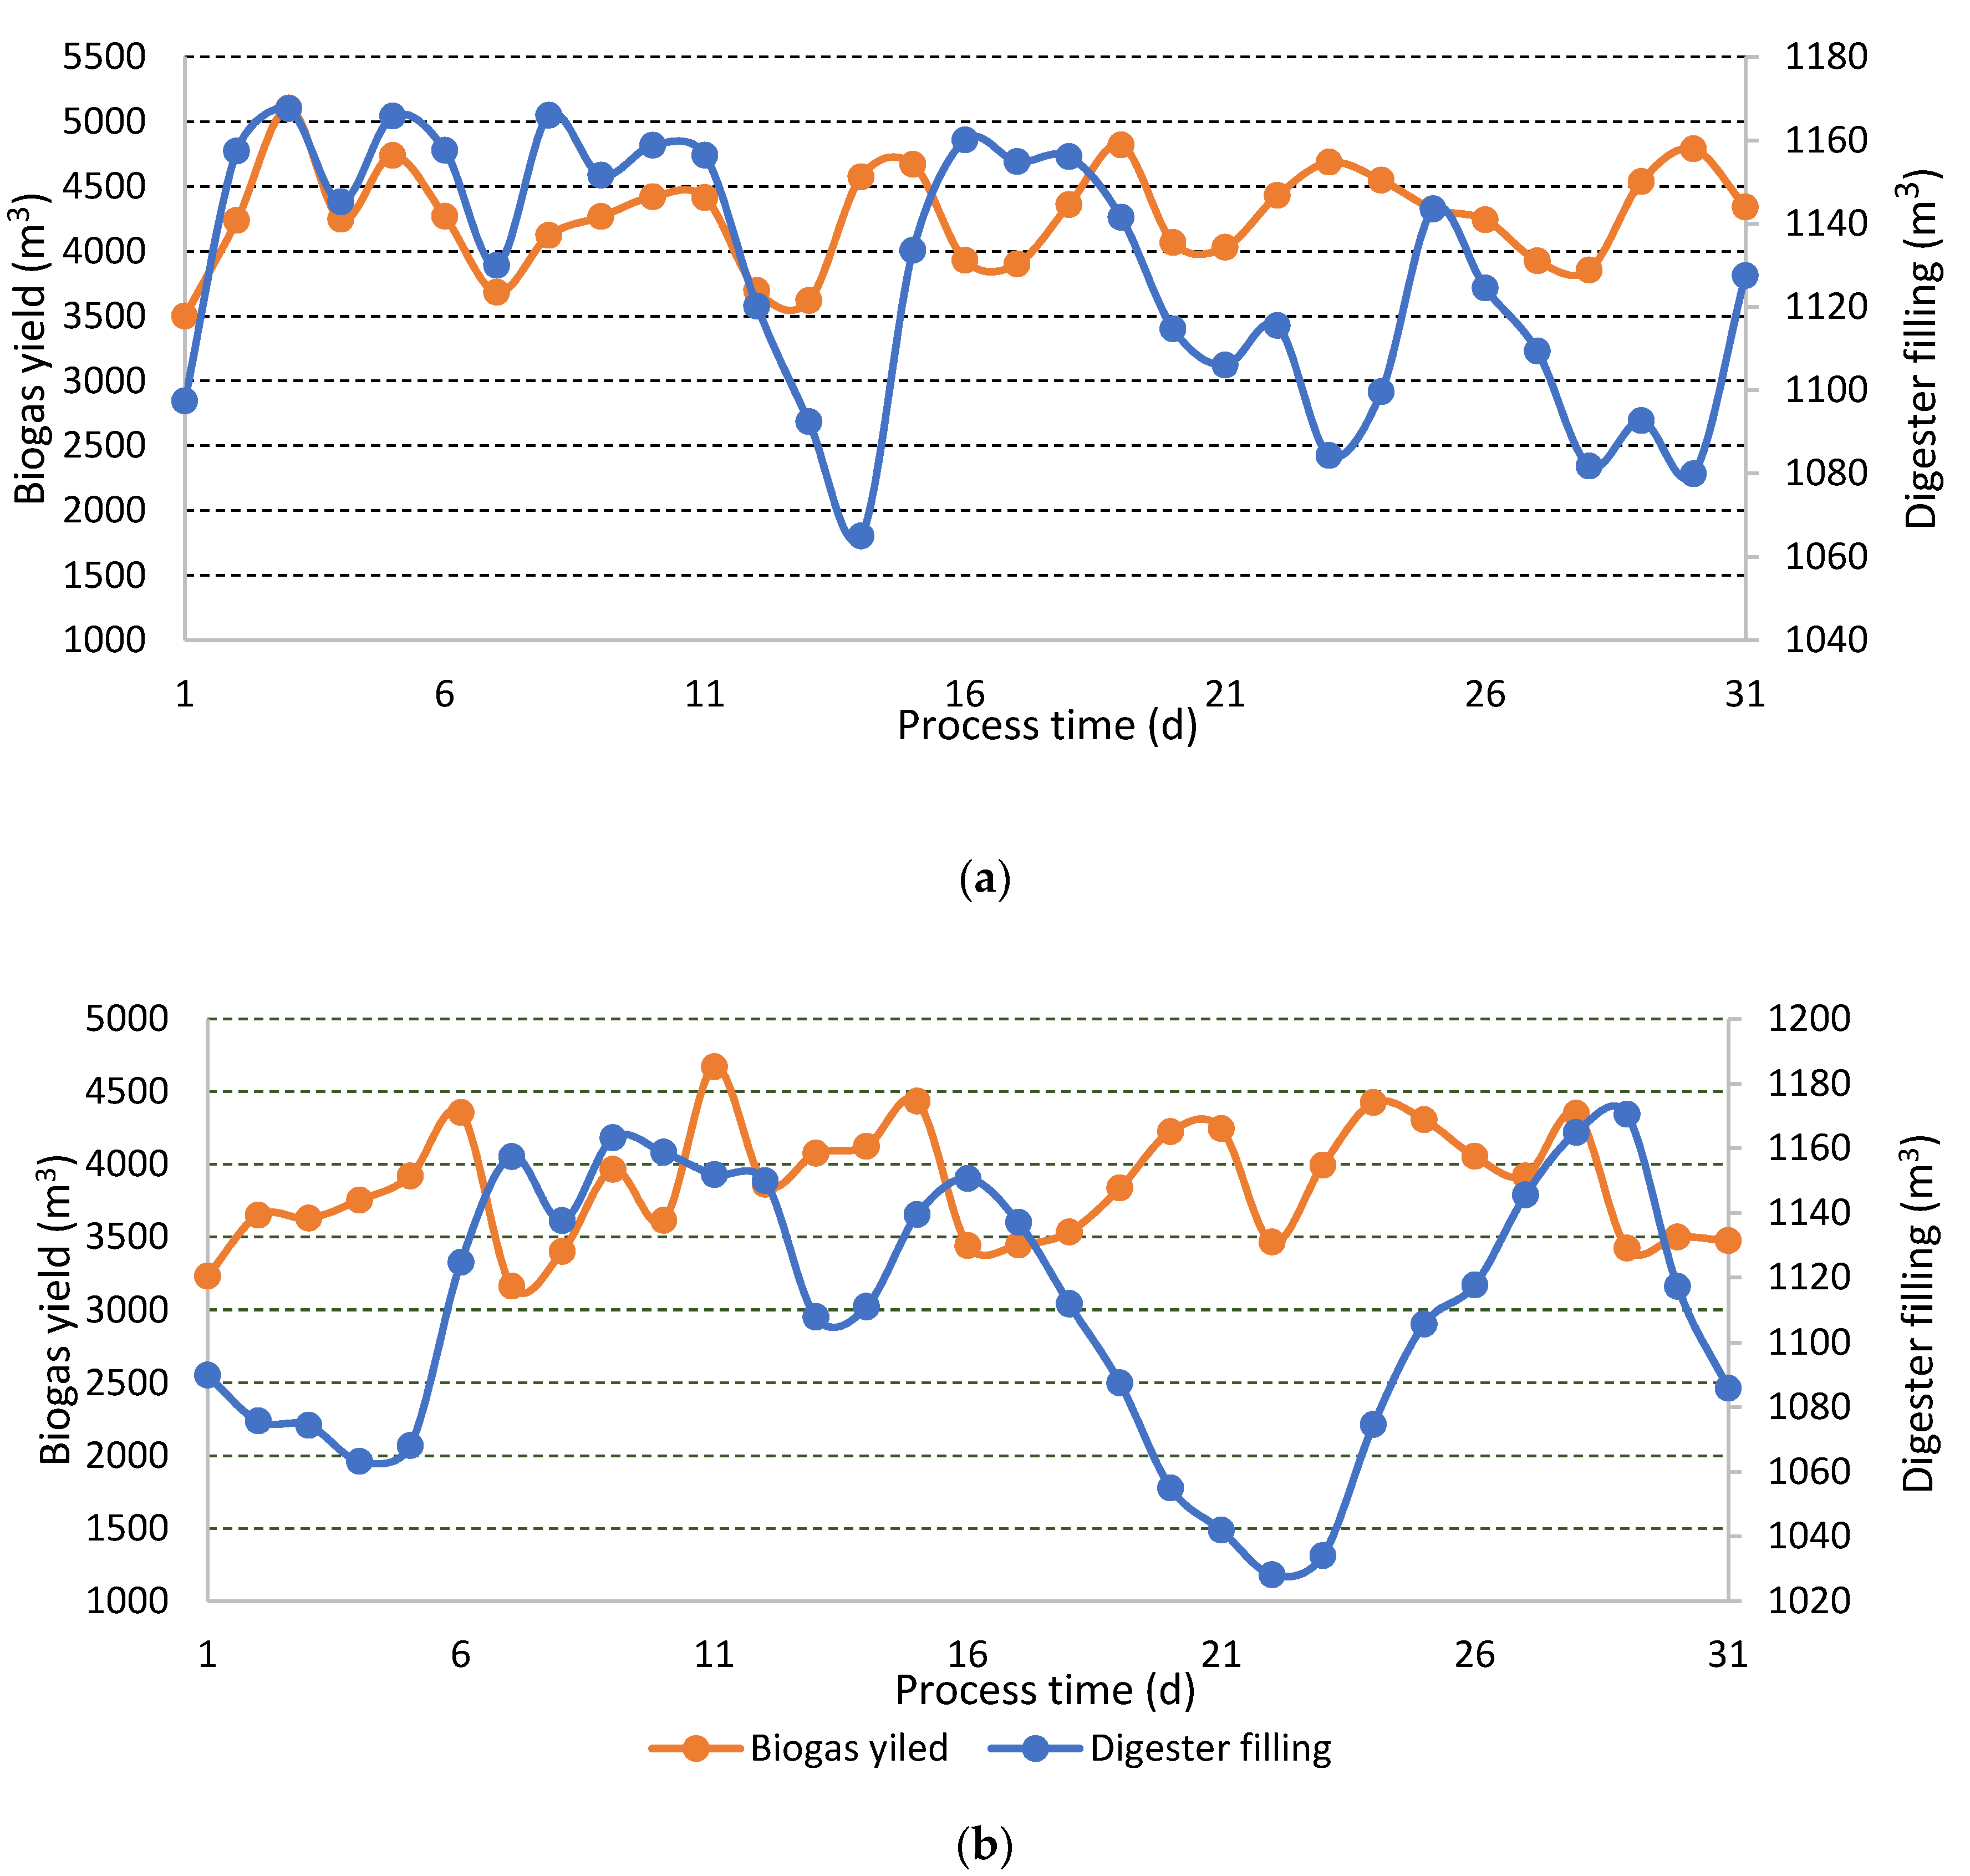
3. Results and Discussion

The research was performed in the Lower Silesia region in Poland. The MSW separate collection standard, based on five fractions: paper, plastics, glass, biowaste, and residual waste, was implemented in Poland in 2018. However, due to a transitional period, mixed MSW is still collected. Thus, the MBT plant receives waste streams which have to be pretreated. In the case of biowaste, the amount of the collected waste is still less than that obtained from mixed MSW in the analyzed area.
The AD was evaluated at the full-scale MBT plant (ZGO Gać, Oława, Poland) with the ms-OFMSW and ss-OFMSW digestions, and the results were compared. The composition of both feedstocks is presented in Table 1 and Table 2. It was observed that organic fraction content is higher in ss-OFMSW (68.1%), compared to ms-OFMSW (48.3%), which was as expected. The wood quantity was at a similar level for both OFMSWs (7.2–8.1%). The fine fraction content was over 10% higher in ms-OFMSW, which can be explained by the coal ashes, which is typical of Polish conditions. Furthermore, over a 7.5% content of the “others” fraction (Table 2) was observed in ss-OFMSW, despite the manual sorting. It may indicate the poor quality of source segregation or a poor sorting process. Due to ms-OFMSW, the “others” fraction content was almost 16% (Table 1), which may confirm that the source segregation in the analyzed MBT plant area still has to be improved regarding biowaste, as well as for packaging fractions (plastic, paper, and glass).
The feedstocks were analyzed before the digester feeding, and the results of the analysis can be found in Table 3. As can be seen, the SS and the fatty acid content remain at similar levels. However, ss-OFMSW is characterized by a higher pH value, alkalinity, and ammonium content compared to ms-OFMSW (Table 3). This can be explained by a higher organic matter content (Table 2), mainly green waste content.
The process of anaerobic digestion of both feedstocks conducted in the MBT Plant was stable. The exploitation of historical trends was similar (Figure 2 and Figure 3). For both digesters, the average filling was kept at about 1110 m3 (Figure 2a,b). The recorded hydraulic retention time (HRT) was about 28 and 31 days for ms-OFMSW and ss-OFMSW AD, respectively. The total volumes of biogas produced were 131,390.7 m3 and 119,478.9 m3 for ms-OFMSW and ss-OFMSW, respectively, followed by total input of 1256.6 tons and 1076.8 tons (Figure 2 and Figure 3). Based on that, it can be found that biogas yield per ton was slightly higher in ss-OFMSW (111.1 m3/ton) than for ms-OFMSW (105.3 m3/ton). The obtained biogas productivity was similar to the results reported in our previous study [7] and by other researchers [21,30]. Nonetheless, owing to a variety of OFMSWs, it is not easy to make a comparison of the collected results with those facilities described in Europe or other places in the world. Campuzano and González-Martínez [31] analyzed the composition of the OFMSW and methane yield in 43 cities in 22 countries worldwide. The methane yield ranged from 61 L/kg up to 580 L/kg with an average value of 415 ± 138 L CH4/kg. The average yield of methane in Italy totaled 400 L/kg; meanwhile, in Denmark, it amounted to 499 L [31]. Furthermore, it should be noted that a more significant variability of daily biogas yield was observed during ss-OFMSW anaerobic digestion. The difference between minimal and maximal daily biogas yield was 45.9 m3/ton, while the difference in the case of ms-OFMSW was 27.1 m3/ton (Figure 2a,b). This difference might be a consequence of the variation in feedstock composition. The composition of ms-OFMSW was averaged during the sorting process, while that of ss-OFMSW was characterized by changes in green waste and kitchen waste content. This waste has different biogas potential, which impacts AD efficiency [31]. The small difference in biogas yield for OFMSWs might also indicate the similar quantities of the digestible organic matter, which proves the necessity of source-segregation improvement. The recirculation of the digestate was maintained at a constant level to ensure organic matter degradation and no compensation of biogas productivity while increasing its proportion was observed.
Methane is the most desired component of biogas. It is deemed a renewable energy, which might be transformed into usable energy (heat or electricity). The potential energy recovery of various feedstocks varies [32]. Therefore, increasing the efficiency of methane production from various substrates is tantamount to greater energy recovery in AD [32]. The measurement of the biogas component content might indicate feedstock quality. In this study, methane, hydrogen sulfide, oxygen, and carbon monoxide concentrations were monitored.
During ss-OFMSW AD, a higher methane concentration was observed (58–60%) compared to ms-OFMSW (51–53%), which affected the production of electricity in combined heat and power (CHP) units. The second important biogas quality parameter is the hydrogen sulfide concentration. It was much lower in biogas from ss-OFMSW AD (200–250 ppm), than in biogas obtained from AD of ms-OFMSW (800–1000 ppm), which can confirm the presence of coal ash in this feedstock. The AD of ms-OFMSW required the addition of more desulfurizing agent (in this study, ferric chloride solution (PIX 116, Kemipol, Poland)), which generates higher process costs and has a higher risk of CHP unit damage. The oxygen concentration was lower than 0.2%, which proves there were no leaks in the facility.
The differences in the electricity production efficiency regarding the AD of ms-OFMSW and ss-OFMSW are presented in Table 4. It can be found that even a small difference in biogas yield (6 m3/ton) results in a significant disparity in total production capacity (87,000 m3). Furthermore, a higher methane content promotes electricity yield and an increase in yearly production capacity by almost 650 MWh, when considering ss-OFMSW AD (Table 4).
Except for the biogas yield, ensuring process stability is also crucial, especially at a full scale. Thus, it is crucial to monitor the values of the process indicators [31]. The changes in the process parameters during the ms-OFMSW AD are presented in Figure 4 and Figure 5. The variations of ss-OFMSW AD are presented in Figure 6 and Figure 7.
The pH value is considered to be the factor stabilizing anaerobic digestion [5,31]. Generally, the pH value ought to be between 7.2 and 7.8. It might, however, be influenced by temperature and sampling, and it might be unique to the particular facility [7,33]. During testing the ms-OFMSW AD, the pH-value was 8.5 in the inlet section, with slight growth to 8.6 in the outlet (Figure 4a), which was typical for the examined MBT plant. Regarding the ss-OFMSW AD, the pH value was 8.3–8.4 in the inlet section, with slight growth to 8.6 in the outlet (Figure 6a). The pH value decrease is usually caused by the organic overload of the digester and might result in reducing the activity of microorganisms, causing the decomposition of volatile fatty acids [5,31]. An alkalinity increase (pH values above 8.0) affects the NH3 and NH4+ dissociation balance. Considering the higher ammonium ion concentration (of about 1g/kg) during the AD of ss-OFMSW, compared to ms-OFMSW AD (Figure 4c and Figure 6c), it was expected to achieve higher pH values. The higher acidity, together with lower acidity in ms-OFMSW AD (Figure 4d,e) than in ss-OFMSW AD (Figure 6d,e), may explain the observations. Nevertheless, mostly because of this digester buffer capacity, pH changes are normally detectable only at the point when the process is already unstable. Hence, the determination of low fatty acid (acetic, propionic, butyric, and valeric) concentrations (with ratios) is the source of the most reliable information regarding the stability for digestion [34]. The process of producing and accumulating volatile fatty acids (VFAs) could inhibit anaerobic digestion, which could result in slowing the production of biogas [28].
The obtained VFA concentrations, at levels around 1.2 g/kg, indicate the possibilities of digester feeding and no-risk exploitation. There is an optimum loading rate for a given size of the digestion chamber, which cannot be exceeded. Otherwise, the loading rate increment could stop being effective, because it might lead to an accumulation of excess VFAs and subsequently to reactor collapse [28].
The ms-OFMSW AD was stable. The acetic acid content amounted to 0.87–1.0 g/kg, with a propionic acid concentration of between 5 and 10 mg/kg in the inlet section (Figure 5a,b). In the outlet section, the acids were nearly zero, which may confirm full organic matter decomposition (Figure 5a,b). Owusu-Agyeman et al. [35] also reported that acetic acid is the most abundant VFA in the anaerobic digestion of organic waste. However, the share of acetic acid decreased with time [35] and its relative abundance was much lower than in this study. Differences in the composition could be attributed to the fact that the AD temperature of the batch was much lower (35 °C) [35], as well as to differences in the composition of the feedstock. The organic waste in the study of Owusu-Agyeman et al. [35] consisted of alcohol and soda beverage, food, dairy, fruit, fat, and oil waste. Tampio et al. [36] reported that the acetic acid fraction dominated only in the first period of the anaerobic digestion of food waste, which was then surpassed by butyric acid. Additionally, in this case, mesophilic conditions (37 °C) [36] could be considered as a plausible explanation for the obtained difference. The butyric and valeric acid contents were at deficient levels during AD (Figure 4c) and did not go beyond 10 mg/kg even in the inlet section. Similar concentrations of butyric acid were reported by Kor-Bicakci et al. [37] for the anaerobic digestion of mixed sludge in thermophilic conditions (55 °C).
The ss-OFMSW AD was also stable. The content of acetic acid ranged from 1.0 to 1.2 g/kg; the concentration of propionic acid in the inlet section was between 15 and 32 mg/kg (Figure 7a,b). Both acid levels were higher than in ms-OFMSW, which confirms the higher organic matter content (Table 1 and Table 2). Furthermore, in the outlet section, the acetic acid content reached about 10 mg/kg (Figure 7a), which may confirm that the organic matter did not fully decompose. Thus, the inoculation volume should be increased. The propionic acid content was nearly zero, similar to ms-OFMSW AD (Figure 7b and Figure 5b). In the inlet section, the butyric acid content was about four to five times higher than in the digestion of ms-OFMSW (Figure 5c and Figure 7c). A higher amount of organic acids may also confirm the higher content of green waste in ss-OFMSW and organic matter in general (Table 1 and Table 2). The valeric and isovaleric acid contents were nearly zero during AD.

4. Conclusions

The performed research confirmed that AD is an effective process of ms-OFMSW and ss-OFMSW treatment. It allows for recovering energy from waste. The obtained results confirmed that the performance of AD with ss-OFMWS, in a full-scale AD plant, is better in comparison to ms-OFMSW, from the perspective of renewable energy generation. The obtained biogas yield per ton was slightly higher in the case of ss-OFMSW (111.1 m3/ton), compared to ms-OFMSW (105.3 m3/ton), followed by the higher methane concentration: 58–60% and 51–53%, respectively. Yearly electricity production capacity was almost 700 MWh higher (3285.4 vs. 3932.9 MWh) for ss-OFMSW digestion. However, the AD performance with ss-OFMWS still has to be verified, mainly at full scale, considering the agricultural use of by-products.
The obtained VFA concentrations, at levels around 1.2 g/kg, pH values (slightly above 8.0), acidity, and alkalinity, indicate the possibilities of the digester feeding and no-risk exploitation of using either as feedstock.
AD is a suitable treatment method for both OFMSWs. It can be found that, compared to ms-OFMSW, ss-OFMSW brings more benefits: higher biogas yield and electricity production potential, as well as lower pre-treatment costs. Moreover, the by-products of ss-OFMSW AD seem to have more organic recycling possibilities. The digestate and the effluents from ss-OFMSW AD might have an agricultural application, while the ms-OFMSW digestion might generate almost the same quantity of waste. Further research on the use of the digestate from ss-OFMSW AD systems is recommended, as it might be possible to recover the nutrients for agricultural purposes. Nonetheless, the environmental safety of such solutions should be assessed prior to wide application.

Author Contributions

P.S. and M.K. conceived and designed the experiments; P.S., A.S., and Ł.N. performed the experiments; P.S., H.P.-K., and A.U. analyzed the data; H.P.-K. and A.U. contributed reagents/materials/analysis tools; P.S., M.K., A.S., and Ł.N. wrote and revised the paper. All authors have read and agreed to the published version of the manuscript.

Funding

This research received no external funding.

Acknowledgments

This research was supported by Zakład Gospodarki Odpadami GAĆ in Poland. The proofreading for English language was supported by David Harrold.

Conflicts of Interest

The authors declare no conflict of interest.

References

  1. Arumugam, A.; Ponnusami, V. Biodiesel Production from Calophyllum Inophyllum Oil a Potential Non-Edible Feedstock: An Overview. Renew. Energy 2019, 131, 459–471. [Google Scholar] [CrossRef]
  2. Heidari, R.; Yazdanparast, R.; Jabbarzadeh, A. Sustainable Design of a Municipal Solid Waste Management System Considering Waste Separators: A Real-World Application. Sustain. Cities Soc. 2019, 47, 101457. [Google Scholar] [CrossRef]
  3. Deus, R.M.M.; Mele, F.D.D.; Bezerra, B.S.S.; Battistelle, R.A.G.A.G. A Municipal Solid Waste Indicator for Environmental Impact: Assessment and Identification of Best Management Practices. J. Clean. Prod. 2020, 242, 118433. [Google Scholar] [CrossRef]
  4. Seadon, J.K. Sustainable Waste Management Systems. J. Clean. Prod. 2010, 18, 1639–1651. [Google Scholar] [CrossRef]
  5. Panigrahi, S.; Dubey, B.K. A Critical Review on Operating Parameters and Strategies to Improve the Biogas Yield From Anaerobic Digestion of Organic Fraction of Municipal Solid Waste. Renew. Energy 2019, 143, 779–797. [Google Scholar] [CrossRef]
  6. Dieckmann, E.; Sheldrick, L.; Tennant, M.; Myers, R.; Cheeseman, C. Analysis of Barriers to Transitioning from a Linear to a Circular Economy for End of Life Materials: A Case Study for Waste Feathers. Sustainability 2020, 12, 1725. [Google Scholar] [CrossRef] [Green Version]
  7. Seruga, P.; Krzywonos, M.; Wilk, M. Thermophilic Co-Digestion of the Organic Fraction of Municipal Solid Wastes—The Influence of Food Industry Wastes Addition on Biogas Production in Full-Scale Operation. Molcules 2018, 23. [Google Scholar] [CrossRef] [Green Version]
  8. Abad, V.; Avila, R.; Vicent, T.; Font, X. Promoting Circular Economy in the Surroundings of an Organic Fraction of Municipal Solid Waste Anaerobic Digestion Treatment Plant: Biogas Production Impact and Economic Factors. Bioresour. Technol. 2019, 283, 10–17. [Google Scholar] [CrossRef]
  9. Zaman, A.U. A Comprehensive Study of the Environmental and Economic Benefits of Resource Recovery from Global Waste Management Systems. J. Clean. Prod. 2016, 124, 41–50. [Google Scholar] [CrossRef]
  10. Kaza, S.; Yao, L.; Bhada-Tata, P.; Van Woerden, F. What a Waste 2.0: A Global Snapshot of Solid Waste Management to 2050; The World Bank: Washington, DC, USA, 2018. [Google Scholar]
  11. Bányai, T.; Tamás, P.; Illés, B.; Stankevičiūtė, Ž.; Bányai, Á. Optimization of Municipal Waste Collection Routing: Impact of Industry 4.0 Technologies on Environmental Awareness and Sustainability. Int. J. Environ. Res. Public Health 2019, 16. [Google Scholar] [CrossRef] [Green Version]
  12. Seruga, P.; Krzywonos, M.; Wilk, M. Treatment of By-Products Generated from Anaerobic Digestion of Municipal Solid Waste. Waste Biomass Valorization 2019. [Google Scholar] [CrossRef] [Green Version]
  13. Yang, Q.; Fu, L.; Liu, X.; Cheng, M. Evaluating the Efficiency of Municipal Solid Waste Management in China. Int. J. Environ. Res. Public Health 2018, 15. [Google Scholar] [CrossRef] [PubMed] [Green Version]
  14. Lim, L.S.; Lee, L.H.; Wu, T.Y. Sustainability of Using Composting and Vermicomposting Technologies for Organic Solid Waste Biotransformation: Recent Overview, Greenhouse Gases Emissions and Economic Analysis. J. Clean. Prod. 2016, 111, 262–278. [Google Scholar] [CrossRef]
  15. Bölükbaş, A.; Aklncl, G. Solid Waste Composition and the Properties of Biodegradable Fractions in Izmir City, Turkey: An Investigation on the Influencing Factors. J. Environ. Heal. Sci. Eng. 2018, 16, 299–311. [Google Scholar] [CrossRef]
  16. Carmo-Calado, L.; Hermoso-Orzáez, M.J.; Mota-Panizio, R.; Guilherme-Garcia, B.; Brito, P. Co-Combustion of Waste Tires and Plastic-Rubber Wastes with Biomass Technical and Environmental Analysis. Sustainbility 2020, 12, 1036. [Google Scholar] [CrossRef] [Green Version]
  17. Kluska, J.; Ochnio, M.; Kardaś, D. Carbonization of Corncobs for the Preparation of Barbecue Charcoal and Combustion Characteristics of Corncob Char. Waste Manag. 2020, 105, 560–565. [Google Scholar] [CrossRef]
  18. Pavi, S.; Kramer, L.E.; Gomes, L.P.; Miranda, L.A.S. Biogas Production from Co-Digestion of Organic Fraction of Municipal Solid Waste and Fruit and Vegetable Waste. Bioresour. Technol. 2017, 228, 362–367. [Google Scholar] [CrossRef]
  19. Khoshnevisan, B.; Tsapekos, P.; Alvarado-Morales, M.; Angelidaki, I. Process Performance and Modelling of Anaerobic Digestion Using Source-Sorted Organic Household Waste. Bioresour. Technol. 2018, 247, 486–495. [Google Scholar] [CrossRef] [Green Version]
  20. Pawlak-Kruczek, H.; Niedzwiecki, L.; Sieradzka, M.; Mlonka-Mędrala, A.; Baranowski, M.; Serafin-Tkaczuk, M.; Magdziarz, A. Hydrothermal Carbonization of Agricultural and Municipal Solid Waste Digestates—Structure and Energetic Properties of the Solid Products. Fuel 2020, 275. [Google Scholar] [CrossRef]
  21. Banks, C.J.; Chesshire, M.; Heaven, S.; Arnold, R. Anaerobic Digestion of Source-Segregated Domestic Food Waste: Performance Assessment by Mass and Energy Balance. Bioresour. Technol. 2011, 102, 612–620. [Google Scholar] [CrossRef] [Green Version]
  22. Beggio, G.; Schievano, A.; Bonato, T.; Hennebert, P.; Pivato, A. Statistical Analysis for the Quality Assessment of Digestates from Separately Collected Organic Fraction of Municipal Solid Waste (OFMSW) and Agro-Industrial Feedstock. Should Input Feedstock to Anaerobic Digestion Determine the Legal Status of Digestate? Waste Manag. 2019, 87, 546–558. [Google Scholar] [CrossRef] [PubMed]
  23. Di Maria, F.; Micale, C.; Morettini, E. Impact of the Pre-Collection Phase at Different Intensities of Source Segregation of Bio-Waste: An Italian Case Study. Waste Manag. 2016, 53, 12–21. [Google Scholar] [CrossRef] [PubMed]
  24. Demirbas, A. Biogas Production from the Organic Fraction of Municipal Solid Waste. Energy Sources Part A Recover. Util. Environ. Eff. 2006, 28, 1127–1134. [Google Scholar] [CrossRef]
  25. Linville, J.L.; Shen, Y.; Wu, M.M.; Urgun-Demirtas, M. Current State of Anaerobic Digestion of Organic Wastes in North America. Curr. Sustain. Energy Rep. 2015, 2, 136–144. [Google Scholar] [CrossRef] [Green Version]
  26. Jamal, M.; Szefler, A.; Kelly, C.; Bond, N. Commercial and Household Food Waste Separation Behaviour and the Role of Local Authority: A Case Study. Int. J. Recycl. Org. Waste Agric. 2019, 8, 281–290. [Google Scholar] [CrossRef] [Green Version]
  27. Stretton-Maycock, D.; Merrington, G. The Use and Application to Land of MBT Compost-Like Output—Review of Current European Practice in Relation to Environmental Protection; Environment Agency: Bristol, UK, 2009.
  28. Paritosh, K.; Kushwaha, S.K.; Yadav, M.; Pareek, N.; Chawade, A.; Vivekanand, V. Food Waste to Energy: An Overview of Sustainable Approaches for Food Waste Management and Nutrient Recycling. Biomed Res. Int. 2017, 2017, 1–19. [Google Scholar] [CrossRef]
  29. Rice, E.W.; Baird, R.B.; Eaton, A.D.; Clesceri, L.E. APHA, AWWA, WEF. Standard Methods for Examination of Water and Wastewater, 22nd ed.; American Public Health Association: Washington, DC, USA, 2012. [Google Scholar]
  30. Guendouz, J.; Buffière, P.; Cacho, J.; Carrère, M.; Delgenes, J. Dry Anaerobic Digestion in Batch Mode: Design and Operation of a Laboratory-Scale, Completely Mixed Reactor. Waste Manag. 2010, 30, 1768–1771. [Google Scholar] [CrossRef]
  31. Campuzano, R.; González-Martínez, S. Characteristics of the Organic Fraction of Municipal Solid Waste and Methane Production: A Review. Waste Manag. 2016, 54, 3–12. [Google Scholar] [CrossRef]
  32. Li, Y.; Chen, Y.; Wu, J. Enhancement of Methane Production in Anaerobic Digestion Process: A Review. Appl. Energy 2019, 240, 120–137. [Google Scholar] [CrossRef]
  33. Drosg, B. Process Monitoring in Biogas Plants; IEA Bioenergy: Tulln, Austria, 2013; ISBN 9781910154038. [Google Scholar]
  34. Wu, D.; Li, L.; Zhao, X.; Peng, Y.; Yang, P.; Peng, X. Anaerobic Digestion: A Review on Process Monitoring. Renew. Sustain. Energy Rev. 2019, 103, 1–12. [Google Scholar] [CrossRef]
  35. Owusu-Agyeman, I.; Plaza, E.; Cetecioglu, Z. Production of Volatile Fatty Acids Through Co-Digestion of Sewage Sludge and External Organic Waste: Effect of Substrate Proportions and Long-Term Operation. Waste Manag. 2020, 112, 30–39. [Google Scholar] [CrossRef] [PubMed]
  36. Tampio, E.A.; Blasco, L.; Vainio, M.M.; Kahala, M.M.; Rasi, S.E. Volatile Fatty Acids (VFAs) and Methane from Food Waste and Cow Slurry: Comparison of Biogas and VFA Fermentation Processes. GCB Bioenergy 2019, 11, 72–84. [Google Scholar] [CrossRef]
  37. Kor-Bicakci, G.; Ubay-Cokgor, E.; Eskicioglu, C. Comparative Analysis of Bacterial and Archaeal Community Structure in Microwave Pretreated Thermophilic and Mesophilic Anaerobic Digesters Utilizing Mixed Sludge under Organic Overloading. Water (Switz.) 2020, 12. [Google Scholar] [CrossRef] [Green Version]
Figure 1. Simplified diagram of the anaerobic digestion (AD) facility: 1: municipal solid waste (MSW) mechanical treatment; 2: mechanically sorted organic fraction of municipal solid waste (ms-OFMSW) loading; 3: digester operating on ms-OFMWS; 4: biowaste sorting and shredding; 5: segregated at source organic fraction of municipal solid waste (ss-OFMSW) loading; 6: digester operating on ss-OFMSW; 7: combined heat and power (CHP) units; A: MSW delivered to mechanical-biological treatment (MBT) plant; B: ms-OFMSW feedstock for digester; C: separate collected biowaste delivered to MBT plant; D: ss-OFMSW feedstock for digester; E: biogas.
Energies 13 03768 g001
Figure 2. Biogas yield and digester filling changes during organic fraction of municipal solid waste (OFMSW) digestions: (a) mechanically sorted; (b) segregated at source.
Energies 13 03768 g002
Figure 3. Input and output changes during organic fraction of municipal solid waste (OFMSW) digestions: (a) mechanically sorted; (b) segregated at source.
Energies 13 03768 g003aEnergies 13 03768 g003b
Figure 4. Parameter changes in the course of the mechanically sorted organic fraction of municipal solid waste anaerobic digestion process at full scale: (a) pH value; (b) suspended solids; (c) ammonium ion concentration; (d) acidity; (e) alkalinity.
Energies 13 03768 g004
Figure 5. The changes in the concentration of fatty acids in the course of the mechanically sorted organic fraction of municipal solid waste anaerobic digestion at full scale: (a) acetic acid; (b) propionic acid; (c) butyric acid.
Energies 13 03768 g005
Figure 6. Parameter changes in the course of the segregated at source organic fraction of municipal solid waste anaerobic digestion process at full scale: (a) pH value; (b) suspended solids; (c) ammonium ion concentration; (d) acidity; (e) alkalinity.
Energies 13 03768 g006aEnergies 13 03768 g006b
Figure 7. The changes in the concentration of fatty acids in the course of the segregated at source organic fraction of municipal solid waste anaerobic digestion at full scale: (a) acetic acid; (b) propionic acid; (c) butyric acid.
Energies 13 03768 g007aEnergies 13 03768 g007b
Table 1. The composition of the mechanically sorted organic fraction of municipal solid waste (ms-OFMSW).
FractionMass Share
Organic (incl. green waste) (%)48.3 ± 2.7
Wood (%)7.2 ± 0.8
Paper (%)3.6 ± 0.8
Plastics (%)3.9 ± 0.7
Glass (%)3.6 ± 1.1
Inert waste (%)2.9 ± 1.0
Textiles (%)0.3 ± 0.5
Metals (%)0.1 ± 0.1
Hazardous (%)0.1 ± 0.1
Tetra Pak (%)0.7 ± 0.2
Others (%)0.6 ± 0.2
Fine fraction 0–15 mm (%)28.7 ± 3.8
Table 2. The composition of the segregated at source organic fraction of municipal solid waste (ss-OFMSW).
FractionMass Share
Organic (incl. green waste) (%)68.1 ± 5.2
Wood (%)8.1 ± 0.5
Paper (%)2.4 ± 0.7
Plastics (%)1.1 ± 0.4
Glass (%)0.8 ± 0.4
Inert waste (%)1. 4 ± 0.9
Textiles (%)0.1 ± 0.4
Metals (%)0.1 ± 0.1
Hazardous (%)0.1 ± 0.1
Tetra Pak (%)0.3 ± 0.1
Others (%)0.4 ± 0.1
Fine fraction 0–15 mm (%)17.1 ± 2.3
Table 3. The characterization of the mechanically sorted and segregated at source organic fractions of municipal solid waste (ms-OFMSW and ss-OFMSW).
Parameterms-OFMSWss-OFMSW
pH (−)7.1 ± 0.28.0 ± 0.2
Suspended solids (SS) (%)49.8 ± 0.346.2 ± 0.3
Ammonium nitrogen (g/L)1453 ± 653879 ± 87
Acidity (mg CH3COOH/kg)655 ± 50463 ± 44
Alkalinity (mg CaCO3/kg)4210 ± 1456758 ± 163
Acetic acid (mg/kg)98 ± 8107 ± 6
Propionic acid (mg/kg)6.0 ± 0.5 3.0 ± 0.5
Butyric acid (mg/kg)1.0 ± 1.01.0 ± 1.0
Isobutyric acid (mg/kg)1.0 ± 1.01.0 ± 1.0
Valeric acid (mg/kg)1.0 ± 1.01.0 ± 1.0
Isovaleric acid (mg/kg)1.0 ± 1.01.0 ± 1.0
Table 4. Electricity production efficiency.
Input MaterialBiogas Yield Yearly Biogas Production CapacityMethane ContentElectrical Production Possibility CHP Units EfficiencyElectricity YieldYearly Electricity Production Capacity
m3/tonm3%kWh/m3CH4%kWh/tonMWh
ms-OFMSW105.31,579,500521040219.03285.4
ss-OFMSW111.11,666,500591040262.23932.9
* Quantities calculated based on mechanical-biological treatment (MBT) plant capacity: 15,000 ton/year/digester; Electricity yield calculated using the formula: biogas yield × methane content × electrical production possibility (10 kWh/m3CH4) × combined heat and power (CHP) unit efficiency (40%); Annual production of electricity based on the formula: annual biogas production capacity × methane content × electrical production possibility (10 kWh/m3CH4) × CHP unit efficiency (40%).

