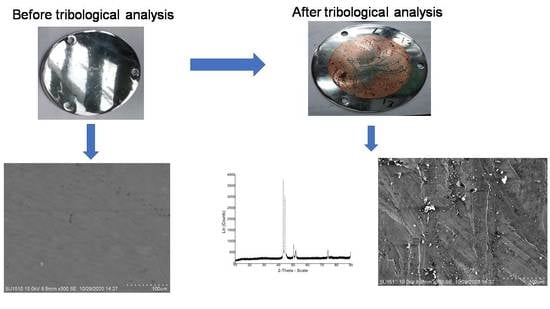
Figure 1.
(a) Block diagram and (b) photograph of disc sample.
Figure 1.
(a) Block diagram and (b) photograph of disc sample.
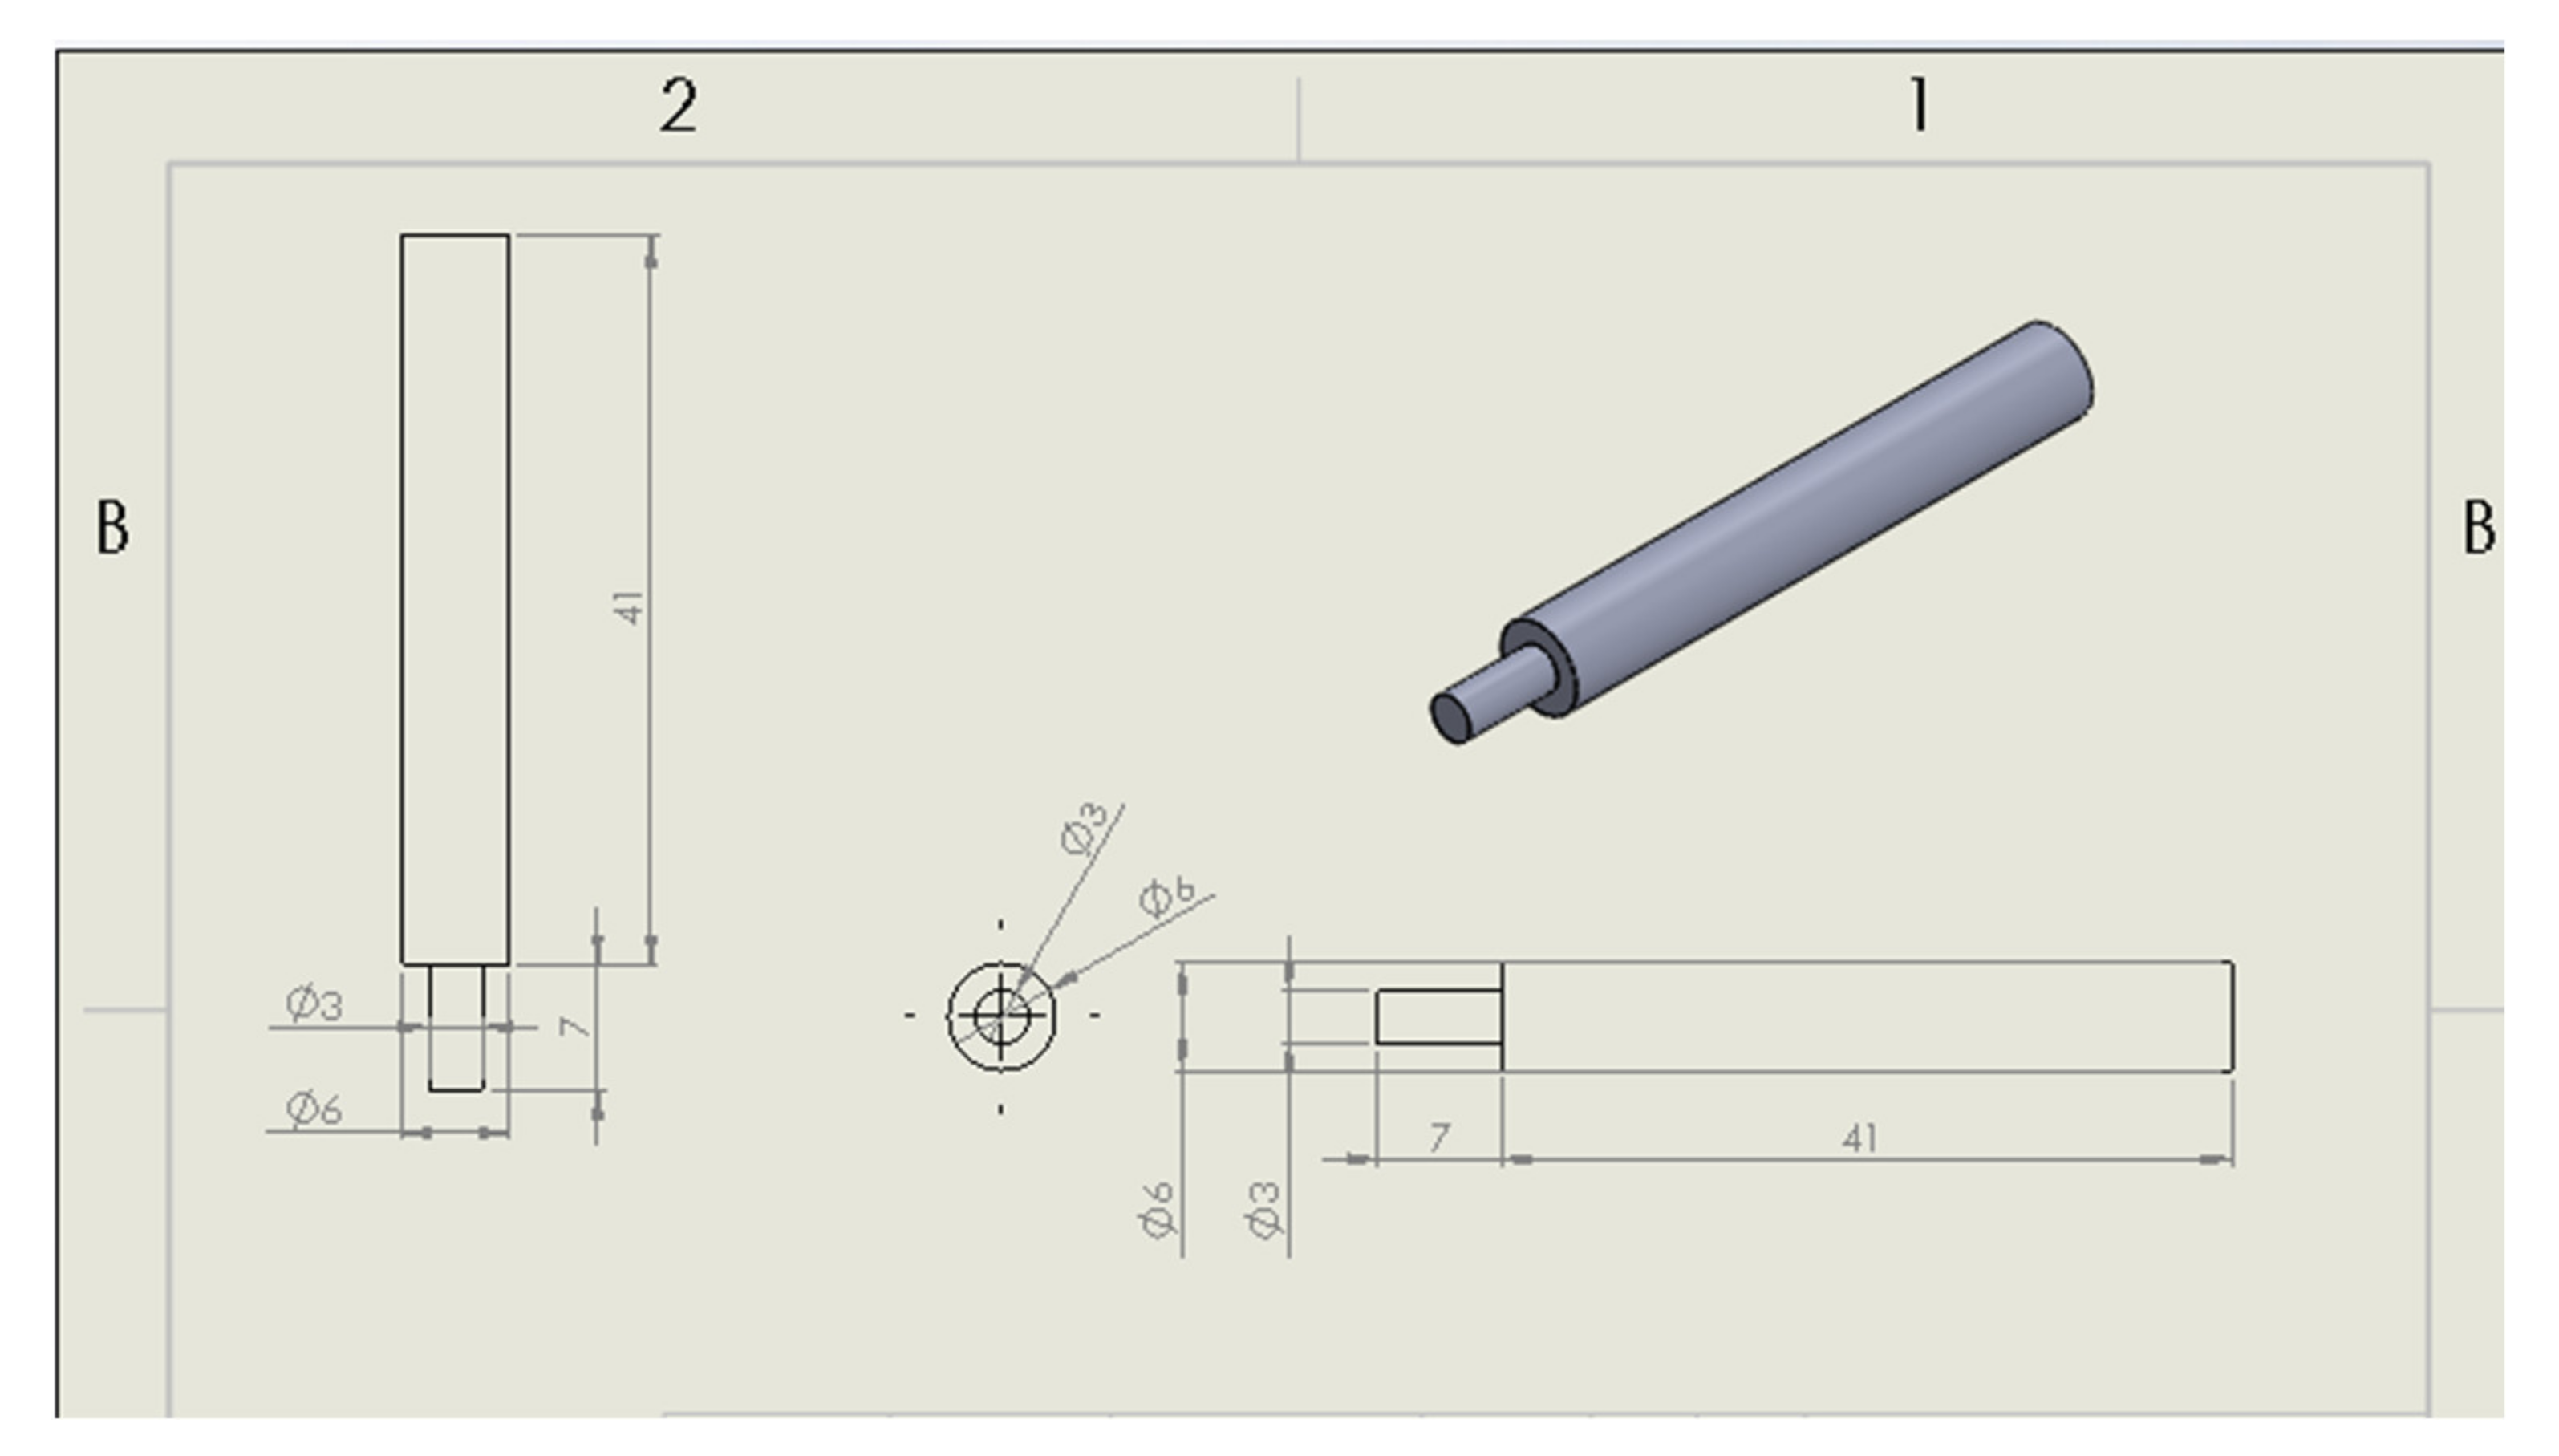
Figure 2.
Projection view of pin sample [
28].
Figure 2.
Projection view of pin sample [
28].
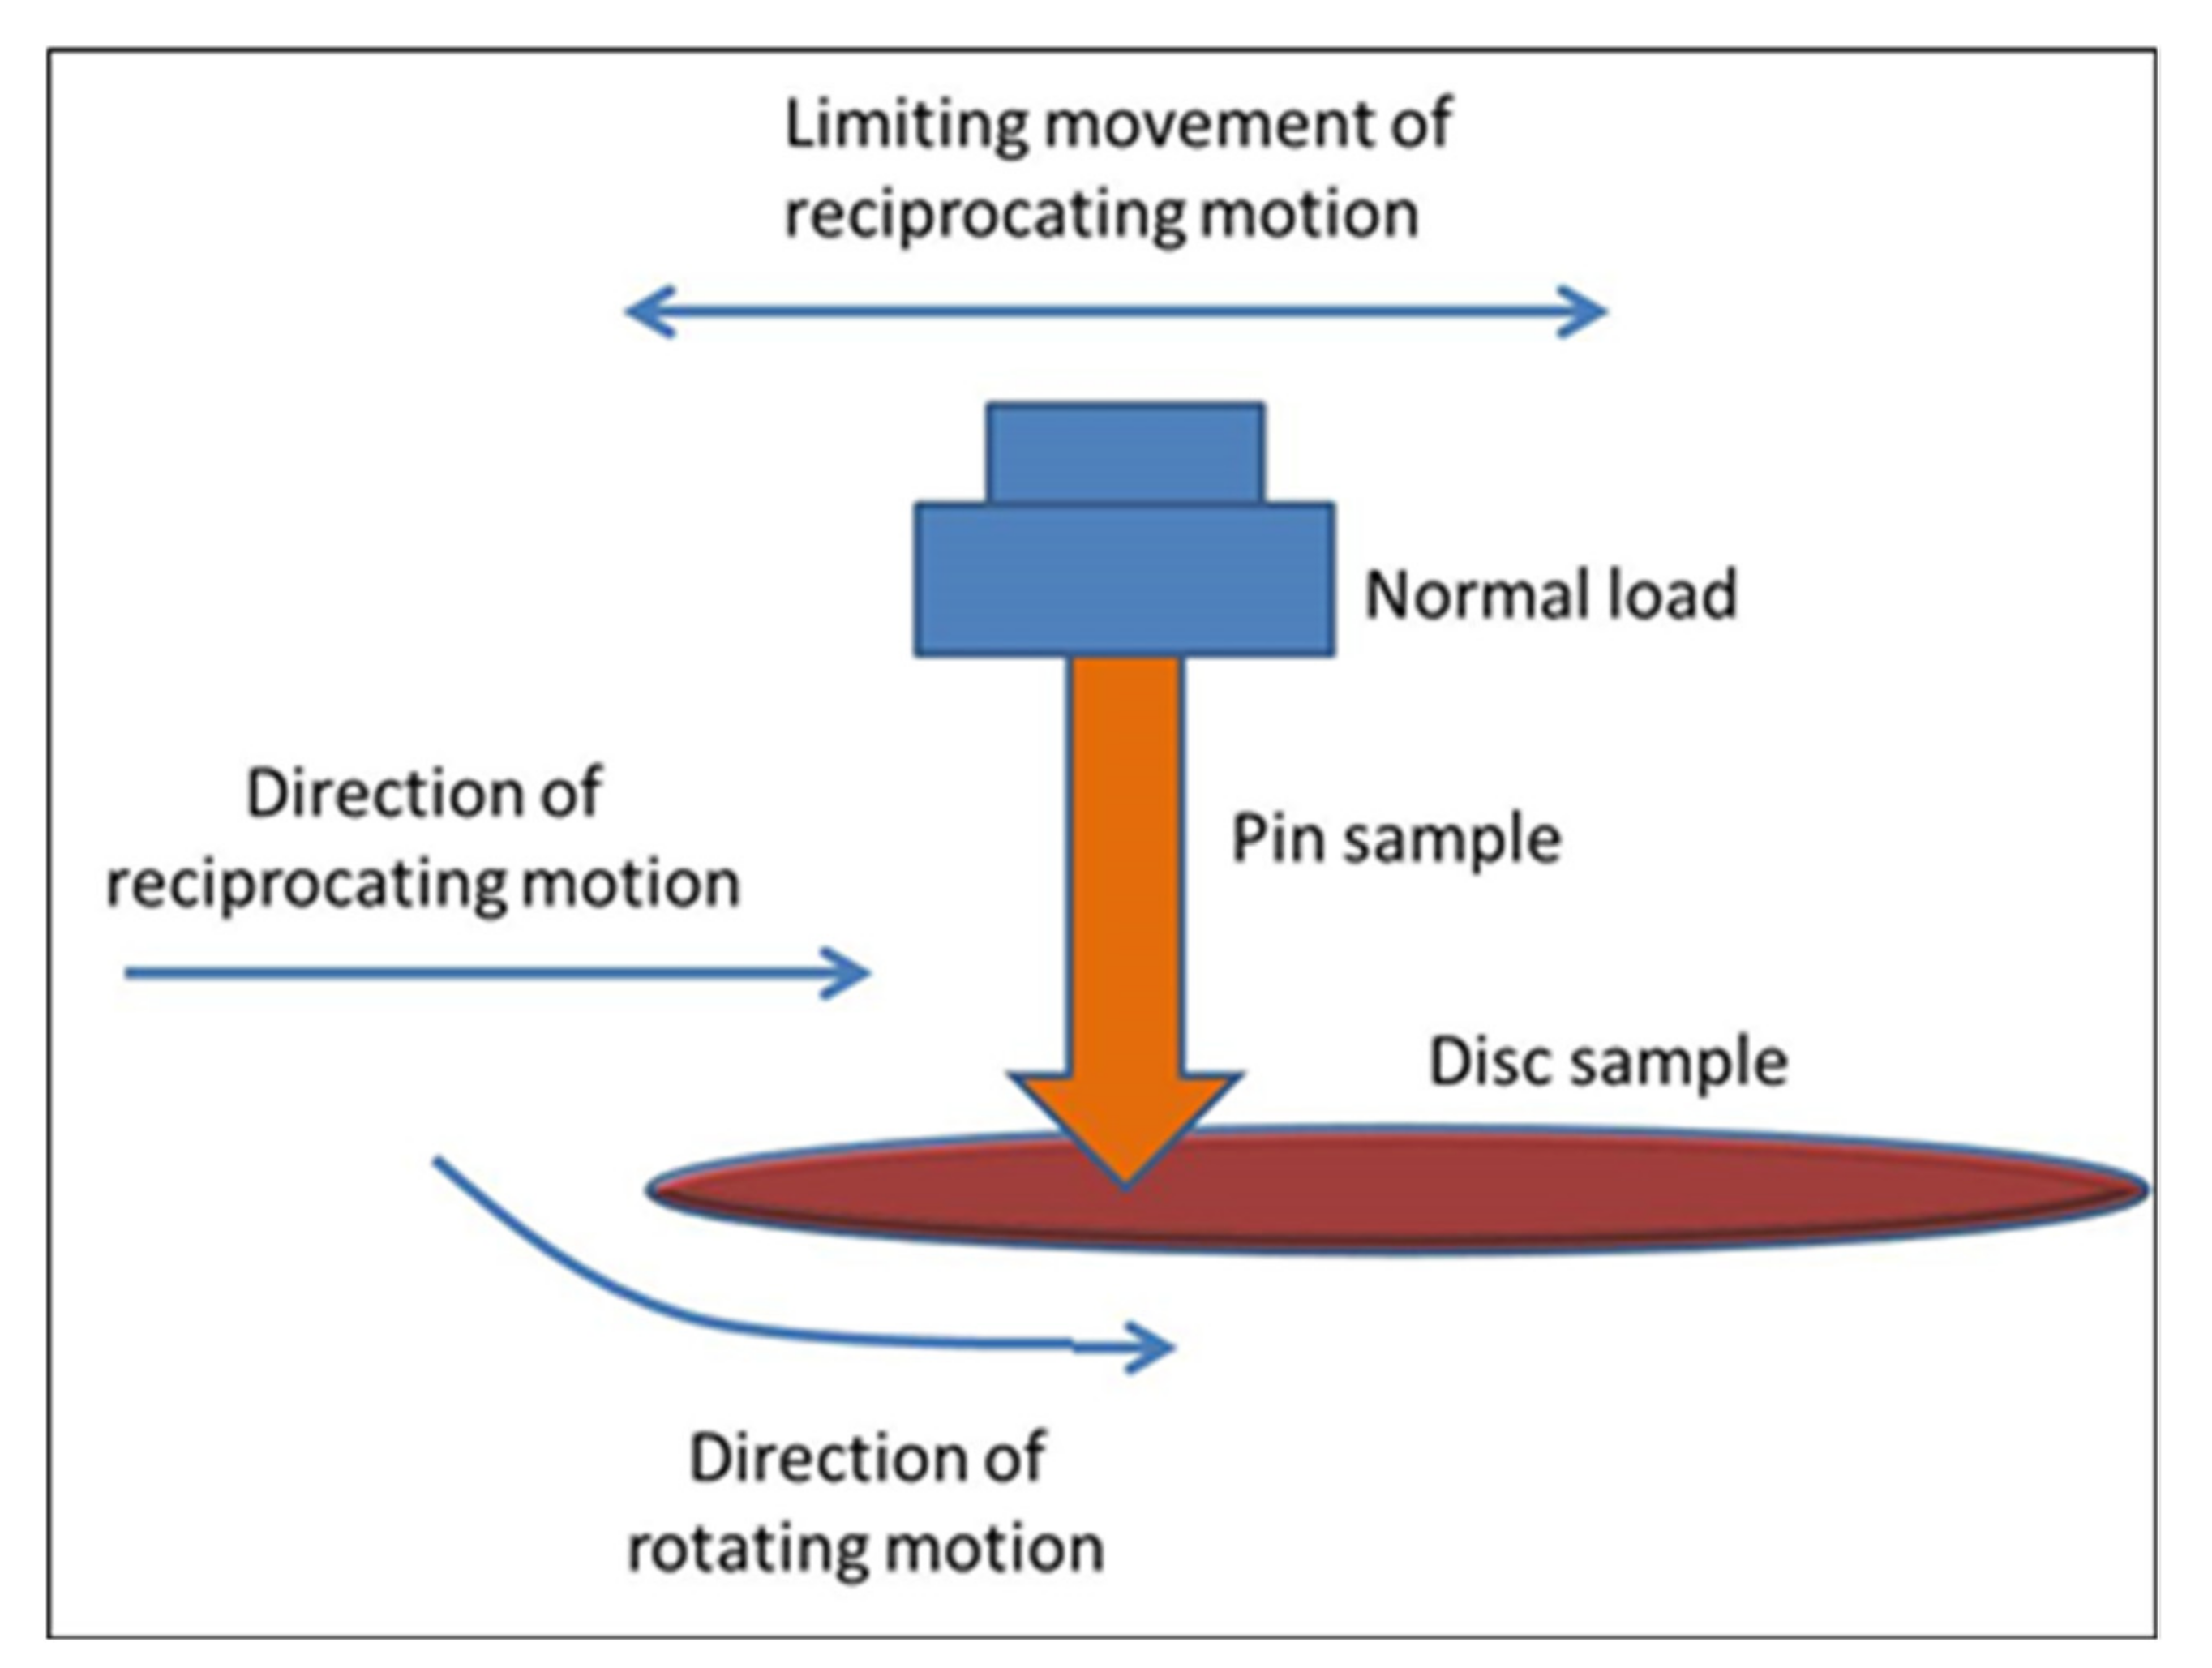
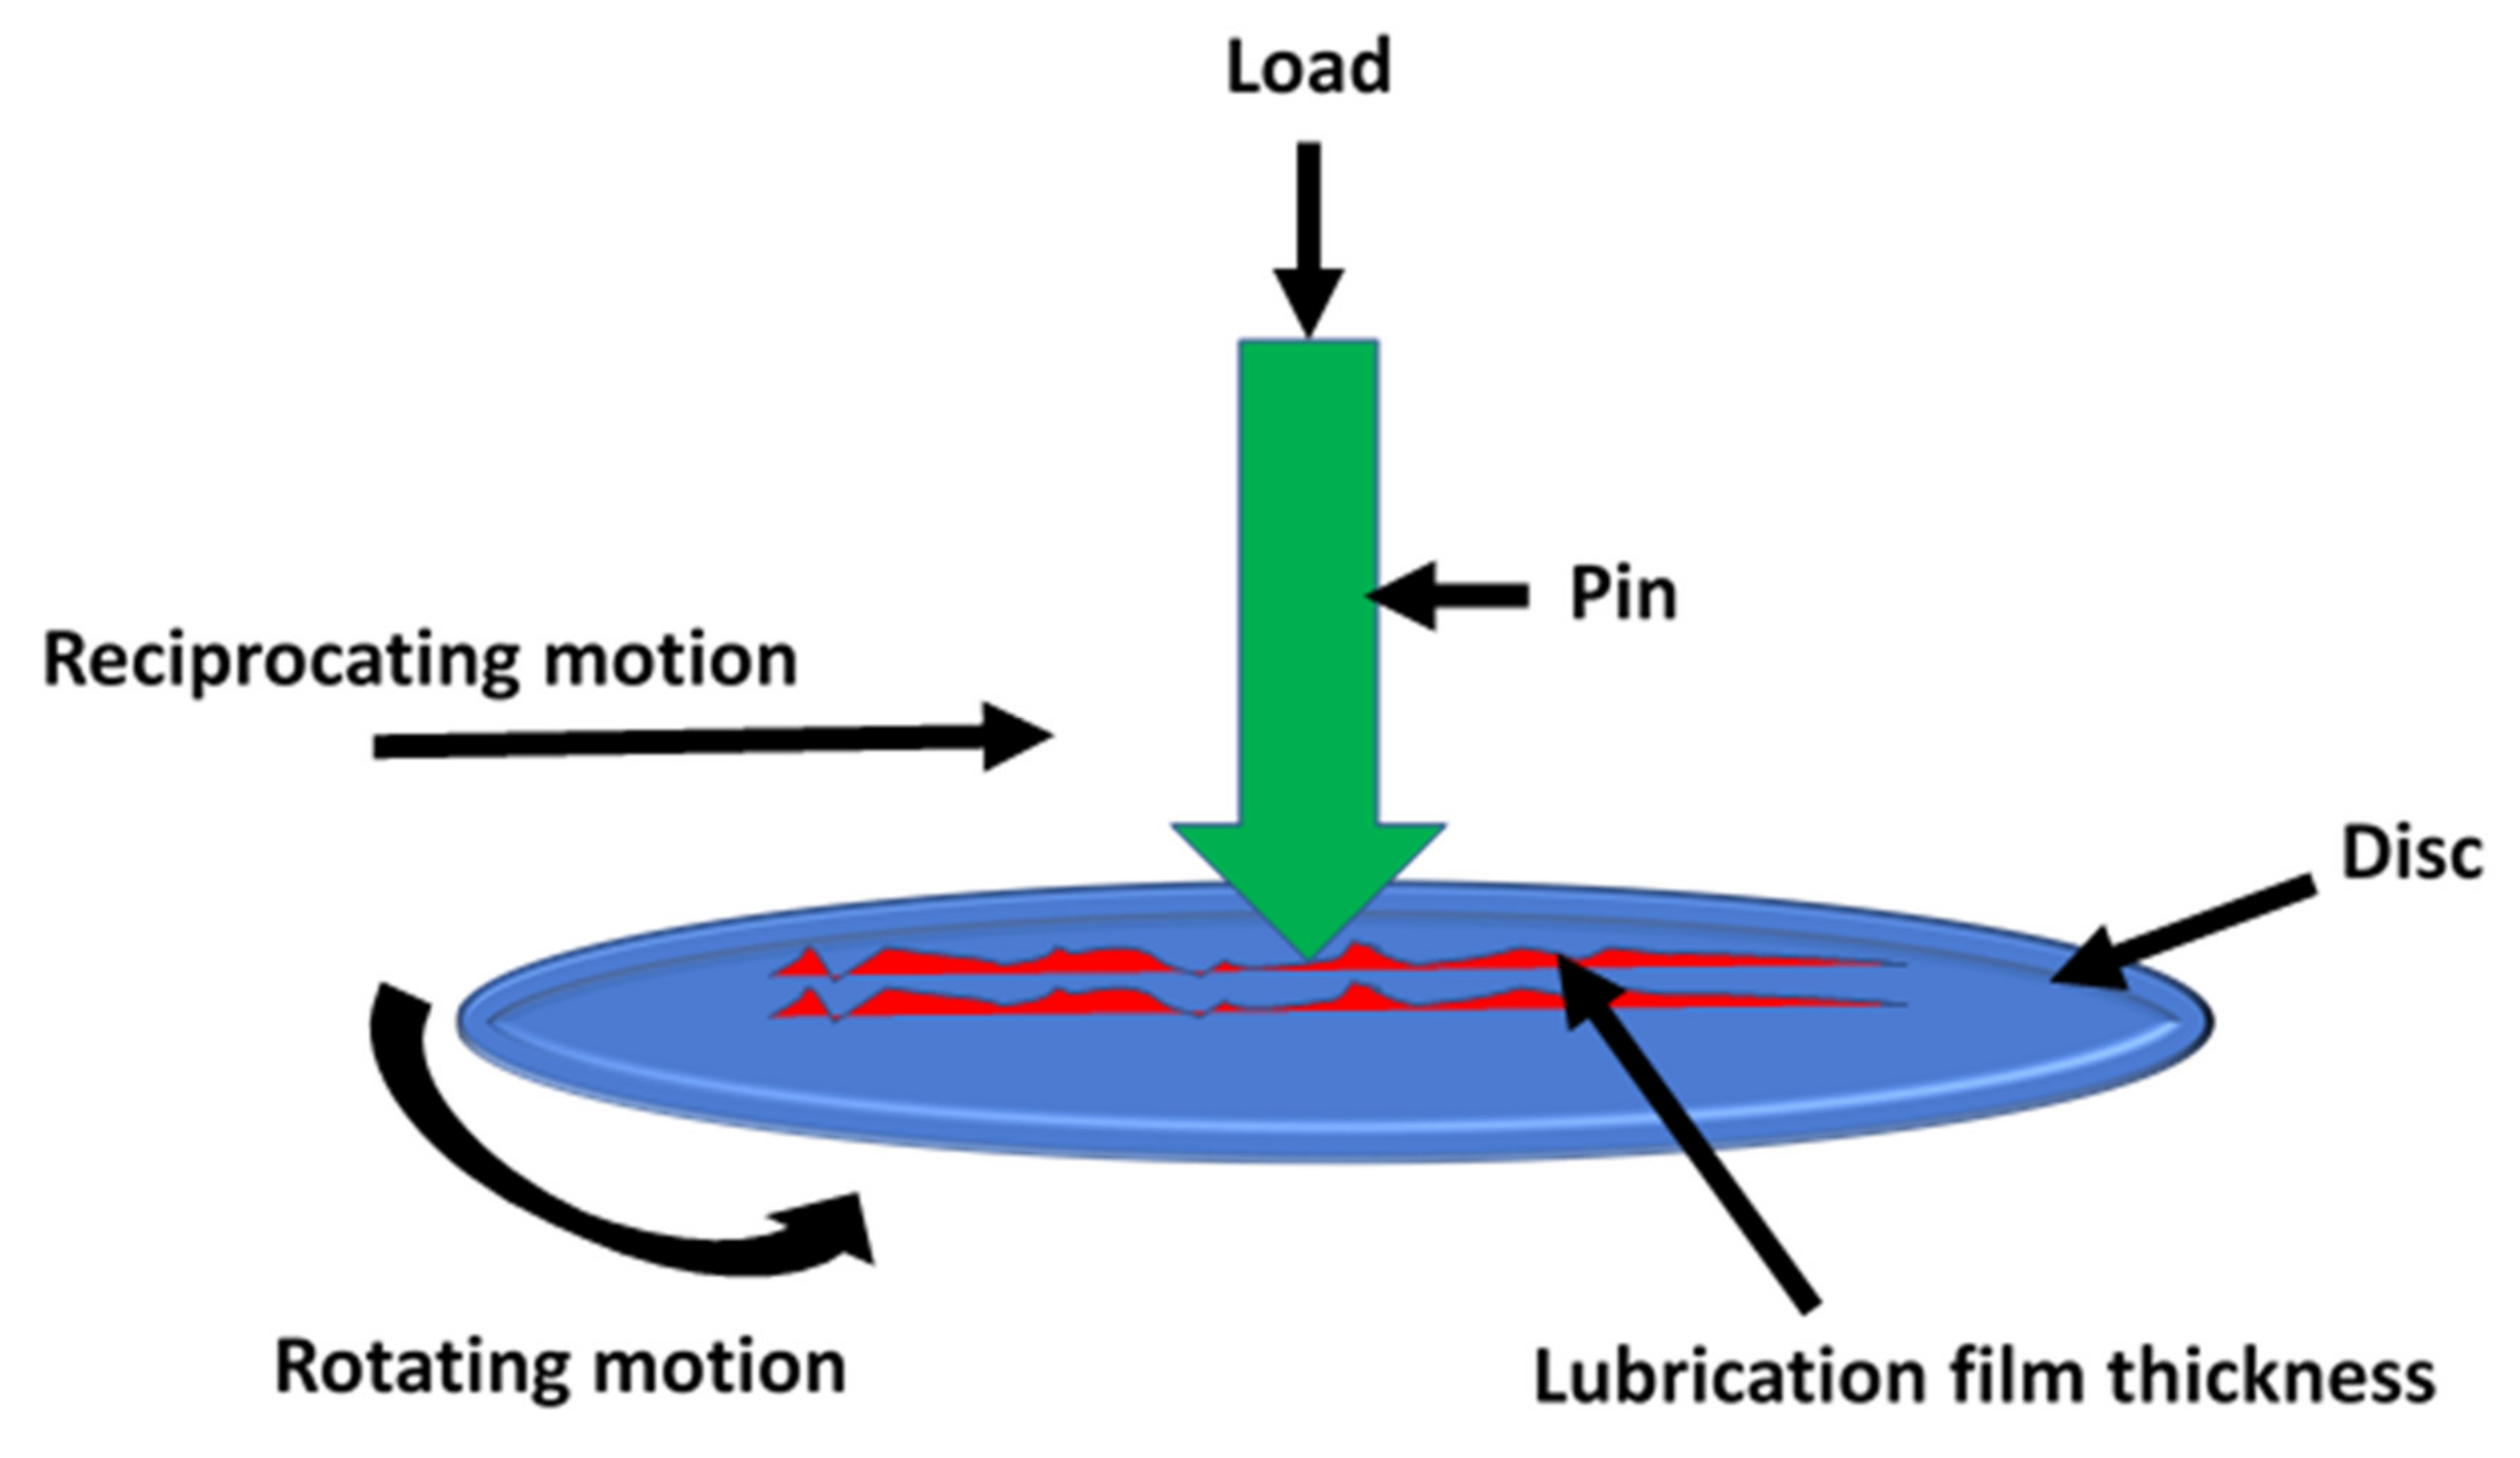
Figure 3.
Schematic diagram of the experimental setup.
Figure 3.
Schematic diagram of the experimental setup.
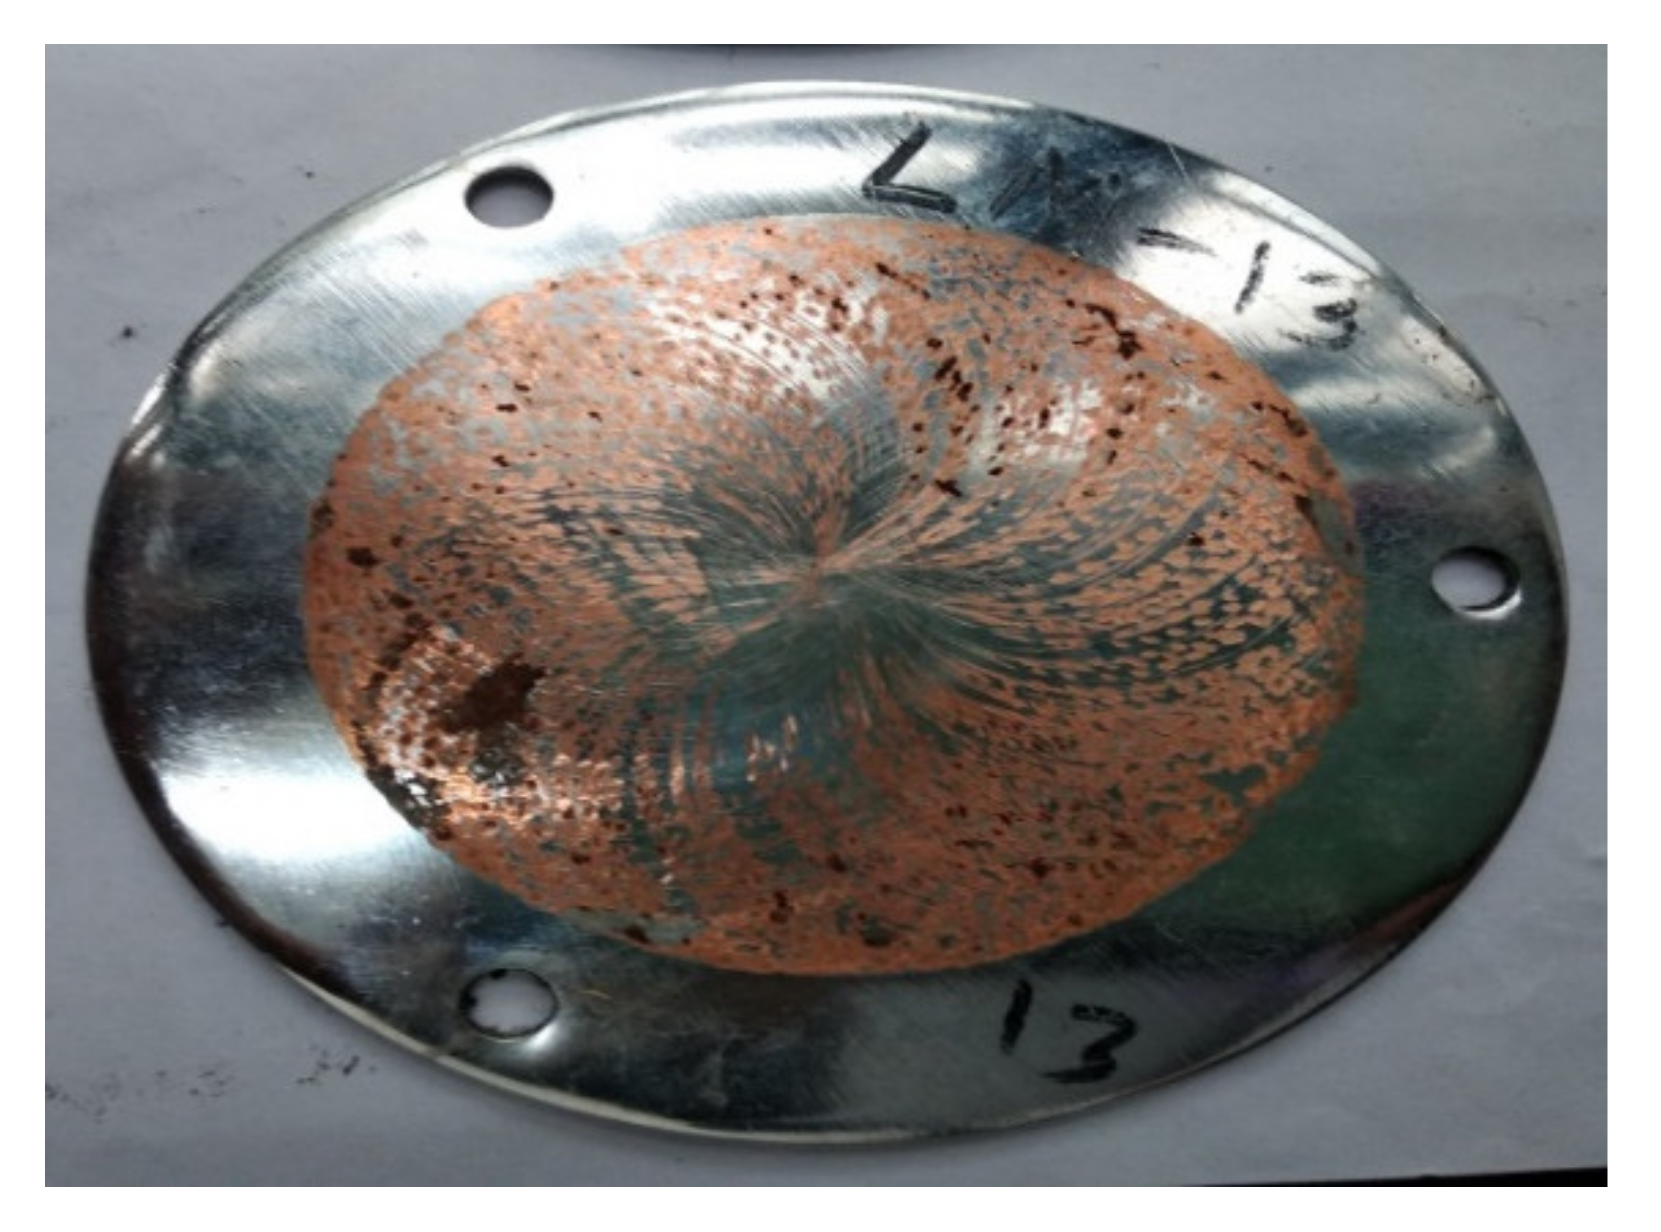
Figure 4.
Disc after frictional analysis.
Figure 4.
Disc after frictional analysis.
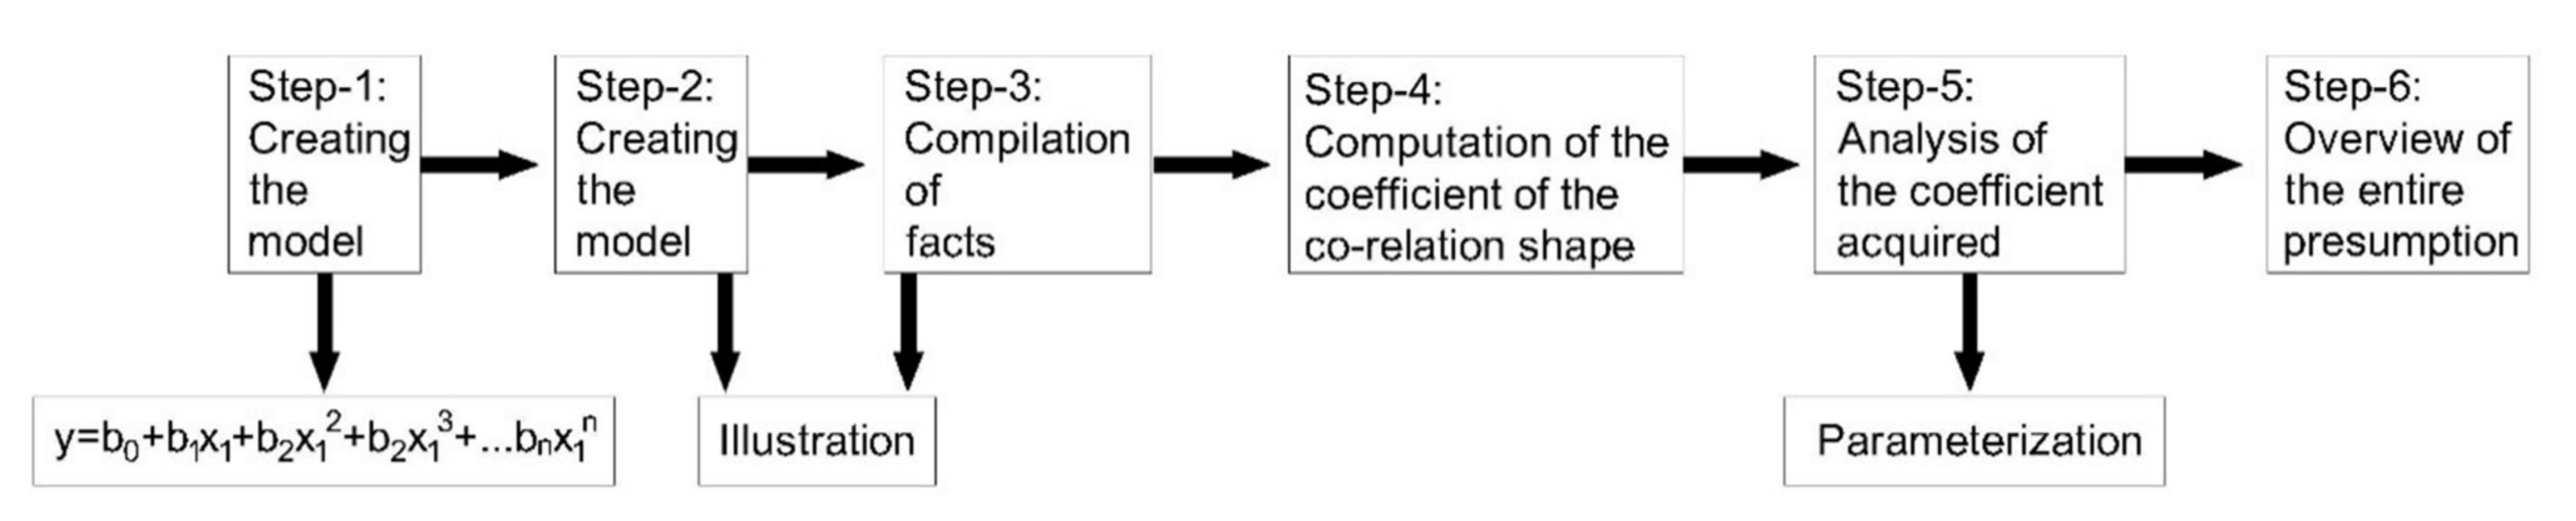
Figure 5.
ML approach flow process chart.
Figure 5.
ML approach flow process chart.
Figure 6.
Electroplated coating behavior on the substrate.
Figure 6.
Electroplated coating behavior on the substrate.
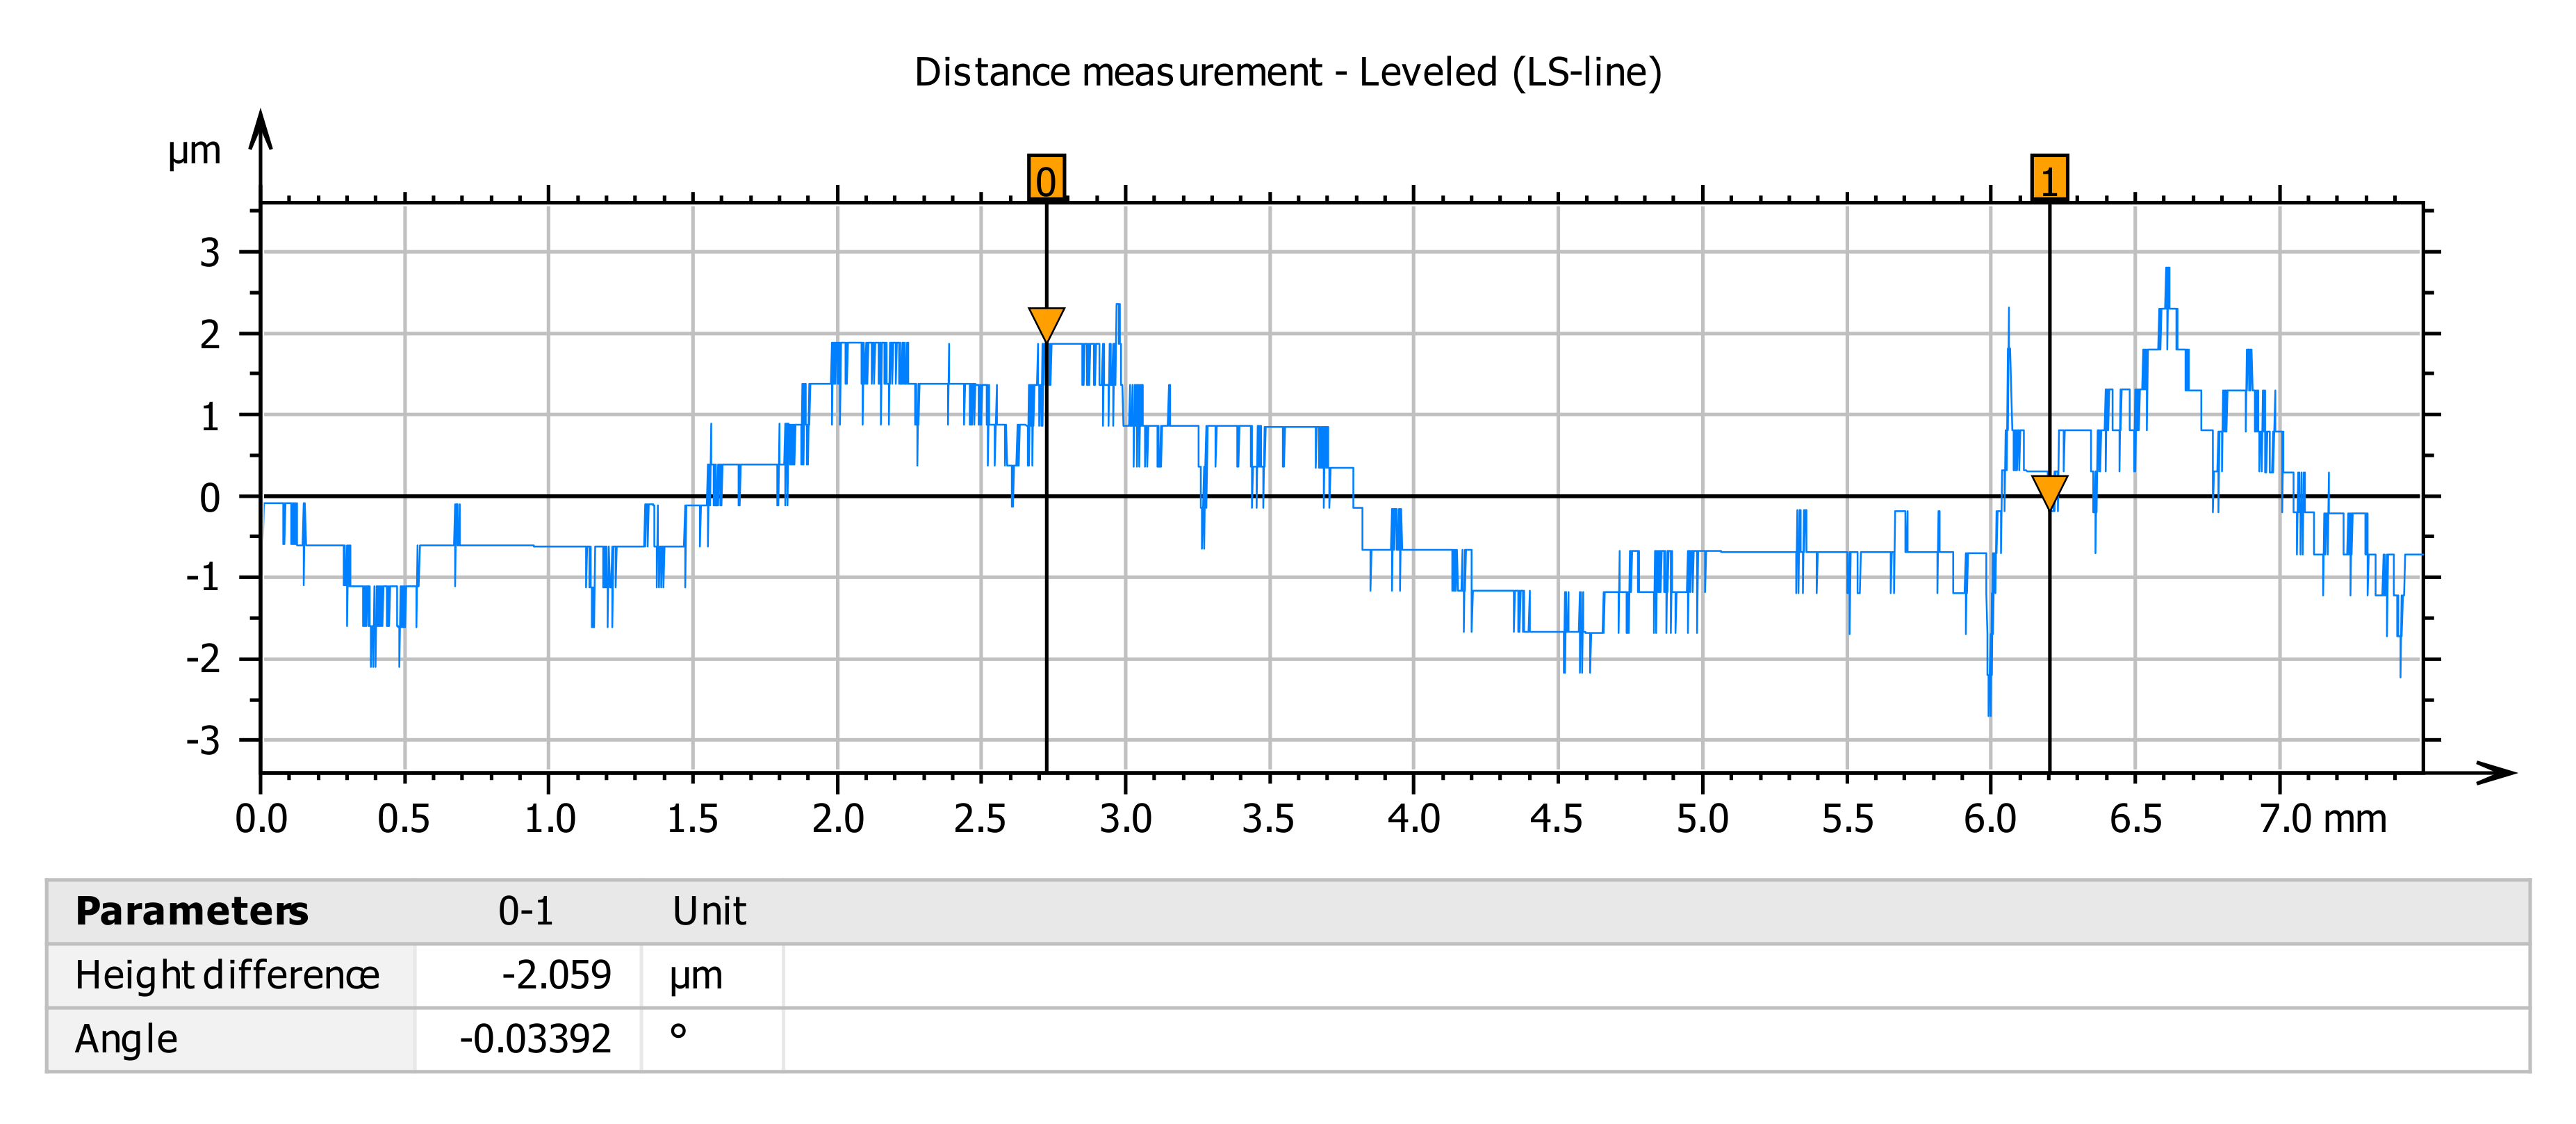
Figure 7.
Analysis of the surface roughness of coated mild steel sample before the tribological test.
Figure 7.
Analysis of the surface roughness of coated mild steel sample before the tribological test.
Figure 8.
Scanning electron microscopy of coating surfaces at (a) 500 µm, (b) 300 µm, (c) 200 µm, (d) 100 µm.
Figure 8.
Scanning electron microscopy of coating surfaces at (a) 500 µm, (b) 300 µm, (c) 200 µm, (d) 100 µm.
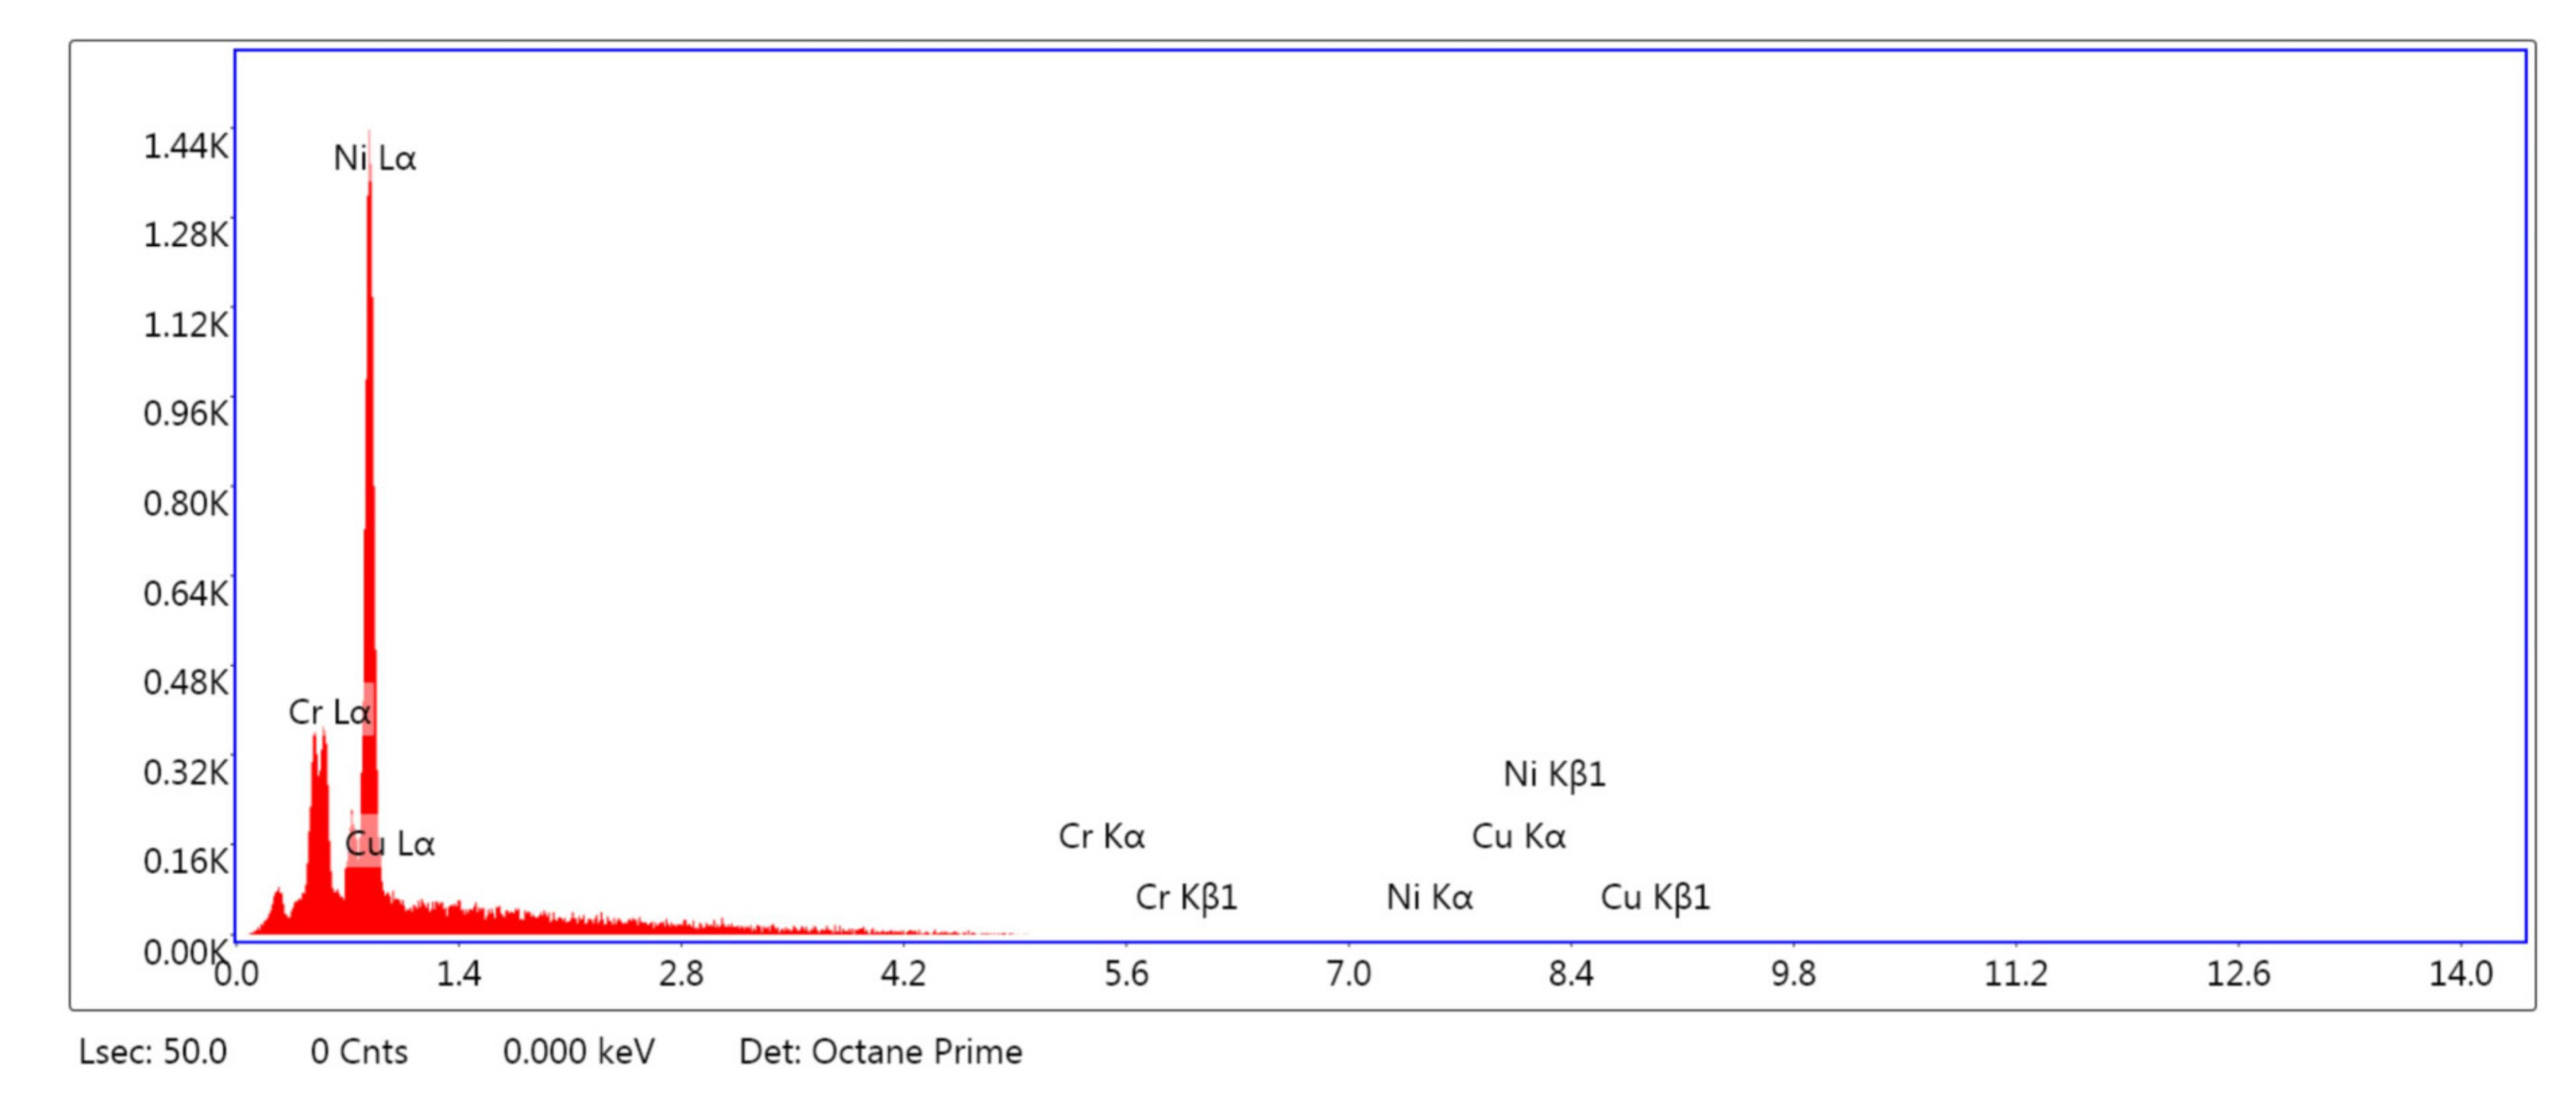
Figure 9.
EDX analysis of coated mild steel specimen.
Figure 9.
EDX analysis of coated mild steel specimen.
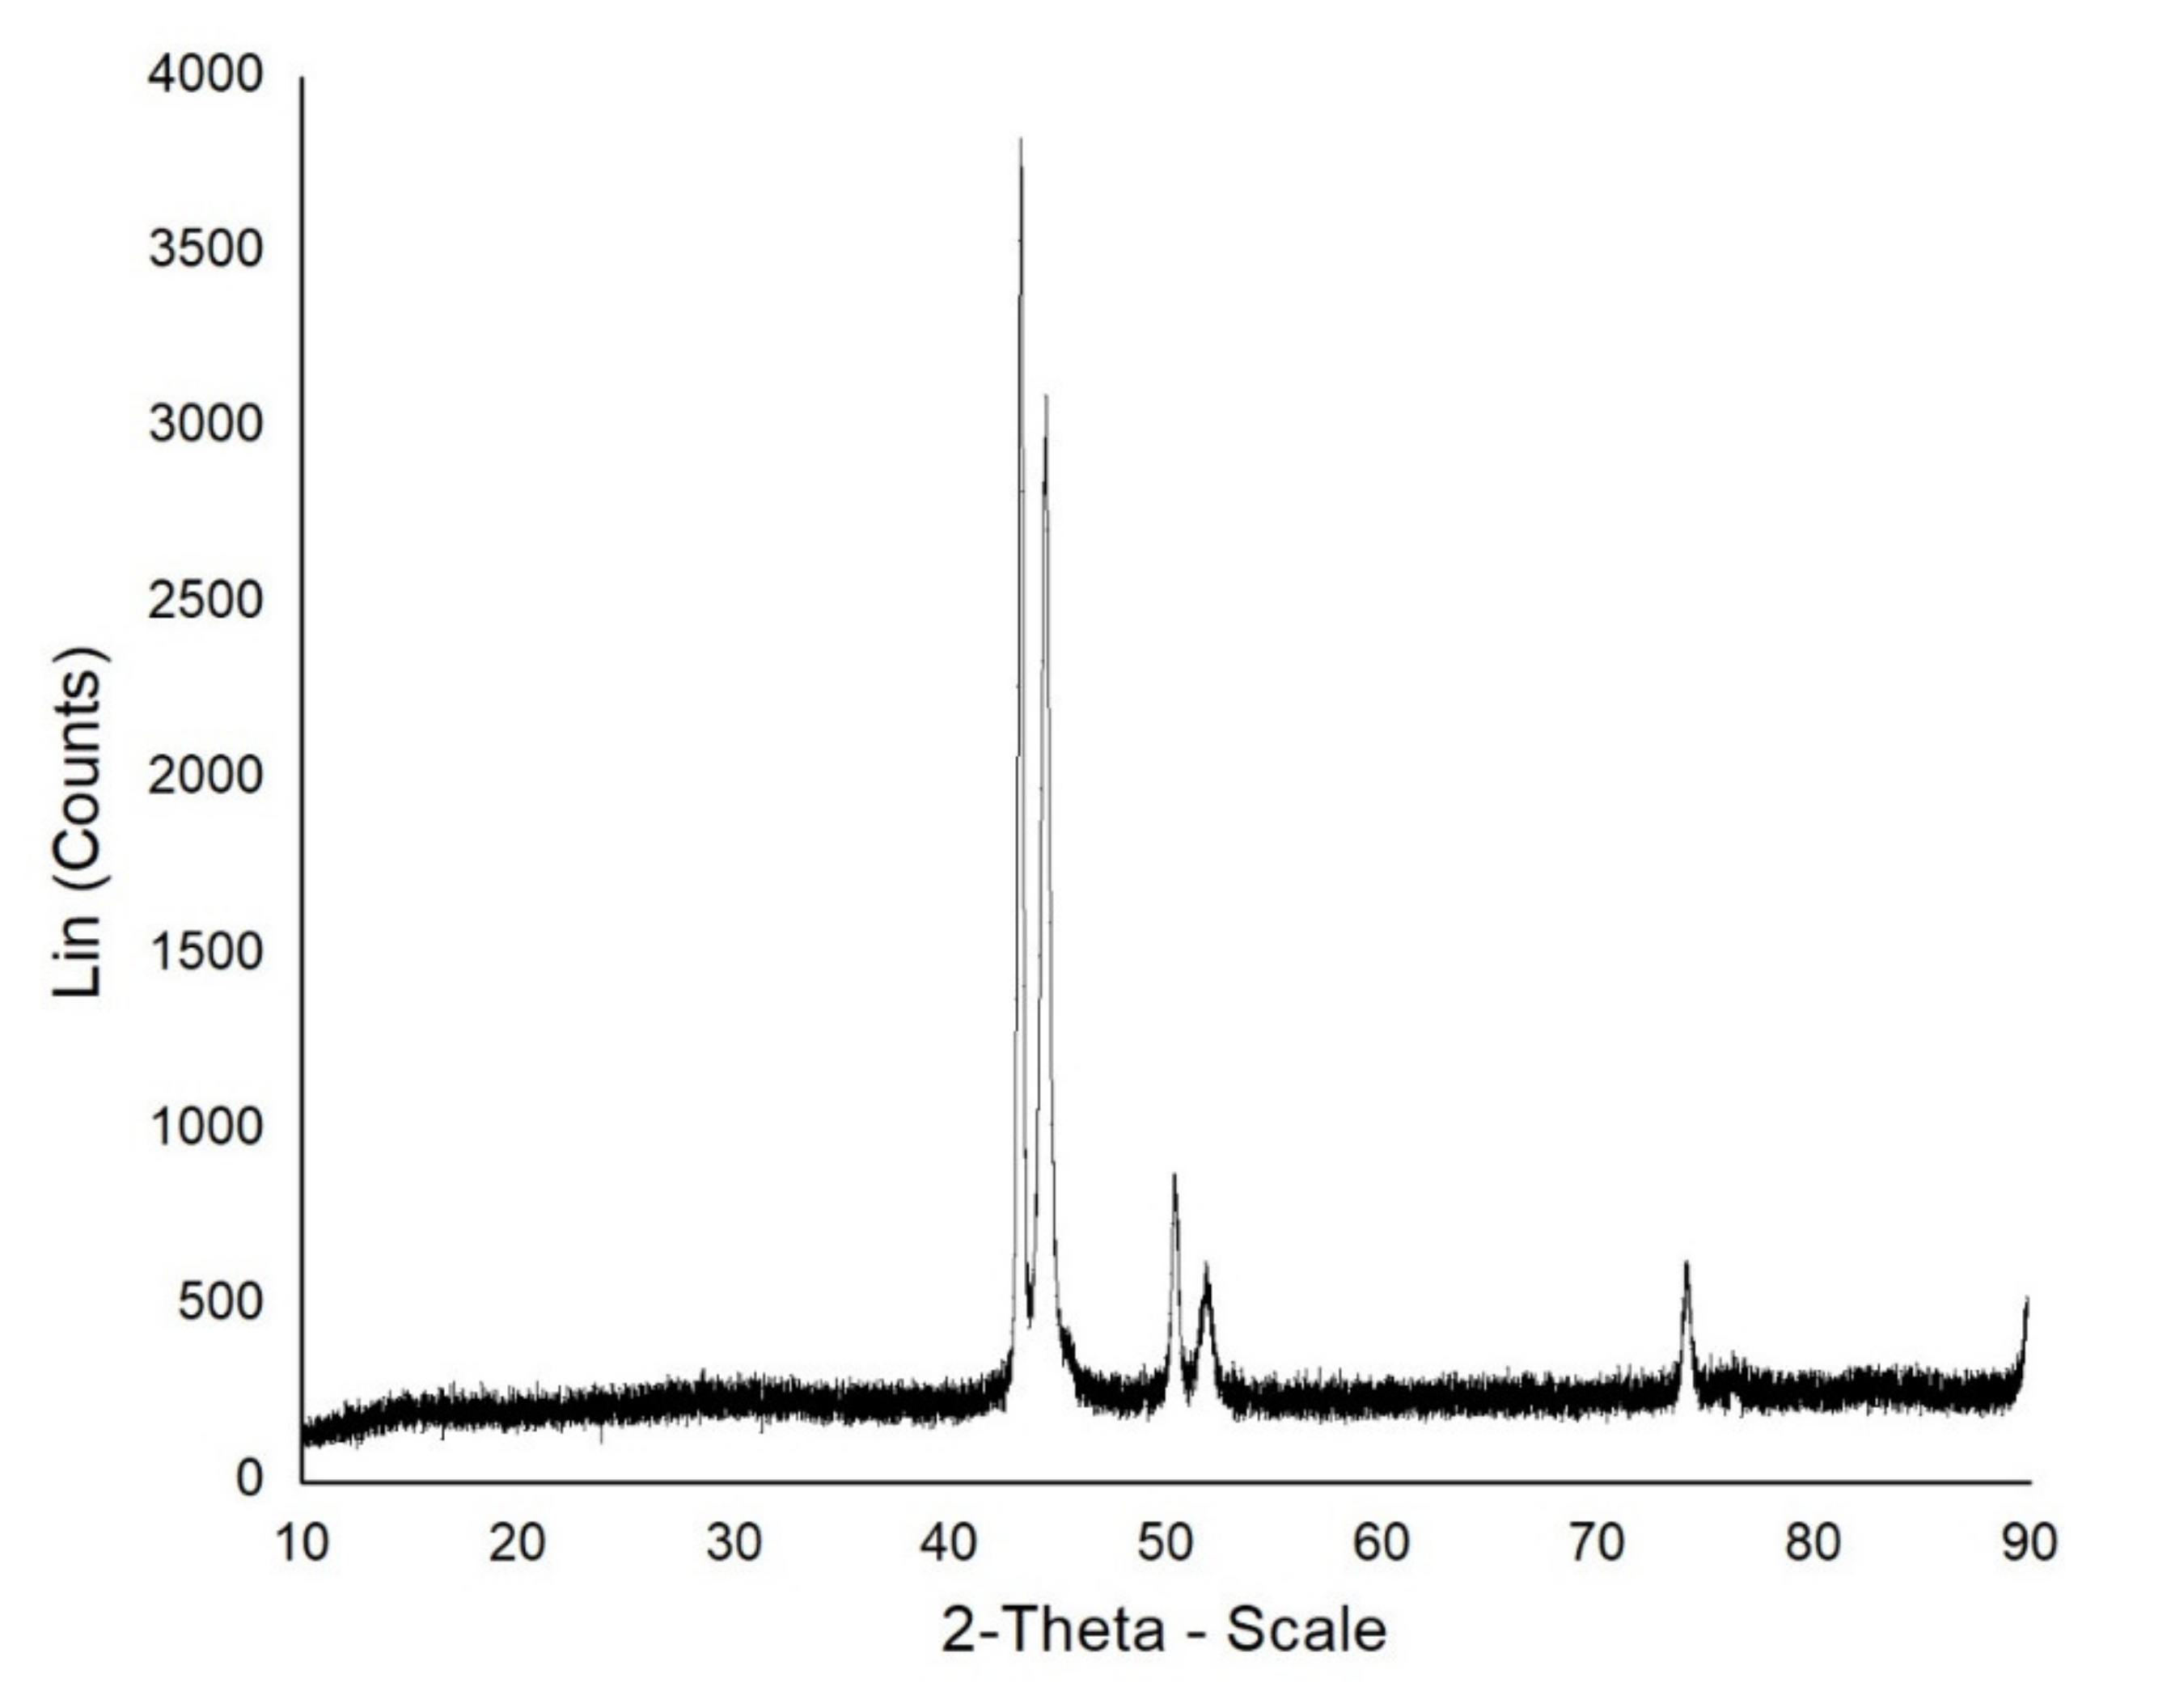
Figure 10.
XRD analysis of coated mild steel sample.
Figure 10.
XRD analysis of coated mild steel sample.
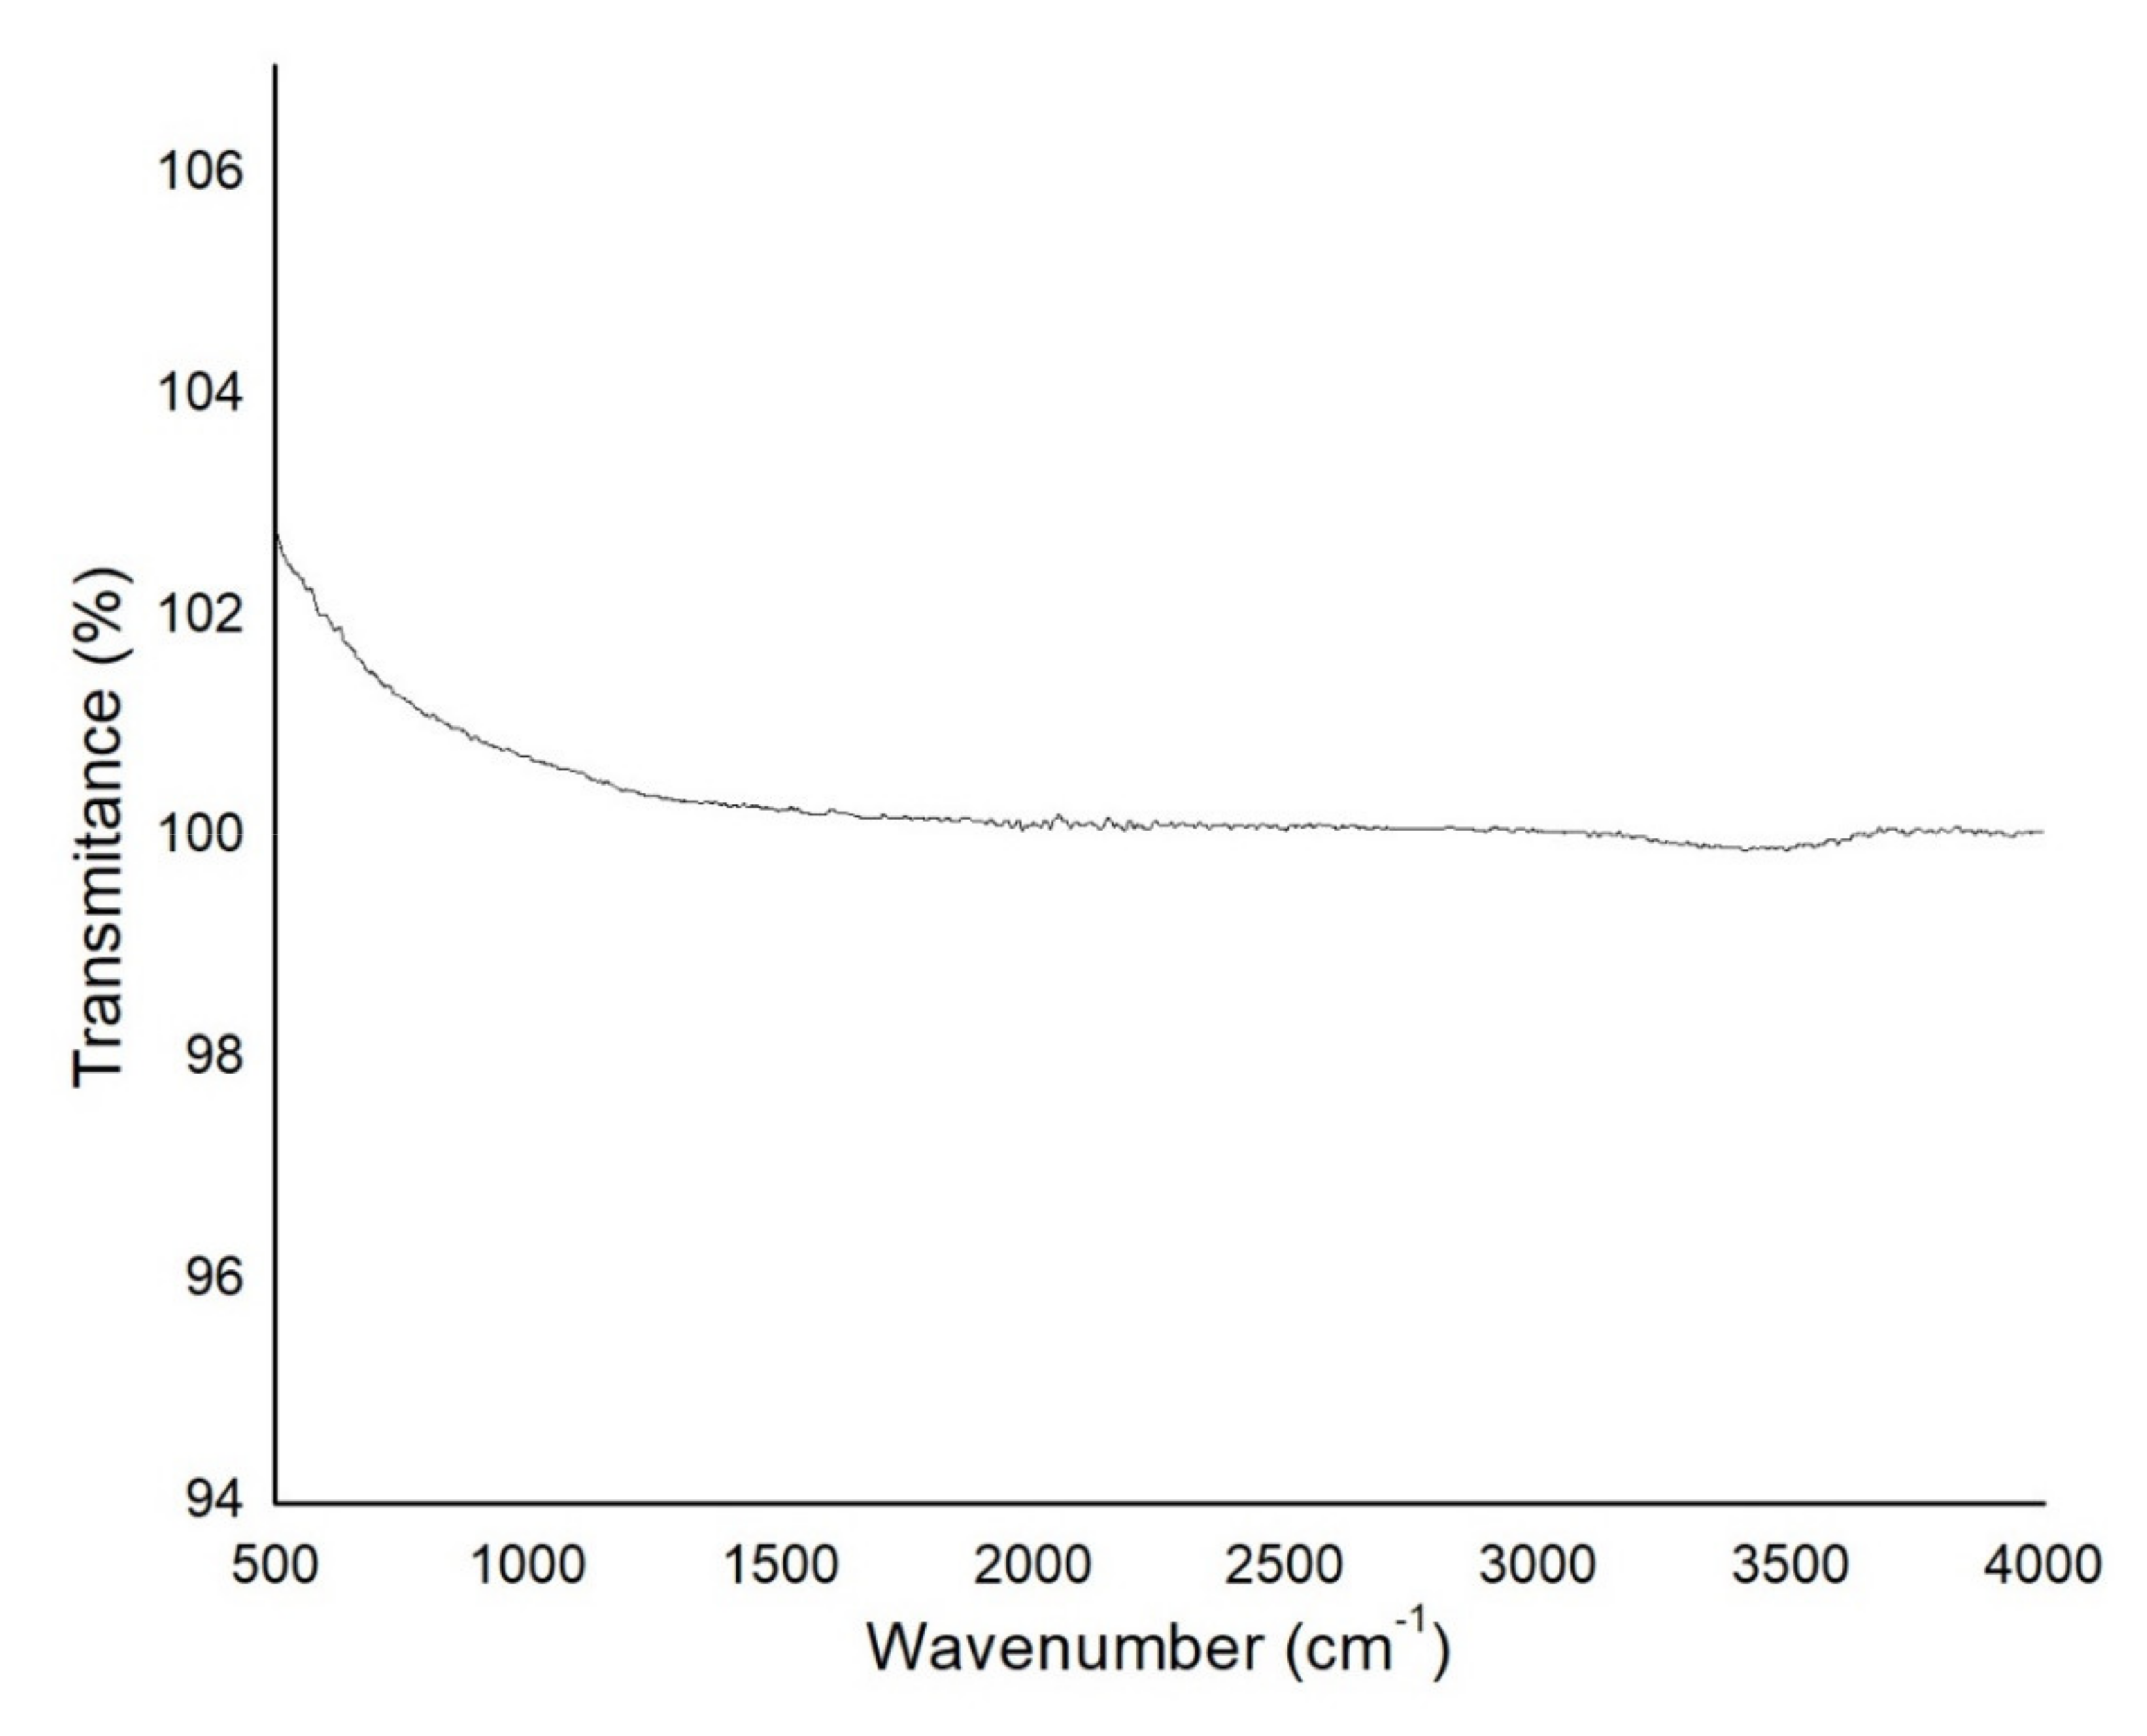
Figure 11.
Fourier transform infrared ray analysis of coated mild steel sample.
Figure 11.
Fourier transform infrared ray analysis of coated mild steel sample.
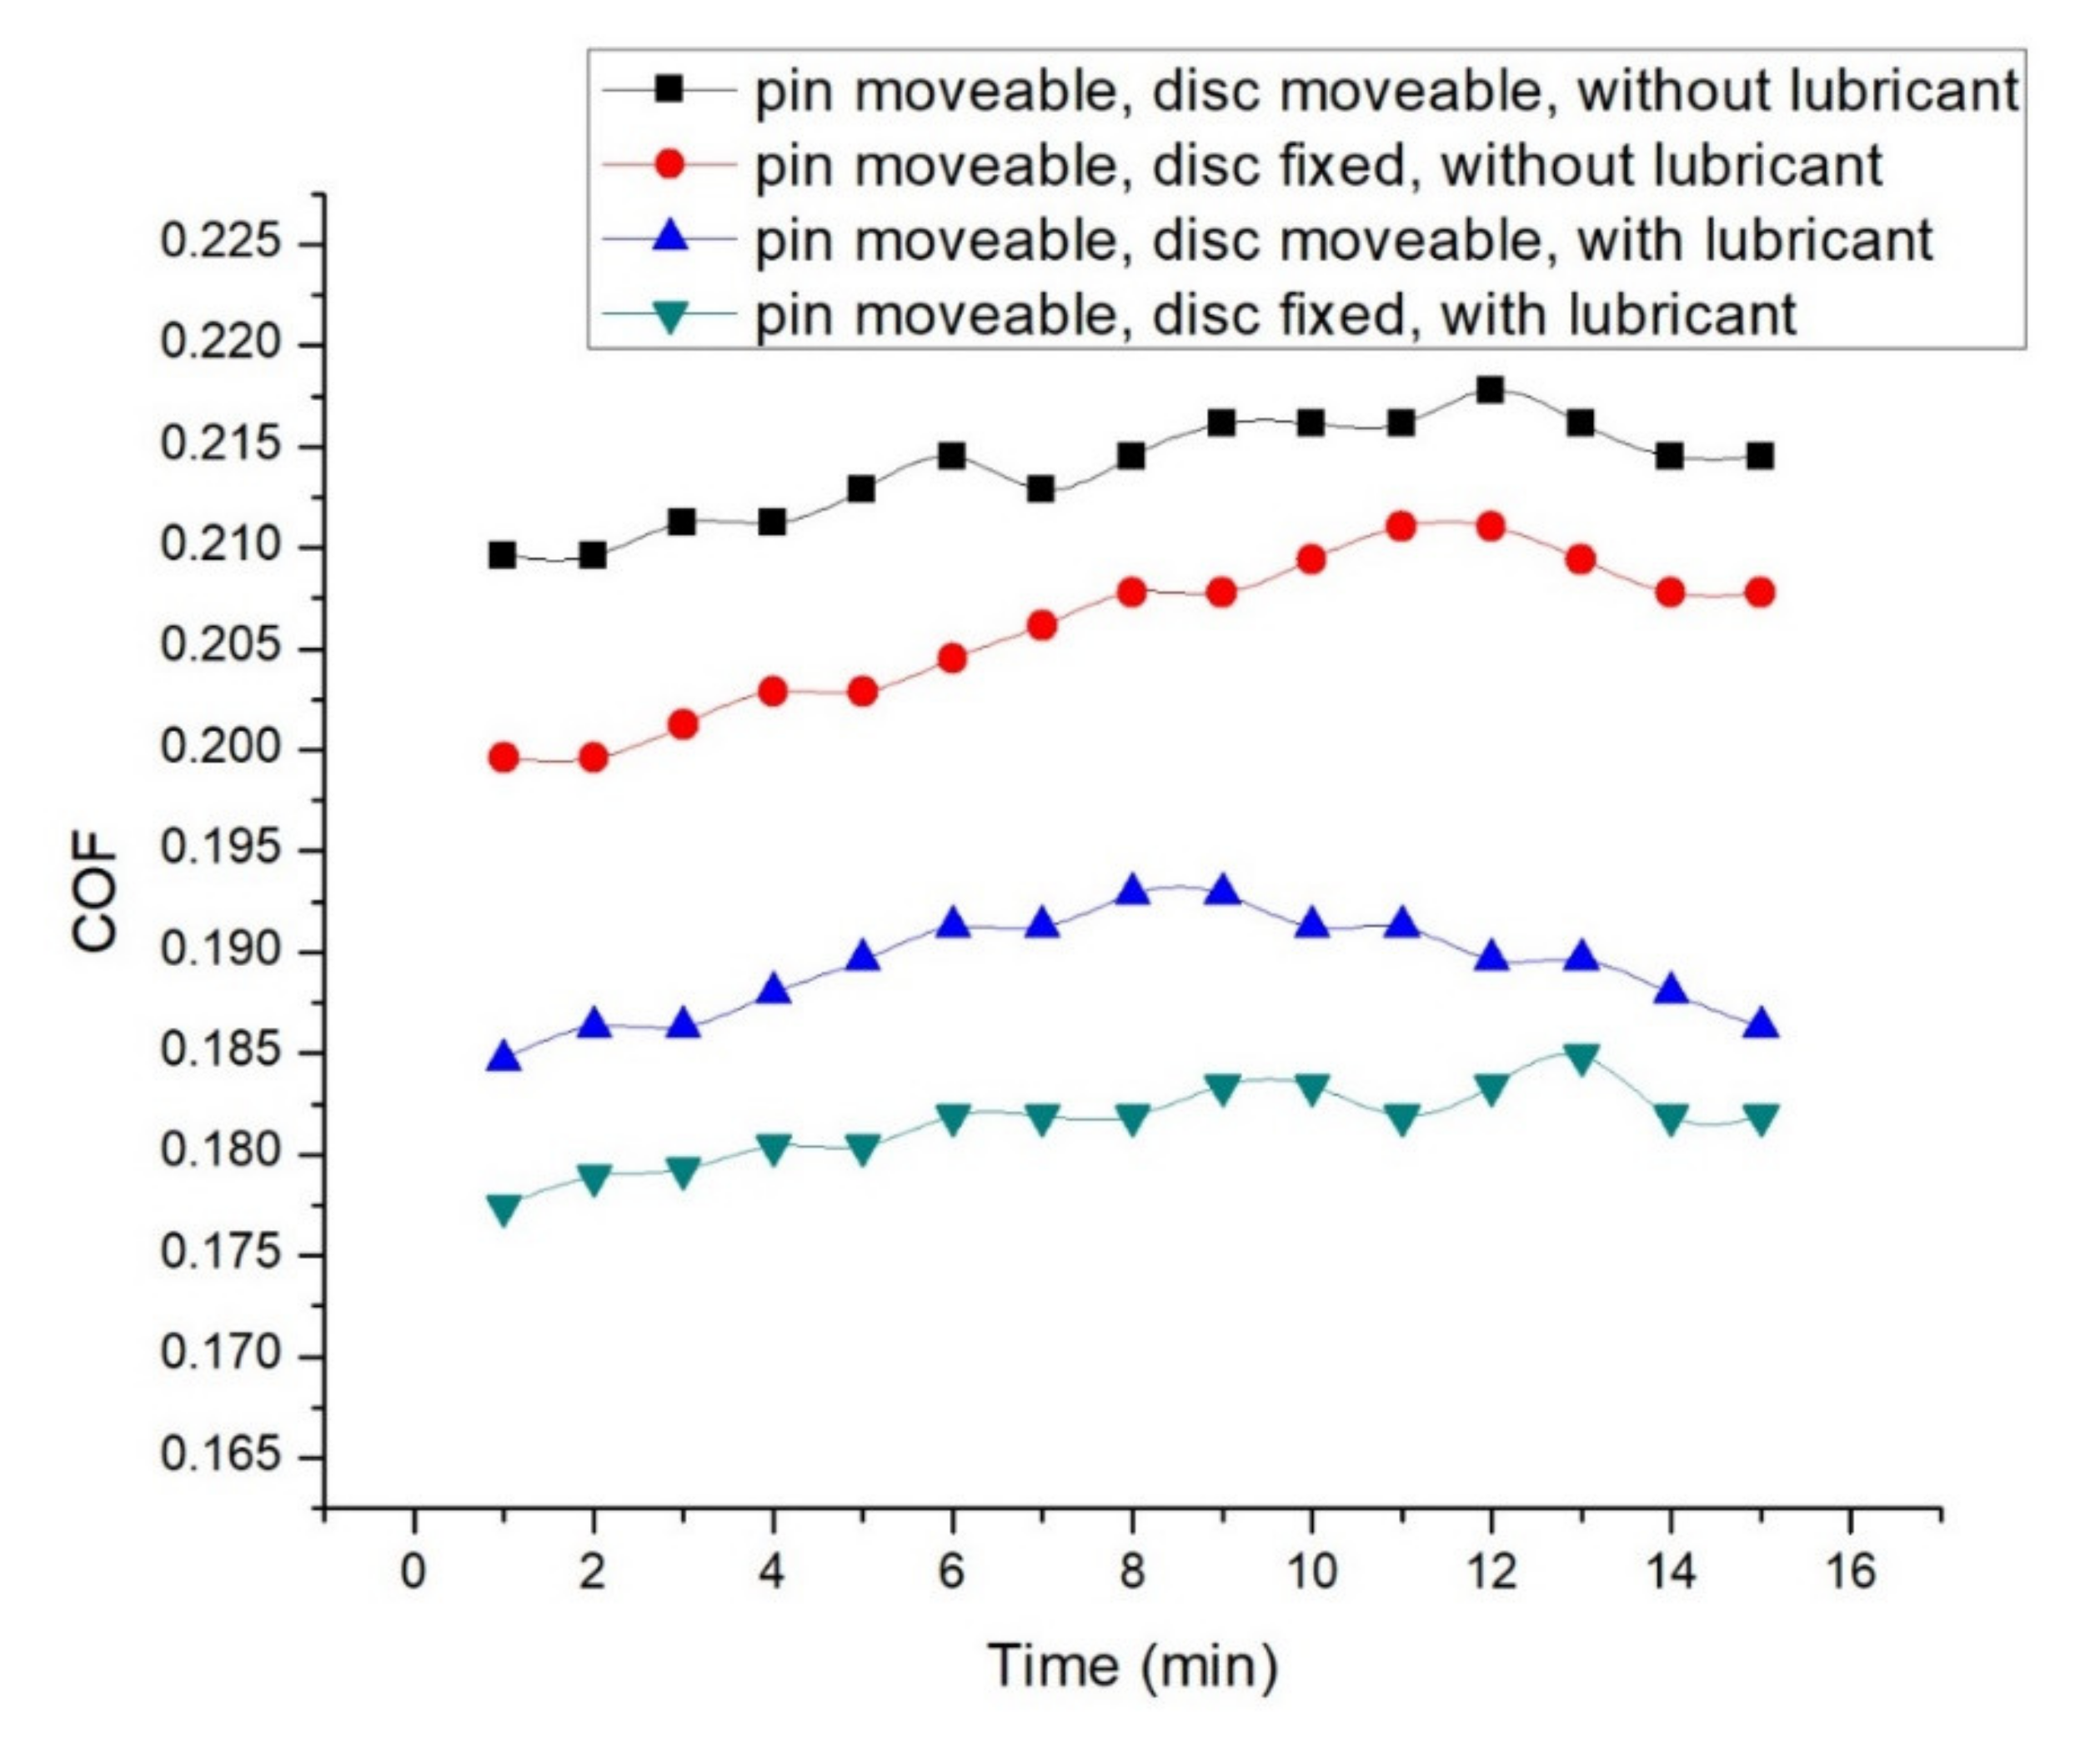
Figure 12.
COF at 3.5 N normal load, 0.45 m/s disc, and 0.15 m/s pin velocity.
Figure 12.
COF at 3.5 N normal load, 0.45 m/s disc, and 0.15 m/s pin velocity.
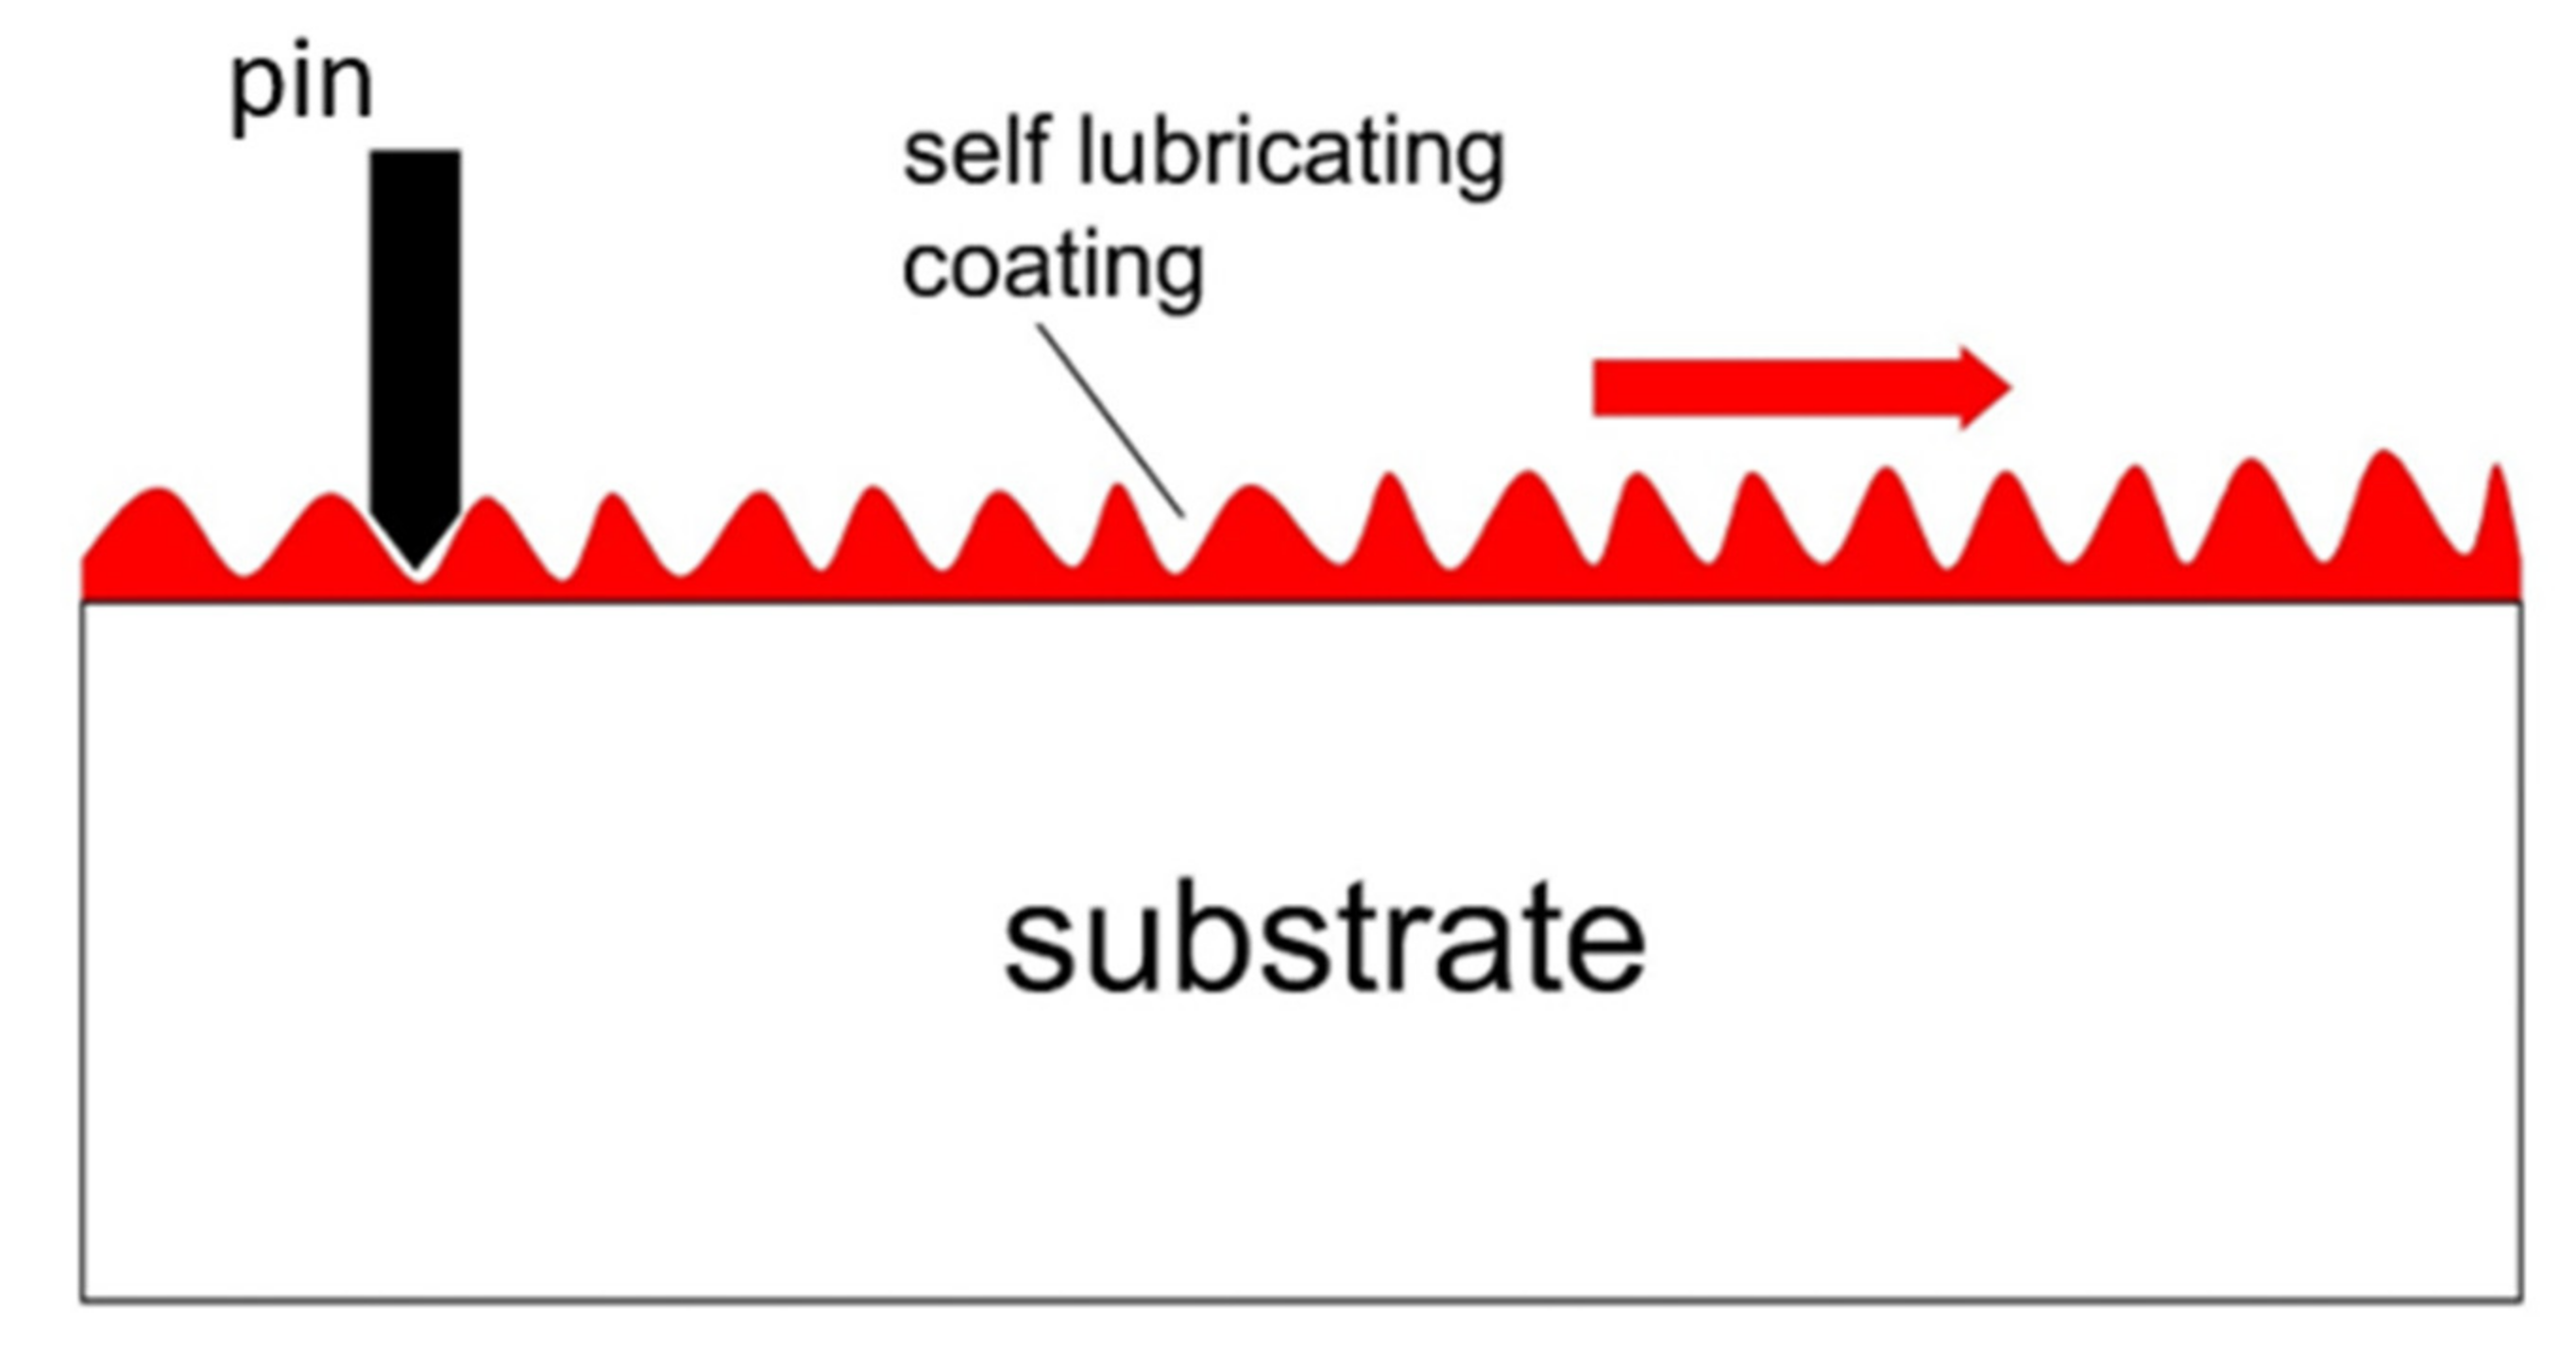
Figure 13.
Lubrication mechanism for separating the mating surfaces.
Figure 13.
Lubrication mechanism for separating the mating surfaces.
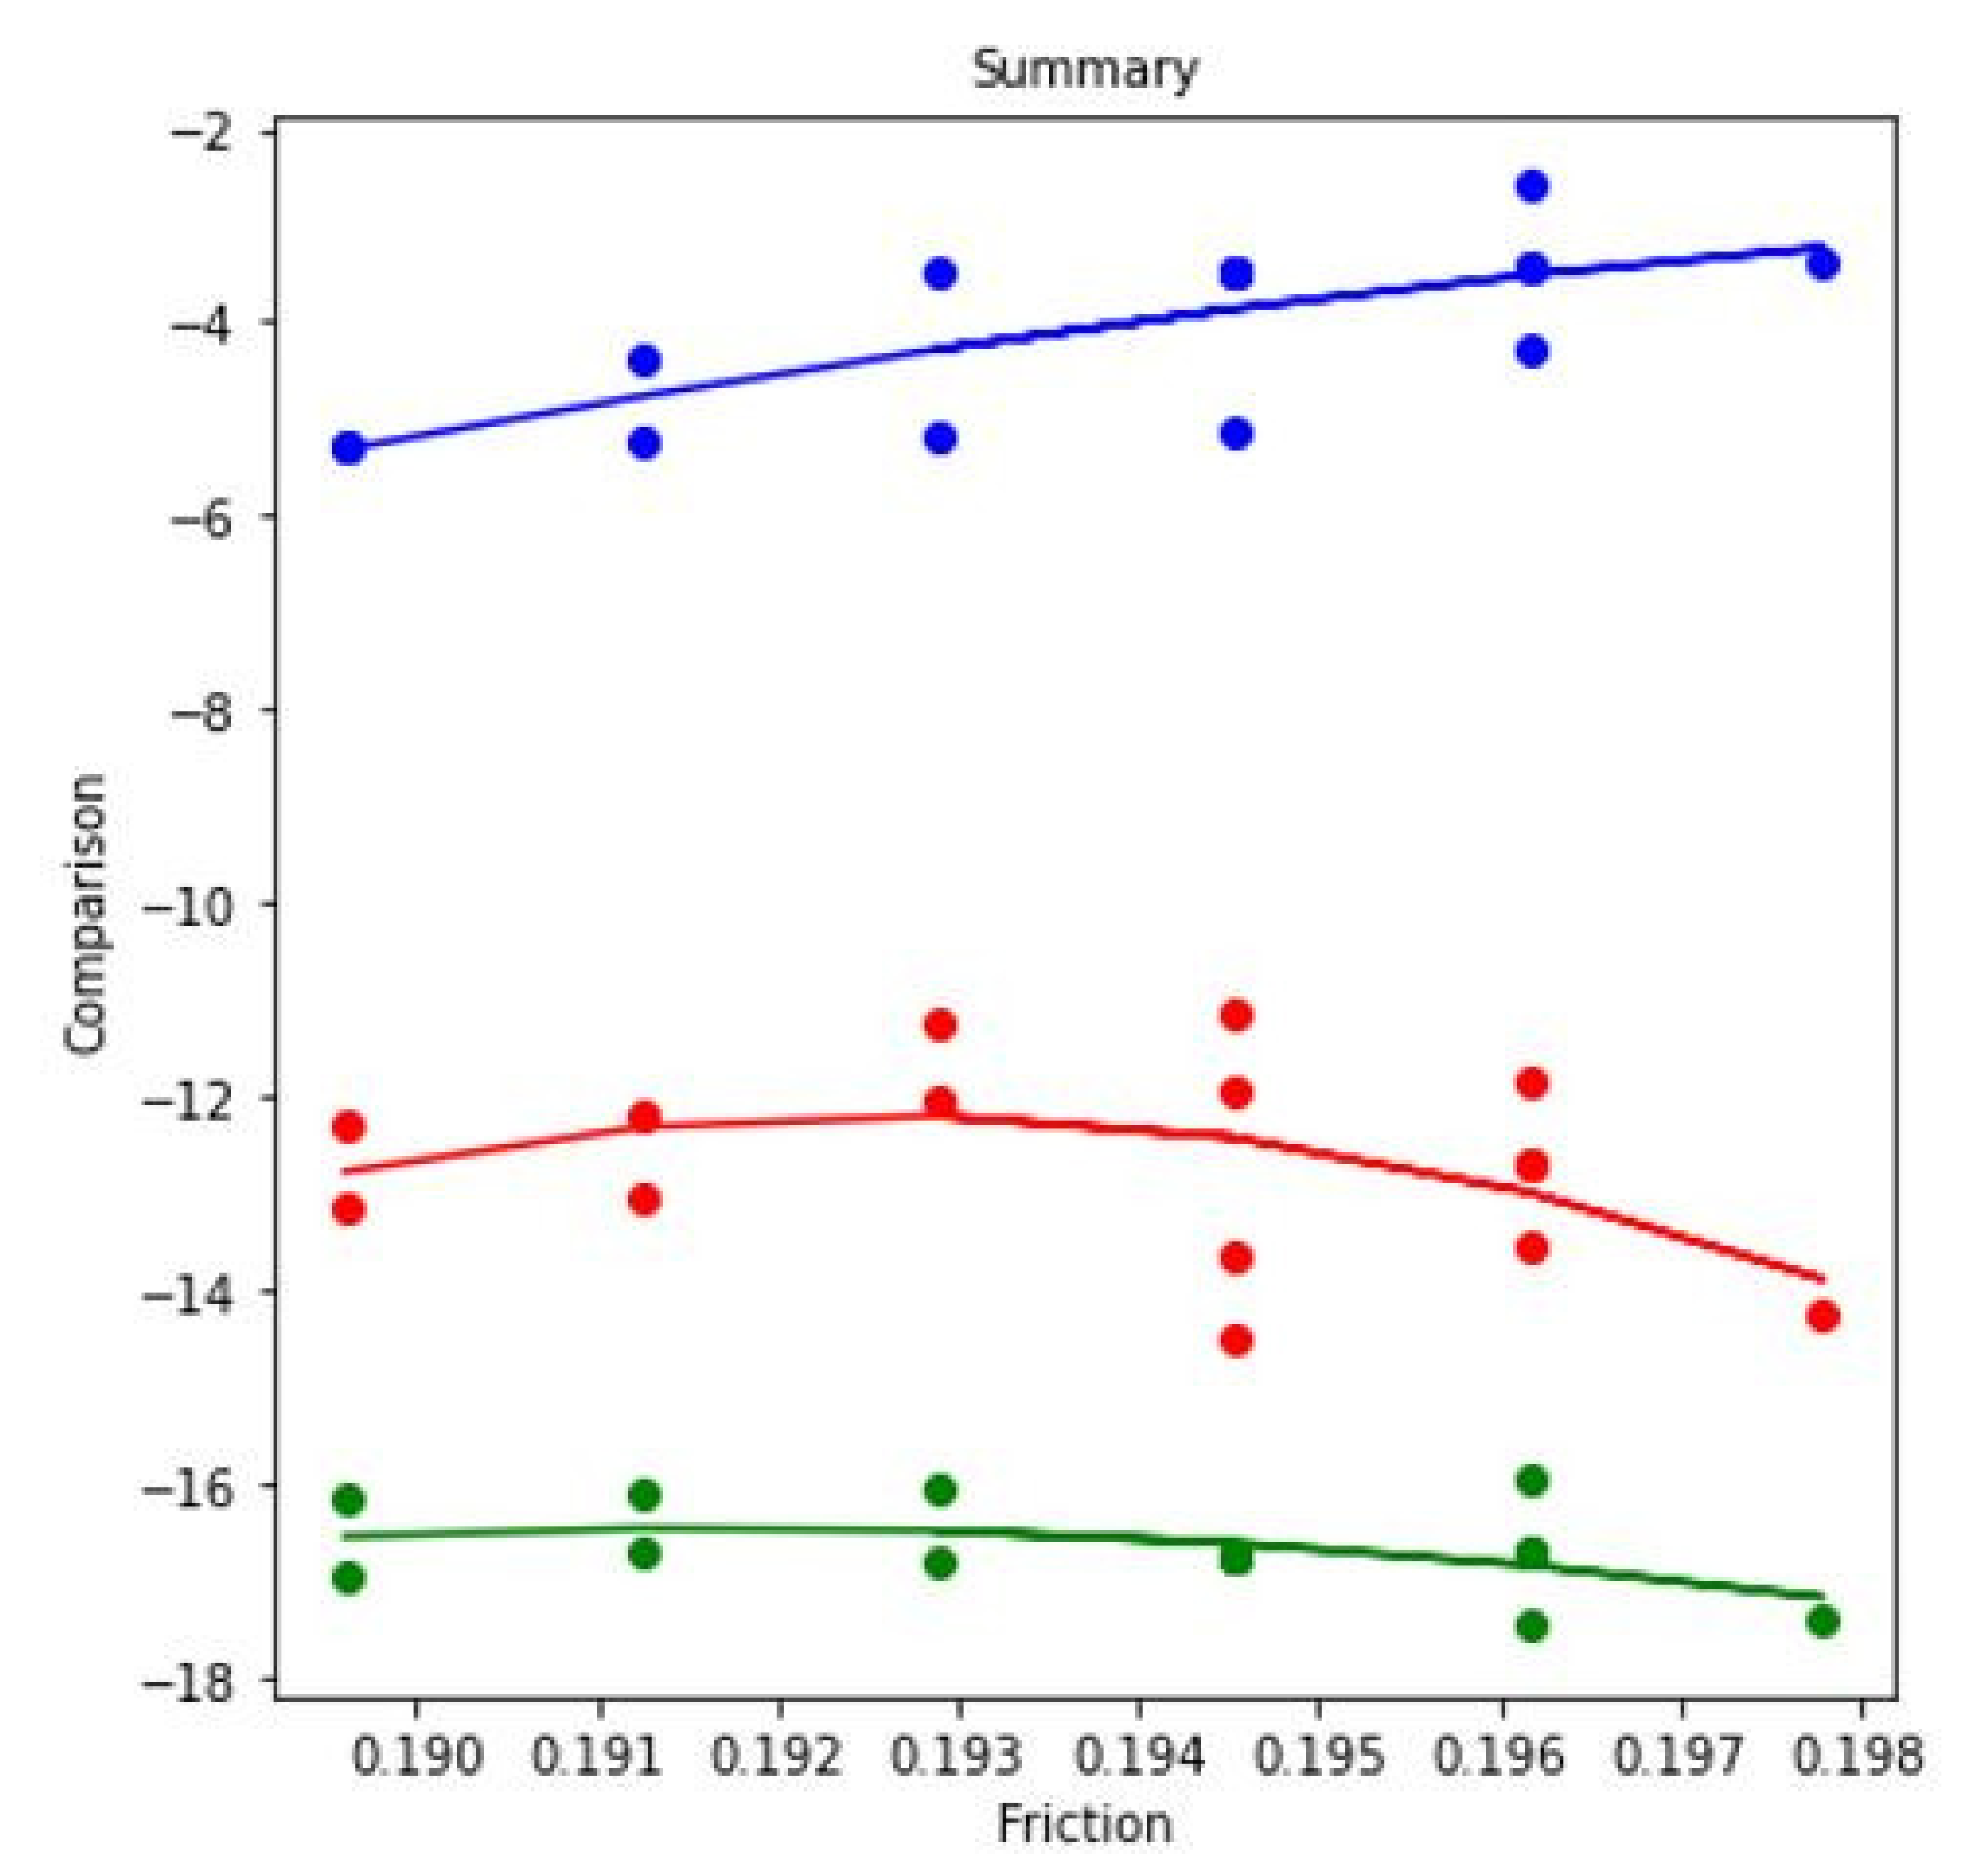
Figure 14.
Regression model for COF at 3.5 N applied force, 0.45 m/s disc velocity, and 0.15 m/s pin velocity.
Figure 14.
Regression model for COF at 3.5 N applied force, 0.45 m/s disc velocity, and 0.15 m/s pin velocity.
Figure 15.
Variation of wear at 3.5 N load, 0.45 m/s disc, and 0.15 m/s pin velocity.
Figure 15.
Variation of wear at 3.5 N load, 0.45 m/s disc, and 0.15 m/s pin velocity.
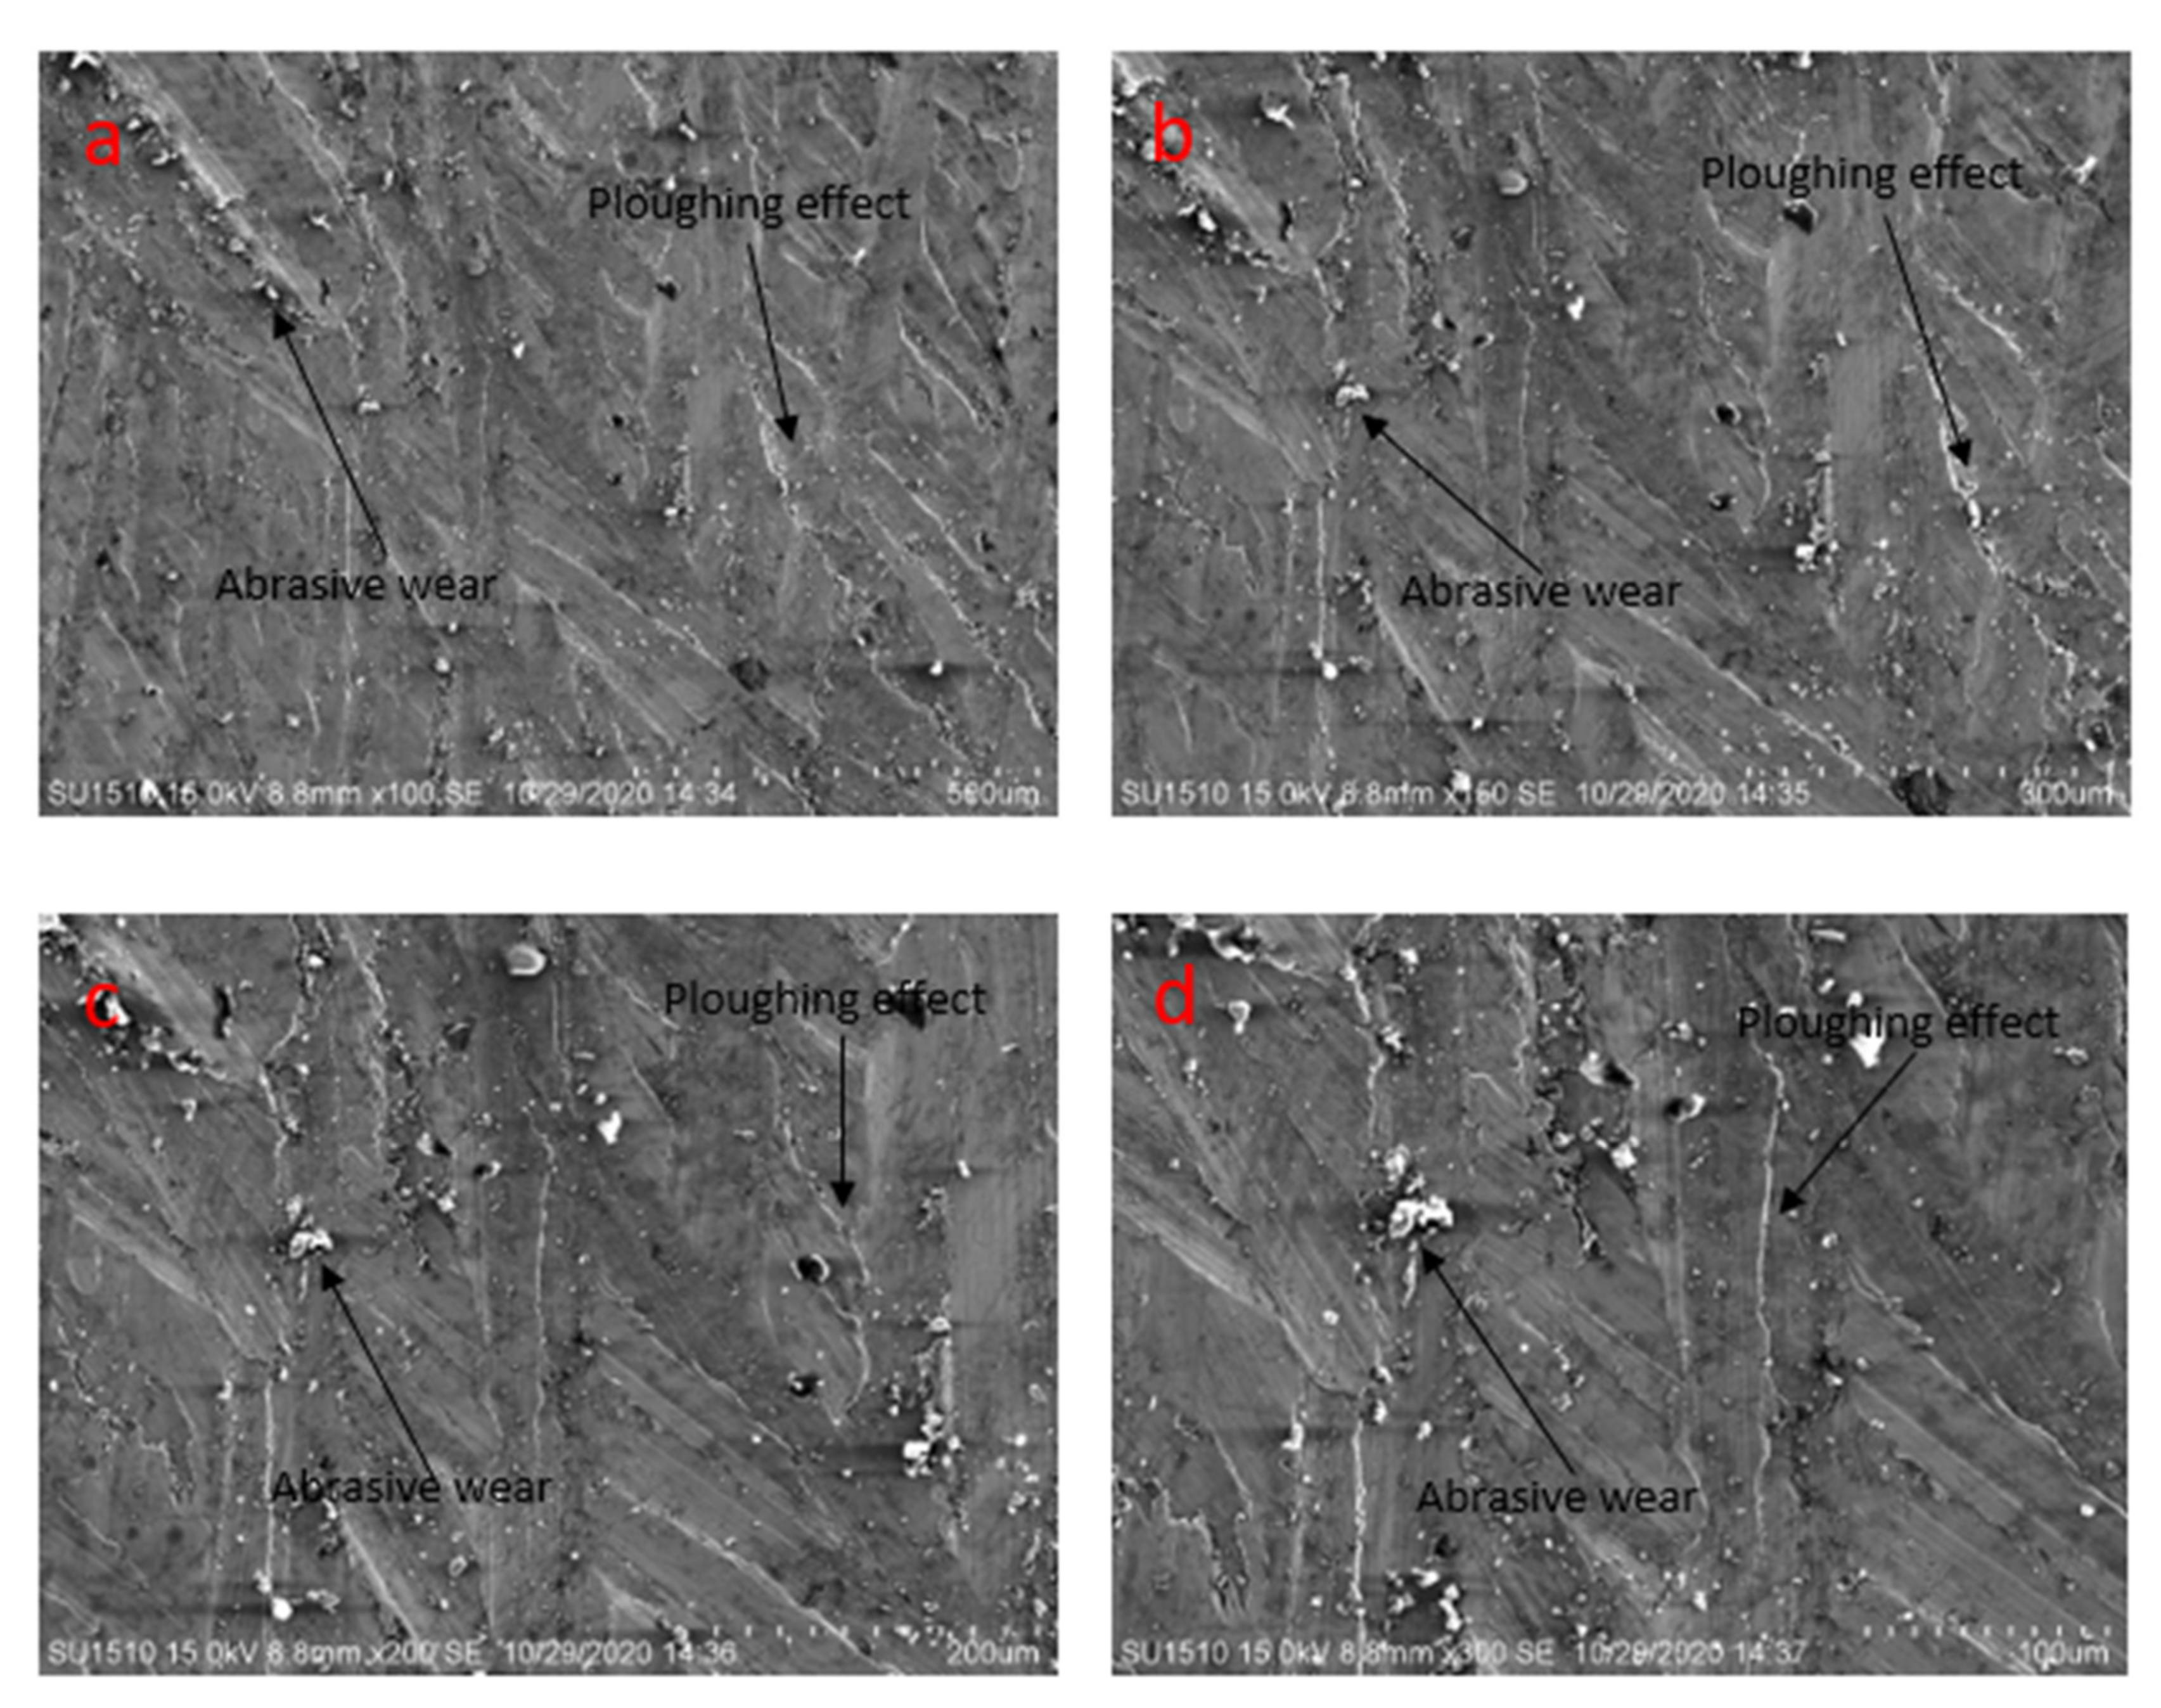
Figure 16.
Scanning electron microscopy image of specimens’ later friction test at 3.5 N load, 0.45 m/s disc, 0.15 m/s pin velocity, and lubrication (a) at 500 µm, (b) at 300 µm, (c) at 200 µm, (d) at 100 µm.
Figure 16.
Scanning electron microscopy image of specimens’ later friction test at 3.5 N load, 0.45 m/s disc, 0.15 m/s pin velocity, and lubrication (a) at 500 µm, (b) at 300 µm, (c) at 200 µm, (d) at 100 µm.
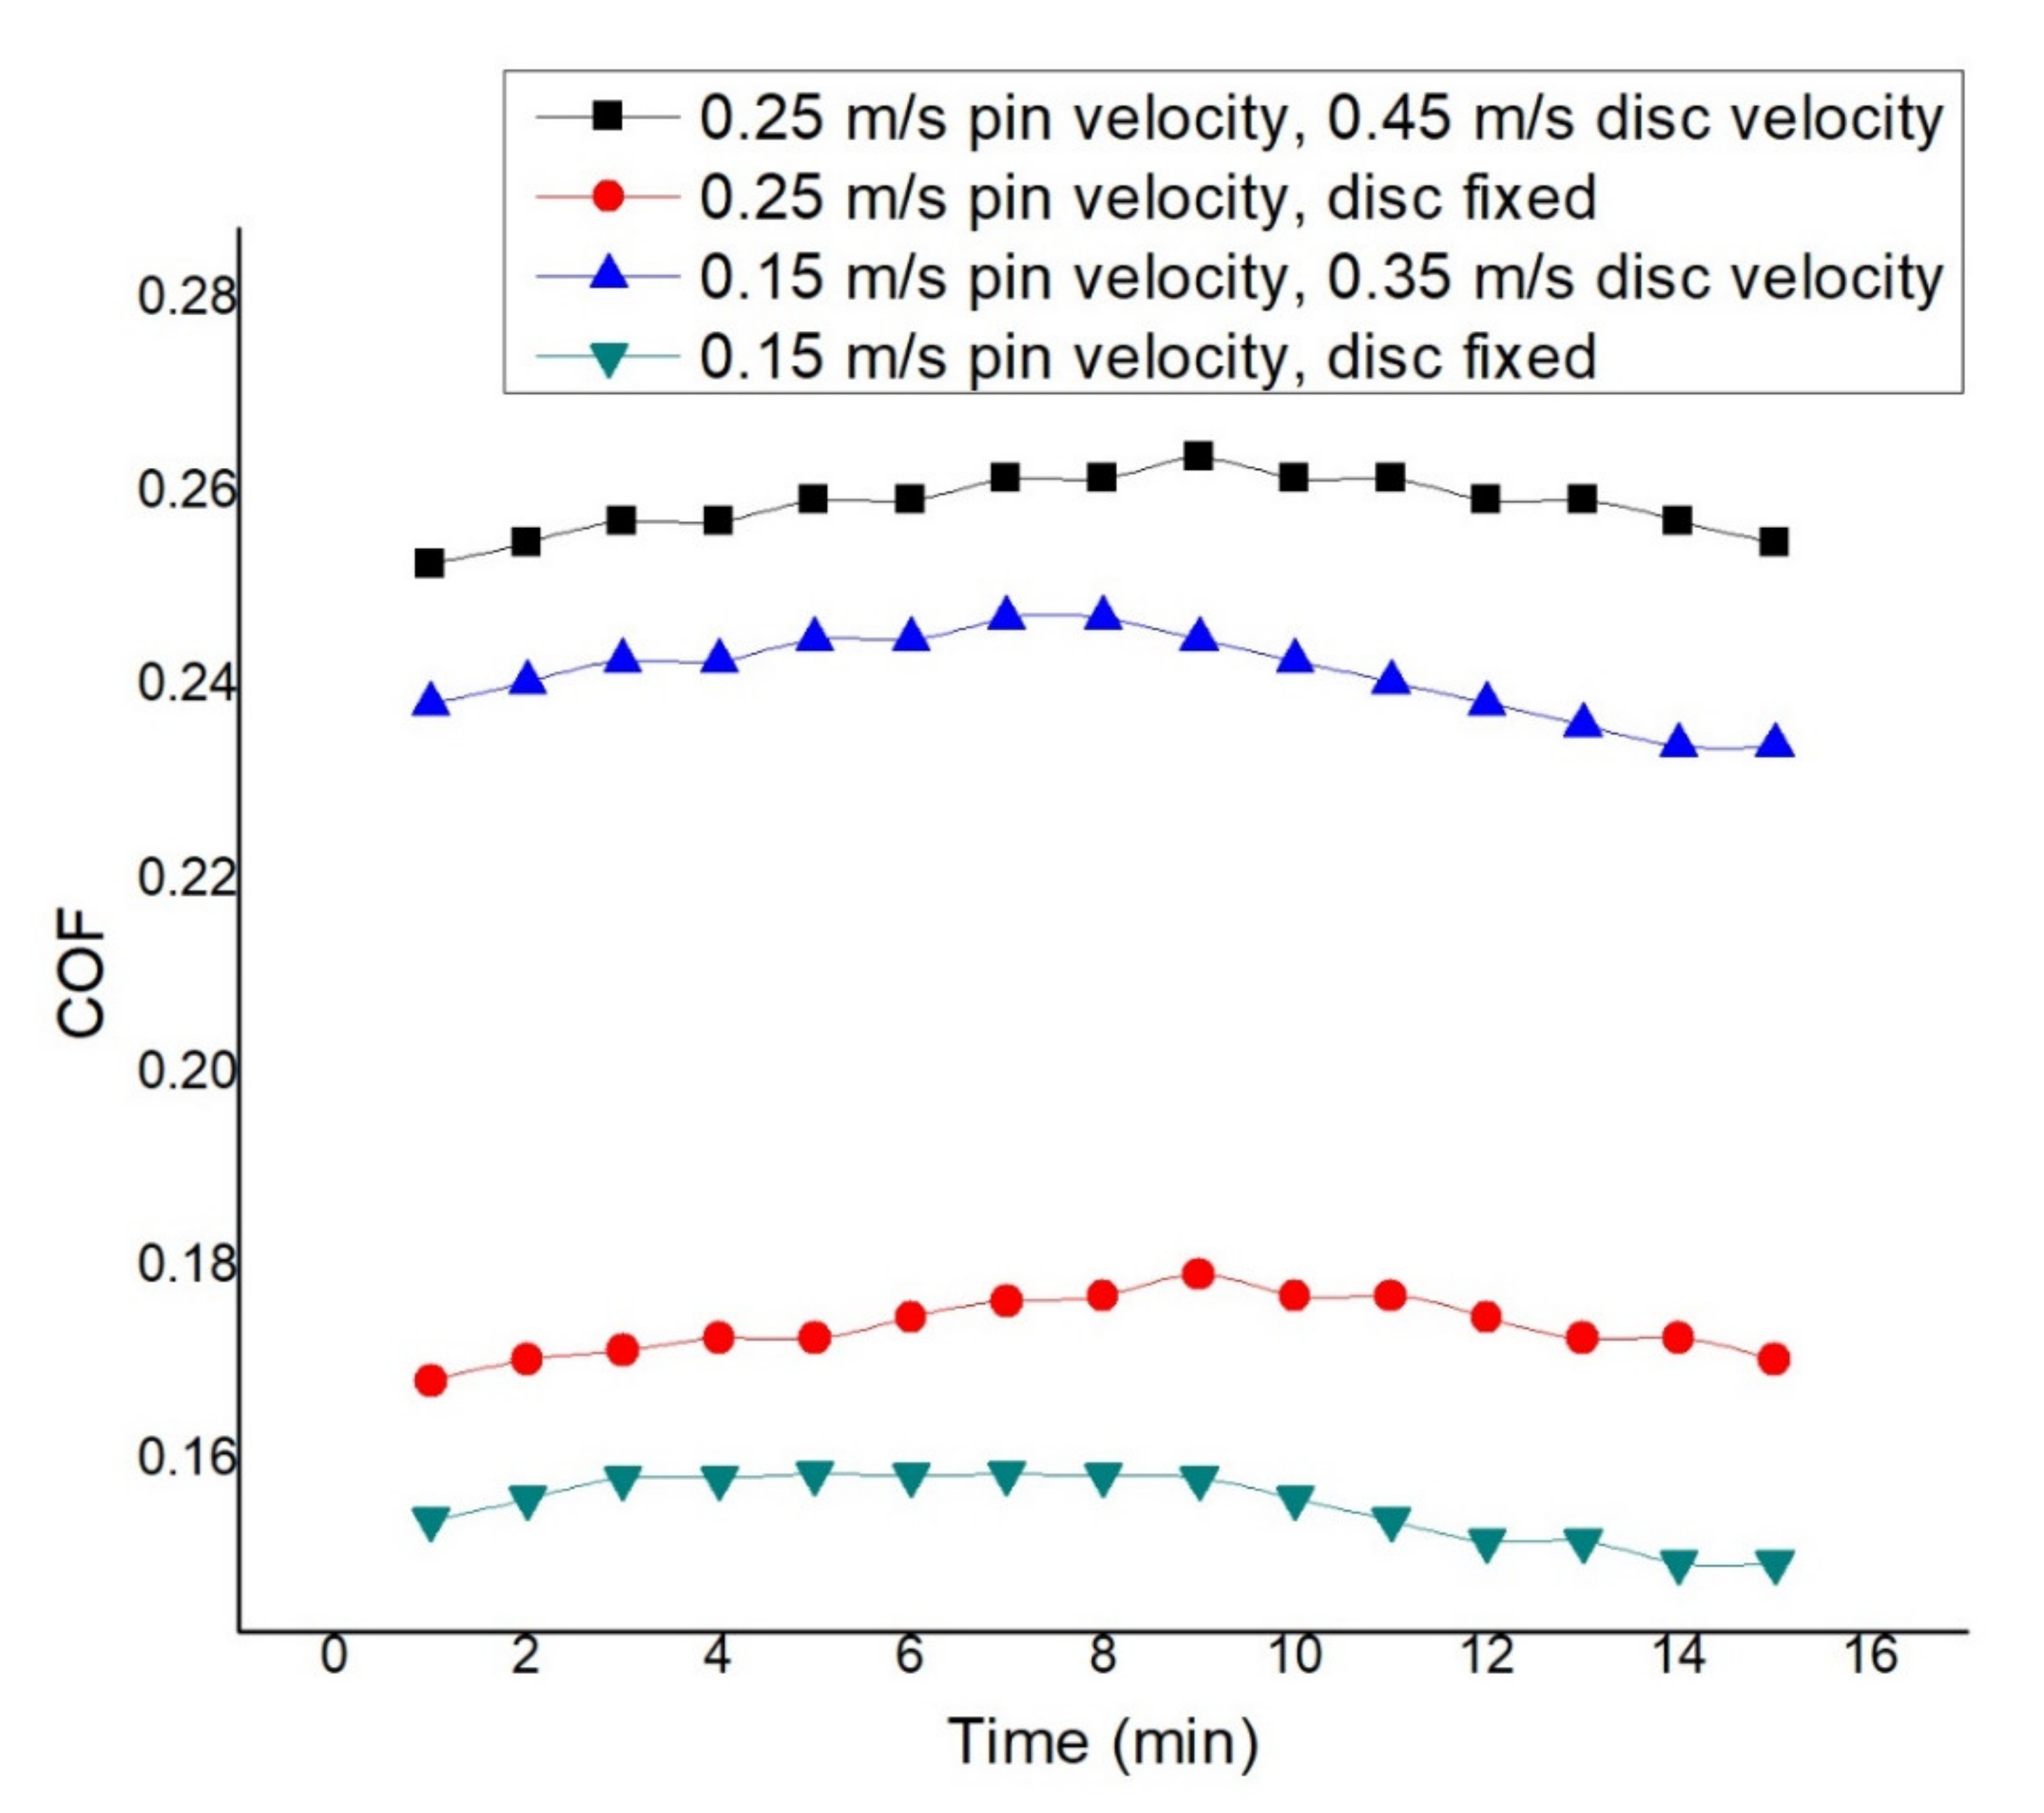
Figure 17.
COF at 2.5 N load and dry condition.
Figure 17.
COF at 2.5 N load and dry condition.
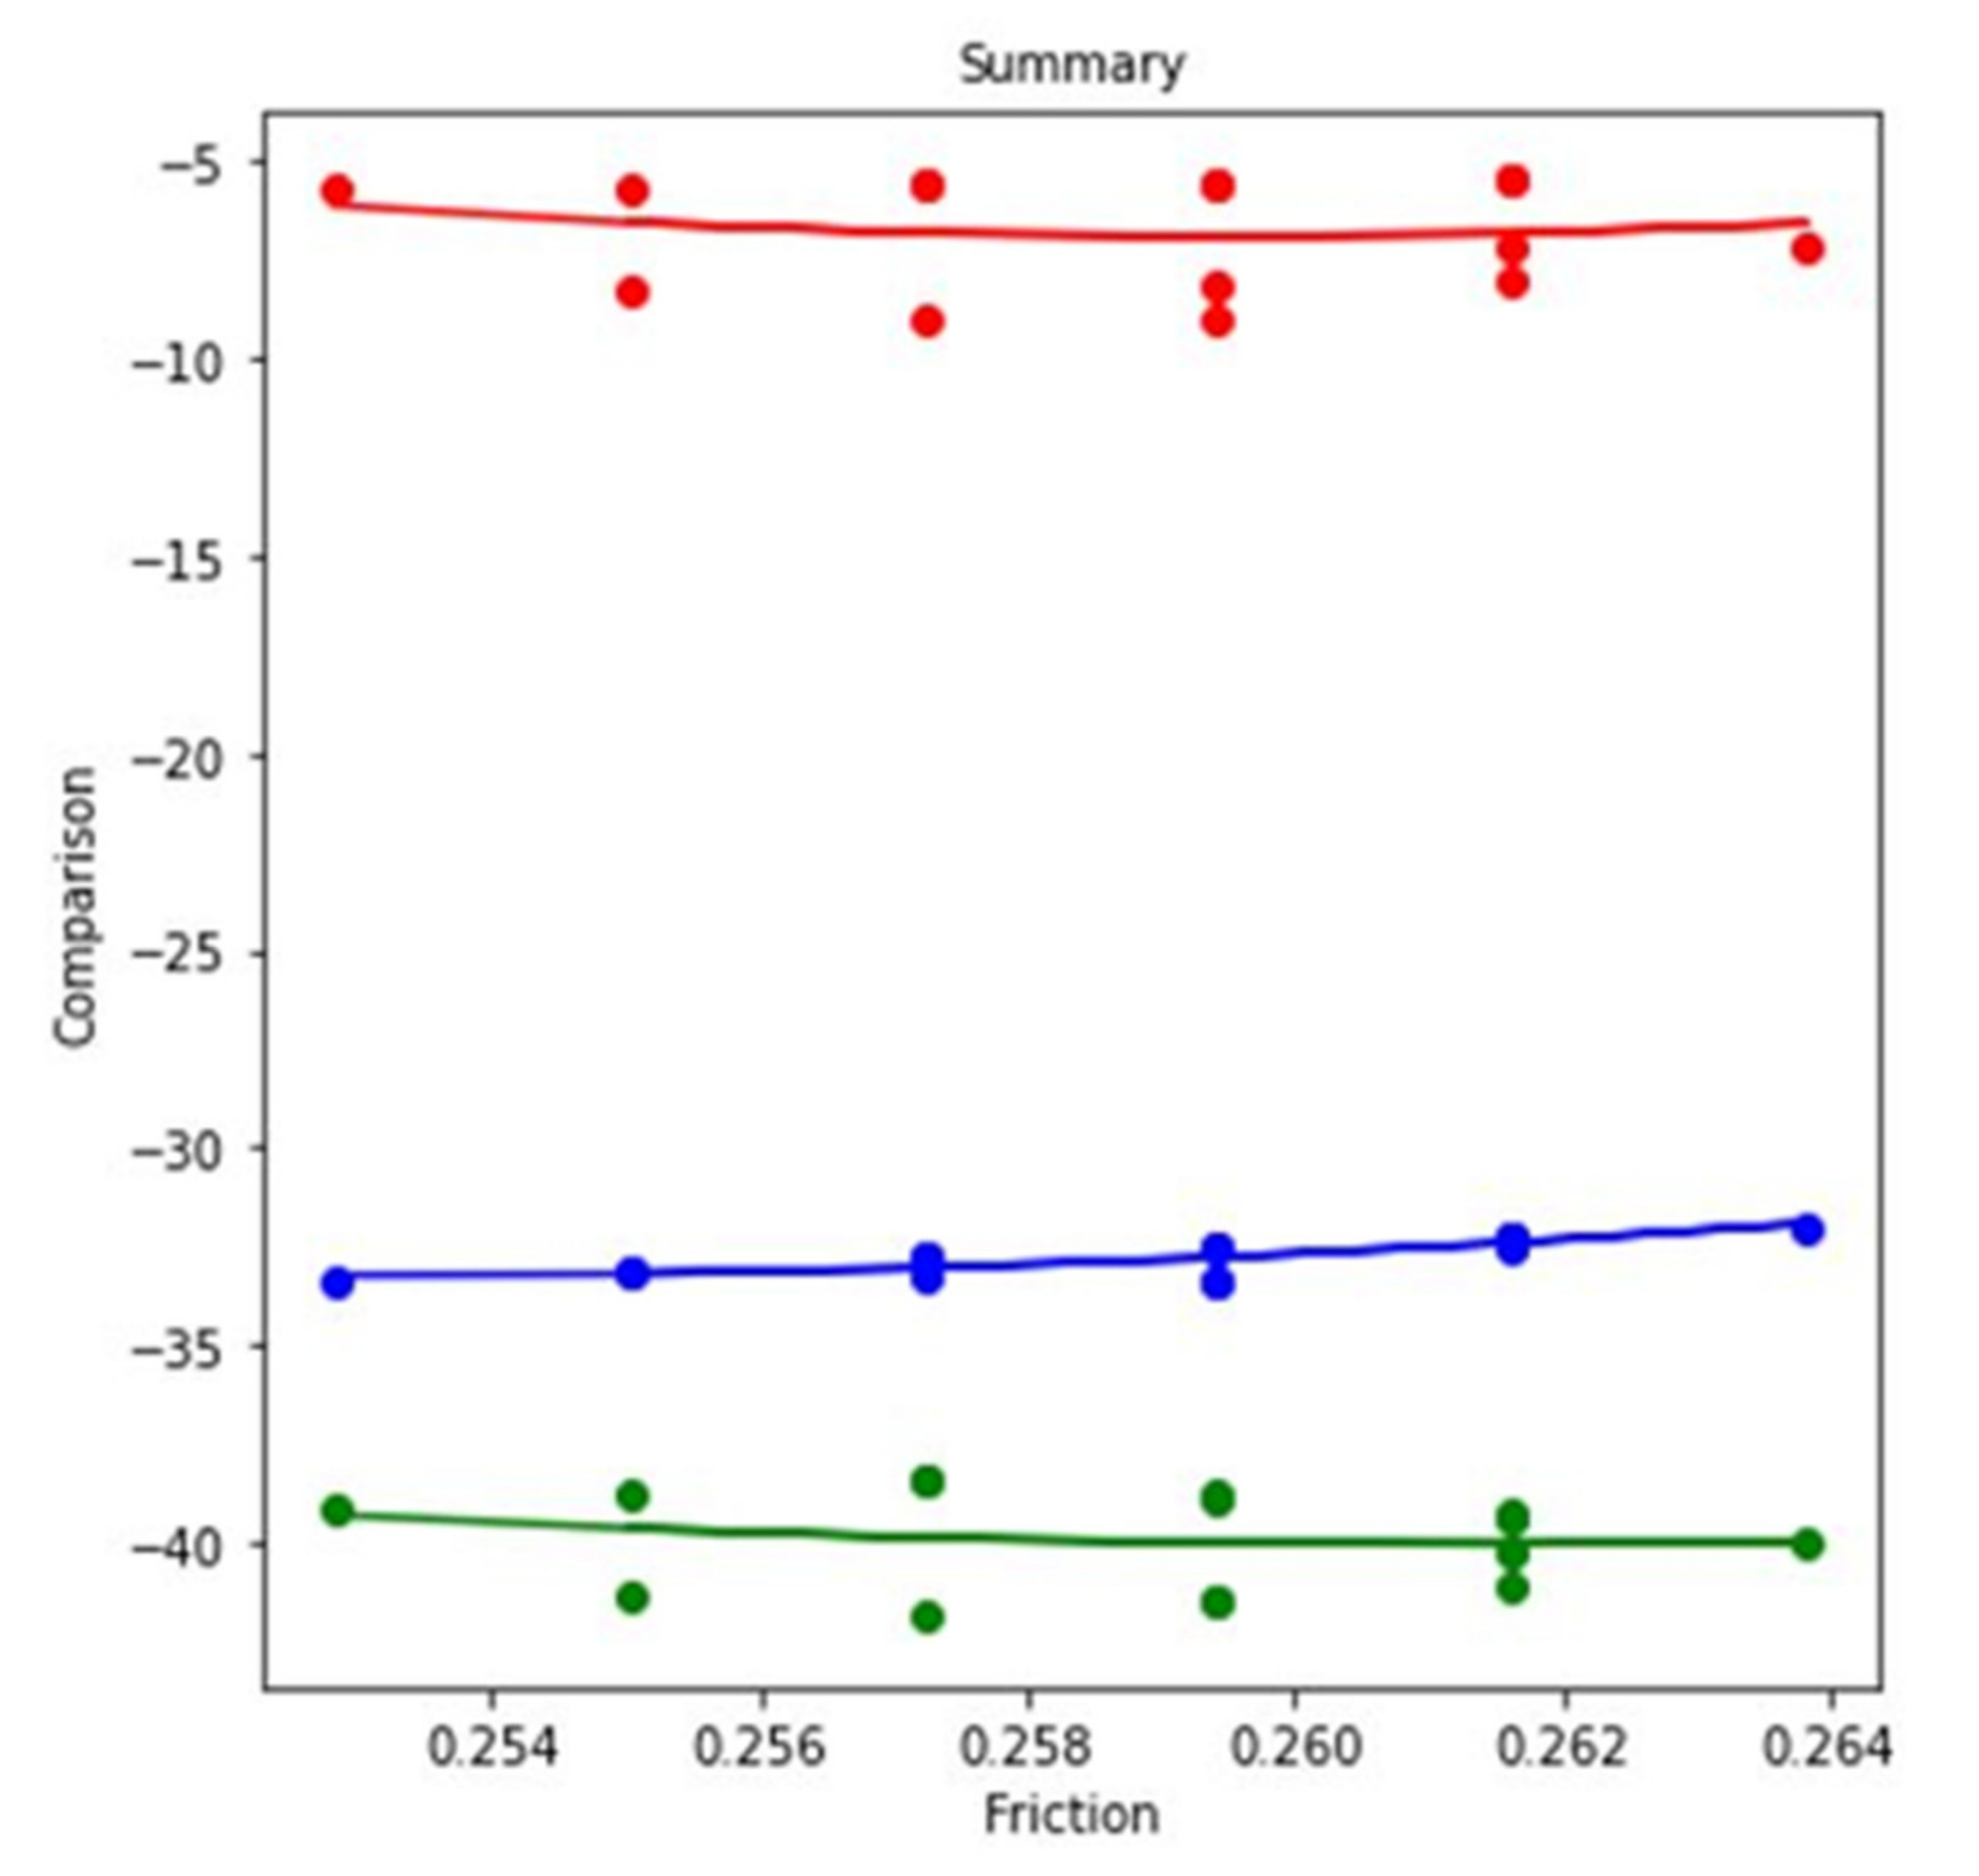
Figure 18.
Regression model for COF at 2.5 N load and dry condition.
Figure 18.
Regression model for COF at 2.5 N load and dry condition.
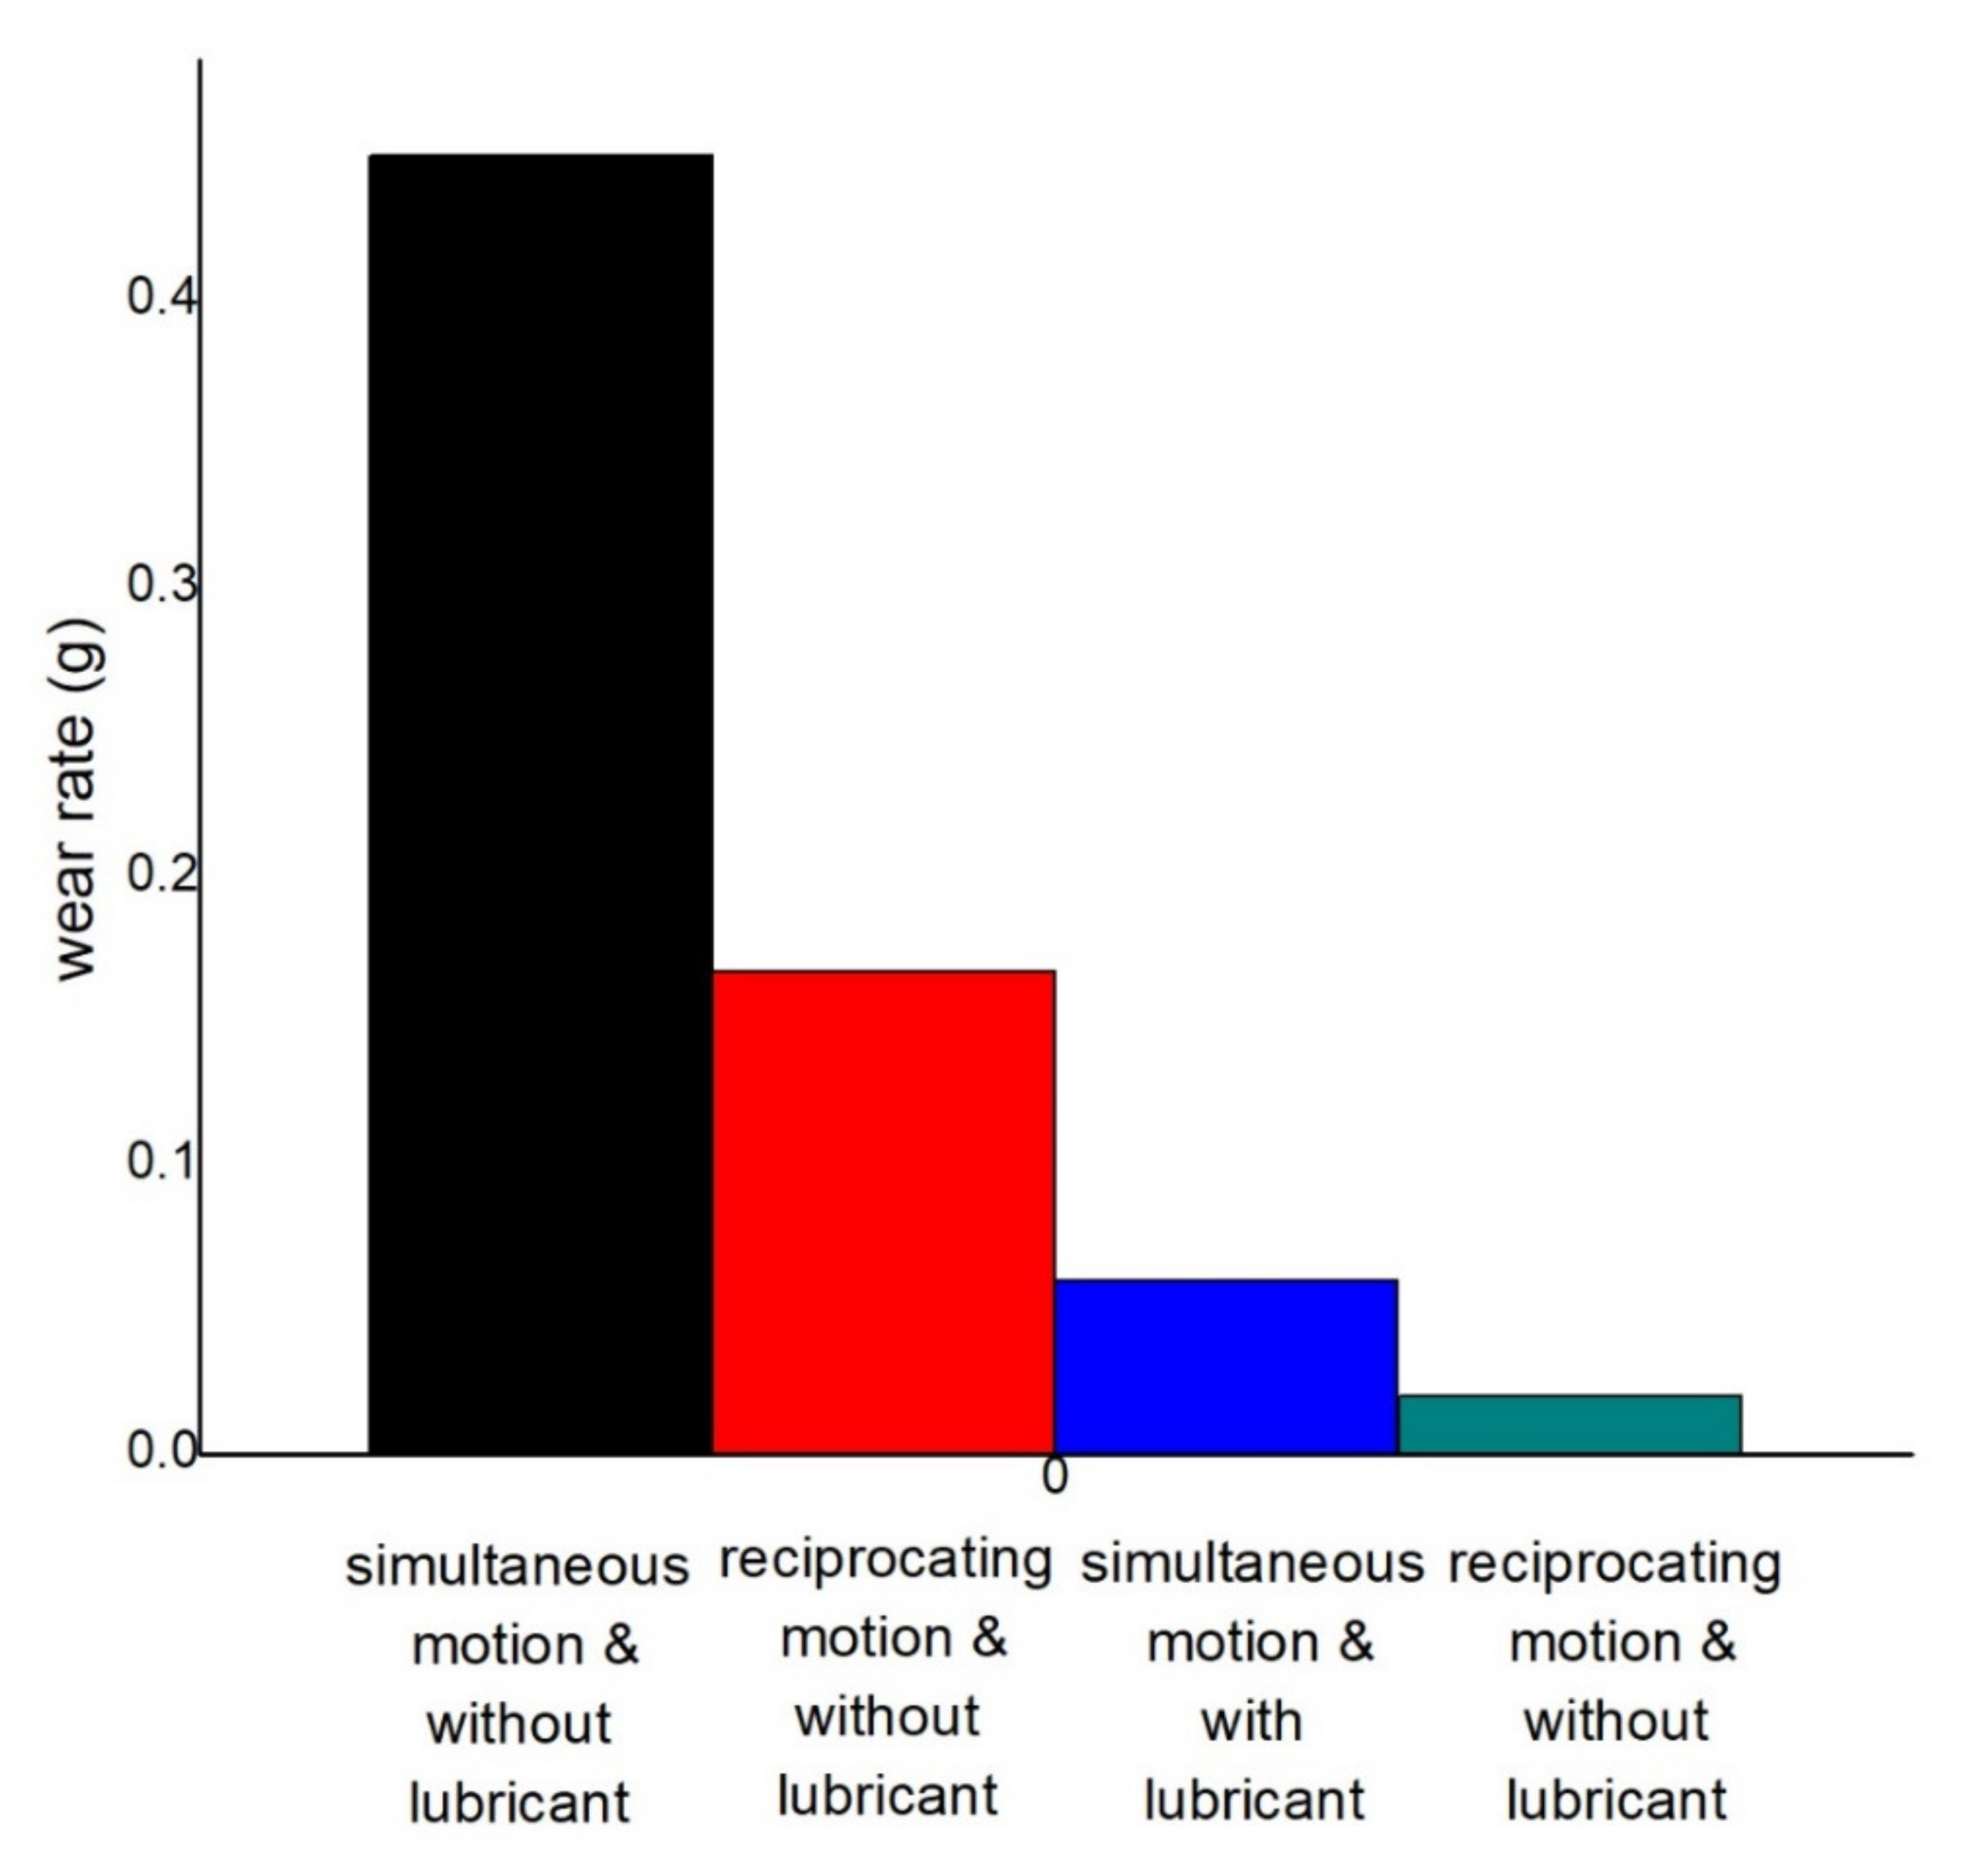
Figure 19.
Wear rate comparison at 2.5 N load and dry condition.
Figure 19.
Wear rate comparison at 2.5 N load and dry condition.
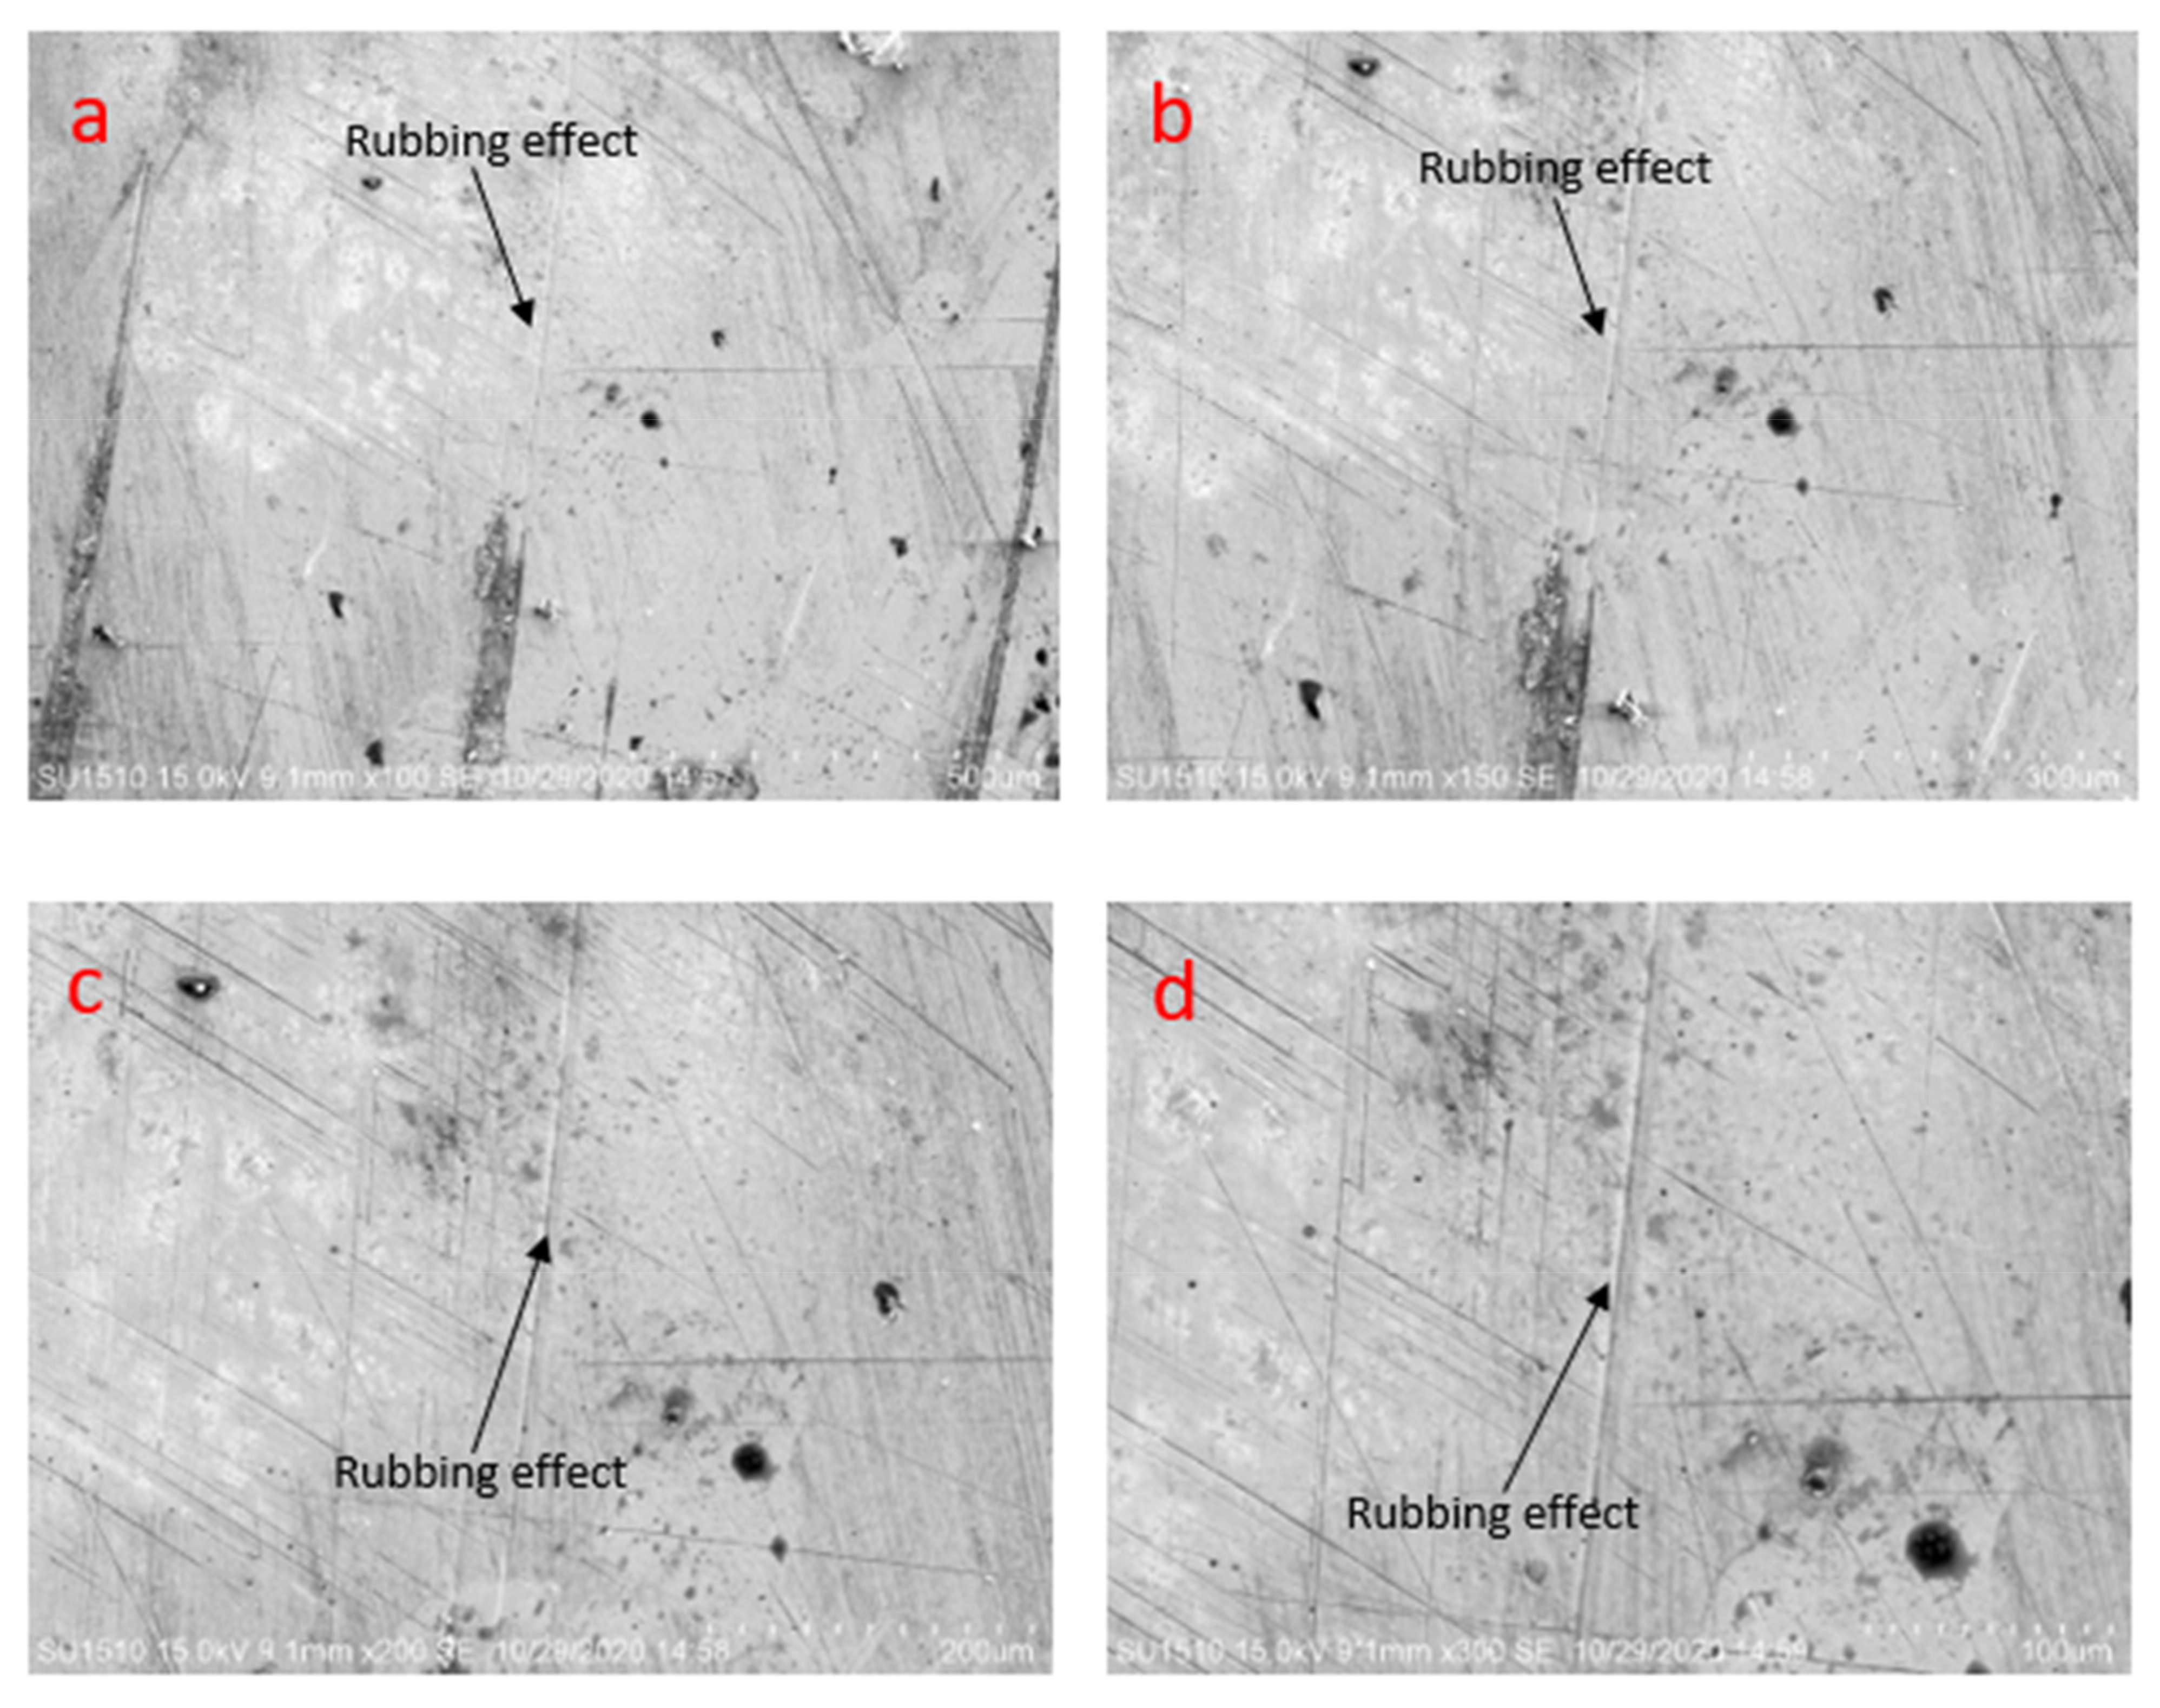
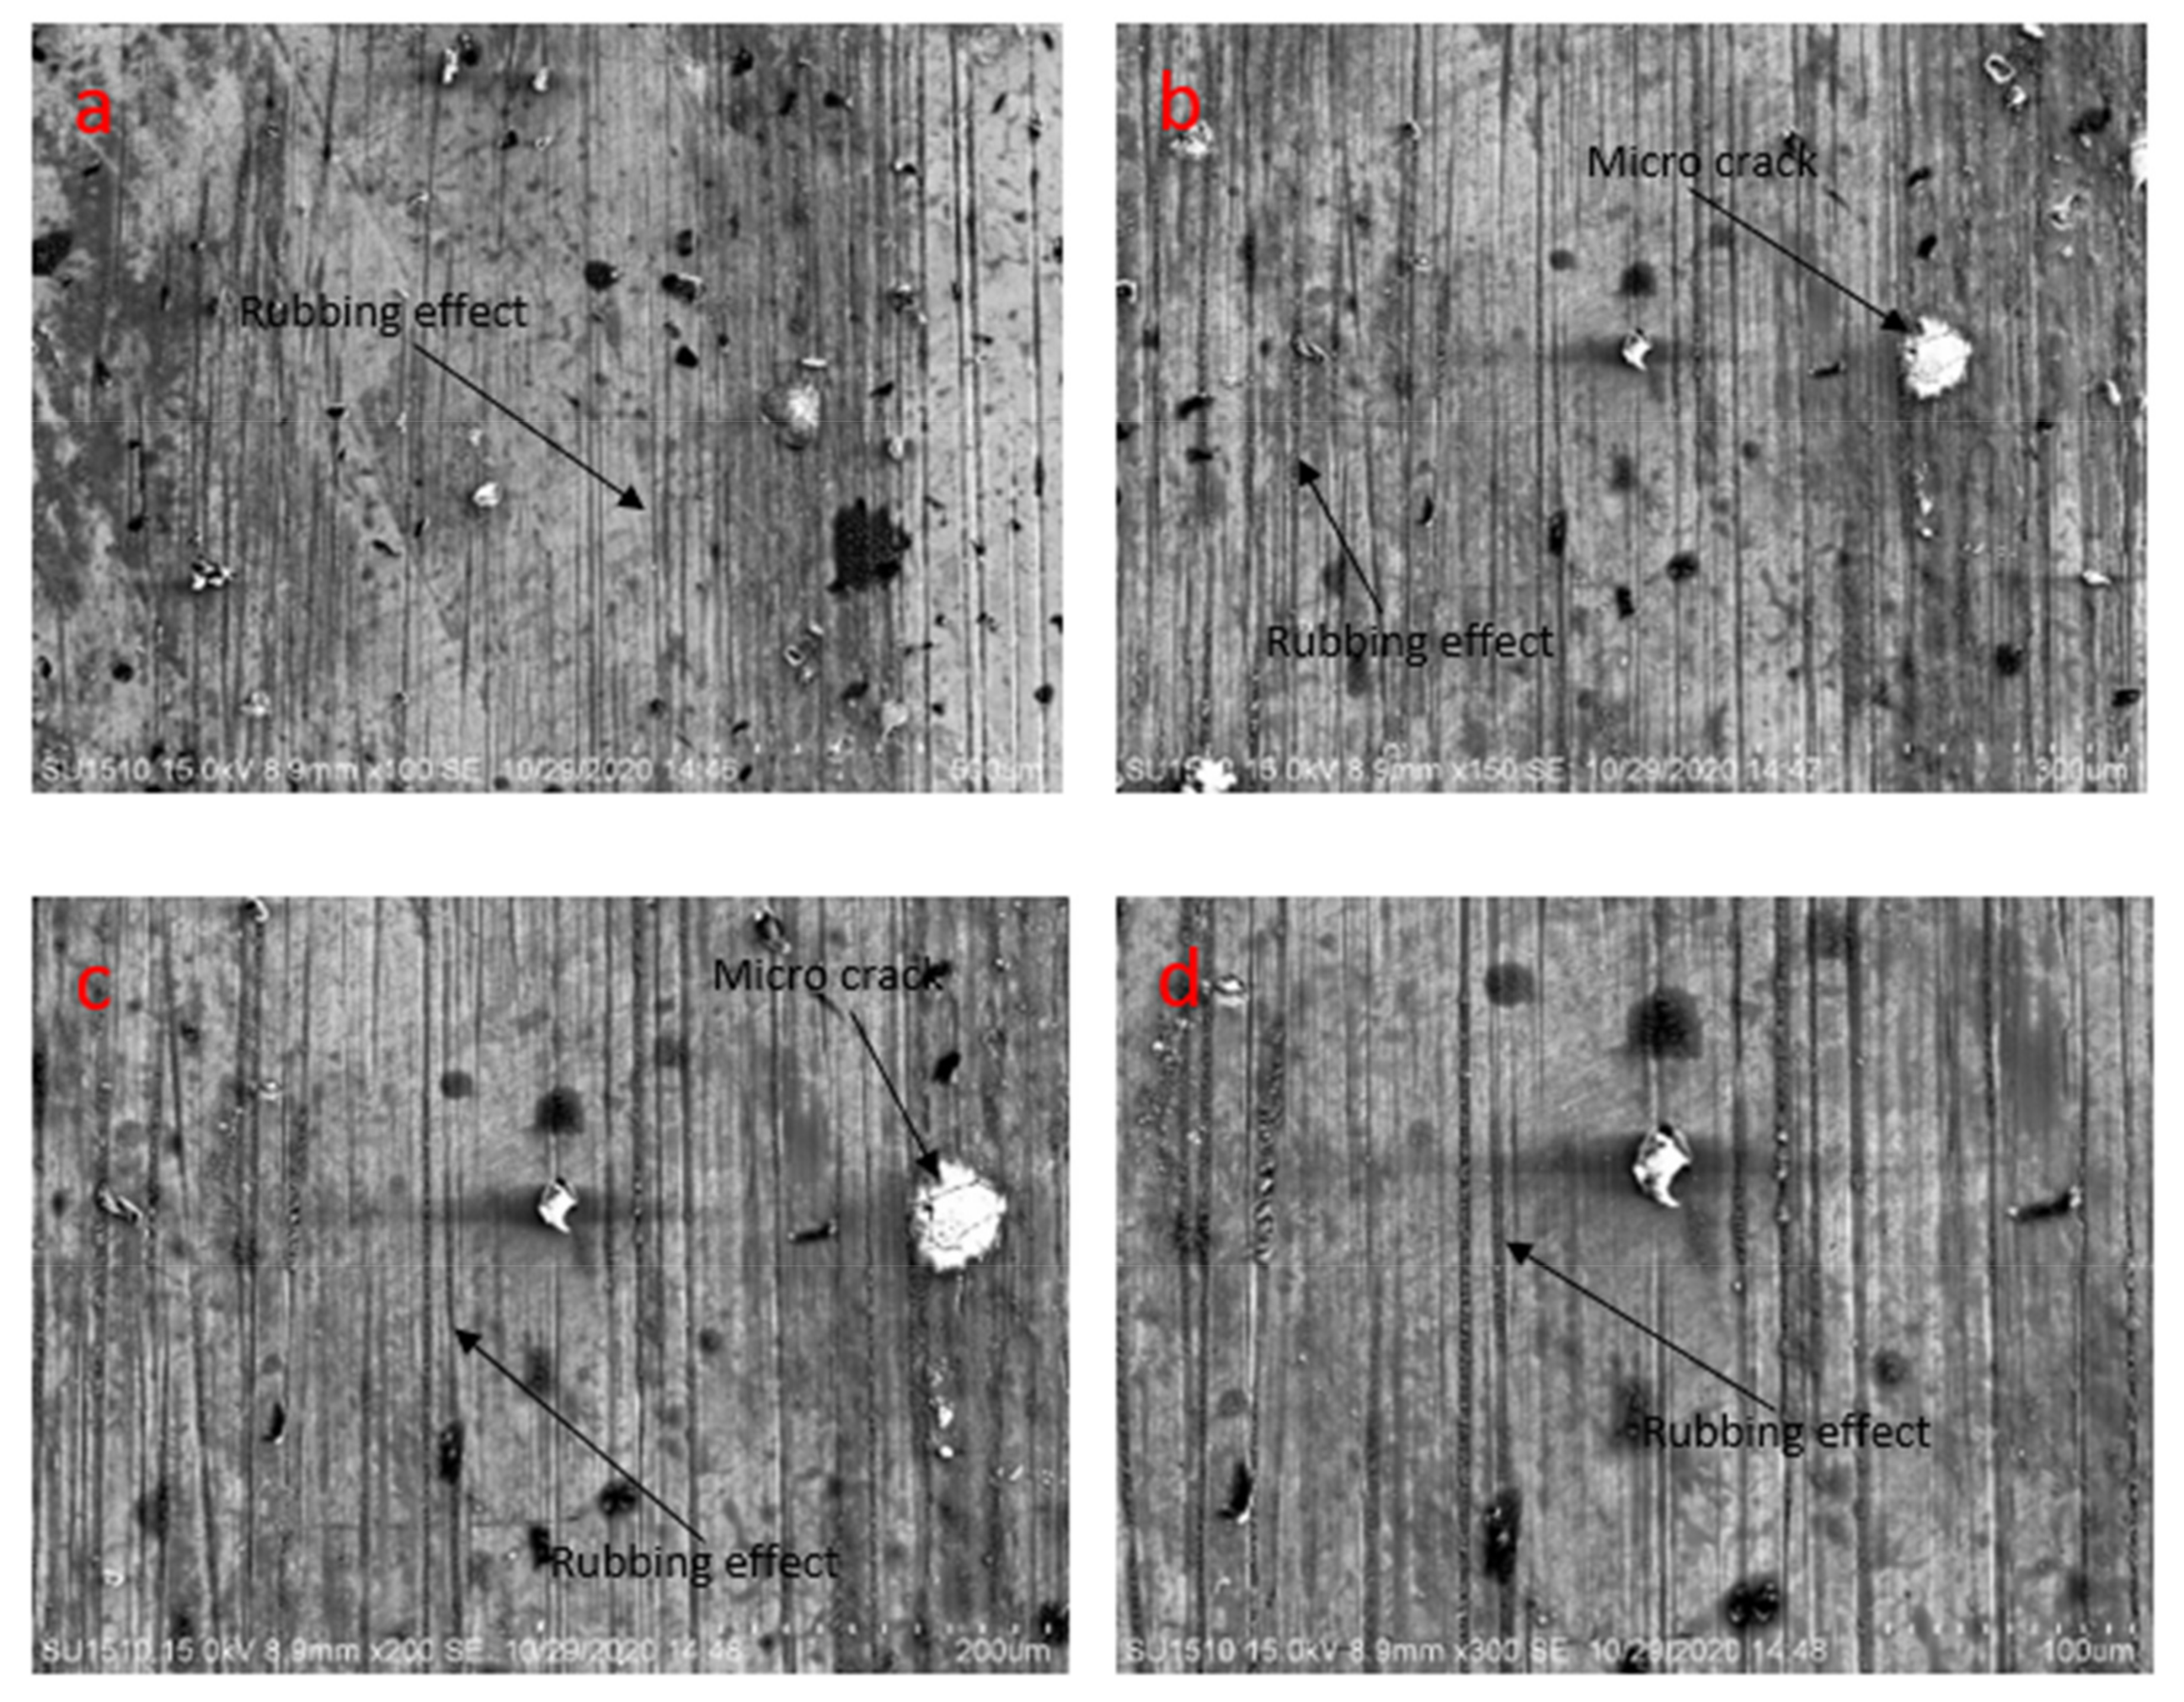
Figure 20.
Scanning electron microscopy analysis of the sample after tribological test at 1.5 N applied force, 0.2 m/s pin velocity, and without lubricating condition (a) at 500 µm, (b) at 300 µm, (c) at 200 µm, (d) at 100 µm.
Figure 20.
Scanning electron microscopy analysis of the sample after tribological test at 1.5 N applied force, 0.2 m/s pin velocity, and without lubricating condition (a) at 500 µm, (b) at 300 µm, (c) at 200 µm, (d) at 100 µm.
Figure 21.
COF at 0.45 m/s disc, 0.2 m/s pin velocity, and dry condition.
Figure 21.
COF at 0.45 m/s disc, 0.2 m/s pin velocity, and dry condition.
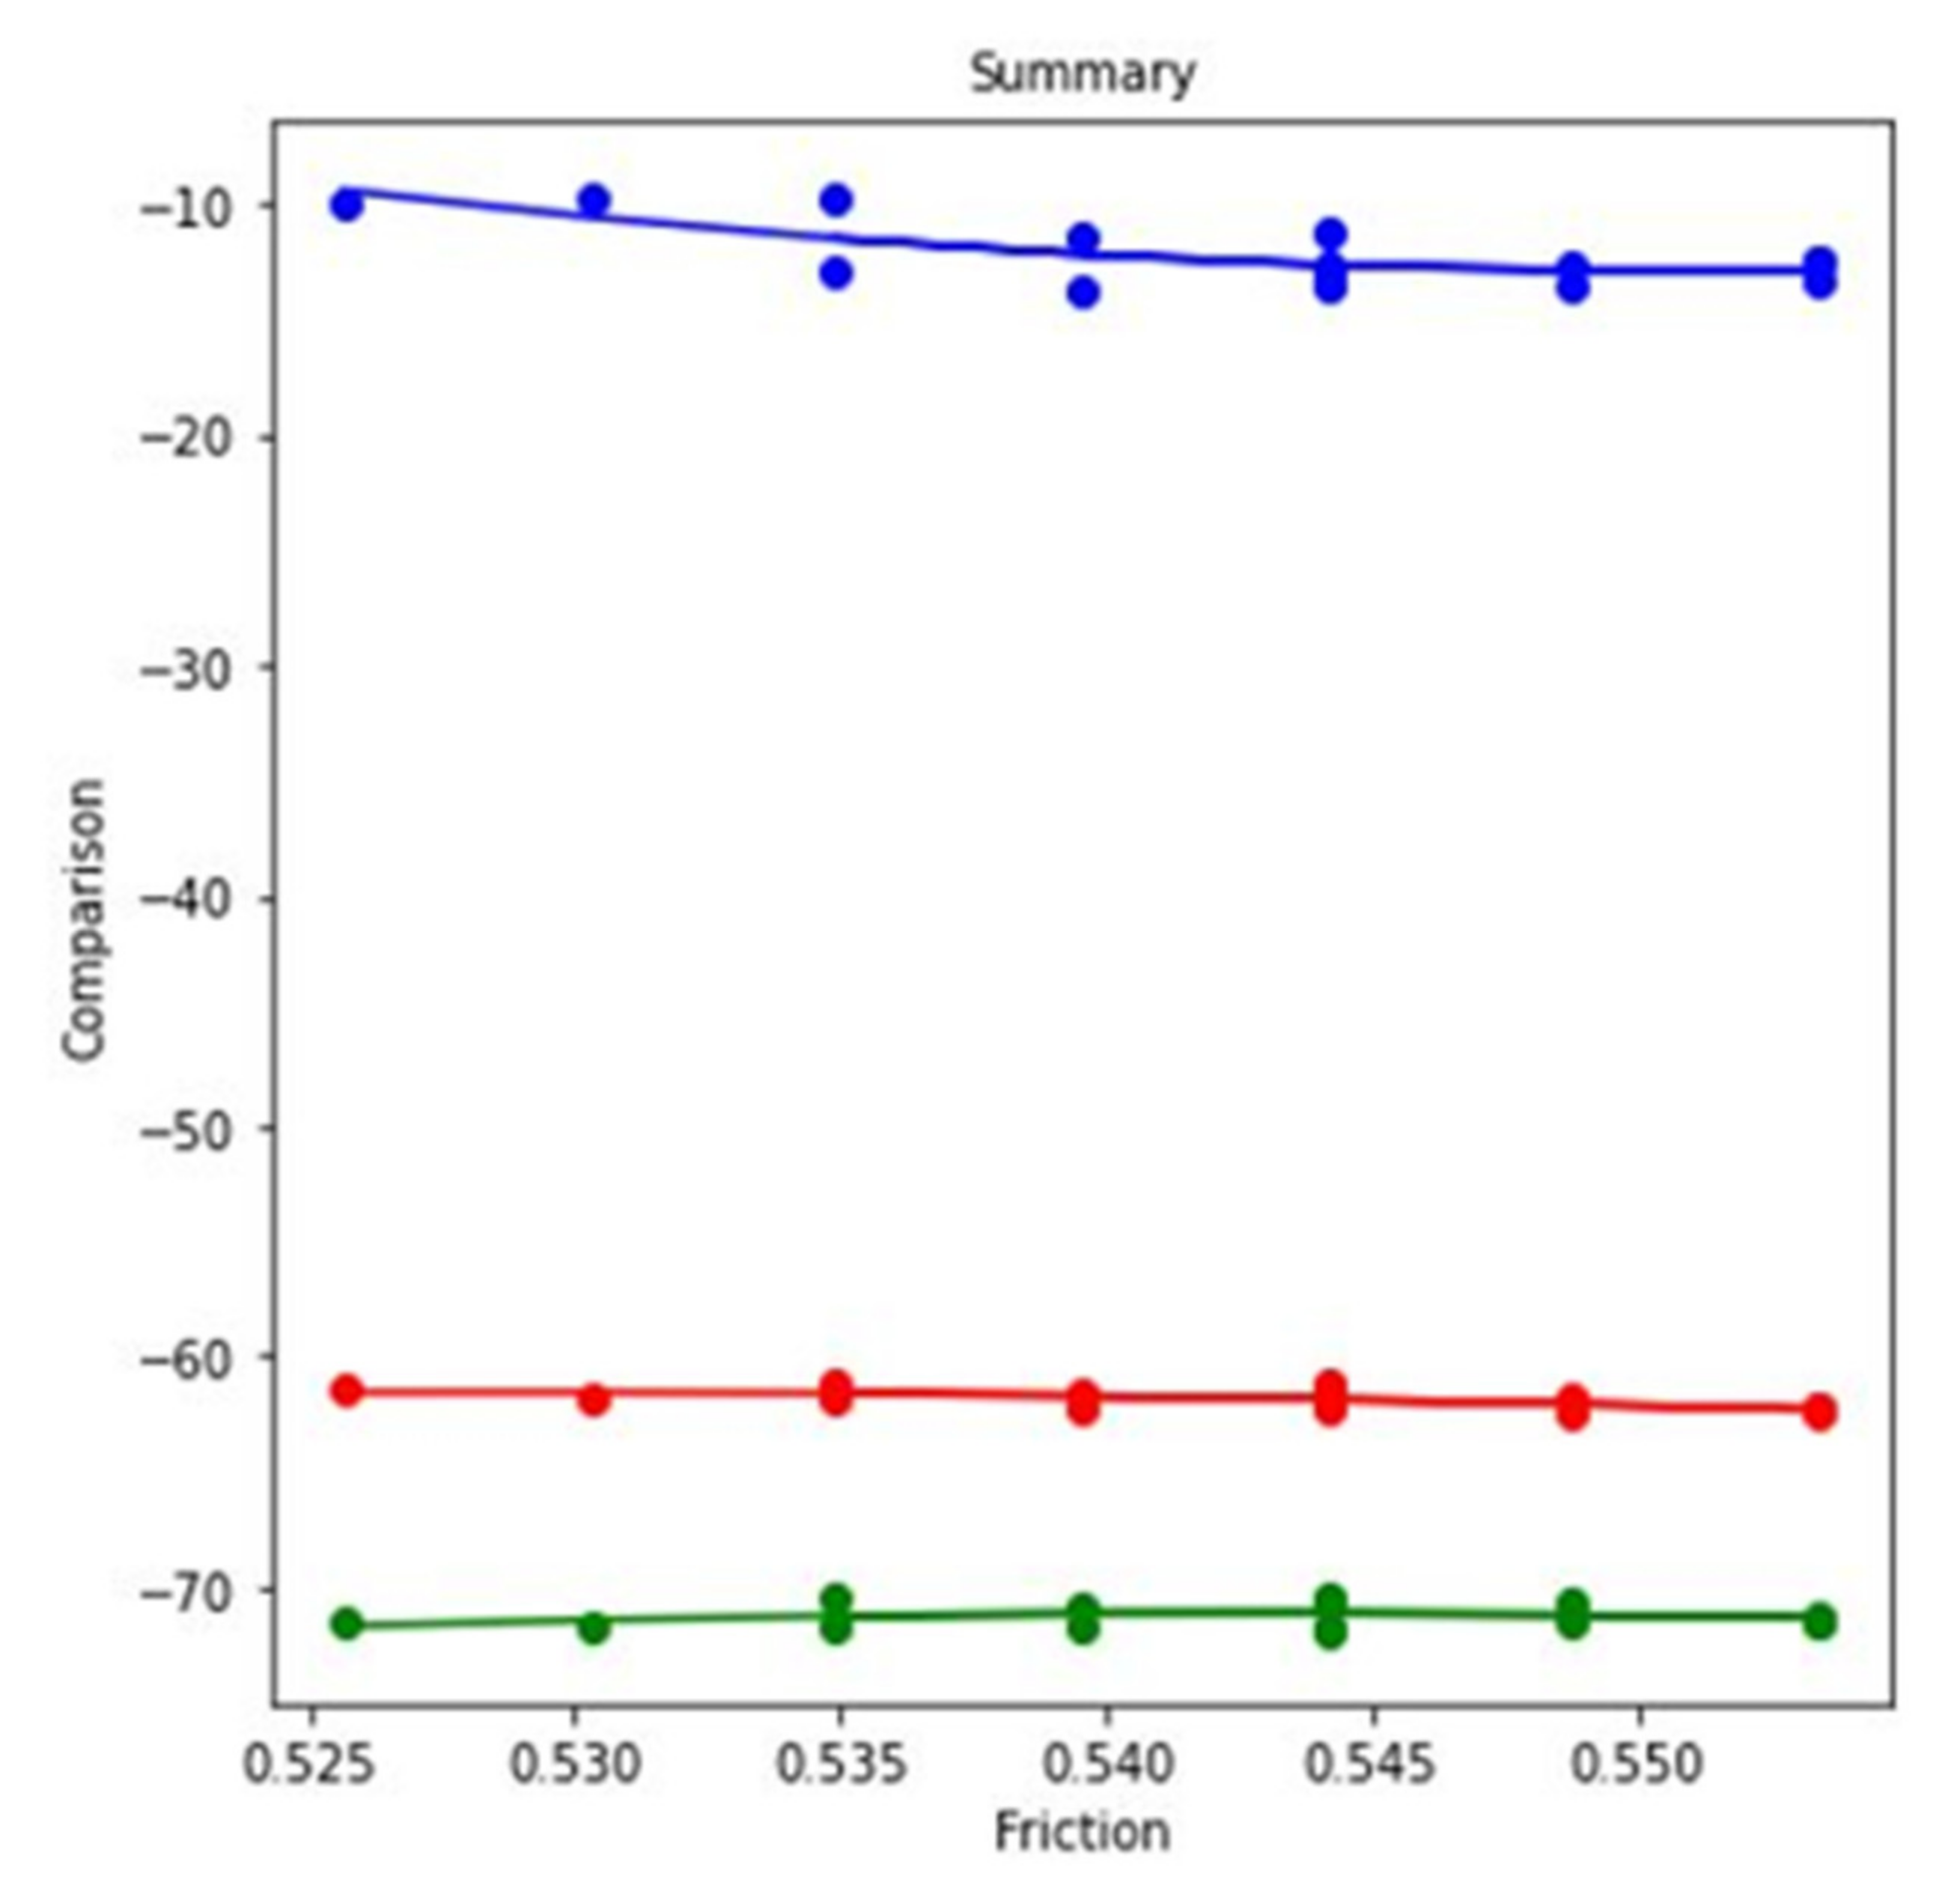
Figure 22.
Regression model for COF at 0.45 m/s disc velocity, 0.2 m/s pin velocity, and dry condition.
Figure 22.
Regression model for COF at 0.45 m/s disc velocity, 0.2 m/s pin velocity, and dry condition.
Figure 23.
Comparison of wear rate at 0.45 m/s disc, 0.2 m/s pin velocity, and dry condition.
Figure 23.
Comparison of wear rate at 0.45 m/s disc, 0.2 m/s pin velocity, and dry condition.
Figure 24.
Scanning electron microscopy of the specimens after friction test at 4.5 N load, 0.2 m/s pin, 0.45 m/s disc velocity, and at dry condition (a) at 500 µm, (b) at 300 µm, (c) at 200 µm, (d) at 100 µm.
Figure 24.
Scanning electron microscopy of the specimens after friction test at 4.5 N load, 0.2 m/s pin, 0.45 m/s disc velocity, and at dry condition (a) at 500 µm, (b) at 300 µm, (c) at 200 µm, (d) at 100 µm.
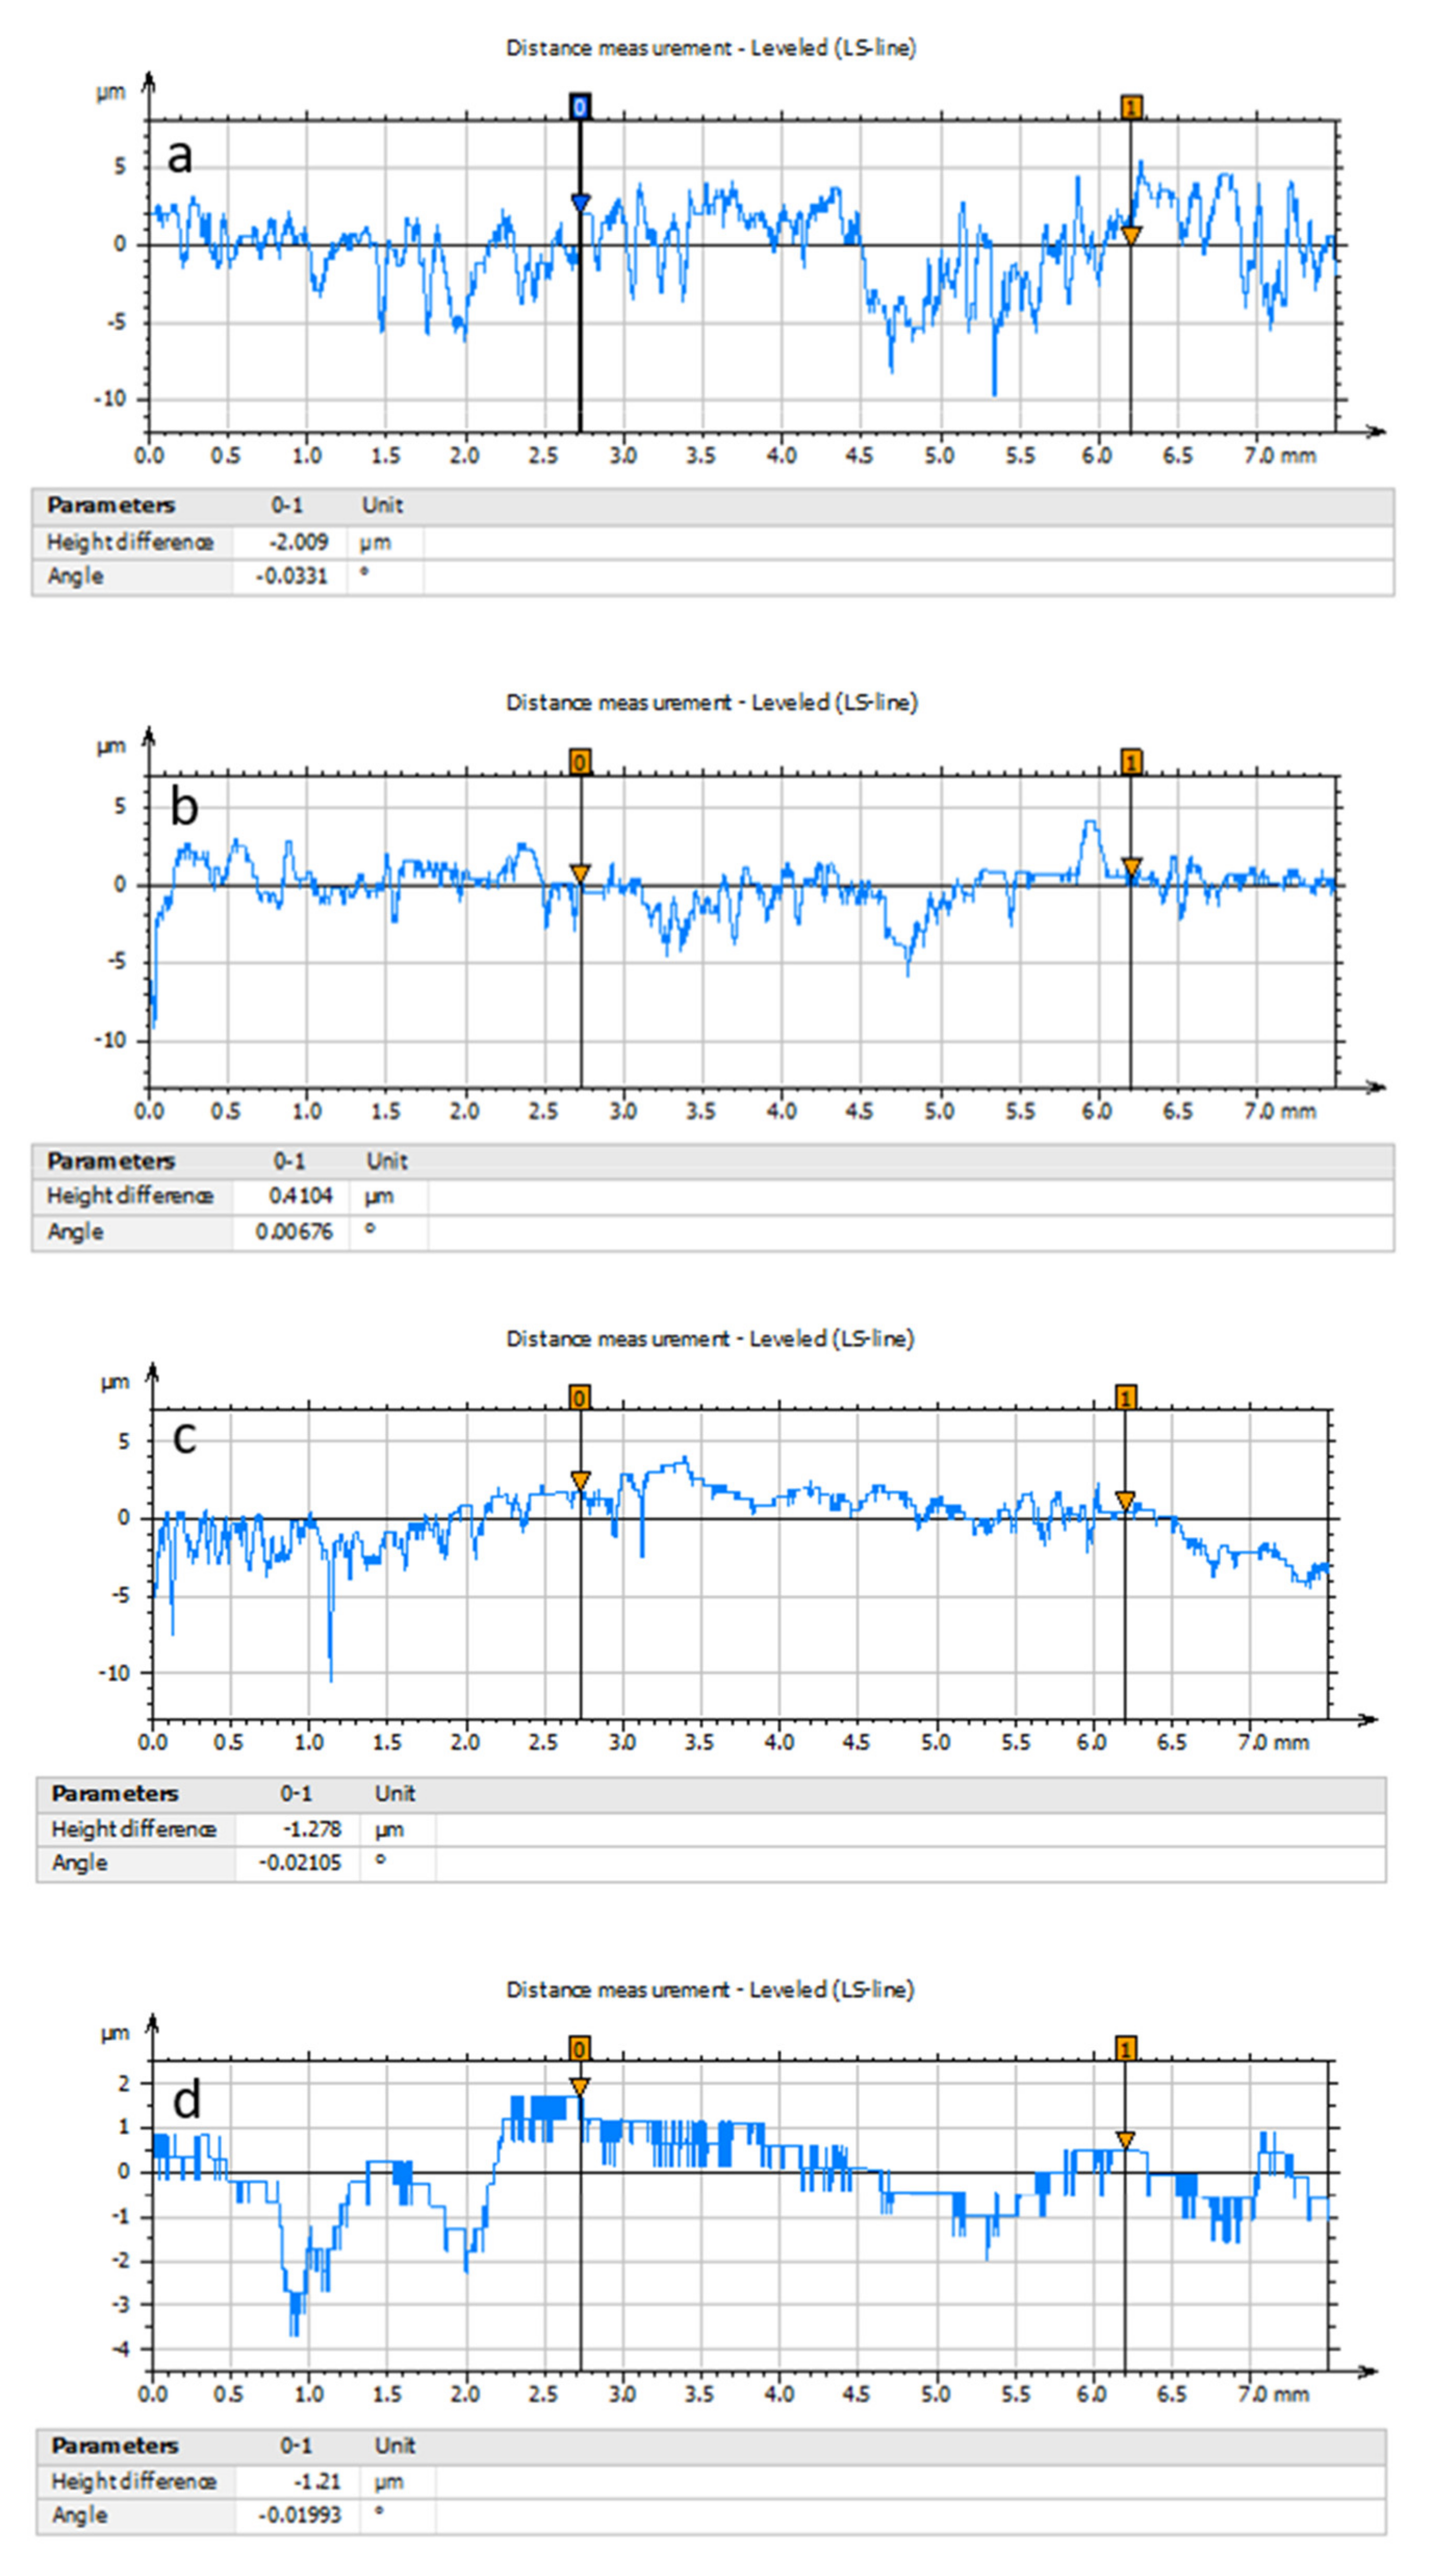
Figure 25.
Roughness analysis of the sample at (a) simultaneous motion of pin and disc at dry condition, (b) reciprocating motion of pin at dry condition, (c) simultaneous motion of pin and disc at lubricated condition, (d) reciprocating motion of pin at lubricated condition.
Figure 25.
Roughness analysis of the sample at (a) simultaneous motion of pin and disc at dry condition, (b) reciprocating motion of pin at dry condition, (c) simultaneous motion of pin and disc at lubricated condition, (d) reciprocating motion of pin at lubricated condition.
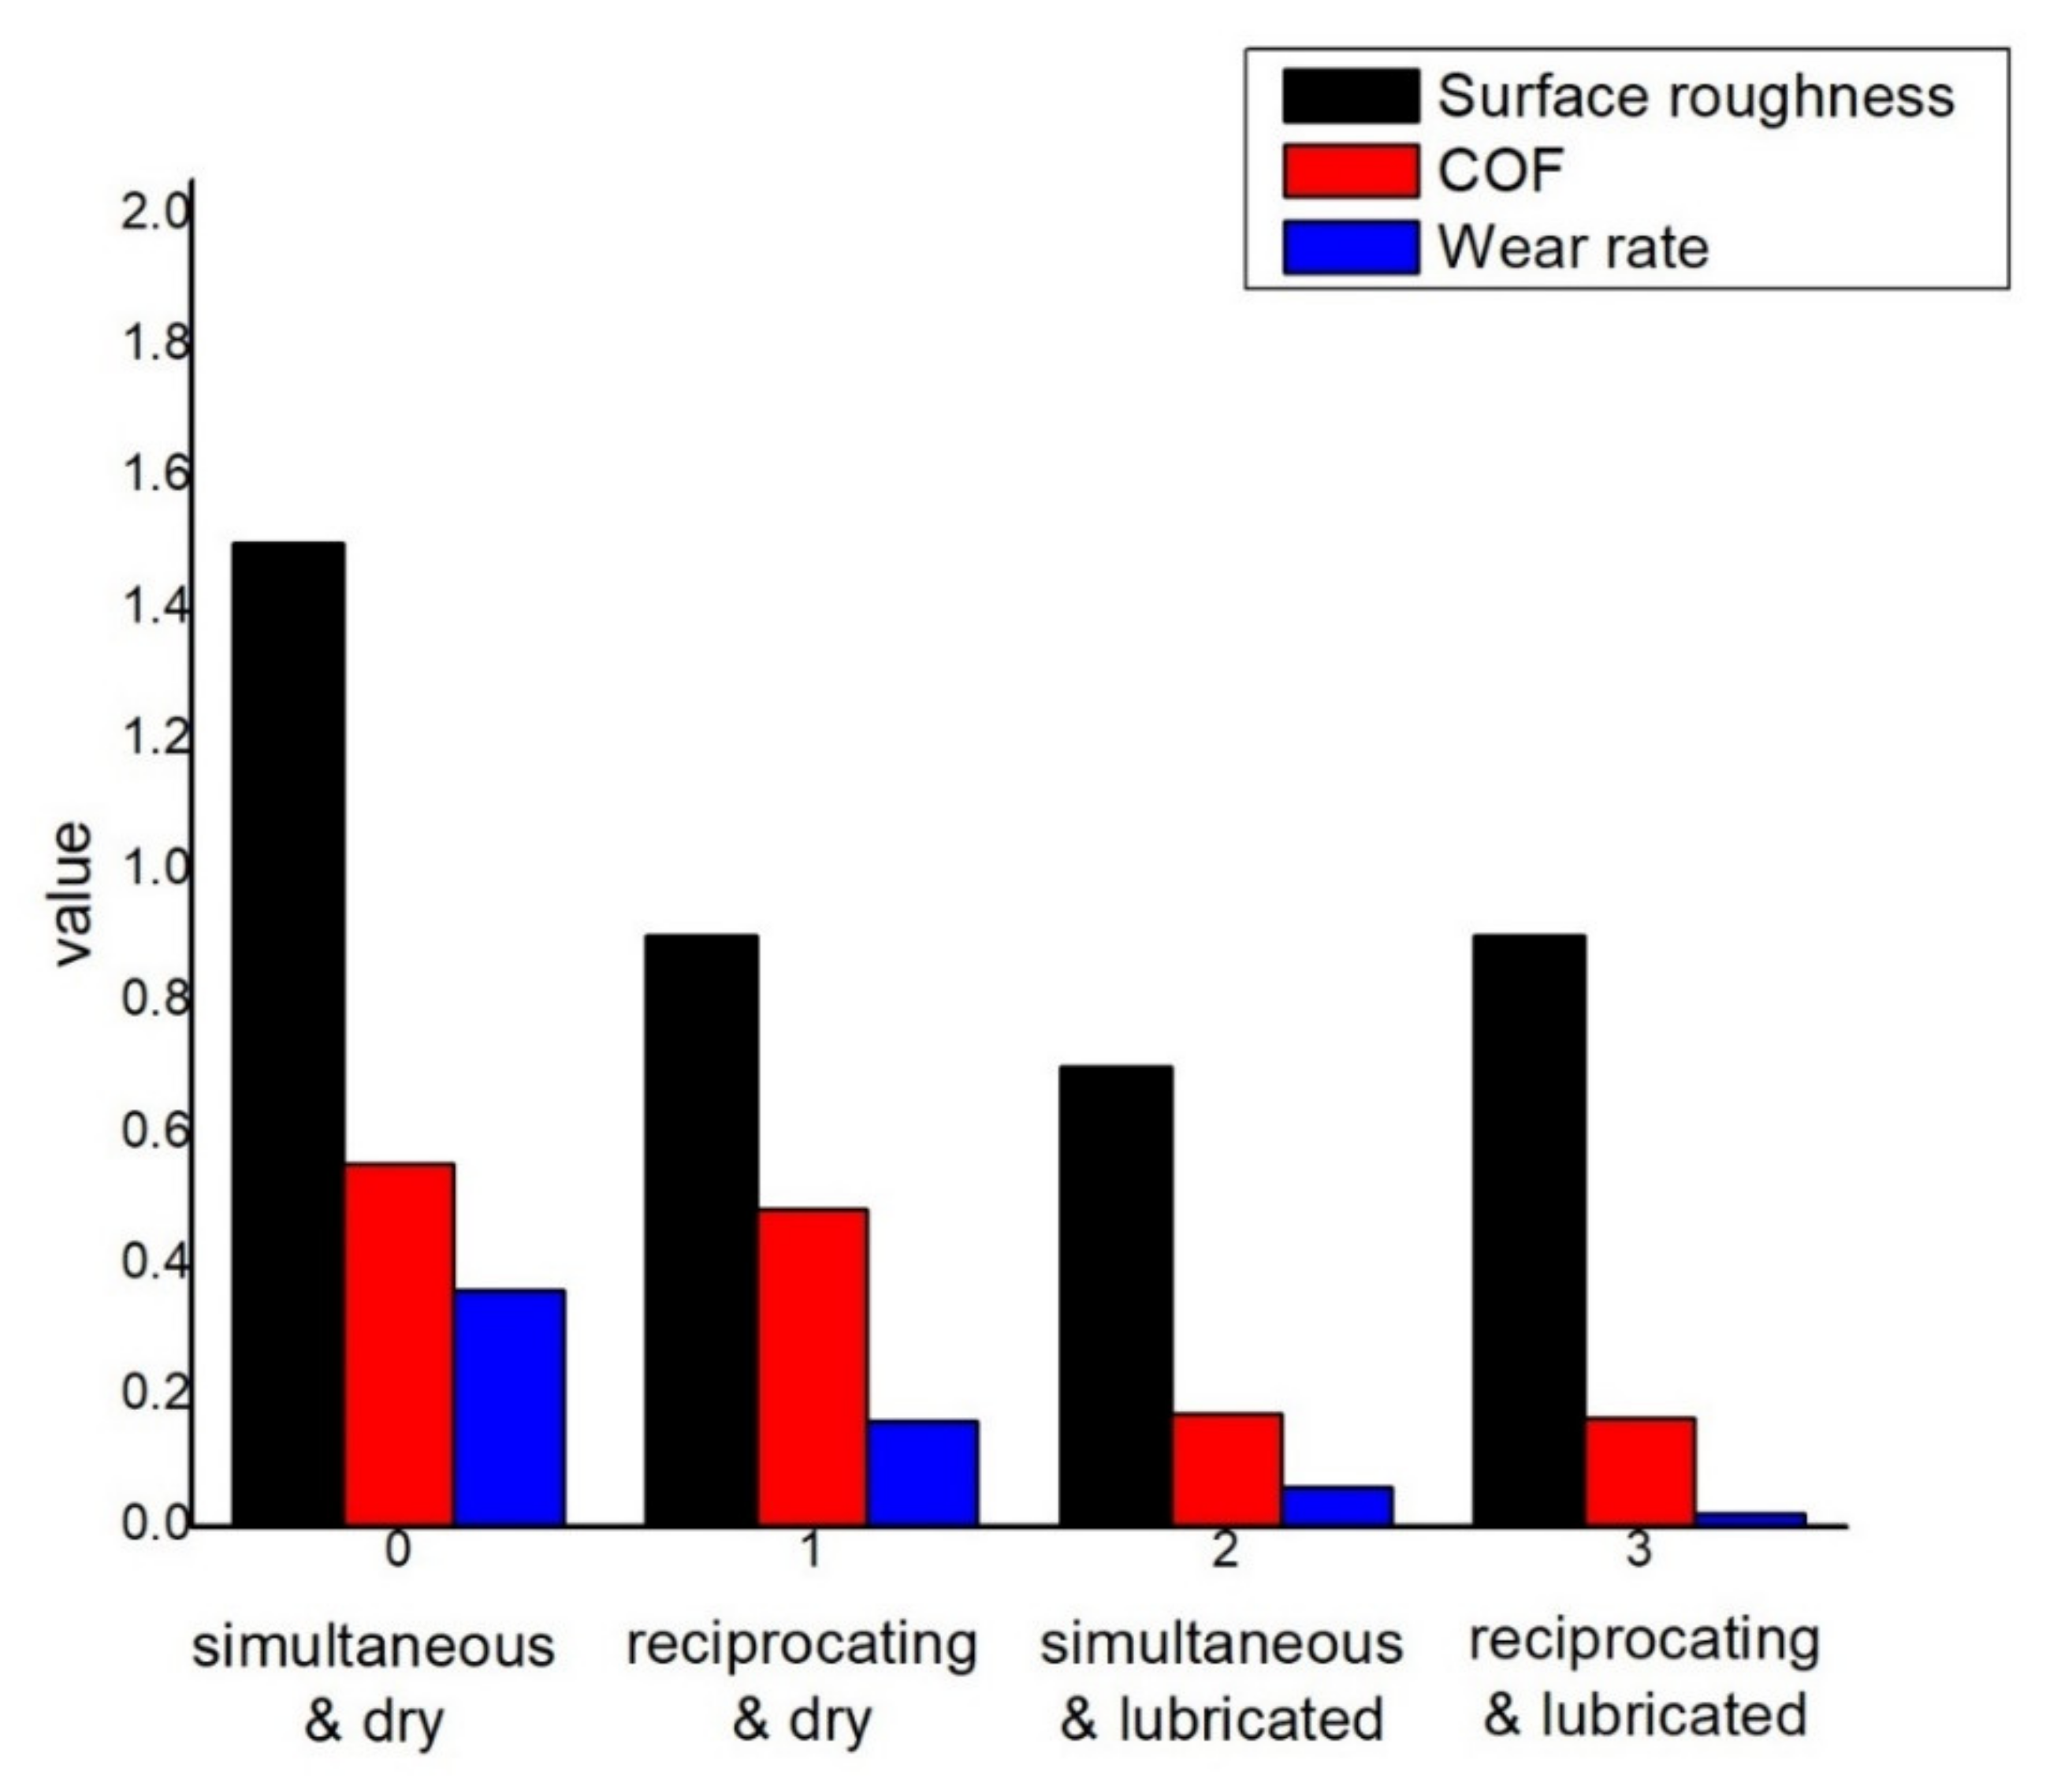
Figure 26.
Surface roughness, COF, and wear rate comparison.
Figure 26.
Surface roughness, COF, and wear rate comparison.
Table 1.
Comparison of variation of COF at different conditions.
Table 1.
Comparison of variation of COF at different conditions.
| SL. | Friction at 3.5 N Applied Force, 0.45 m/s Disc Velocity, 0.15 m/s Pin Velocity, and without Lubricant | Comparison of Friction at 3.5 N Applied Force, 0.15 m/s Pin Motion, and without Lubricant with the First One (%) | Comparison of Friction at 3.5 N Applied Force, 0.45 m/s Disc Motion, 0.15 m/s Pin Motion, and with Lubricant with the First One (%) | Comparison of Friction at 3.5 N Applied Force, 0.15 m/s Pin Motion, and with Lubricant with the First One (%) |
|---|
| 1 | 0.18961 | −5.273983 | −13.13749 | −16.9664 |
| 2 | 0.18961 | −5.273983 | −12.27783 | −16.18058 |
| 3 | 0.19125 | −5.228758 | −13.03007 | −16.72157 |
| 4 | 0.19125 | −4.371242 | −12.17255 | −16.12026 |
| 5 | 0.19289 | −5.184302 | −12.06905 | −16.83343 |
| 6 | 0.19452 | −5.14086 | −11.96792 | −16.76434 |
| 7 | 0.19289 | −3.489035 | −11.22401 | −16.06097 |
| 8 | 0.19452 | −3.459798 | −11.12482 | −16.76434 |
| 9 | 0.19616 | −4.266925 | −11.86786 | −16.70065 |
| 10 | 0.19616 | −3.430873 | −12.70392 | −16.70065 |
| 11 | 0.19616 | −2.594821 | −12.70392 | −17.46024 |
| 12 | 0.19779 | −3.397543 | −14.24743 | −17.38713 |
| 13 | 0.19616 | −3.430873 | −13.53487 | −15.93597 |
| 14 | 0.19452 | −3.459798 | −13.64898 | −16.76434 |
| 15 | 0.19452 | −3.459798 | −14.49208 | −16.76434 |
Table 2.
Wear rate comparison at different conditions.
Table 2.
Wear rate comparison at different conditions.
| SL. | Wear Rate at 3.5 N Load, 0.45 m/s disc, 0.15 m/s Pin Velocity, and Dry Condition | Variation of Wear Rate at 3.5 N Load, 0.15 m/s Pin Motion, and Dry Condition with the First One (%) | Variation of Wear Rate at 3.5 N Load, 0.45 m/s Disc Motion, 0.15 m/s Pin Motion, and with Lubricant with the First One (%) | Variation of Wear Rate at 3.5 N Load, 0.15 m/s Pin Motion, and with Lubricant with the First One (%) |
|---|
| 1 | 0.45 | −62.88889 | −86.66667 | −95.55556 |
Table 3.
COF Comparison at different conditions.
Table 3.
COF Comparison at different conditions.
| SL. | Friction at 2.5 N Load, 0.45 m/s Disc, 0.25 m/s Pin Velocity, and No Lubricant | Comparison of Friction at 2.5 N load, 0.25 m/s Pin Velocity, and No Lubricant with the First One (%) | Comparison of Friction at 2.5 N Applied Force, 0.35 m/s Disc, 0.15 m/s Pin Velocity, and No Lubricant with the First One (%) | Comparison of Friction at 2.5 N Load, 0.15 m/s Pin Velocity, and No Lubricant with the First One (%) |
|---|
| 1 | 0.25283 | −33.38211 | −5.695527 | −39.07764 |
| 2 | 0.25503 | −33.09415 | −5.646395 | −38.74054 |
| 3 | 0.25723 | −33.27761 | −5.598103 | −38.40921 |
| 4 | 0.25723 | −32.8111 | −5.598103 | −38.40921 |
| 5 | 0.25943 | −33.38087 | −5.55063 | −38.77732 |
| 6 | 0.25943 | −32.53286 | −5.55063 | −38.85441 |
| 7 | 0.26163 | −32.4657 | −5.503956 | −39.29213 |
| 8 | 0.26163 | −32.2593 | −5.503956 | −39.36857 |
| 9 | 0.26383 | −31.9903 | −7.125801 | −39.94997 |
| 10 | 0.26163 | −32.2593 | −7.18572 | −40.2859 |
| 11 | 0.26163 | −32.2593 | −8.026602 | −41.12678 |
| 12 | 0.25943 | −32.53286 | −8.094669 | −41.47554 |
| 13 | 0.25943 | −33.38087 | −8.942682 | −41.47554 |
| 14 | 0.25723 | −32.8111 | −9.019166 | −41.83027 |
| 15 | 0.25503 | −33.09415 | −8.234325 | −41.32847 |
Table 4.
Variation of wear rate at distinct operating conditions.
Table 4.
Variation of wear rate at distinct operating conditions.
| SL. | Wear Rate at 2.5 N Applied Force, 0.45 m/s Disc Velocity, 0.25 m/s Pin Velocity, and Dry Condition | Comparison of Wear Rate at 2.5 N Applied Force, 0.25 m/s Pin Velocity, and Dry Condition with the First One (%) | Comparison of Wear Rate at 2.5 N Applied Force, 0.35 m/s Disc Velocity, 0.15 m/s Pin Velocity, and Dry Condition with the First One (%) | Comparison of Wear Rate at 2.5 N Applied Force, 0.15 m/s Pin Velocity, and Dry Condition with the First One (%) |
|---|
| 1 | 0.47 | −63.82979 | −25.53191 | −68.08511 |
Table 5.
Comparison of COF at different conditions.
Table 5.
Comparison of COF at different conditions.
| SL. | Friction at 1.5 N Load, 0.45 m/s Disc, 0.2 m/s Pin Velocity, and Dry Condition | Variation of Friction at 1.5 N Load, 0.2 m/s Pin Velocity, and Dry Condition with the First One (%) | Variation of Friction at 4.5 N Load, 0.45 m/s Disc, 0.2 m/s Pin Velocity, and Dry Condition with the First One (%) | Variation of Friction at 4.5 N Load, 0.2 m/s Pin Velocity, and Dry Condition with the First One (%) |
|---|
| 1 | 0.52566 | −9.939885 | −61.45607 | −71.53864 |
| 2 | 0.53028 | −9.853285 | −61.79188 | −71.7866 |
| 3 | 0.53491 | −9.769868 | −61.81601 | −71.72422 |
| 4 | 0.53953 | −11.39881 | −62.14298 | −71.66237 |
| 5 | 0.54416 | −13.00169 | −62.1637 | −71.90348 |
| 6 | 0.54416 | −11.164 | −62.04793 | −71.60394 |
| 7 | 0.54878 | −12.75557 | −62.48223 | −71.54415 |
| 8 | 0.55341 | −12.51333 | −62.50158 | −71.48769 |
| 9 | 0.55341 | −12.51333 | −62.20524 | −71.48769 |
| 10 | 0.55341 | −13.34996 | −62.20524 | −71.19134 |
| 11 | 0.54878 | −13.46077 | −61.88637 | −70.64944 |
| 12 | 0.54416 | −12.72604 | −61.26323 | −70.40025 |
| 13 | 0.54416 | −13.57689 | −61.56278 | −70.70163 |
| 14 | 0.53953 | −13.69155 | −61.53689 | −70.75417 |
| 15 | 0.53491 | −12.9461 | −61.20469 | −70.50158 |
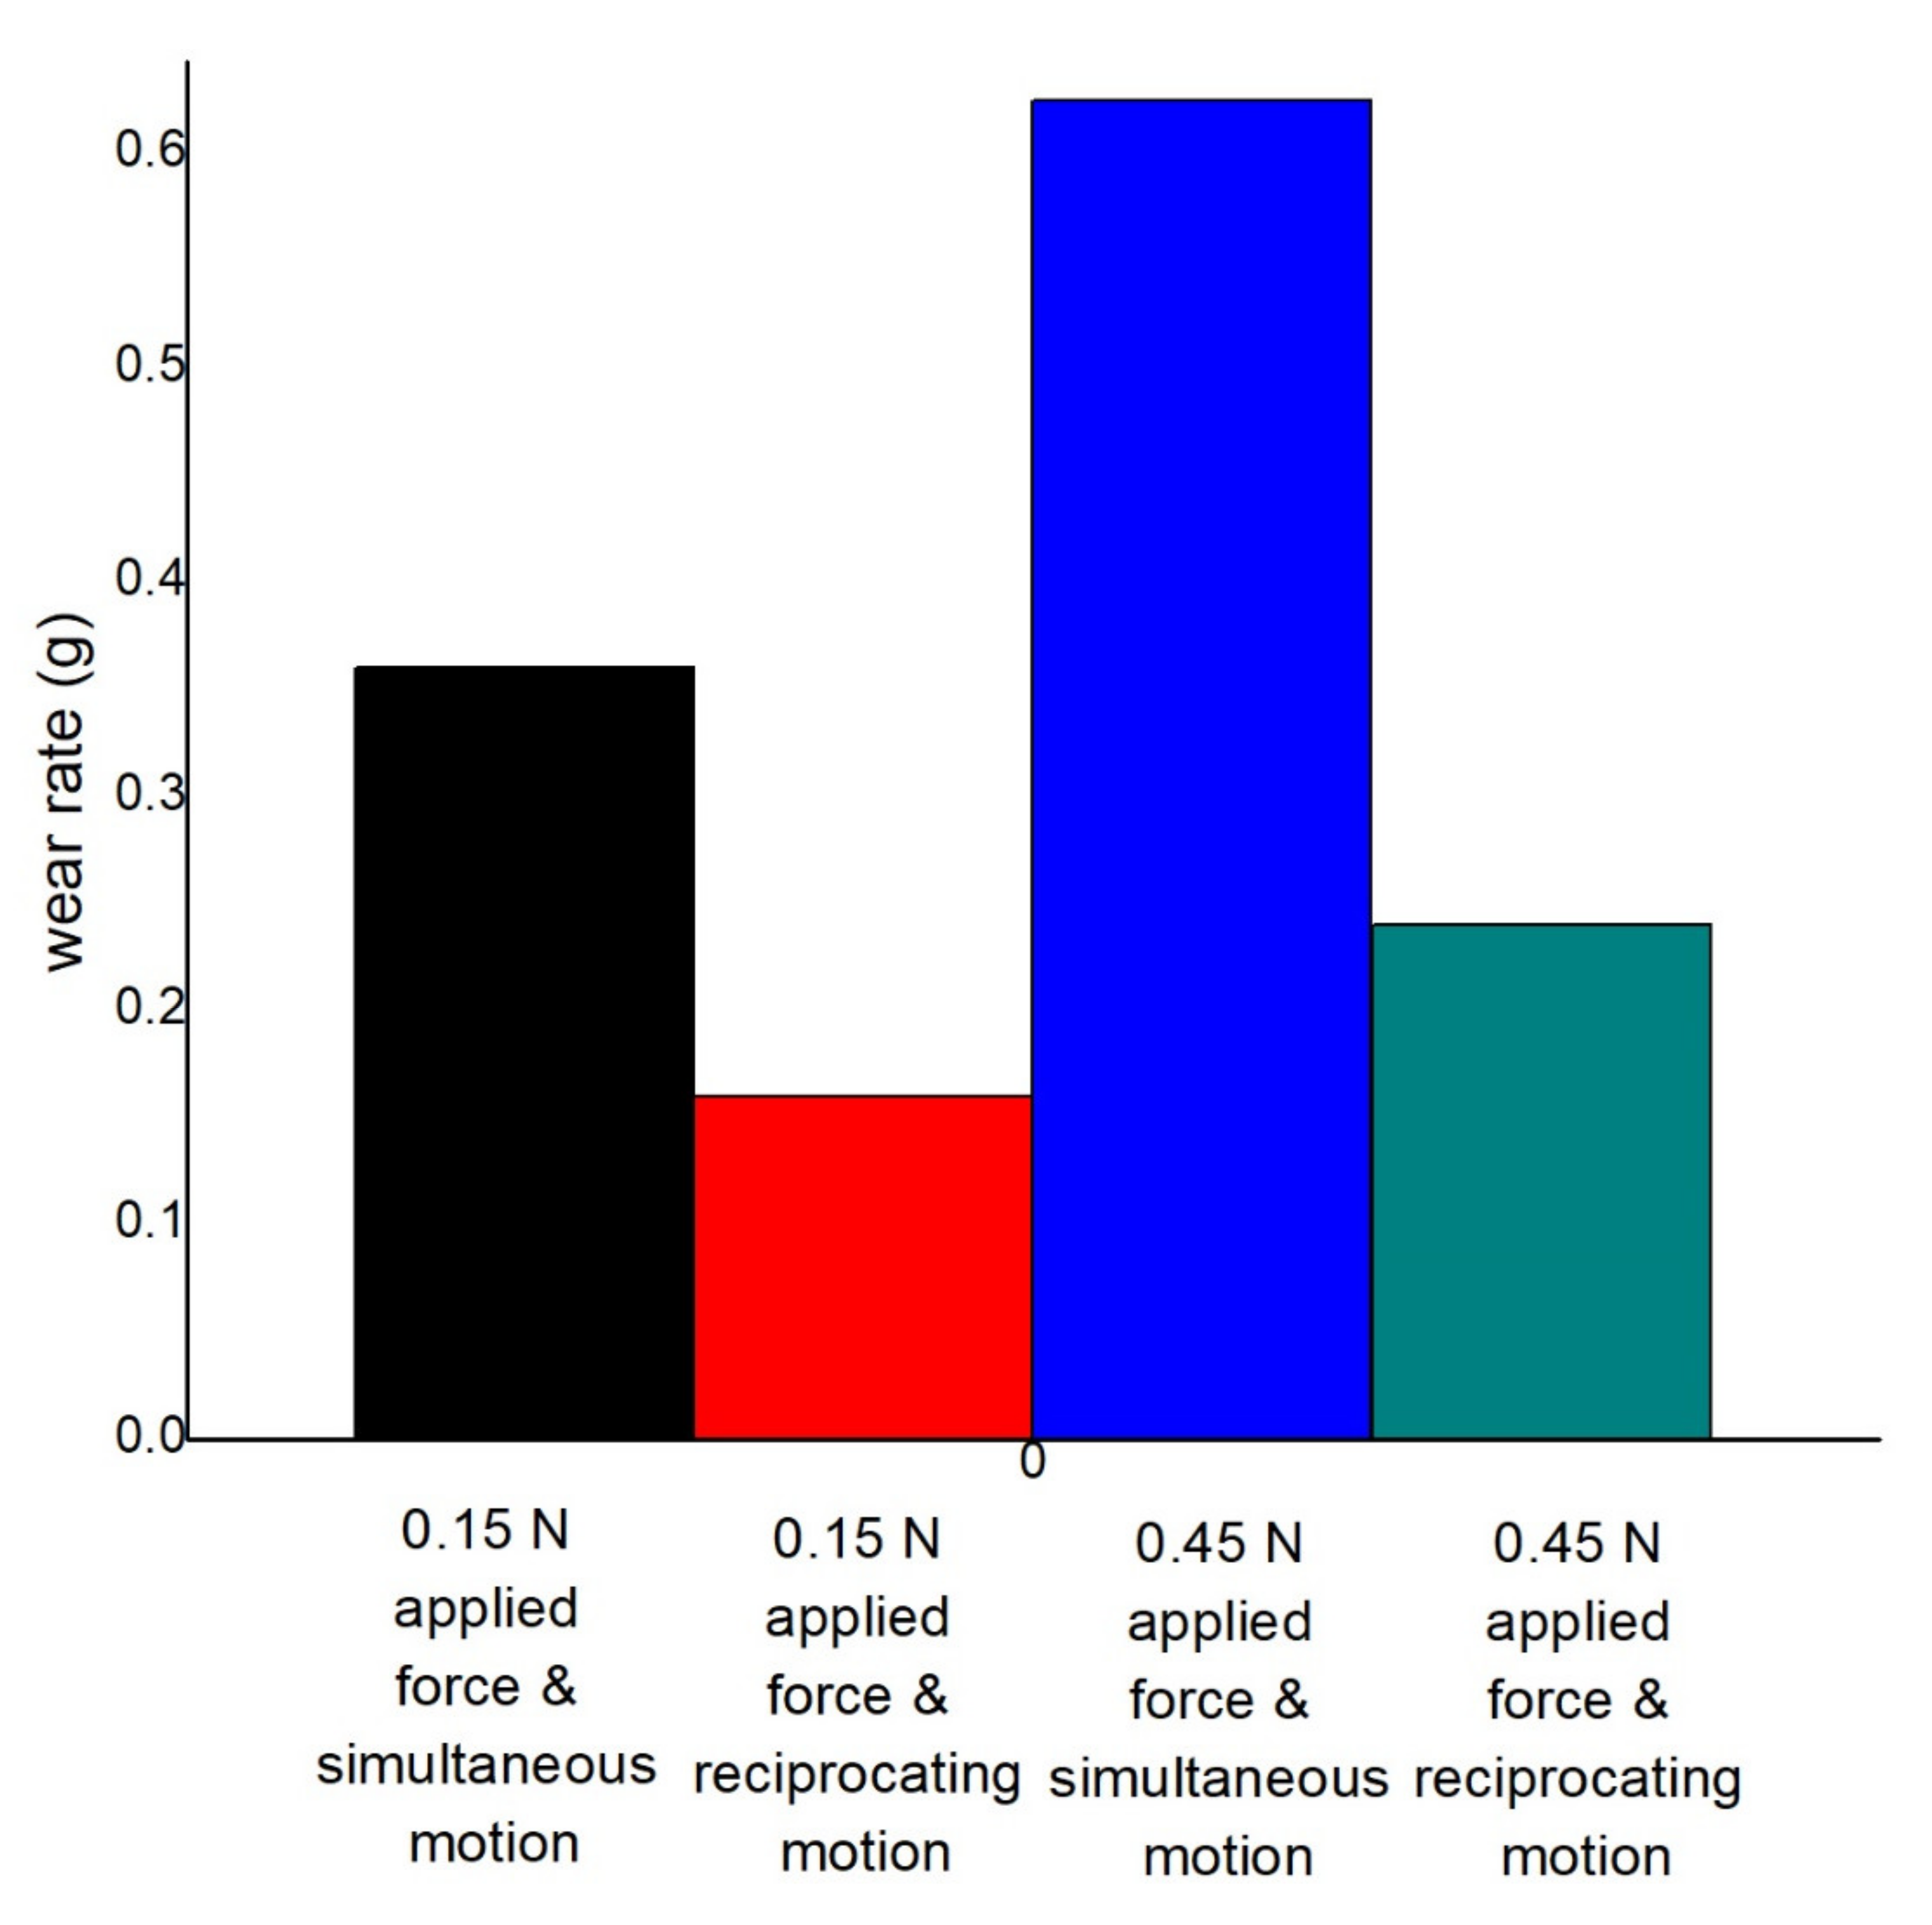
Table 6.
Comparison of wear rate at different conditions.
Table 6.
Comparison of wear rate at different conditions.
| SL. | Wear Rate at 1.5 N Load, 0.45 m/s Disc Velocity, 0.2 m/s Pin Velocity, and Dry Condition | Comparison of Wear Rate at 1.5 N Load, 0.2 m/s Pin Velocity, and Dry Condition with the First One (%) | Comparison of Wear Rate at 4.5 N Applied Force, 0.45 m/s Disc, 0.2 m/s Pin Velocity, and Dry Condition with the First One (%) | Comparison of Wear Rate at 4.5 N Load, 0.2 m/s Pin Velocity, and Dry Condition with the First One (%) |
|---|
| 1 | 0.36 | −55.55556 | +73.6111 | −33.33333 |


 ,
, 


