1. Introduction
Global warming caused by greenhouse gas (GHG) emissions has raised worldwide concern [
1] and has become a major challenge to the sustainable development of human society and natural eco-systems [
2]. Many countries, like China, Canada, and so on, have realized the threat of global warming and have taken a lot of measures to reduce GHG emissions and limit the rise of average global temperature [
3,
4,
5]. However, the effect of mitigating GHG is not significant and the emissions have increases continuously [
6,
7]. Reducing GHG emissions has therefore become a hot topic worldwide.
It is generally believed that carbon dioxide (CO
2) is a significant contributor to the accelerated global GHG emissions [
8,
9], among which a great proportion of emissions have come from anthropogenic activities, especially the overconsumption of coal, oil, natural gas and other fossil fuels [
10]. In fact, the agricultural production activities based on agricultural land utilization (ALU), which is also a main source of carbon emissions in the atmosphere, have a great impact on the carbon cycle [
5,
11]. In Canada, the agricultural sector contributes approximately 20% to the total GHG emissions [
5]. According to the Word Bank [
12], agriculture practices including agricultural land conversion and agricultural land utilization have produced about 20% of carbon dioxide globally.
China, as a large agricultural country, has achieved rapid urbanization and agricultural economic development since its reform and opening-up policy in the late 1970s [
13]. Especially, China now successfully feeds 20% of the world’s population with less than 10% of the world’s cultivated land. However, this high-speed development has consumed excessive resources and the environmental cost has been huge. From 1990 to 2010, China’s carbon emissions expanded from 2461 million tons to 8241 million tons [
14], and now China is the largest carbon emitter in the world [
14]. Considering nearly 17% of China’s carbon emissions are from agriculture [
15] and the important status of China in the world, scholars from different countries have their eyes on agricultural carbon emissions in China. Their studies mainly concentrated on the calculation method [
16,
17], regional discrepancies [
17,
18,
19], driving forces [
17,
18,
19,
20] and the reduction strategies [
21,
22] of carbon emissions from agricultural practices in different time and space standards. **ong et al. [
23] and Luo et al. [
24] explored the relationship between agricultural carbon emissions and economic growth using data of Hotan prefecture and 30 Chinese provinces, respectively.
All the above studies have made a great contribution to the expansion of the research breadth and depth of carbon emissions. In fact, the main agricultural carbon sources, like the generation of agricultural waste, the extensive use of agricultural supplies and energy, the widespread planting of rice and the burning of biological tissue, are directly related to the activities of agricultural land utilization [
25]. A number of studies have sought to explore the scale and distribution characteristics of the carbon emissions from ALU at different spatial scales in China. Li et al. [
26] examined the carbon effects of ALU across China during 2000 to 2008 with correlation analysis. Wu and Wang [
27] took the **du county, Shandong Province, China, as the case example, and calculated the carbon emissions from ALU by selecting the main sources of emissions and establishing a measurement system for the sources during the period 1995–2013. Li [
28] calculated the carbon emissions from ALU of China’s provinces between 1993 and 2010, and found that the average annual growth rates of carbon emissions from ALU in Inner Mongolia, Guangxi, Guizhou, Yunnan, Tibet, Qinghai, Ningxia and **njiang were 8.59%, 4.09%, 3.04%, 5.48%, 8.20%, 2.06%, 6.63% and 6.95%, respectively.
Due to the equality of natural resources, social and economic development in China [
29], the regional discrepancies in China’s carbon emissions from ALU has been widely recognized by scholars, and some scholars have discussed the influencing factors that result in the discrepancies of carbon emissions from ALU in China [
26,
30]. However, to our knowledge, few studies exploring the evolutionary characteristics of the discrepancies of the carbon emissions from ALU. To bridge this gap, this study aims to investigate the dynamic evolution of regional discrepancies in carbon emissions from ALU at the national level and the three regional systems of China during the period 2000–2015. The results of this study will provide reference for the low-carbon utilization of agricultural land and the construction of ecological civilization. Methods applied in this study include the calculation model of carbon emissions from ALU and kernel density estimation. The rest of this study is organized as follows.
Section 2 offers the methods adopted in this study and the data information.
Section 3 describes the empirical results.
Section 4 concludes this study and provides some policy recommendations.
4. Conclusions and Policy Recommendations
4.1. Conclusions
Based on the data of 31 provinces in mainland China and the method of kernel density estimation, this study analyzed the spatial-temporal discrepancies of carbon emissions from ALU and its evolutionary characteristics from 2000 to 2015. The main conclusions are as follows.
(1) The carbon emissions from ALU in the whole China and the eastern, central and western regions of China have increased sharply during the study period. From 2000 to 2015, the carbon emissions from ALU in China increased by 2626.11 (104 tons), with an annual increase of 175.07 (104 tons) and an average annual growth rate of 2.75%. The total increase in the eastern, central, and western region were 441.32 (104 tons), 1054.45 (104 tons), and 1130.33 (104 tons), respectively, the average annual growth rates of which were 1.29%, 3%, and 4.35%, respectively. Carbon emissions from ALU of each province all demonstrated significant increasing trend, with the exception of Bei**g and Shanghai. Shandong produced the largest carbon emissions from ALU, followed by Henan and Jiangsu, whose average carbon emissions were, respectively, 671.11 (104 tons), 661.26 (104 tons), and 403.40 (104 tons).
(2) The scale of carbon emissions from ALU showed significant spatial disparities at the regional and inter-provincial levels. Due to the differences of the abundances of agricultural land resources, the level of the economic development and the agricultural technology, etc., the regional discrepancy of China’s carbon emissions from ALU was obvious [
43]. The central region, which is a concentrated distribution area of major agricultural provinces and major grain producing areas in China, has the highest carbon emissions from ALU throughout the study period. The average carbon emissions from ALU in the central, eastern and western regions were 308.20 (10
4 tons), 216.99 (10
4 tons) and 147.71 (10
4 tons), respectively. The emissions of the provinces in central region were much higher than other provinces.
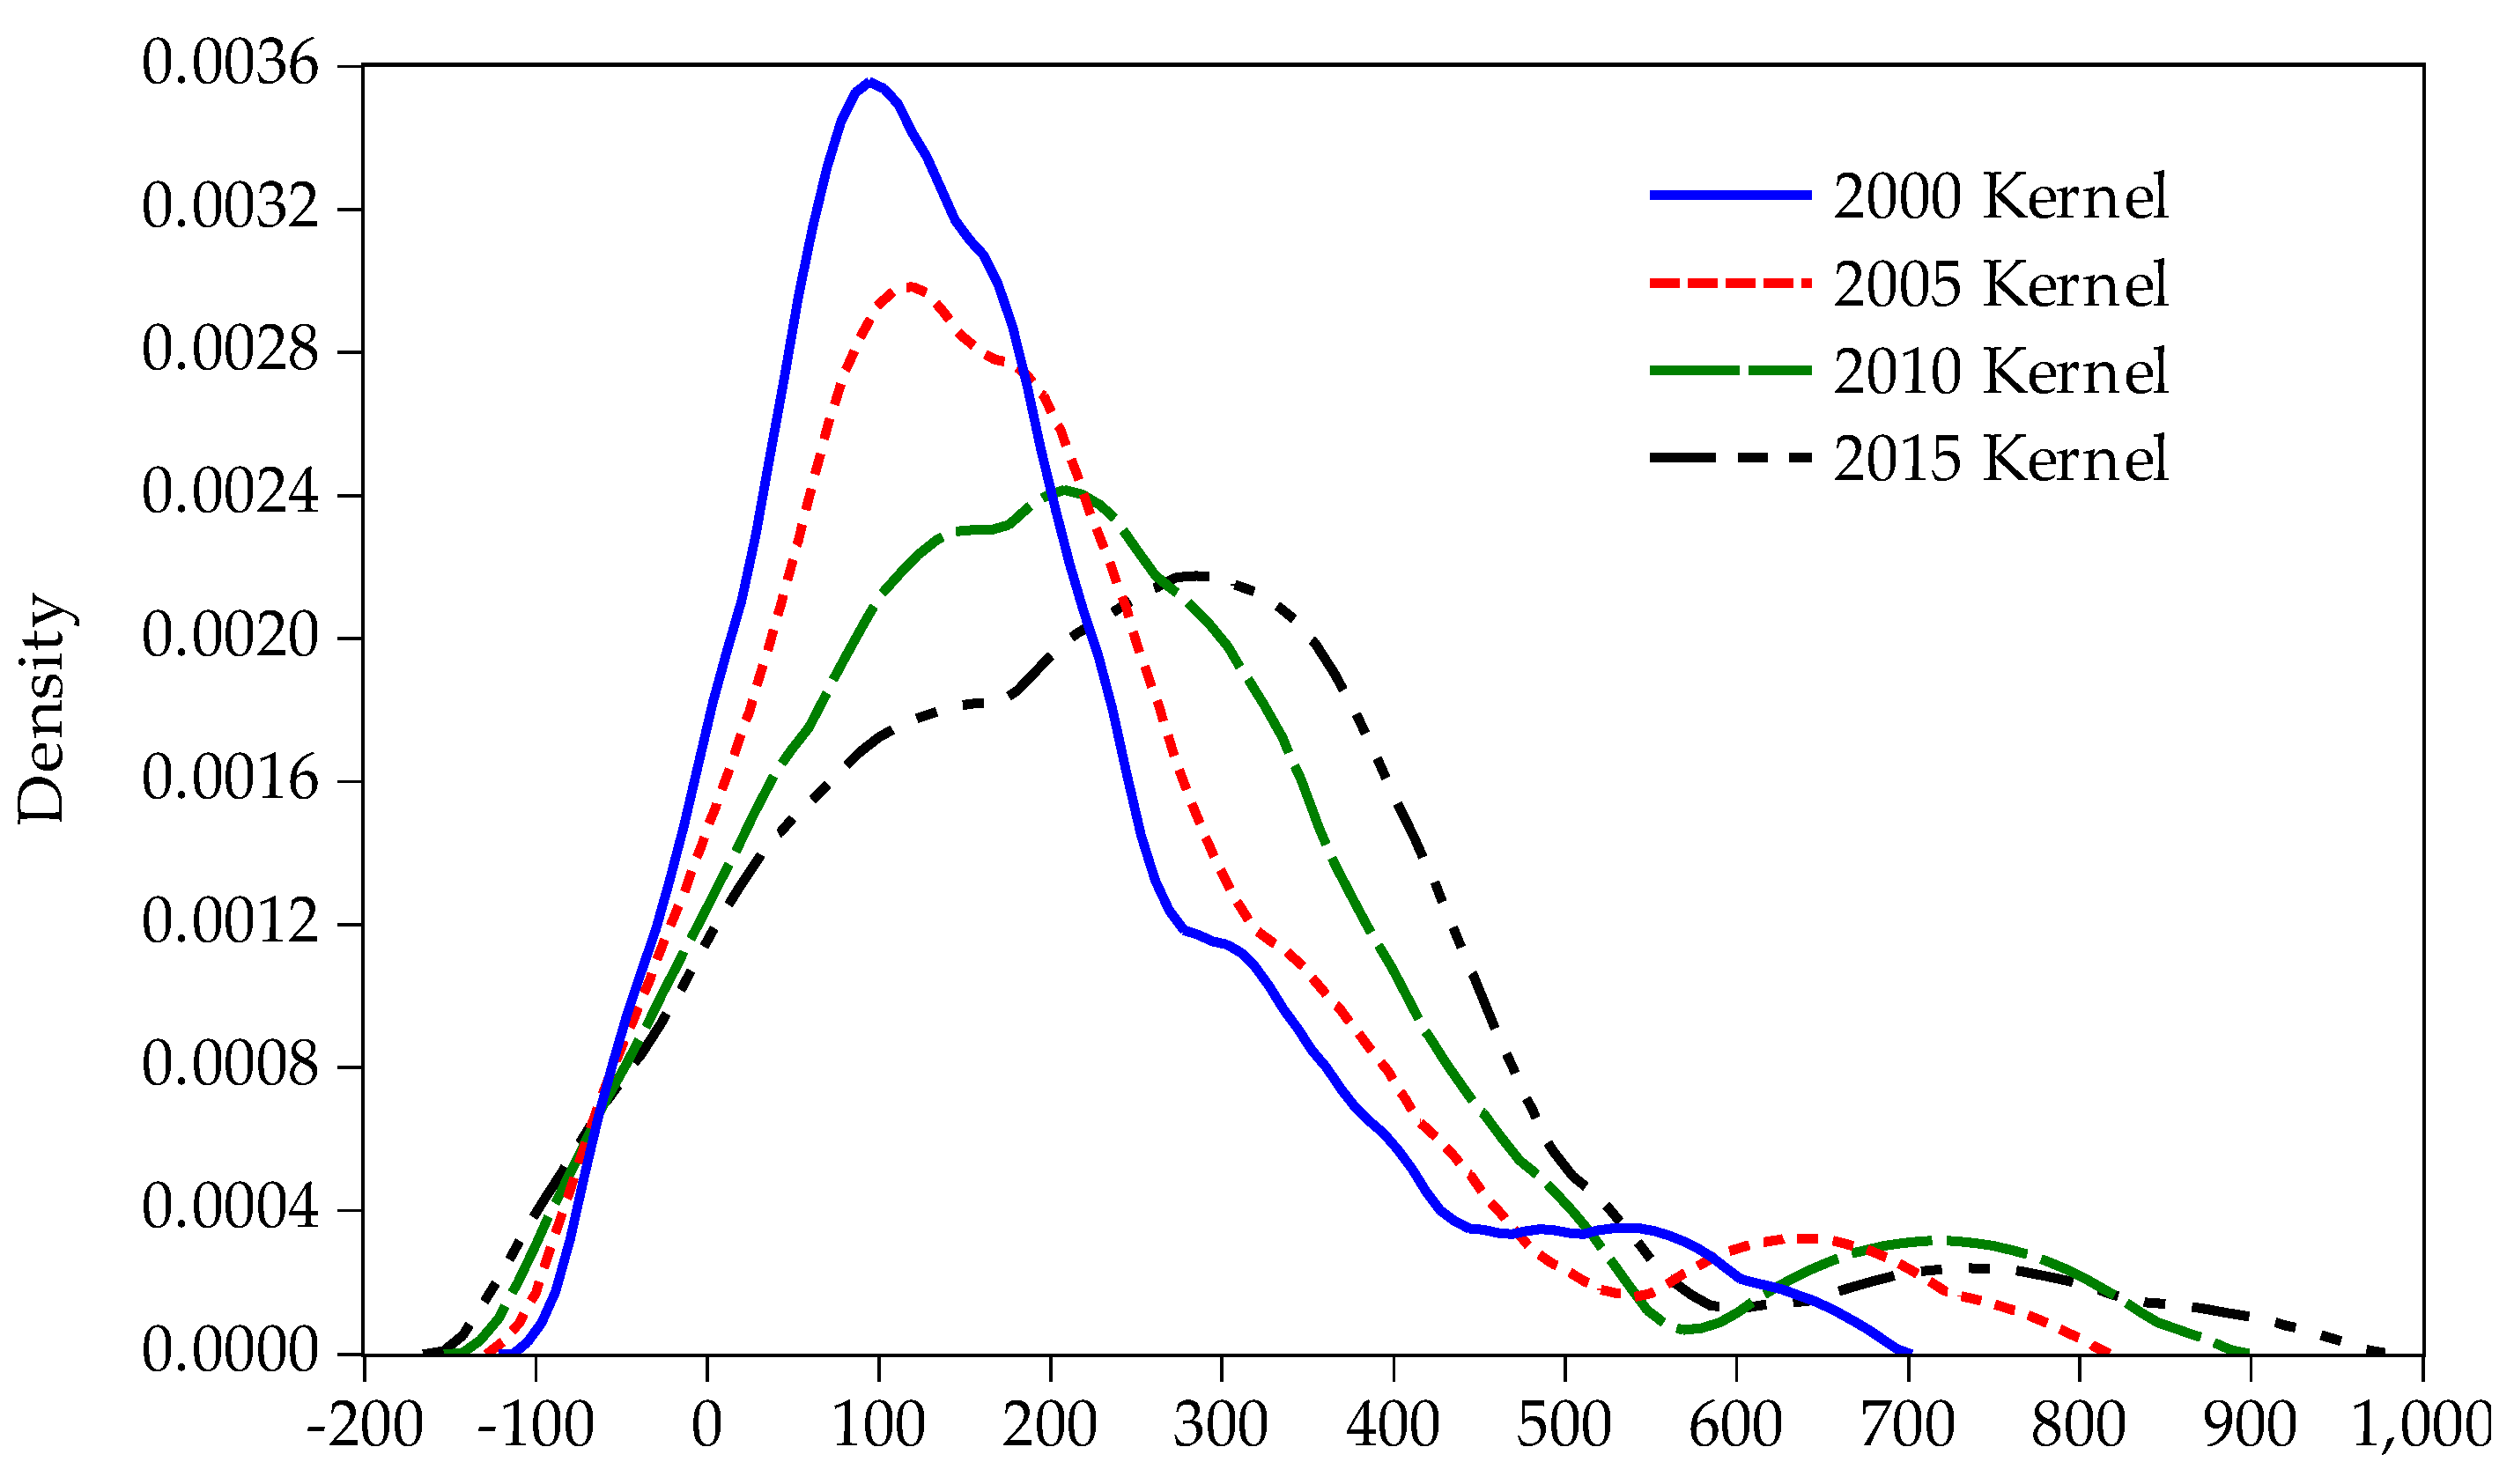
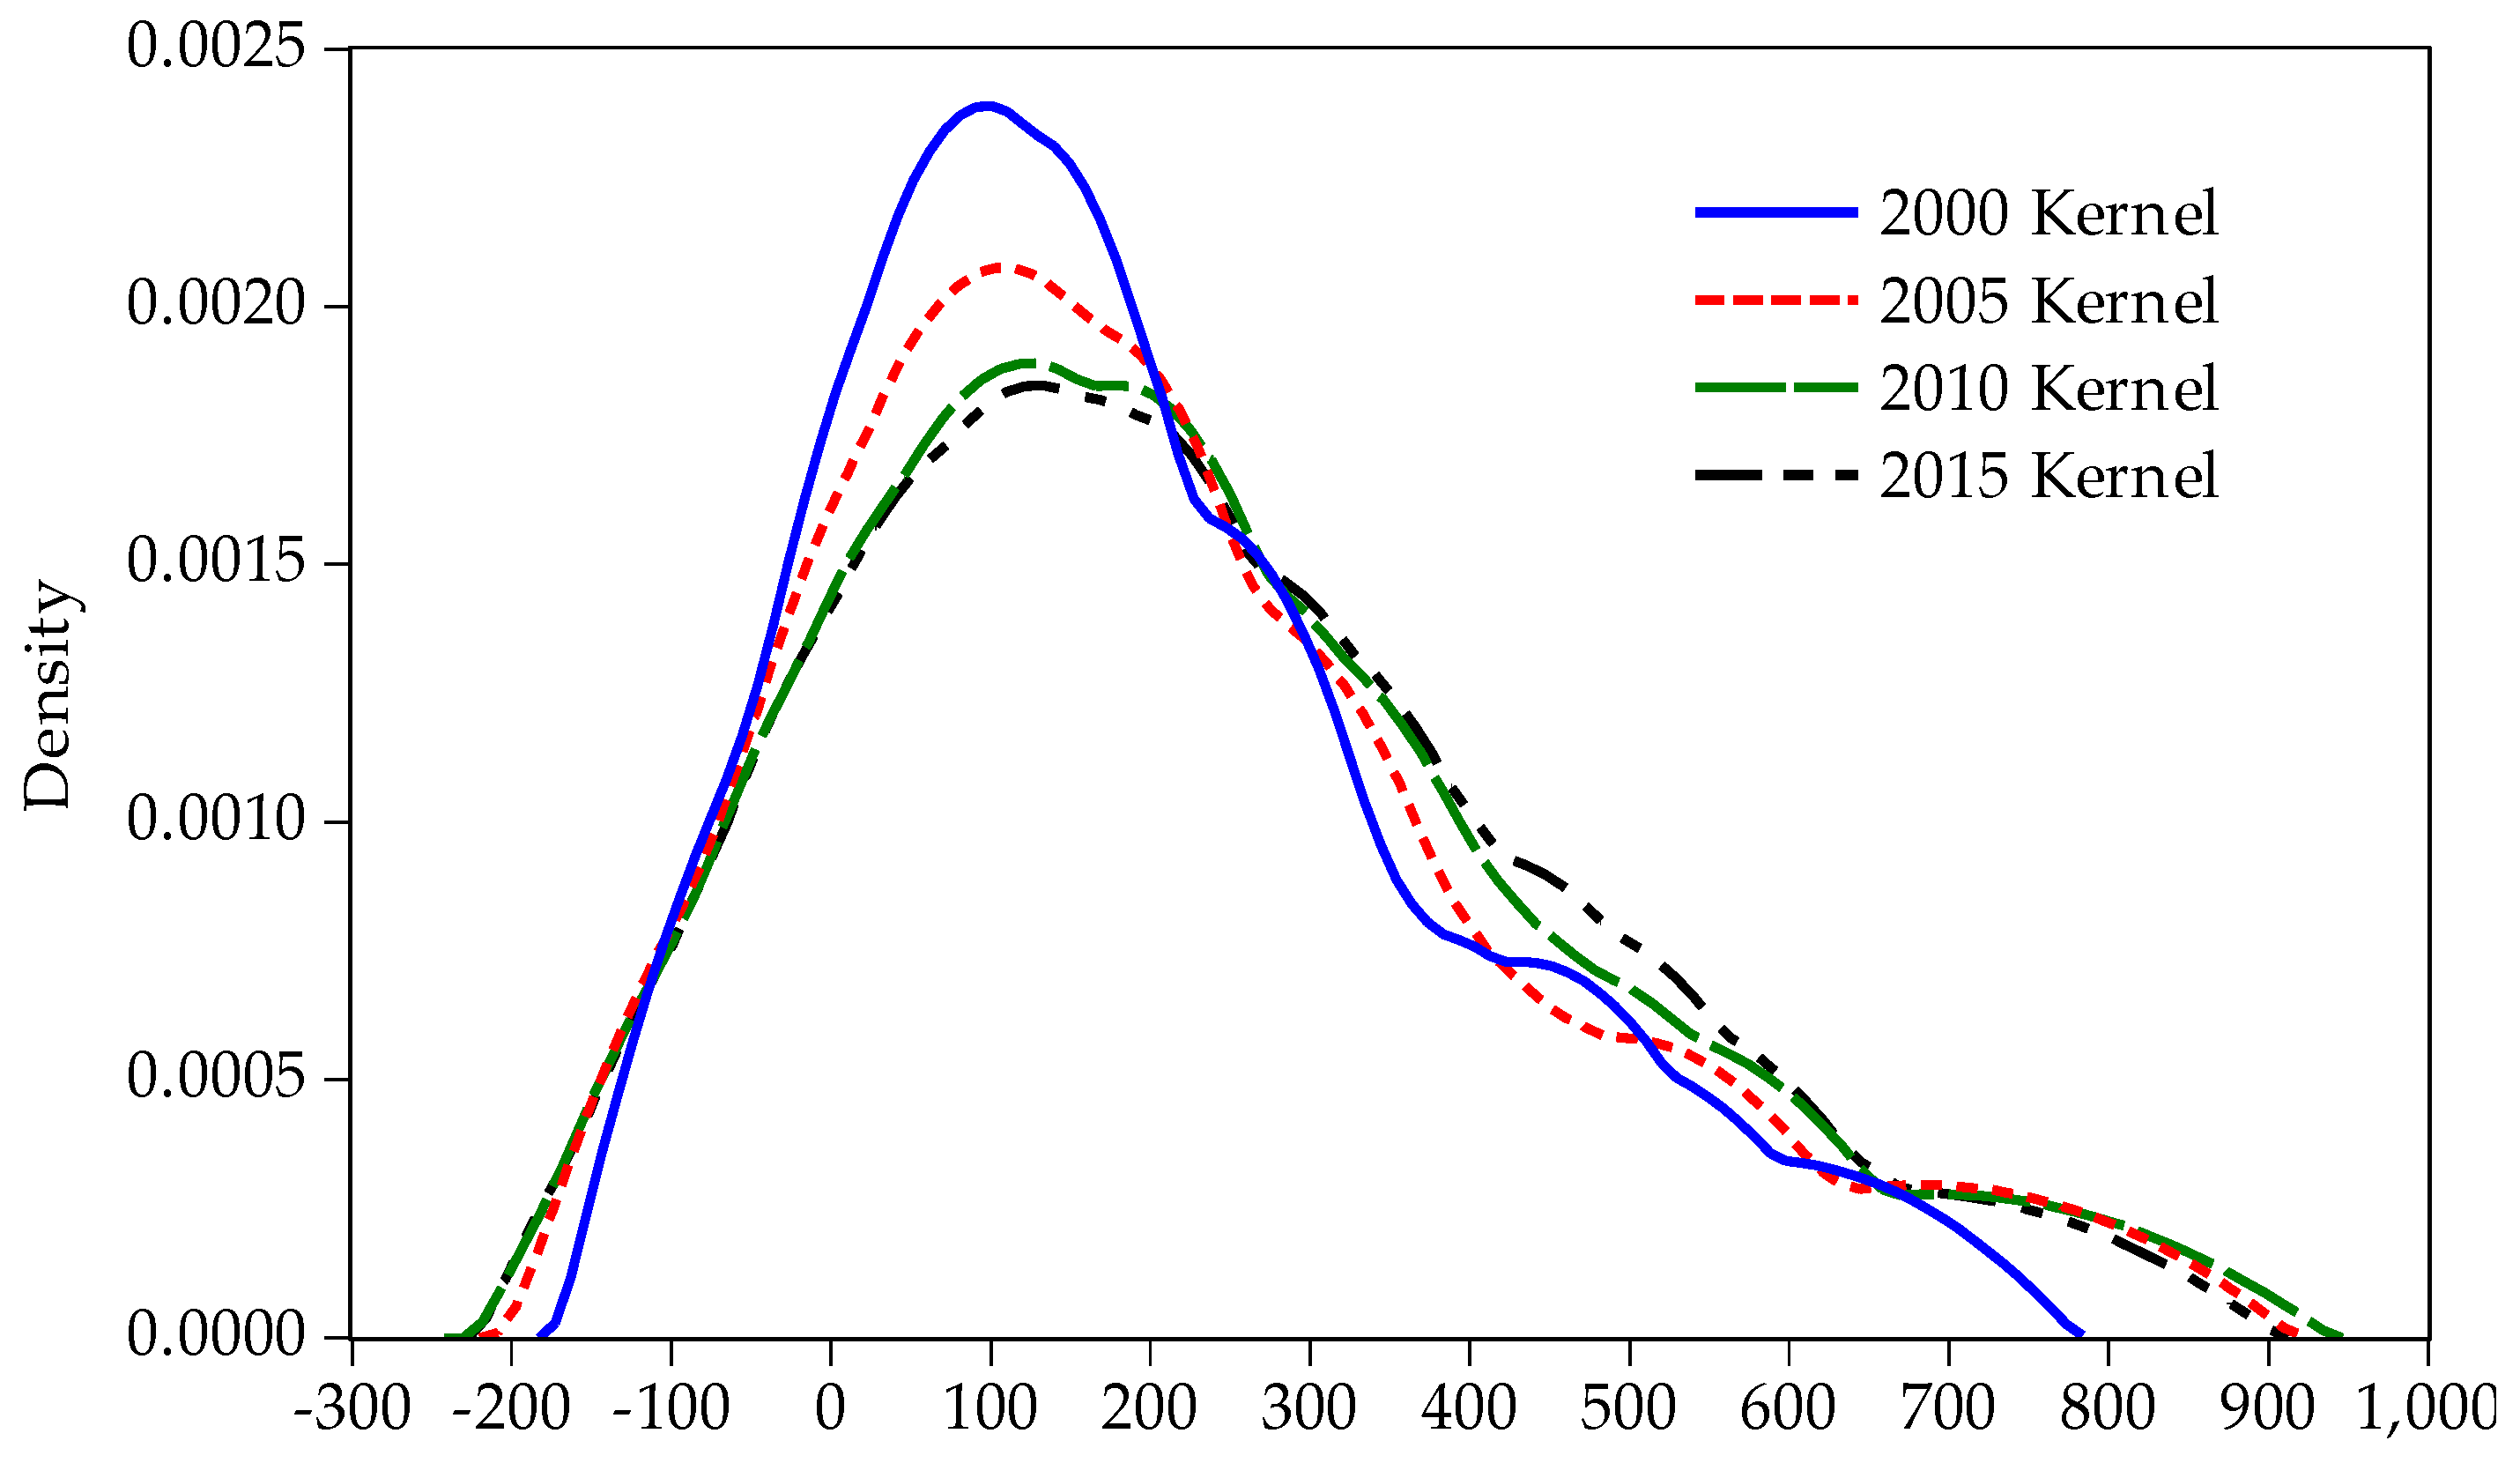
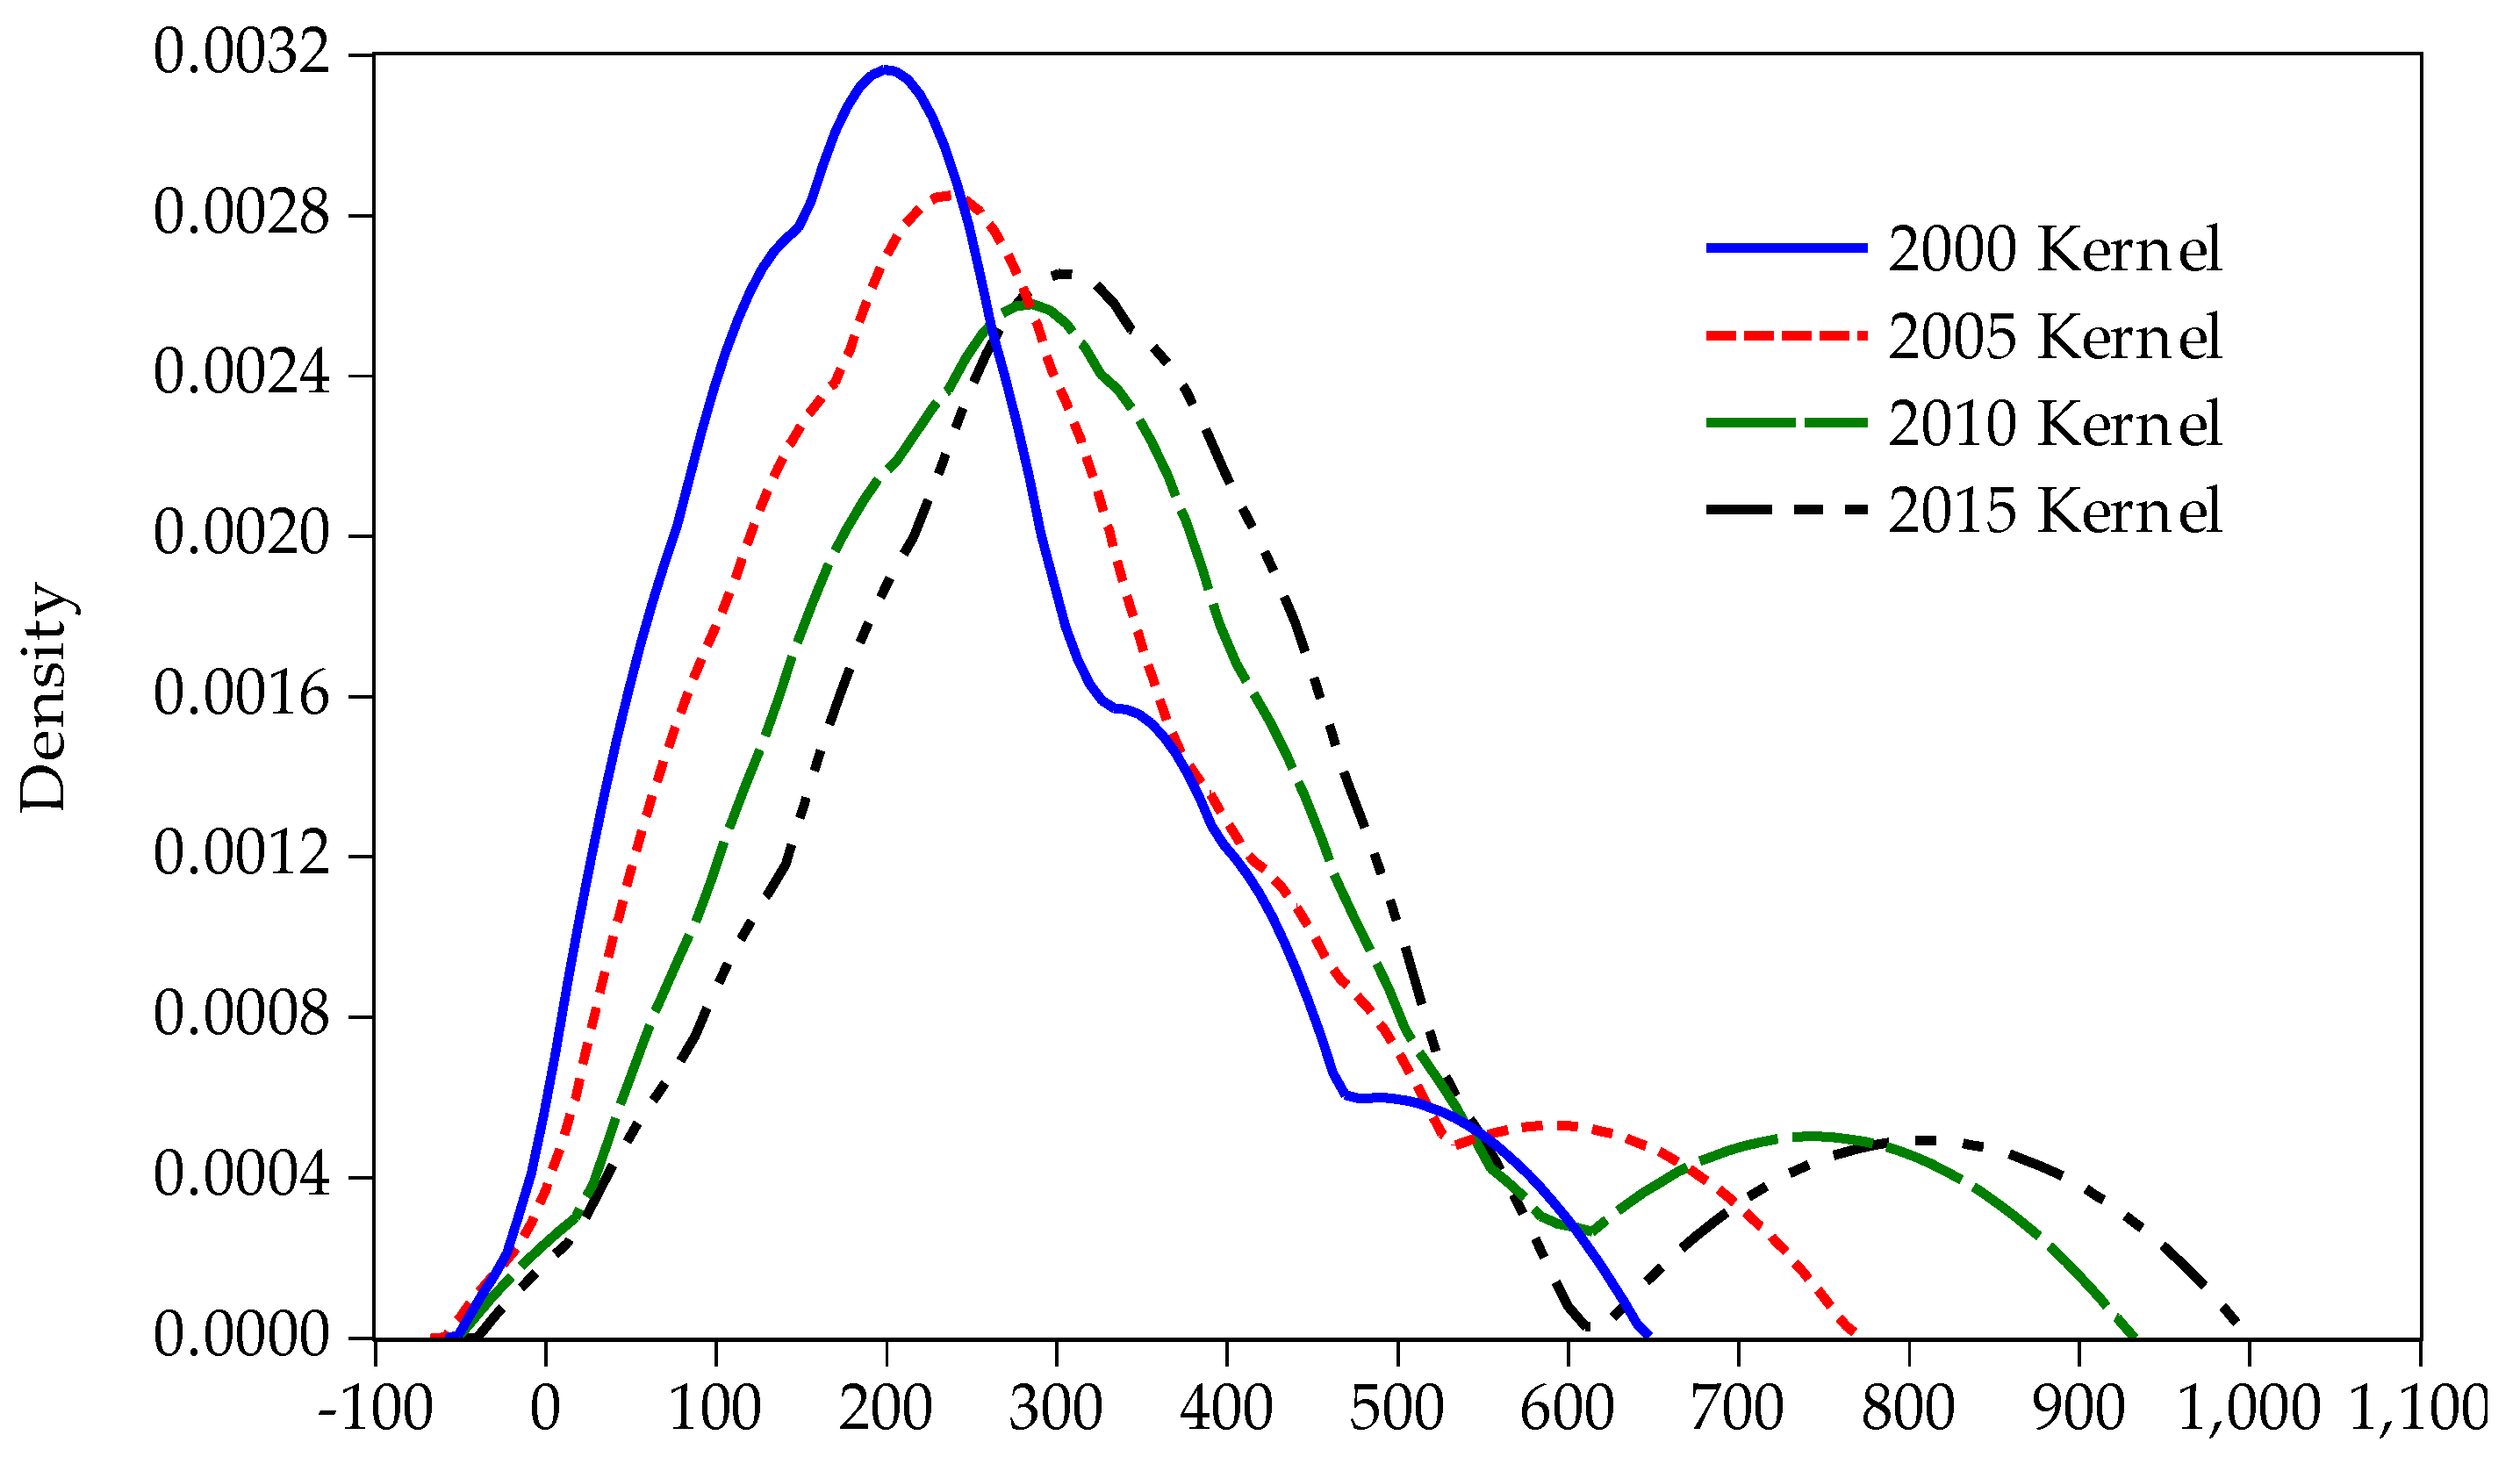
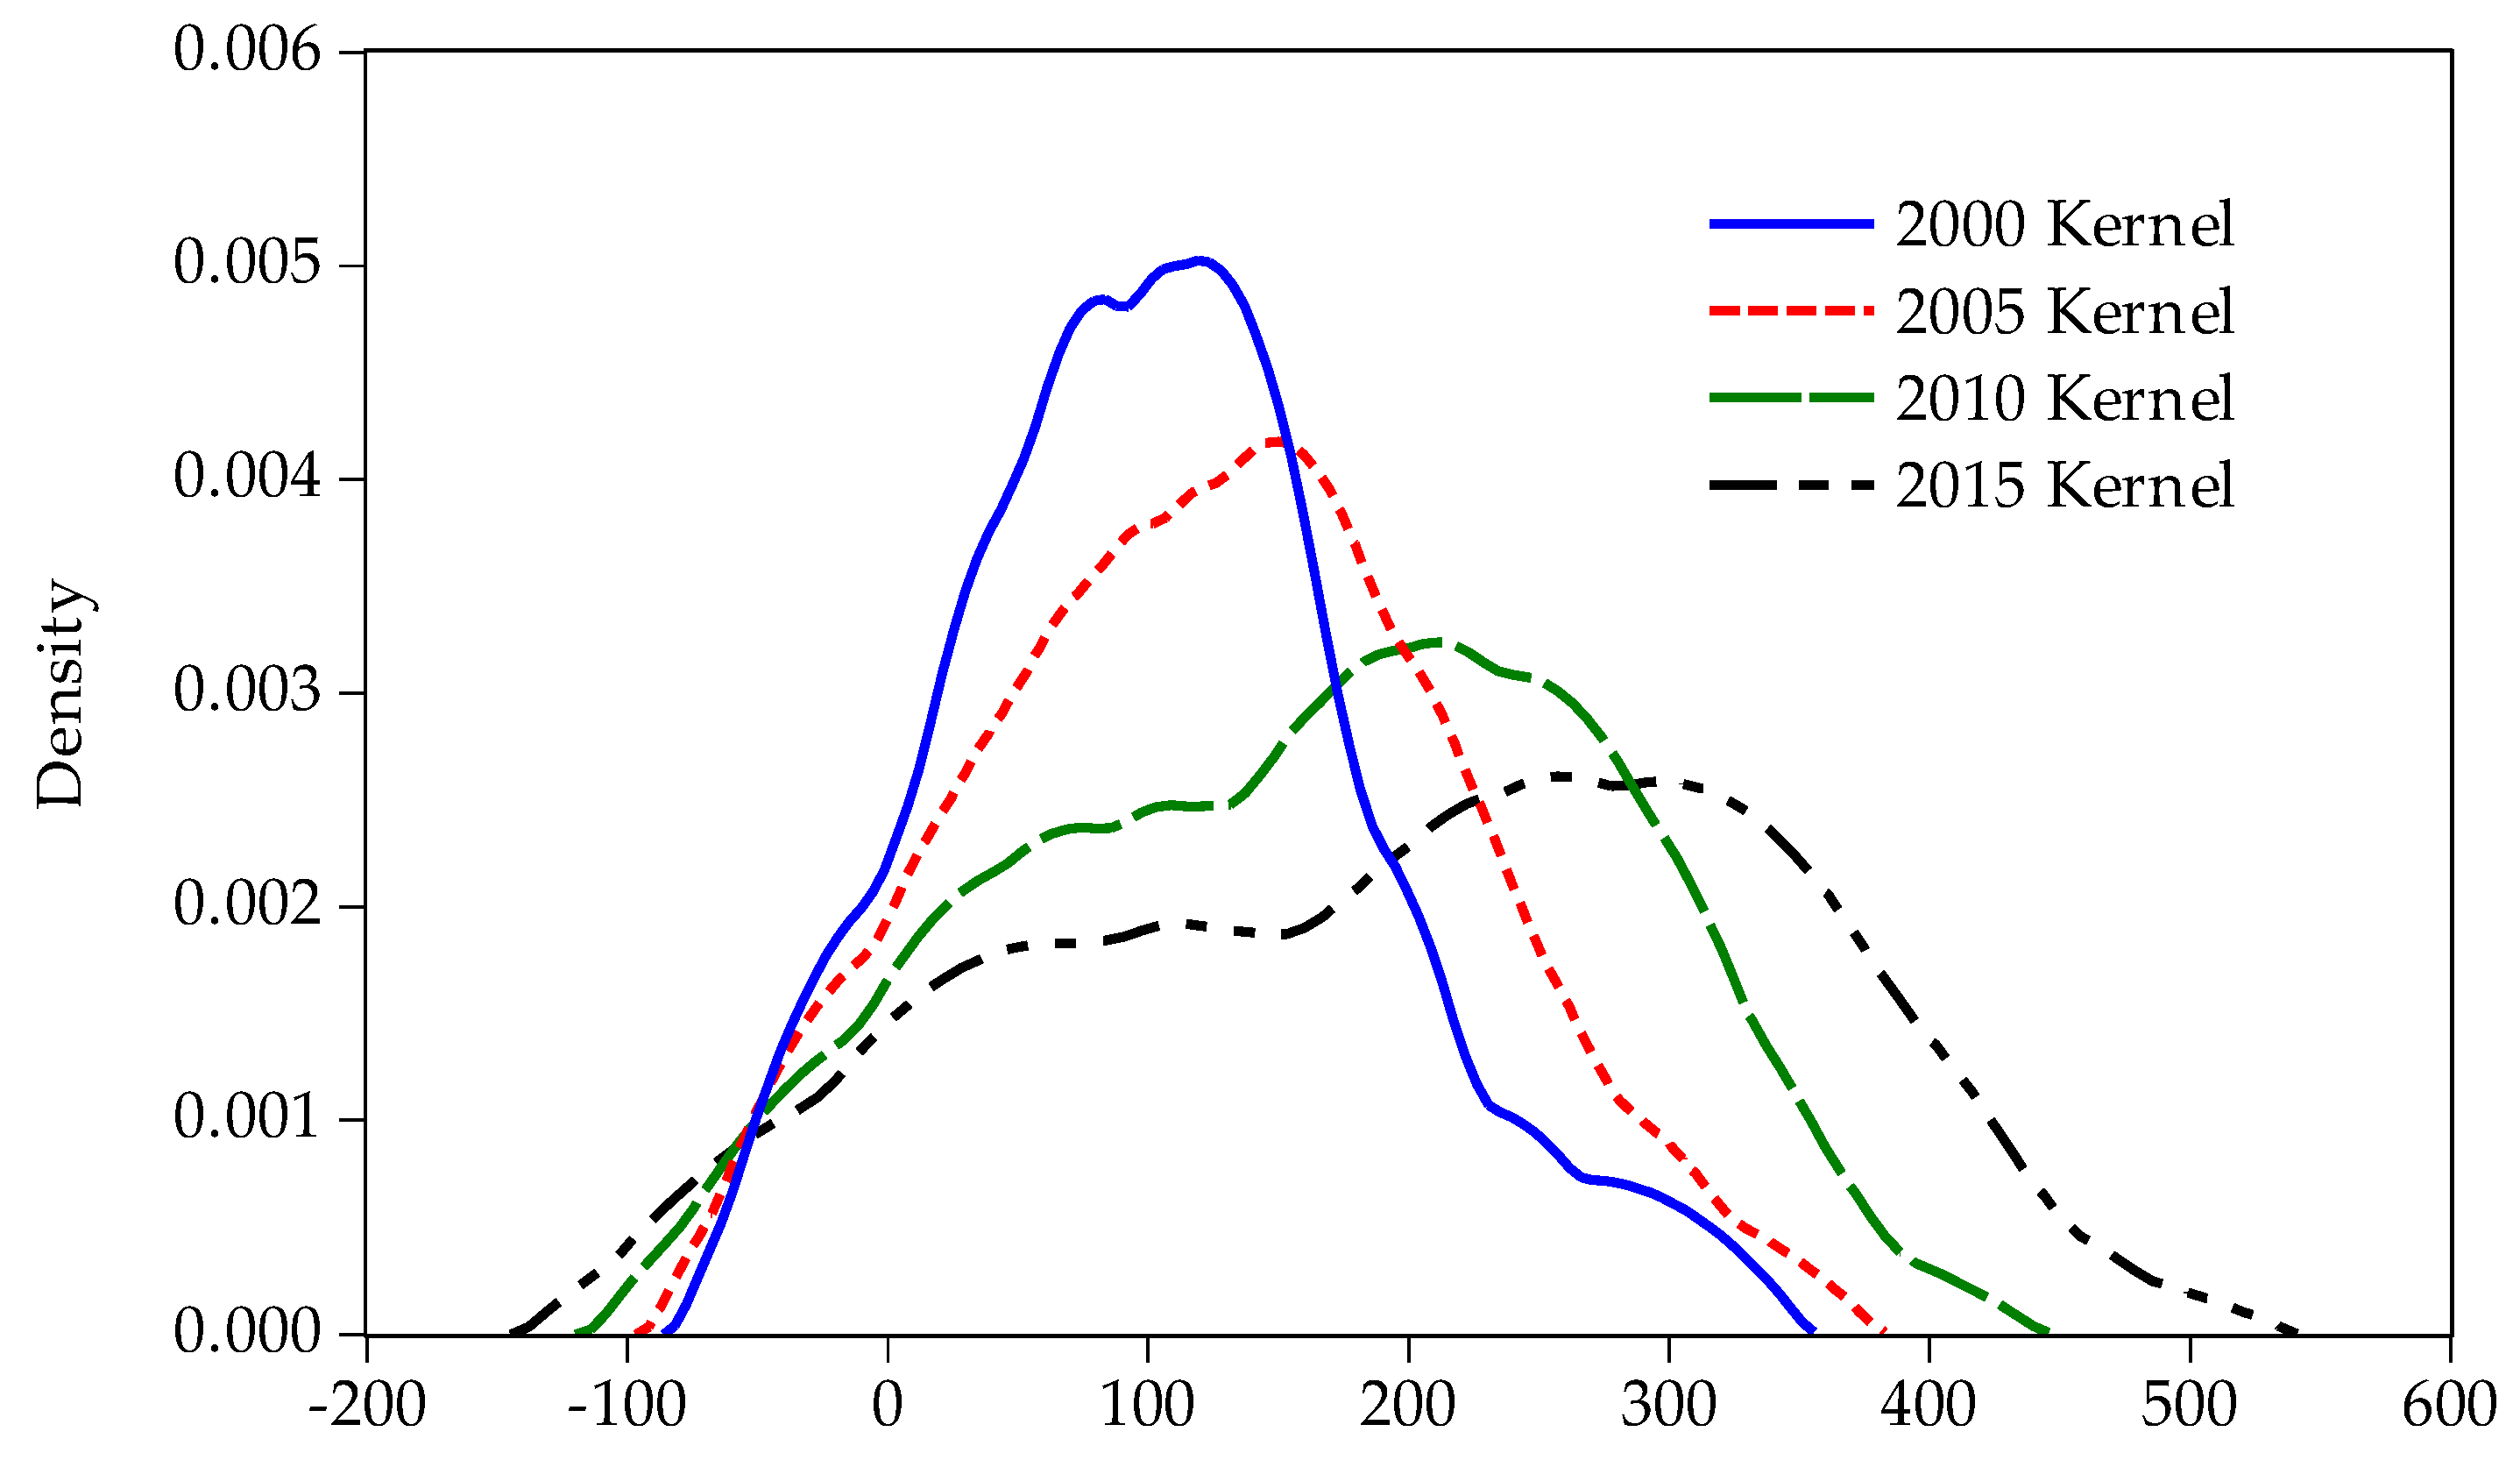
(3) The regional discrepancies of carbon emissions from ALU were expanding and showed various degrees of polarization at different spatial scales. From the results of the kernel density estimation, the distribution curves of carbon emissions from ALU in the whole country and each region all moved in the right direction gradually during the study period, and the width of the curves increased. All these characteristics meant that the regional discrepancies of carbon emissions from ALU were expanding at different spatial scales. Density estimation has a strong internal mobility in the distribution of China’s carbon emissions from ALU, with a “tri-polar” differentiation trend. Three regions have different trends. The eastern region has gradually switched from “multi-polar” into “tri-polar” distribution during the period 2000–2015. The central region presented a “multi-polar” division in 2000, while a “bipolar” differentiation phenomenon appeared in 2015. Distribution of carbon emissions from ALU in the western region showed a “multi-polar” differentiation phenomenon in 2000, 2010 and 2015, and a “unipolar” division phenomenon in 2005.
4.2. Policy Recommendations
As the world’s major agricultural countries, China and the United States have similar GHG emissions currently. However, the carbon emissions from agricultural practices in the United States account for only 6.3% of their total carbon emissions [
25], which is much lower than that of China’s 17%. How to achieve the orderly development of grain production and agricultural economy while realizing a low-carbon and green utilization of agricultural land resources has become a key issue for the Chinese government in the future [
46]. In particular, the Chinese government should innovate ways and modes of ALU based on the current situation and the advantages of agricultural development of different regions so as to reduce the carbon emissions from ALU and improve the low-carbon efficiency of agricultural land utilization.
(1) The eastern region has the advantages of geographic location, economic development and agricultural technology innovation, which contribute to lower resource consumption and carbon emissions in the process of ALU [
15,
17]. For the provinces in this region, the key measure to reduce carbon emissions from ALU is to develop modern agriculture and ecological agriculture based on its various advantages. Another important way is to reduce the proportion of traditional agriculture and improve the versatility of agricultural production.
(2) The central region is a major agricultural production base in China and enjoys superior agricultural production conditions, which has made a great contribution to China’s food security and urbanization. However, the agricultural development in this region is largely dependent on the high-intensity development and utilization of agricultural land, especially the over investment in chemical fertilizers, pesticides, and other factors [
28], thus resulting in the highest carbon emissions from 2000 to 2015. Therefore, improving the efficiency of agricultural production will be an effective means of carbon emission reduction for the provinces in this region. It is important to abandon this unsustainable agricultural land utilization model and follow the development path of “resource-saving” and “environment-friendly”.
(3) The agricultural production resources in the western region of China are relatively scarce, and the carbon emissions from ALU in the western region are much lower than that in the eastern and central regions. However, the low-carbon utilization of agricultural land resources in the western region is confronted with the dual constraint of small scale agricultural land and low productivity in agricultural inputs [
14]. For the provinces in this region, it is necessary to speed up the process of agricultural land transfer and promote the transformation of agricultural production and management, which will ensure basic carbon emissions reduction from ALU.
Apart from the measures mentioned above, cultivating new-type professional farmers, constructing a low-carbon agricultural technology extension system and optimizing the structure of agricultural production are all effective ways to achieve the efficient and low-carbon utilization of agricultural land resources in China.


