3.1. Dataset of Multi-Scan Mode
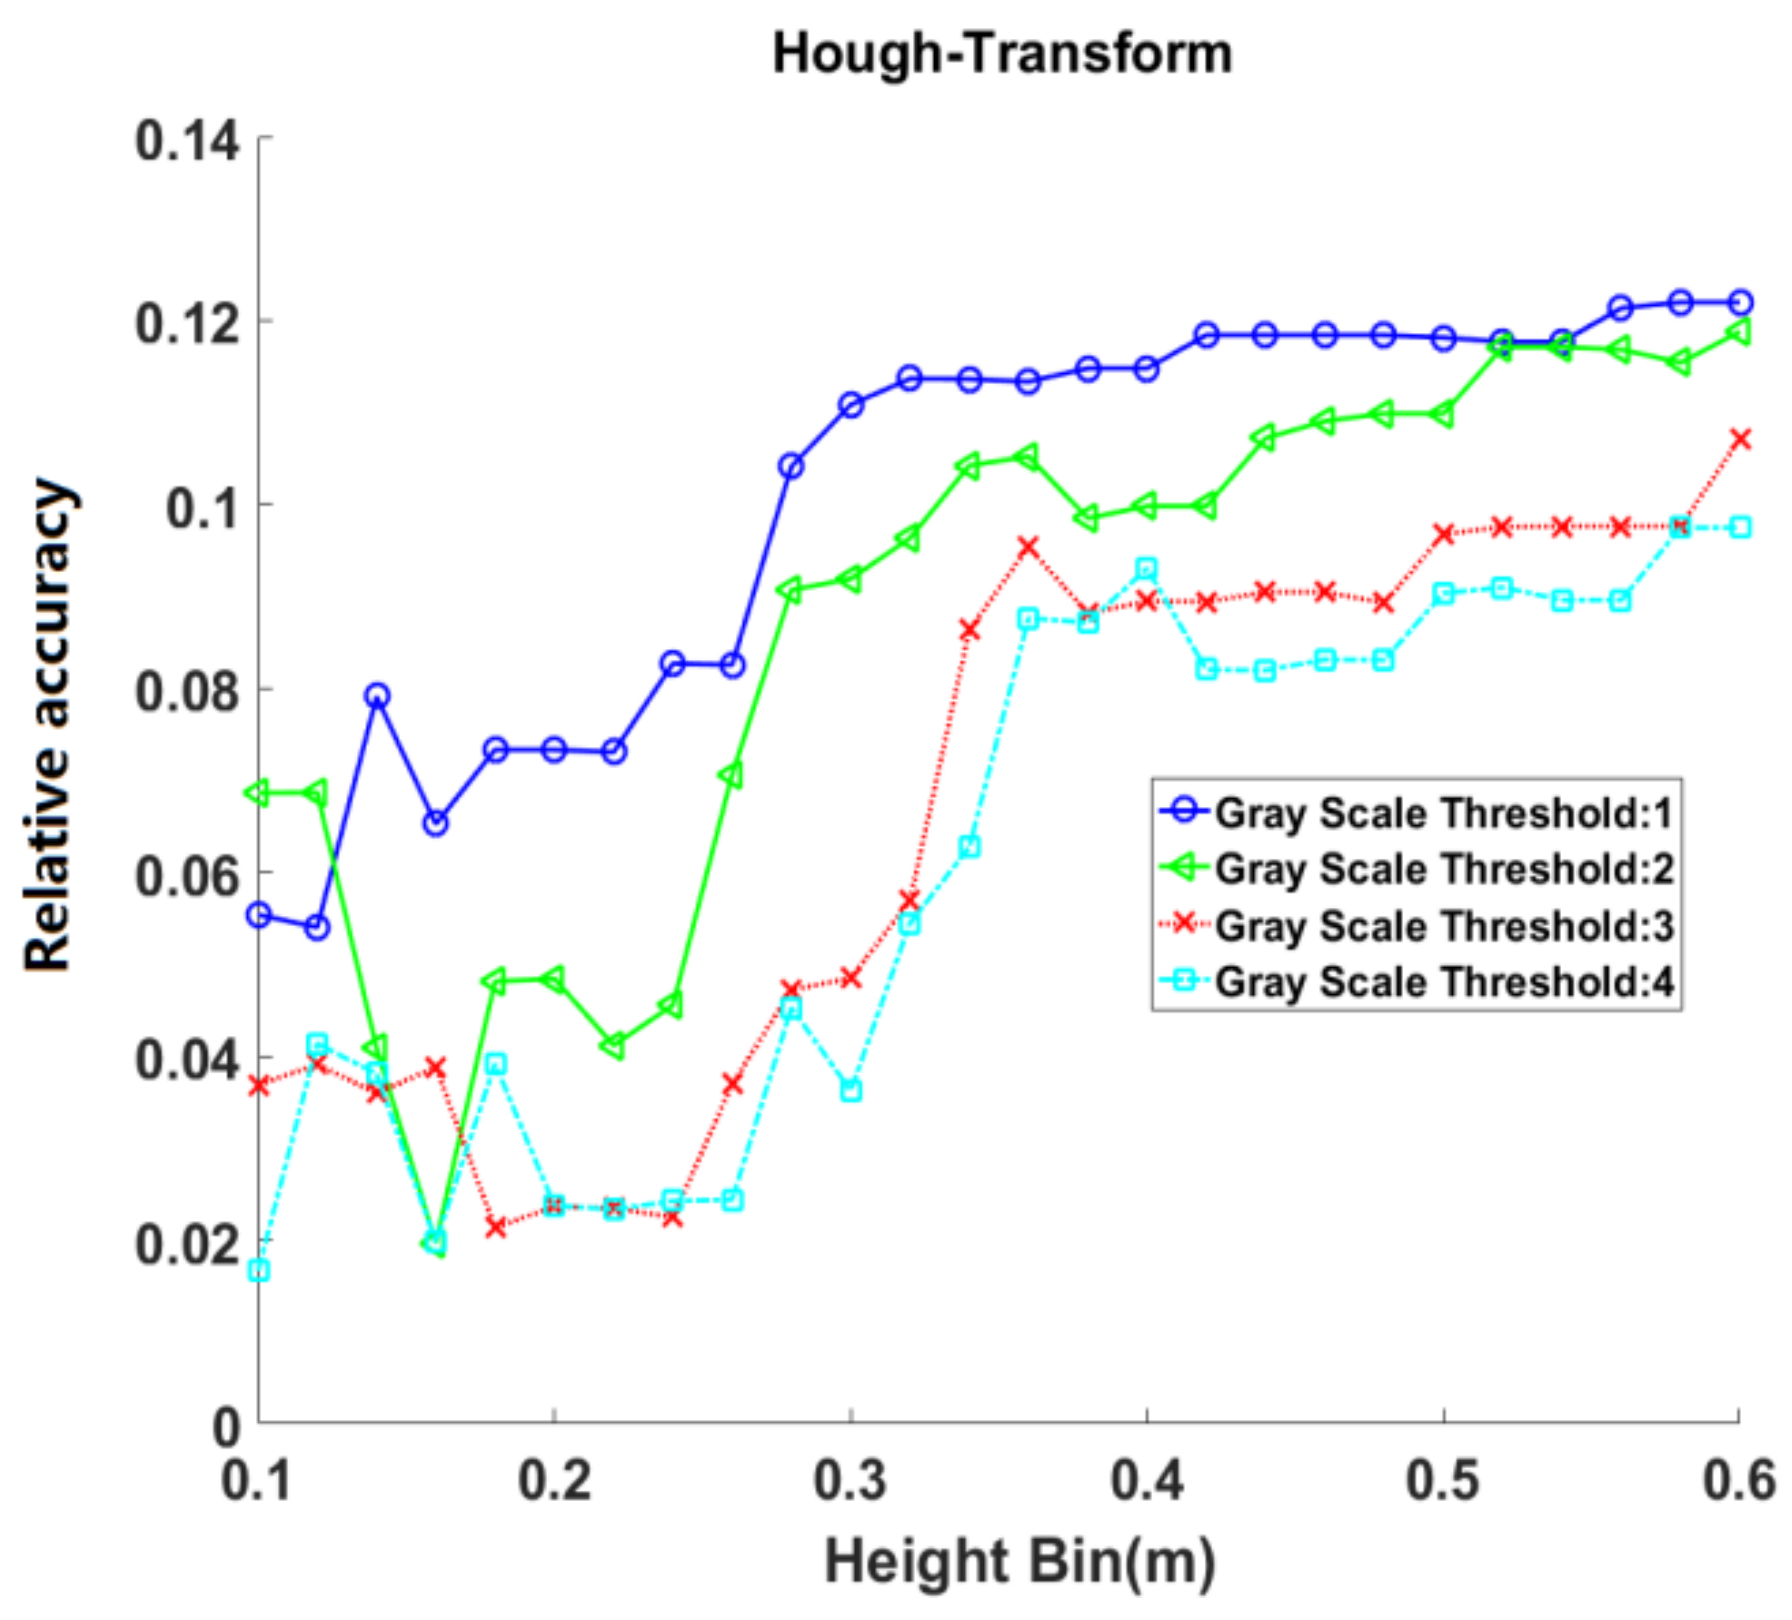
The performance of the Hough-Transform was worse than the other two algorithms in multi-scan mode of the natural secondary forest, producing a maximum relative accuracy lower than 0.14 (
Figure 8). Physically, plots were located in a natural forest with heavy understory and branches, which resulted in enormous numbers of outlier points and a relatively low SNR of the binary images. Hough-Transform was based on the accumulative matrix in the transform space, so many outlier points in the image would significantly influence the accuracy. Hough-Transform was not appropriate in the natural forest with heavy understory vegetation and branches in multi-scan mode.
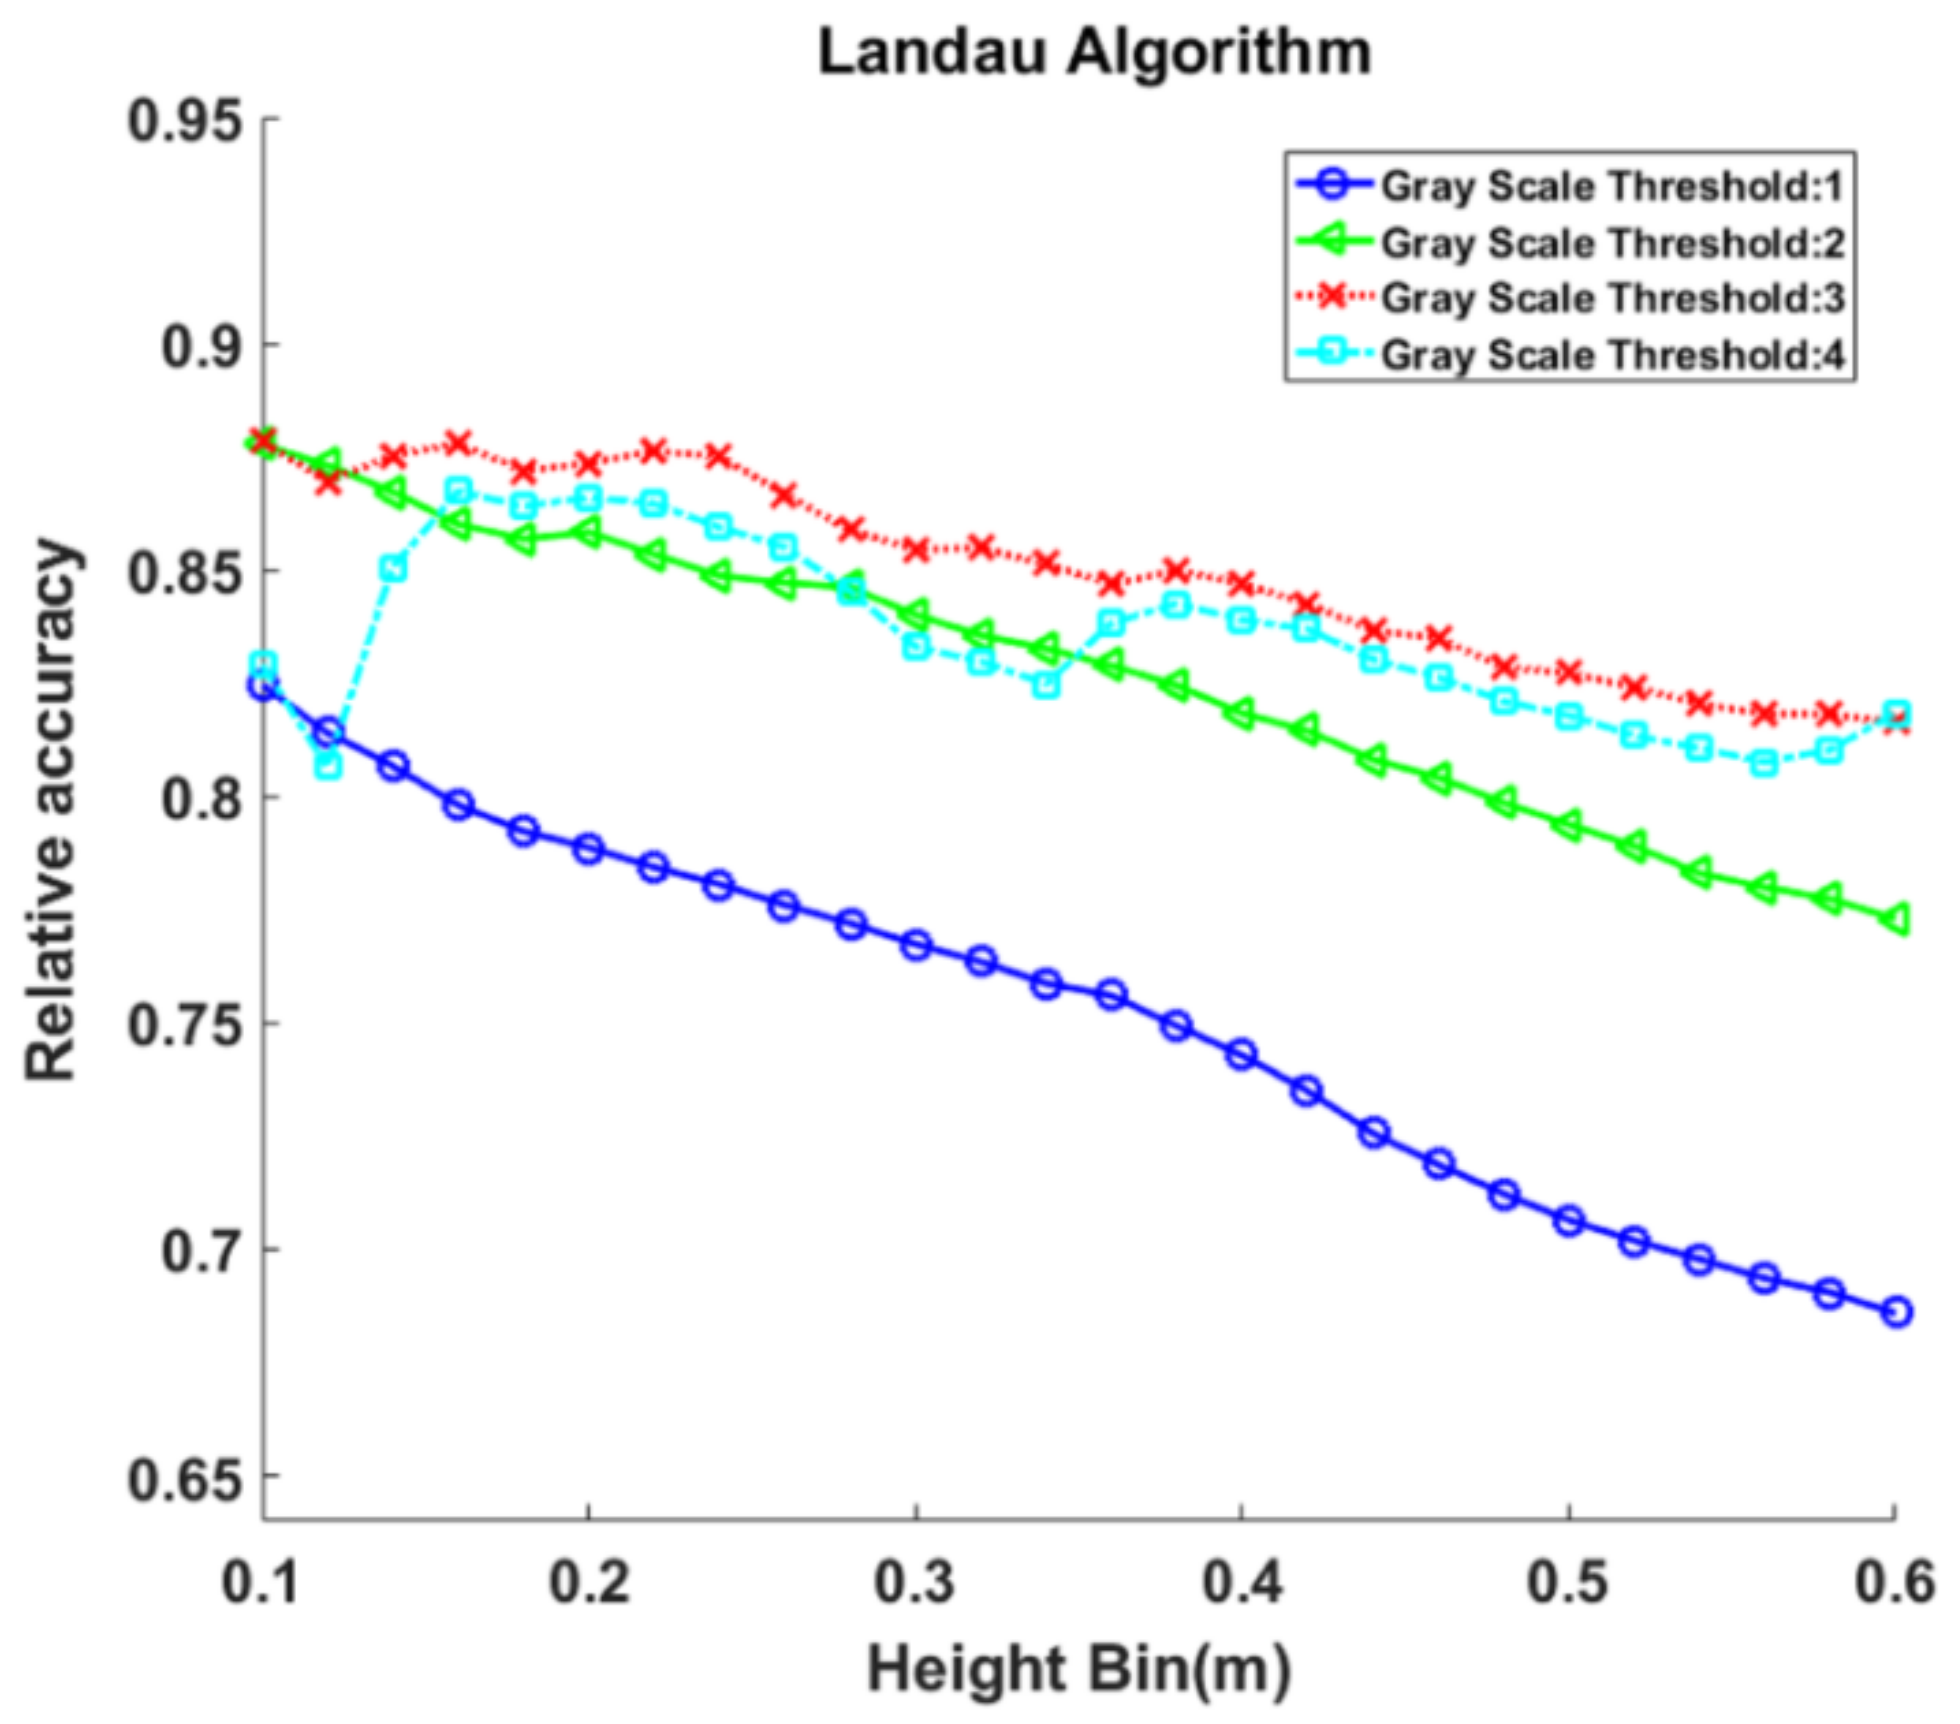
In multi-scan mode, the Landau algorithm achieved its highest accuracy with a height bin of 0.1 m and a gray scale threshold of three with a
R2 of 0.97, a RMSE of 1.77 cm and a relative RMSE of 12.2%. The overall accuracy of the Landau algorithm showed a declining trend as the height bin increased. Only at a gray scale threshold of four, accuracy showed an increasing trend up to the maximum accuracy point (with a height bin of 0.16 m, relative accuracy of 0.87) and then a declining trend (
Figure 9). Although only three scanning stations were conducted in the plots, there was high stem visibility in multi-scan mode. Therefore, a small height bin (0.1–0.24 m) was able to encompass enough stem circumference information. In this context, the projection binary images contained more outlier points as the height bin increased, and the effect of circle fitting inclined stem point clouds was also increased, causing a decrease in the accuracy of DBH retrieval.
For the gray scale threshold, estimation accuracy was greatest at the gray scale threshold of three in most height bins, with decreased accuracy at thresholds of two and four, and the least accuracy at one. Due to heavy understory vegetation and branches, it was difficult to remove outlier points with a small gray scale threshold. As the stem circumference information would be incomplete if a large threshold was used, a moderate threshold of three had the best performance (
Figure 9).
In multi-scan mode, the nonlinear least square algorithm was most accurate at the height bin of 0.24 m with a gray scale threshold of 3. The
R2 was 0.98, the RMSE was 1.69 cm, and the relative RMSE was 11.6%. The accuracy trend of the nonlinear least square algorithm along with the height bin and gray scale threshold was similar to that of the Landau algorithm. The algorithm had greater accuracy when the gray scale threshold ranged from 2–4, and the height bin was 0.1–0.24 m (
Figure 10). This height bin increased as the threshold increased. This implied that a larger height bin was needed to contain more stem information as the threshold increased.
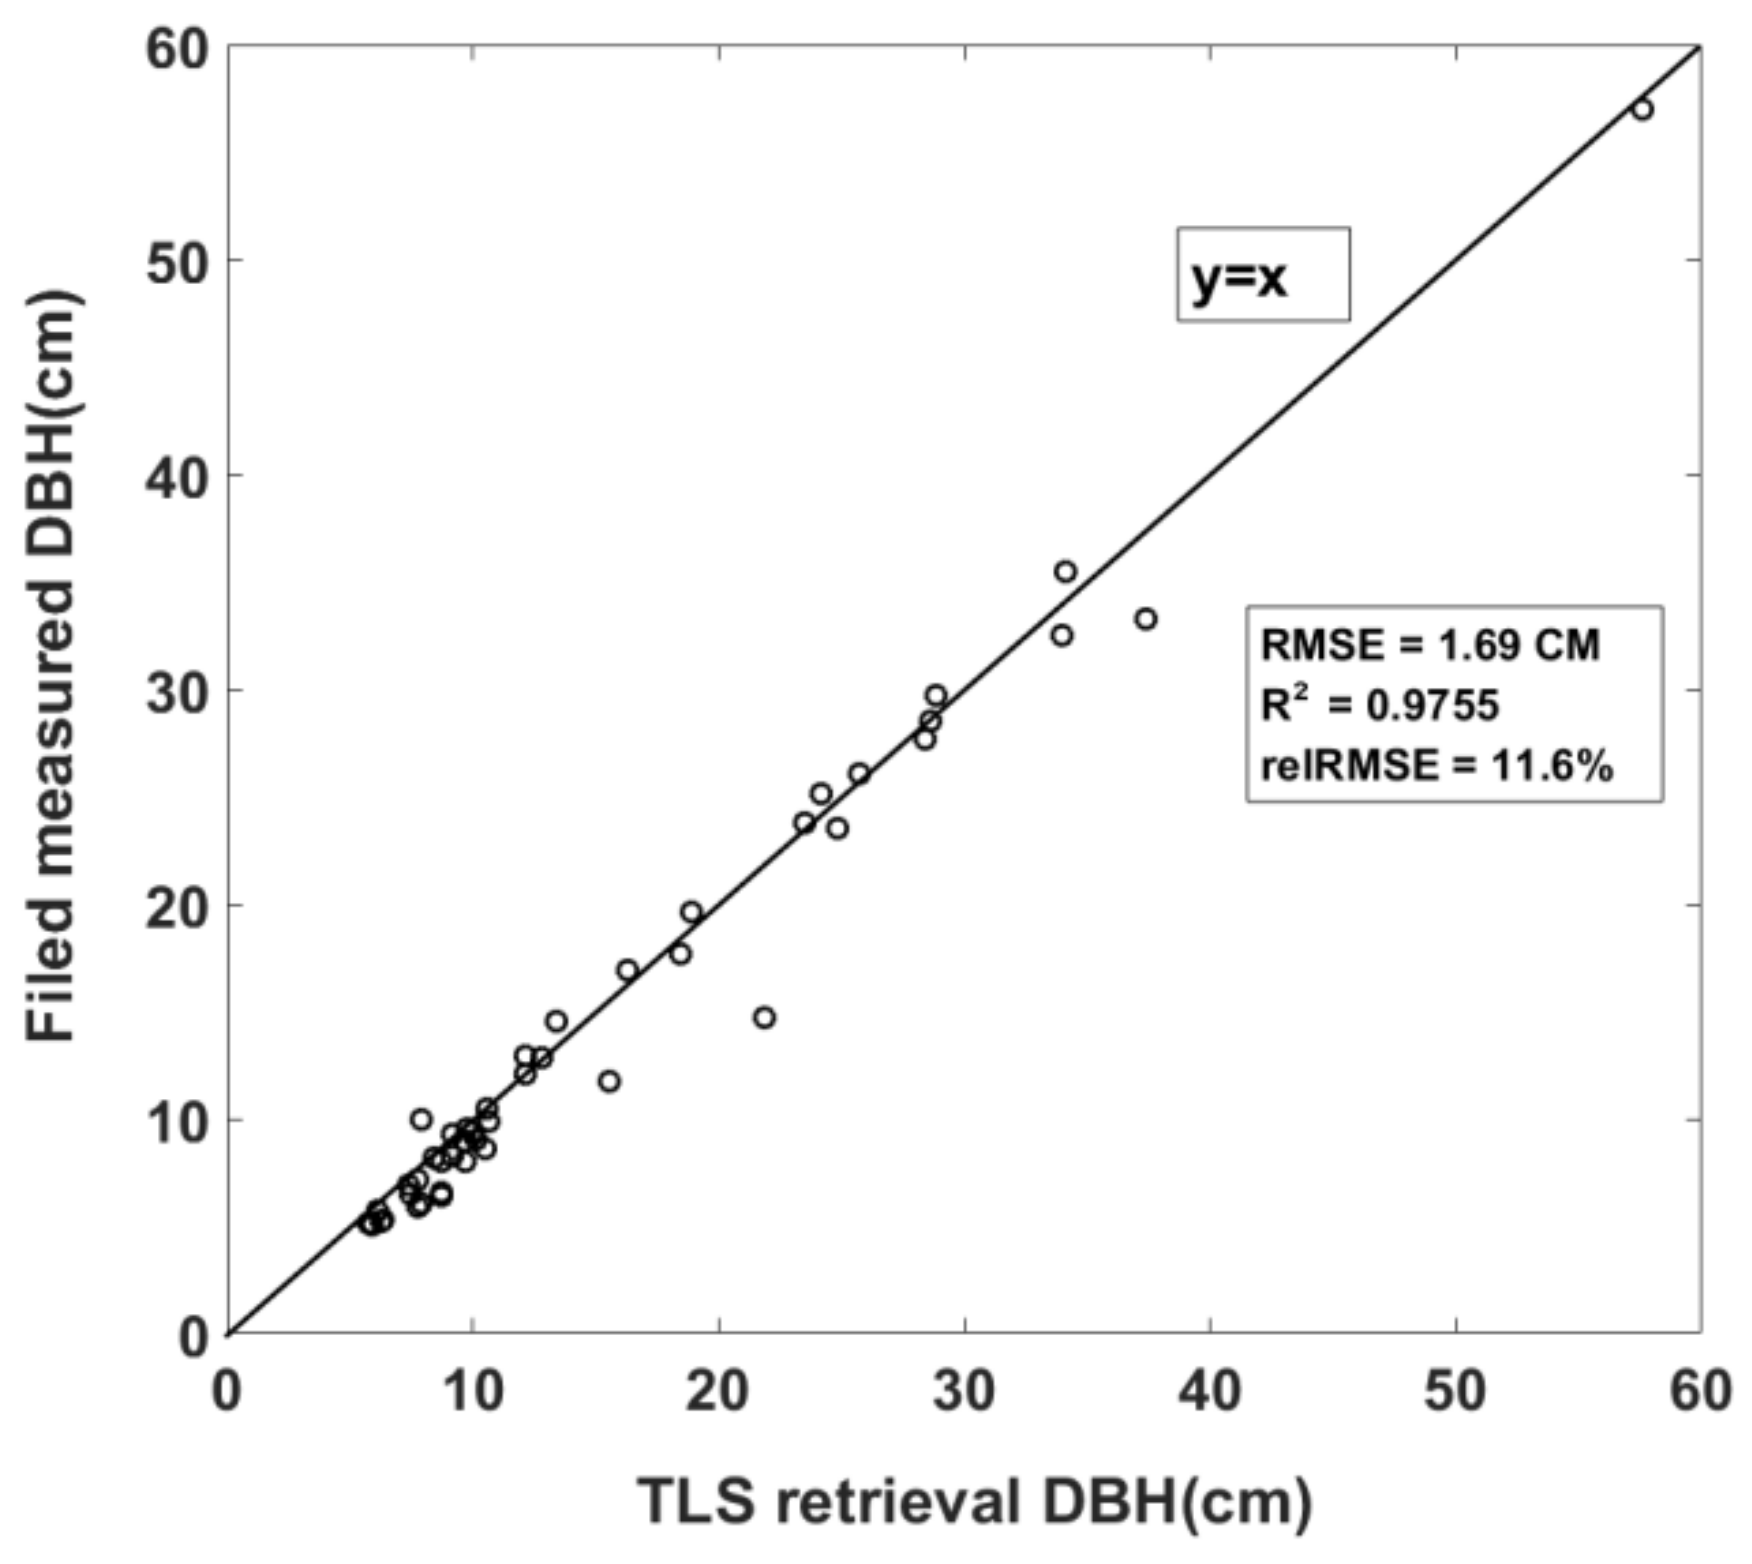
In multi-scan mode of the natural secondary forest, the nonlinear least square algorithm obtained the most accurate results of all the tested algorithms.
Figure 11 shows the scatter plot of TLS estimated DBH versus field measured DBH in the multi-scan mode of the natural secondary forest, which provided the most accuracy (nonlinear least square algorithm, a height bin of 0.24 m, and a gray scale threshold of 3).
The Landau and nonlinear least square algorithms were more accurate under the preprocessing condition of a small height bin (0.1–0.24 m) and a moderate gray scale threshold (both three). The stems could be scanned from multiple directions in the multi-scan mode, which meant the stems were complete in the point cloud data. A small height bin could contain complete stem circumference information. A moderate gray scale threshold is needed to overcome the outlier points caused by the presence of branches and shrubs. When compared with the potential issue resulting from limited visibility of stems in a natural forest, the presence of outlier points was the main cause of DBH estimation bias when using multi-scan mode in the natural secondary forest. Multi-scan methods improved the potential problem of low stem visibility, while the outlier points caused by the presence of branches and shrubs impacted DBH estimation from TLS data.
In most previous 2D-slice studies, DBH was estimated from a fixed small height bin of approximately 0.1 m [
19,
20,
26]. This study showed that a height bin range of 0.1–0.24 m and a moderate threshold of three were more appropriate for multi-scan mode of the natural secondary forest. Using these parameters, the projection binary images had a better SNR and were able to contain more stem circumference information with fewer outlier points. The Landau algorithm had the best overall performance than the other algorithms. Although the best accuracy of Landau algorithm was slightly worse (
R2 = 0.97 vs. 0.98 and RMSE 1.69 cm vs. 1.77 cm) than the nonlinear least square algorithm, the Landau algorithm was simpler and less depending on the preprocessing conditions (
Figure 9). In a natural forest, combining this algorithm and preprocessing condition could provide a high accuracy DBH estimation result that could be automatically obtained from a TLS point cloud using multi-scan mode.
3.2. Dataset of Single-Scan Mode
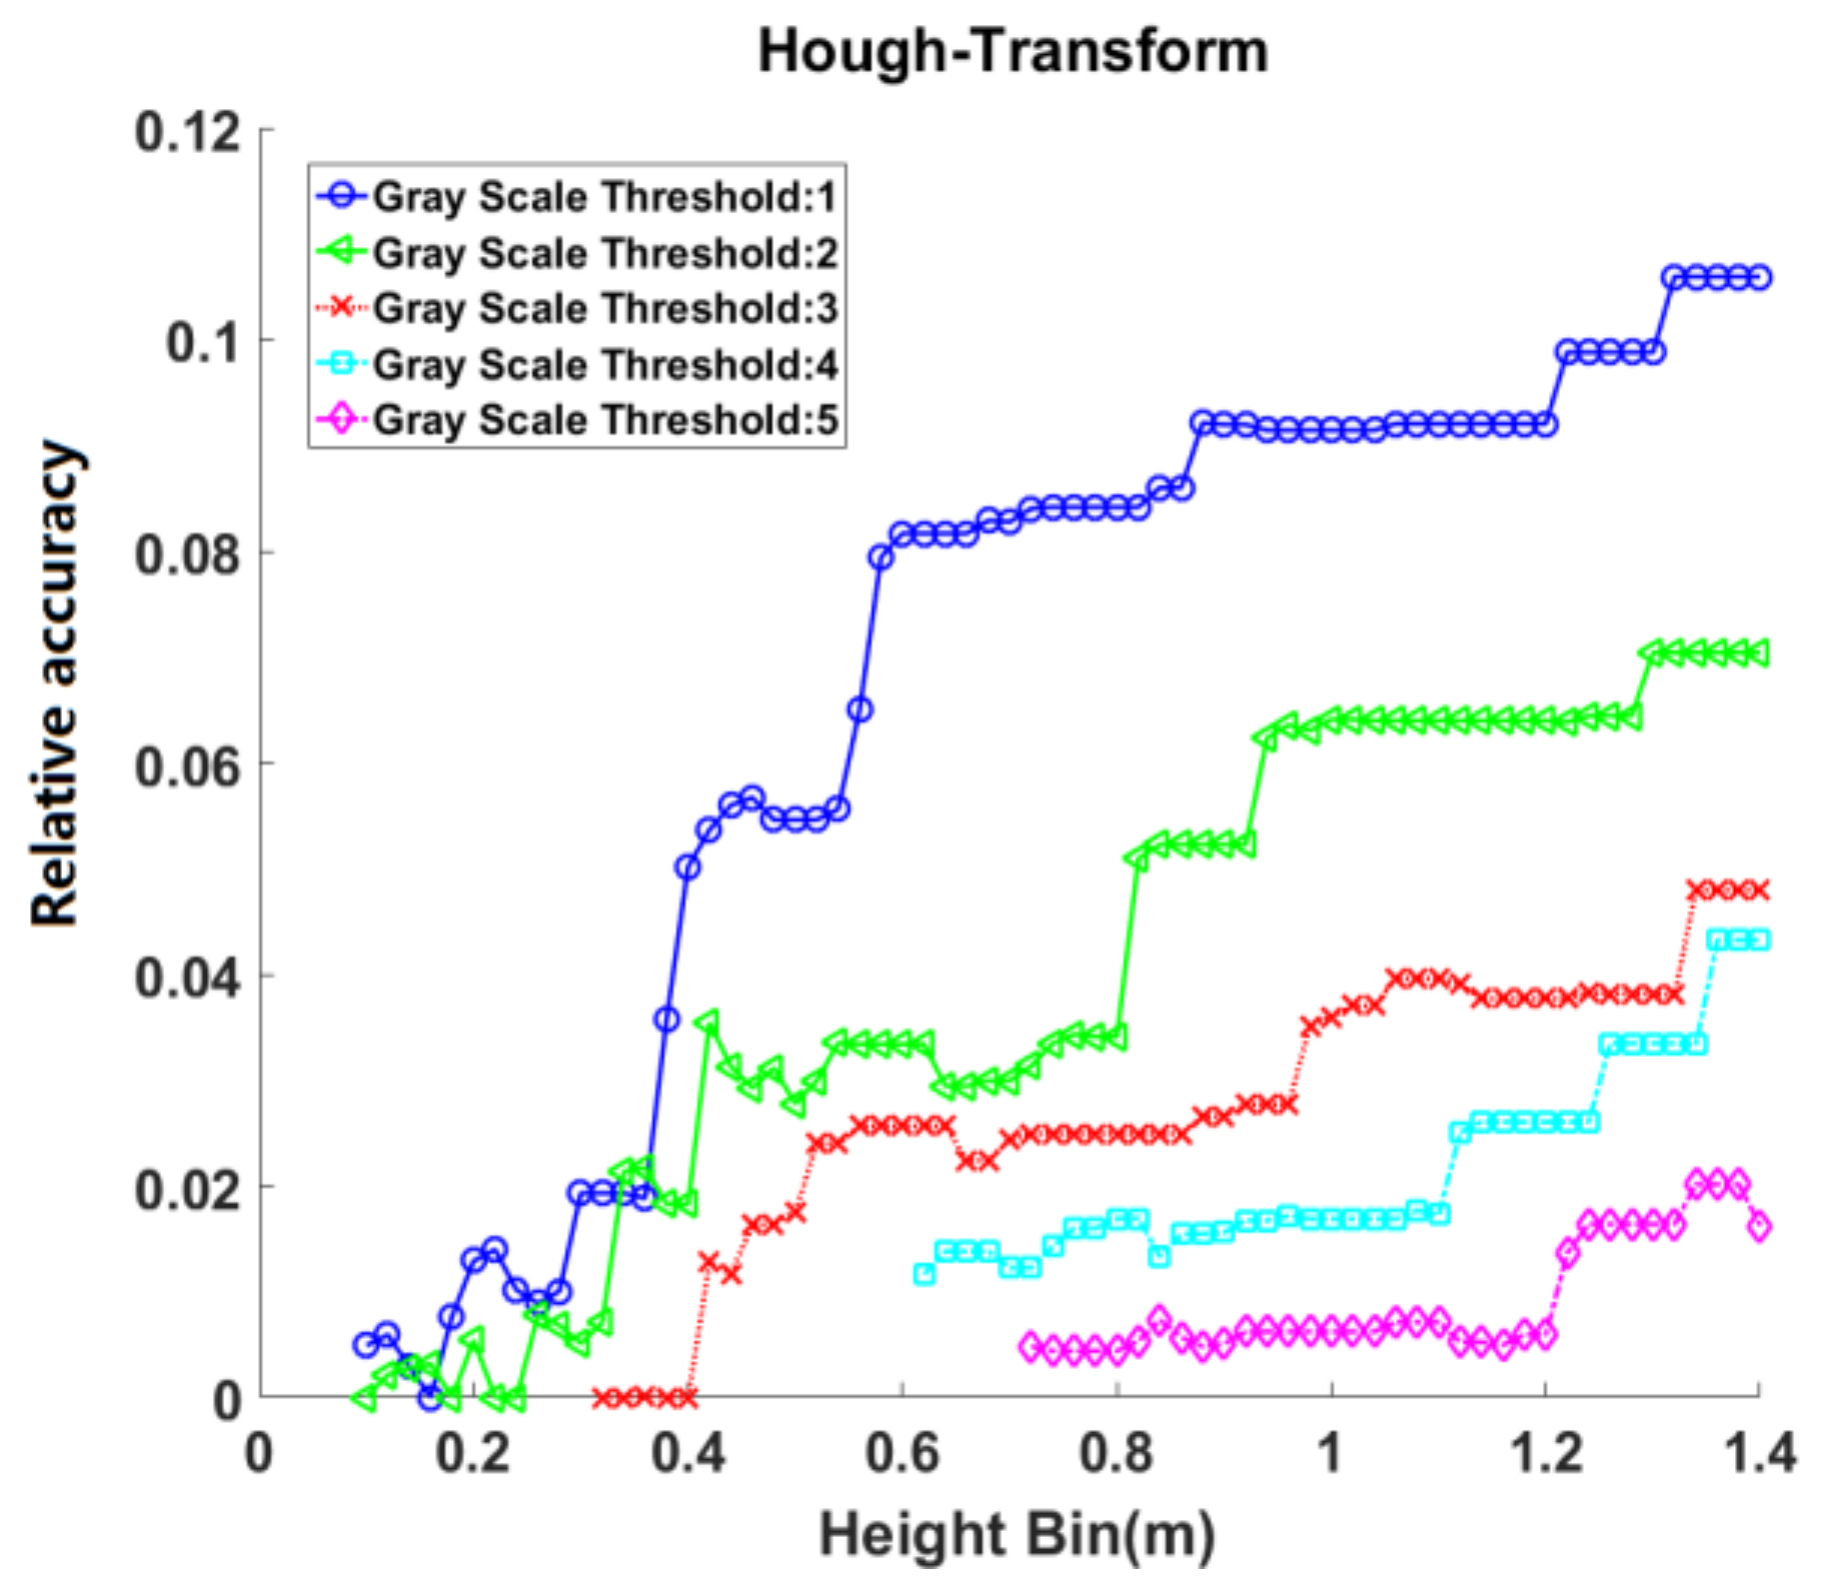
Similar to its performance in multi-scan mode, the Hough-Transform had the least successful single-scan mode results in the natural secondary forest. The maximum relative accuracy of the Hough-Transform was lower than 0.12 (
Figure 12) for the same reasons as in multi-scan mode of the natural secondary forest.
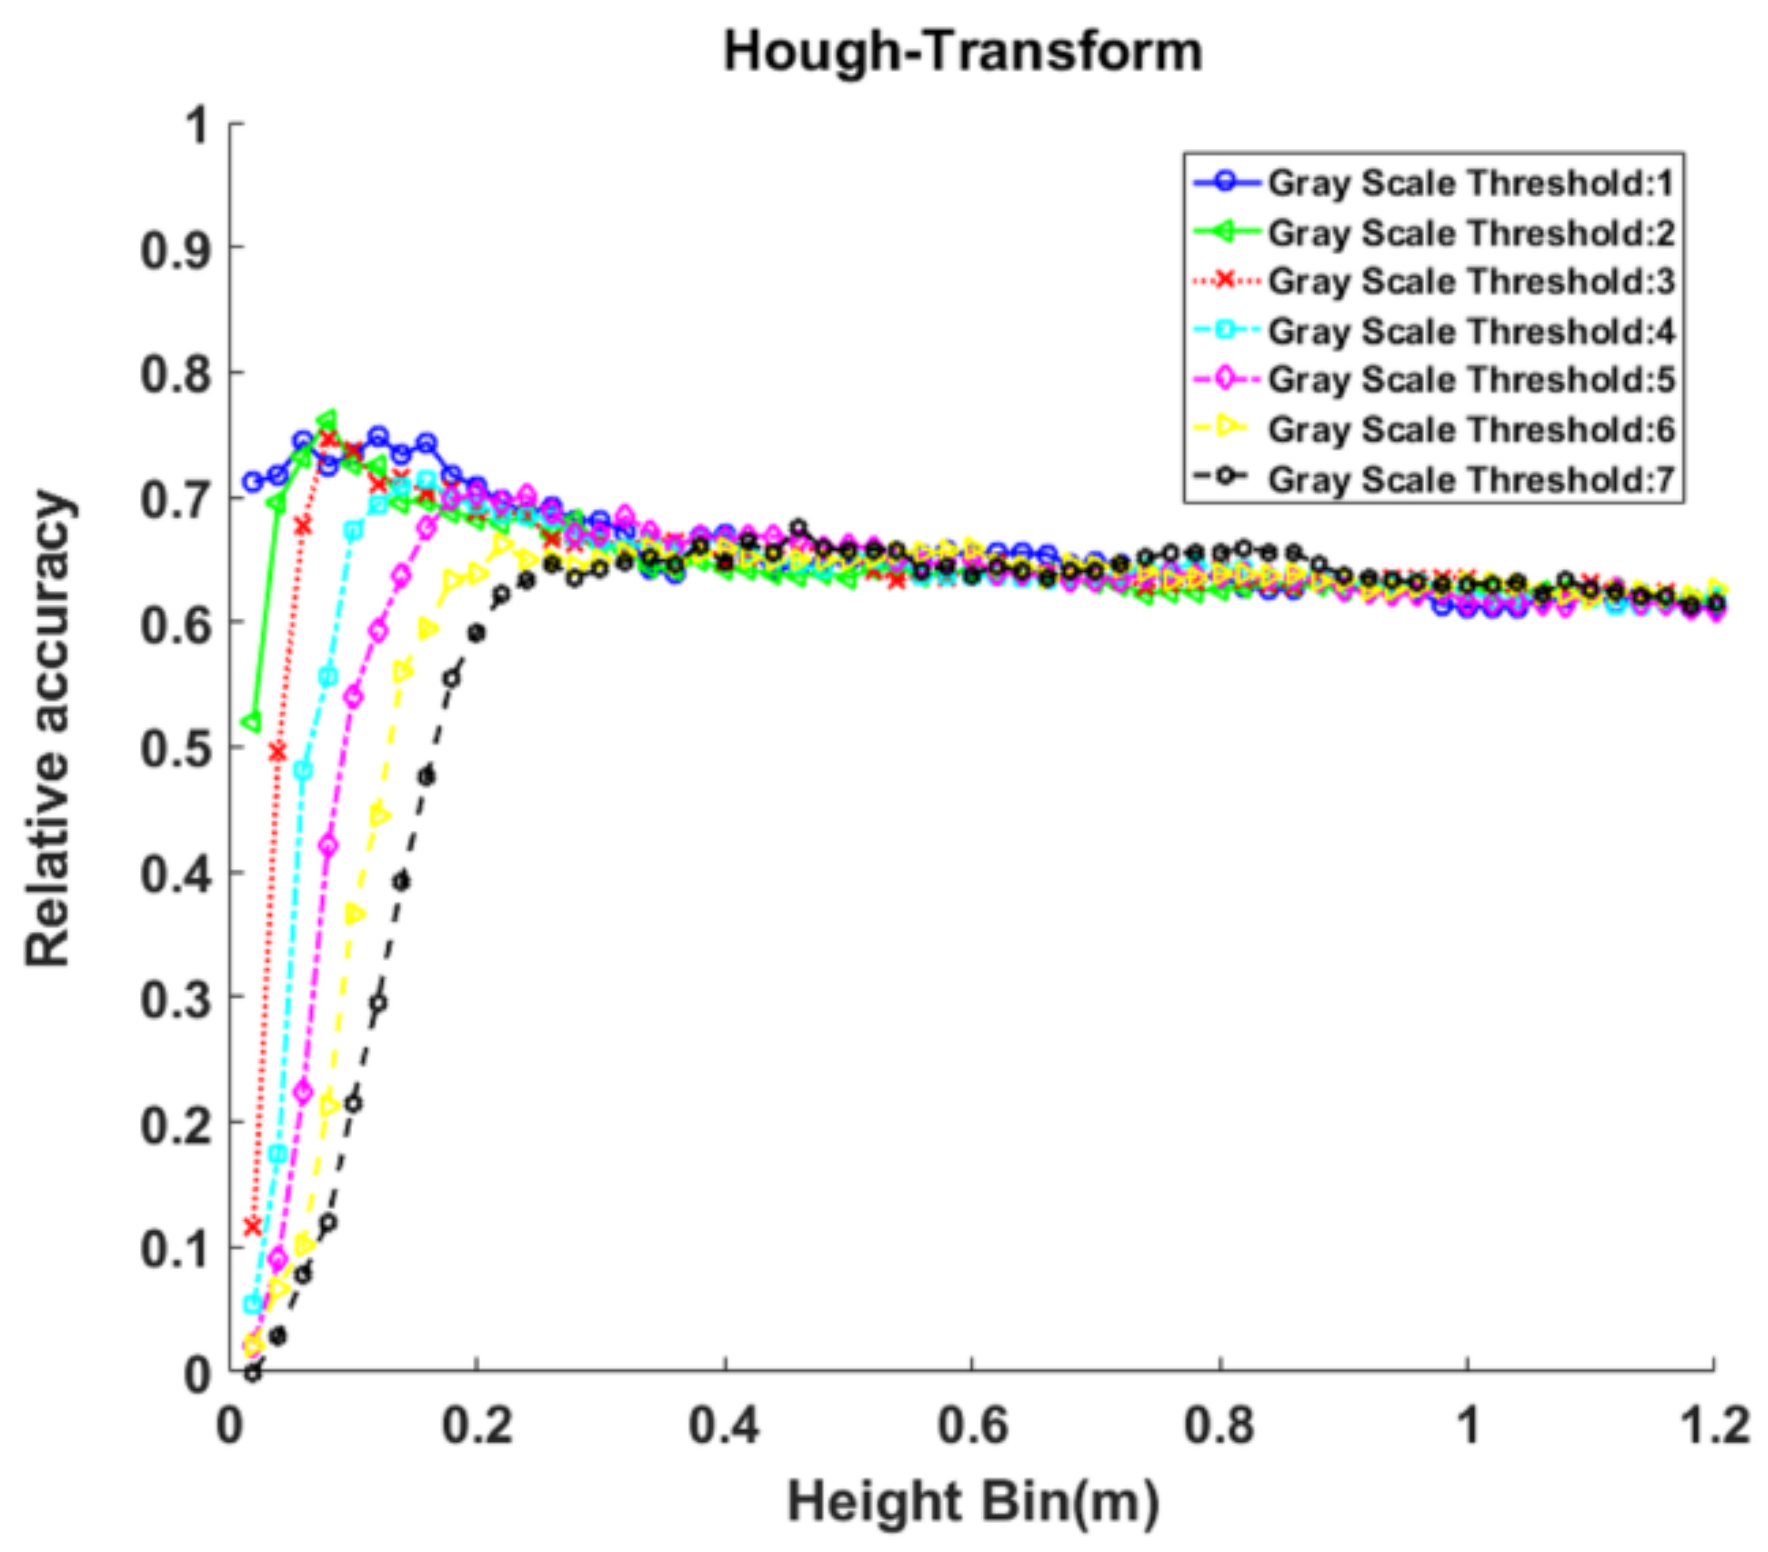
The performance of the Hough-Transform in plot 3 was better than plot 1 and 2. The maximum relative accuracy was 0.76 (with a height bin of 0.08 m and a gray scale threshold of two). The overall accuracy of the Hough-Transform showed an increasing and then a declining trend as the height bin increased (
Figure 13). The height bin started from a small value in plot 3, 0.02 m. The stem circumference was incomplete in the binary images due to the small height bin. The binary images could contain more stem circumference information as the height bin increased. Therefore, the overall accuracy of DBH estimation increased as the height bin increased in the range of 0.02–0.2 m. The height bin of the maximum accuracy point for each gray scale threshold increased as the gray scale threshold increased. This implied that a larger height bin was needed to contain enough stem information as the threshold increased.
Plot 3 was located in a plantation with few understory vegetation. Although only one scanning stations were conducted in the plot, there was relatively high stem visibility due to the sparse understory. Therefore, the height bin of ~0.2 m was enough to contain complete stem circumference information. After the height bin of ~0.2 m, the projection binary images contained more outlier points as the height bin increased, and the effect of circle fitting inclined stem point clouds was also increased, causing a decrease in the accuracy of DBH retrieval.
For gray scale threshold, the overall estimation accuracy decreased as the gray scale threshold increased. Due to sparse understory and branches, there were few numbers of outlier points in the binary images. The gray scale threshold was not needed to overcome the outlier points. Instead, more stem points would be removed as the gray scale threshold increased, causing the incomplete of stem circumference and a decrease in the accuracy of DBH estimation.
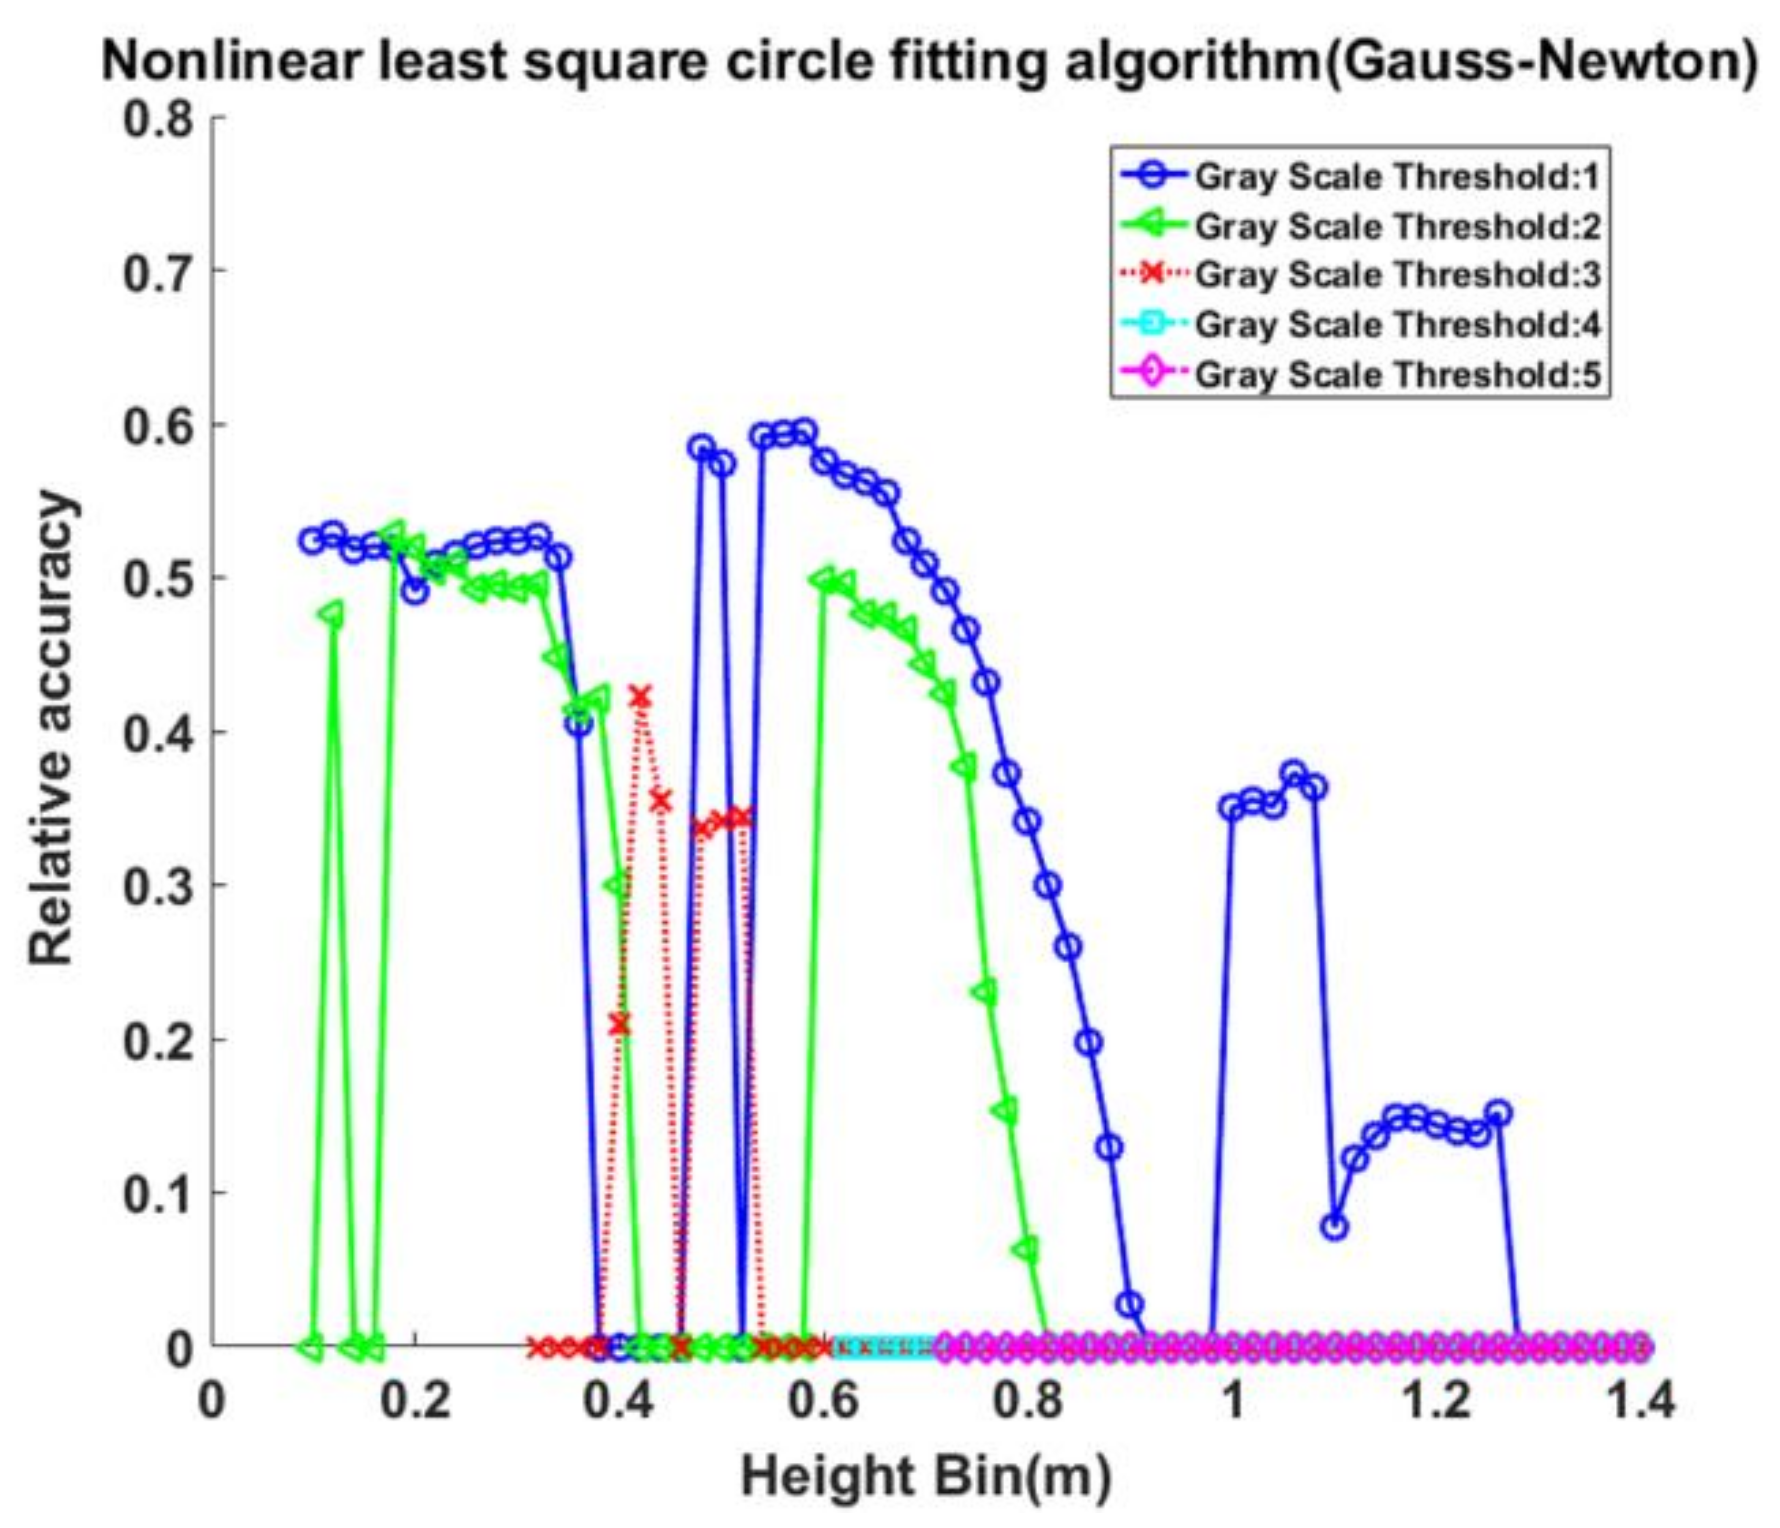
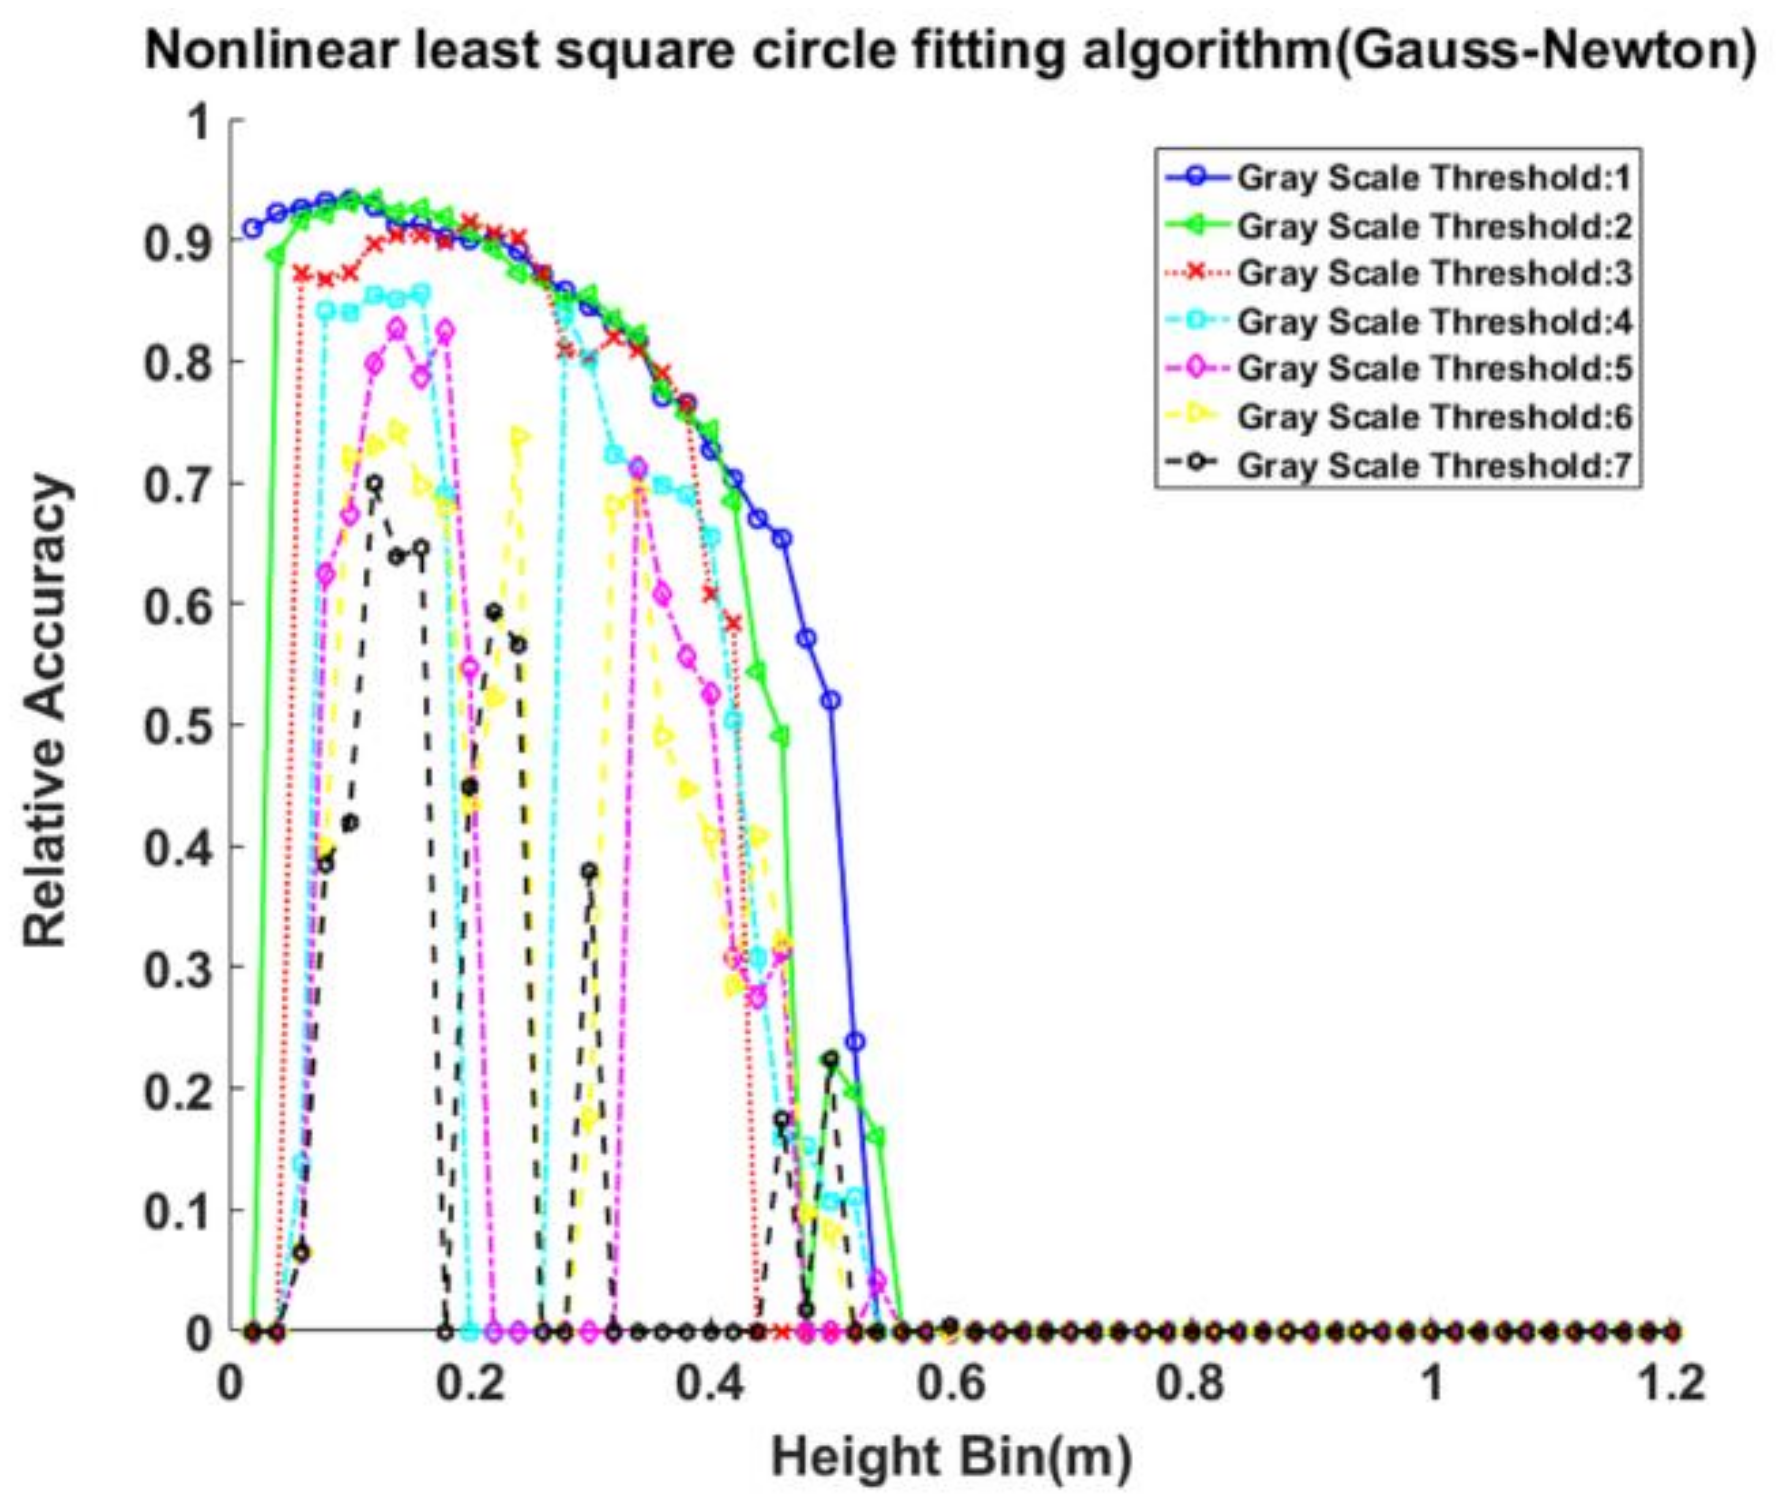
The nonlinear least square algorithm was less accurate in single-scan mode of the natural secondary forest. The maximum relative accuracy was 0.59 (with a height bin of 0.58 m and a gray scale threshold of one). Compared with multi-scan mode, there were some “zero points,” meaning that the relative accuracy was not within the range of zero to one (
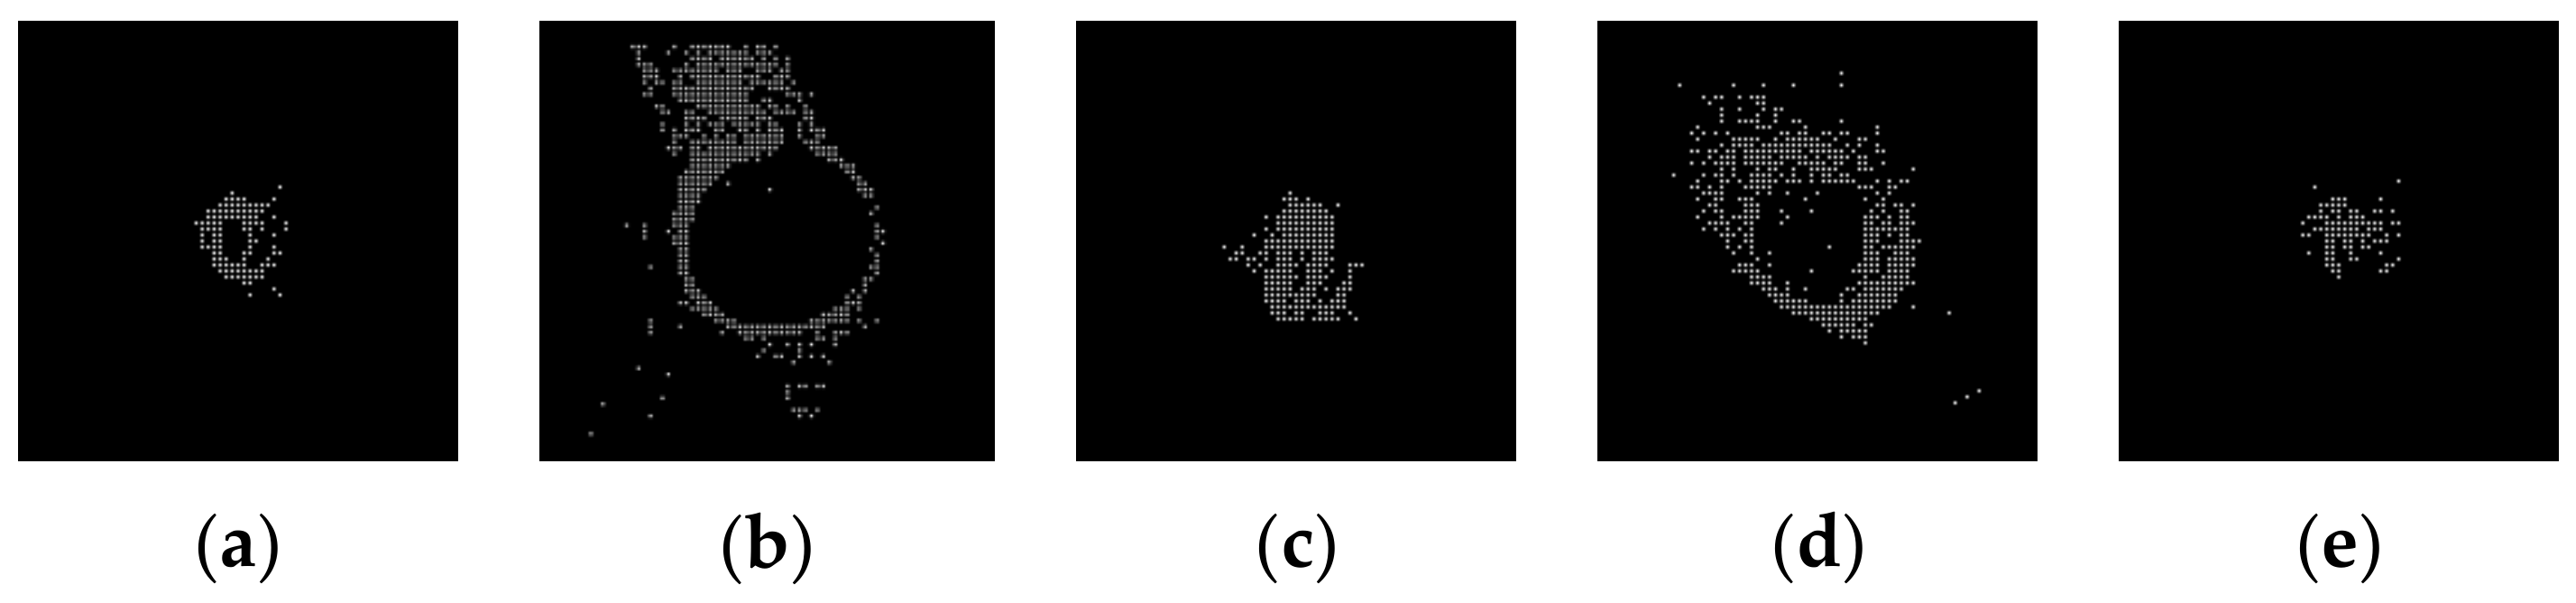
Figure 14). These “zero points” resulted from the low SNR of the binary images. The visibility of trees was low in single-scan mode of the natural secondary forest, resulting in incomplete stem circumference information and a low SNR (
Figure 6). The nonlinear least square algorithm may converge to the local minimum instead of global minimum, leading to a large bias of the estimated DBH. This implies that the nonlinear least square algorithm had a high input image quality requirement. The algorithm was less stable with low accuracy when the image quality was low. Therefore, the nonlinear least squares algorithm is not an appropriate choice for single-scan mode of the natural secondary forest.
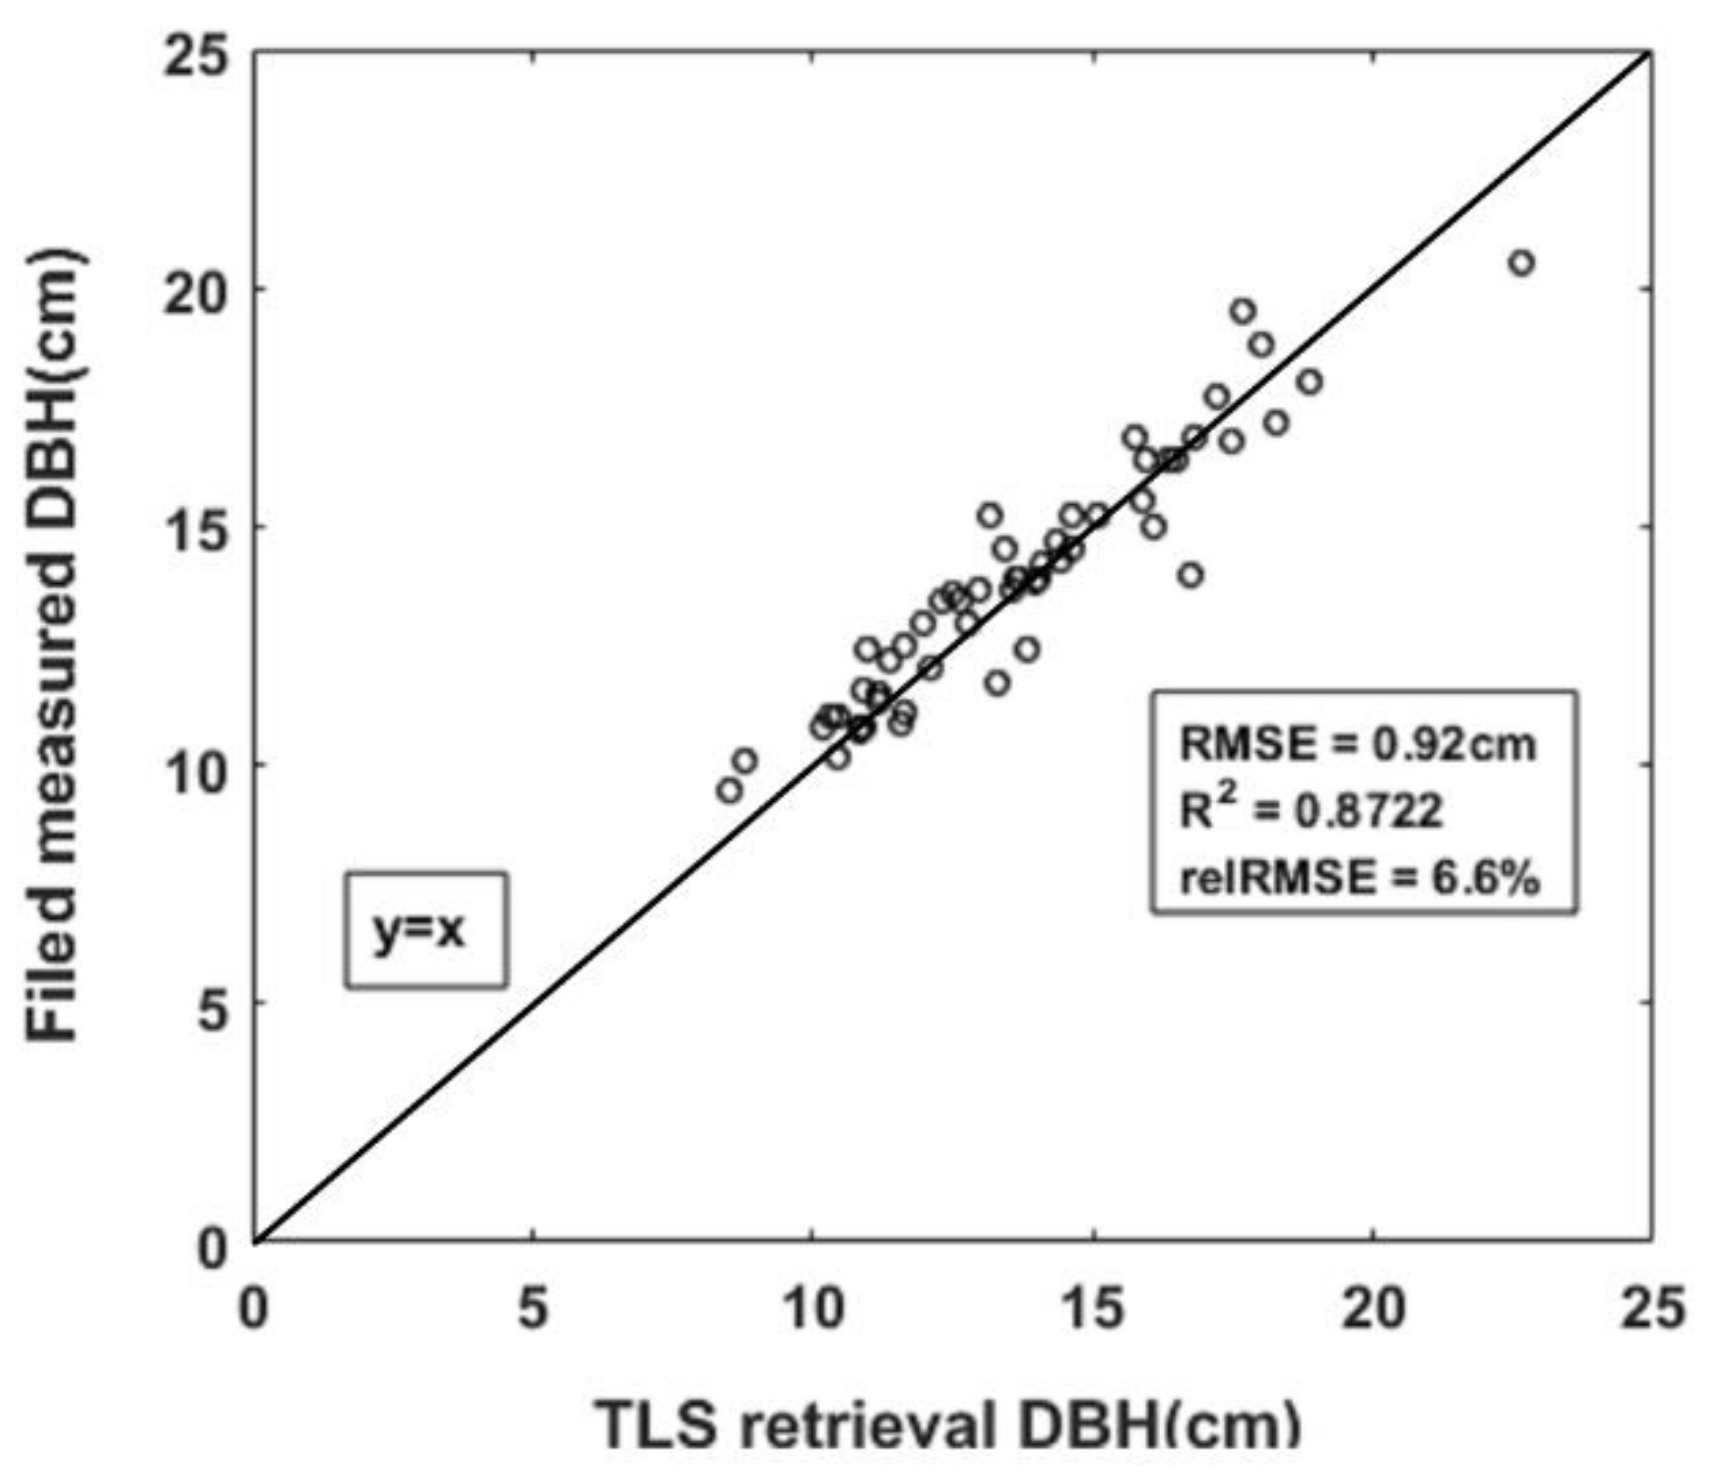
The maximum accuracy of the nonlinear least square algorithm in plot 3 was obtained under the height bin of 0.1 m and the gray scale threshold of 1:
R2 0.87, RMSE 0.92 cm, and relative RMSE 6.63%. At the gray scale threshold of 1–3, the accuracy of the nonlinear least square algorithm showed an increasing and then a declining trend as the height bin increased (
Figure 15). The height bin of the maximum accuracy point for each gray scale threshold was 0.1, 0.1, and 0.22 m, respectively. Like described in the Hough-Transform of plot 3, the stem circumference was incomplete under the small height bin; while the projection binary images contained more outlier points and the effect of circle fitting inclined stem point clouds was also increased under the large height bin. Therefore, a moderate height bin of 0.1–0.22 m was the most optimal parameterization.
The algorithm was not stable at thresholds of 4–7, and some “zero points” appeared. The accuracy of the algorithm decreased to zero for all the gray scale thresholds after the height bin increased to 0.56 m. More stem points would be removed under the large gray scale threshold, causing the incomplete of stem circumference and a low quality of the binary images. Similarly, more outlier points were preserved and the effect of circle fitting inclined stem point clouds increased due to the excessive height bin, causing the low SNR of the binary images. The algorithm was not able to obtain accurate results from the low SNR images, as described in the single-scan mode of the natural secondary forest. The accuracy decreased to zero. The results showed that the nonlinear least square algorithm had a high requirement on input image quality, a moderate small height bin (0.1–0.22 m) and a small gray scale threshold (1–3) were appropriate when using this algorithm in the plantation.
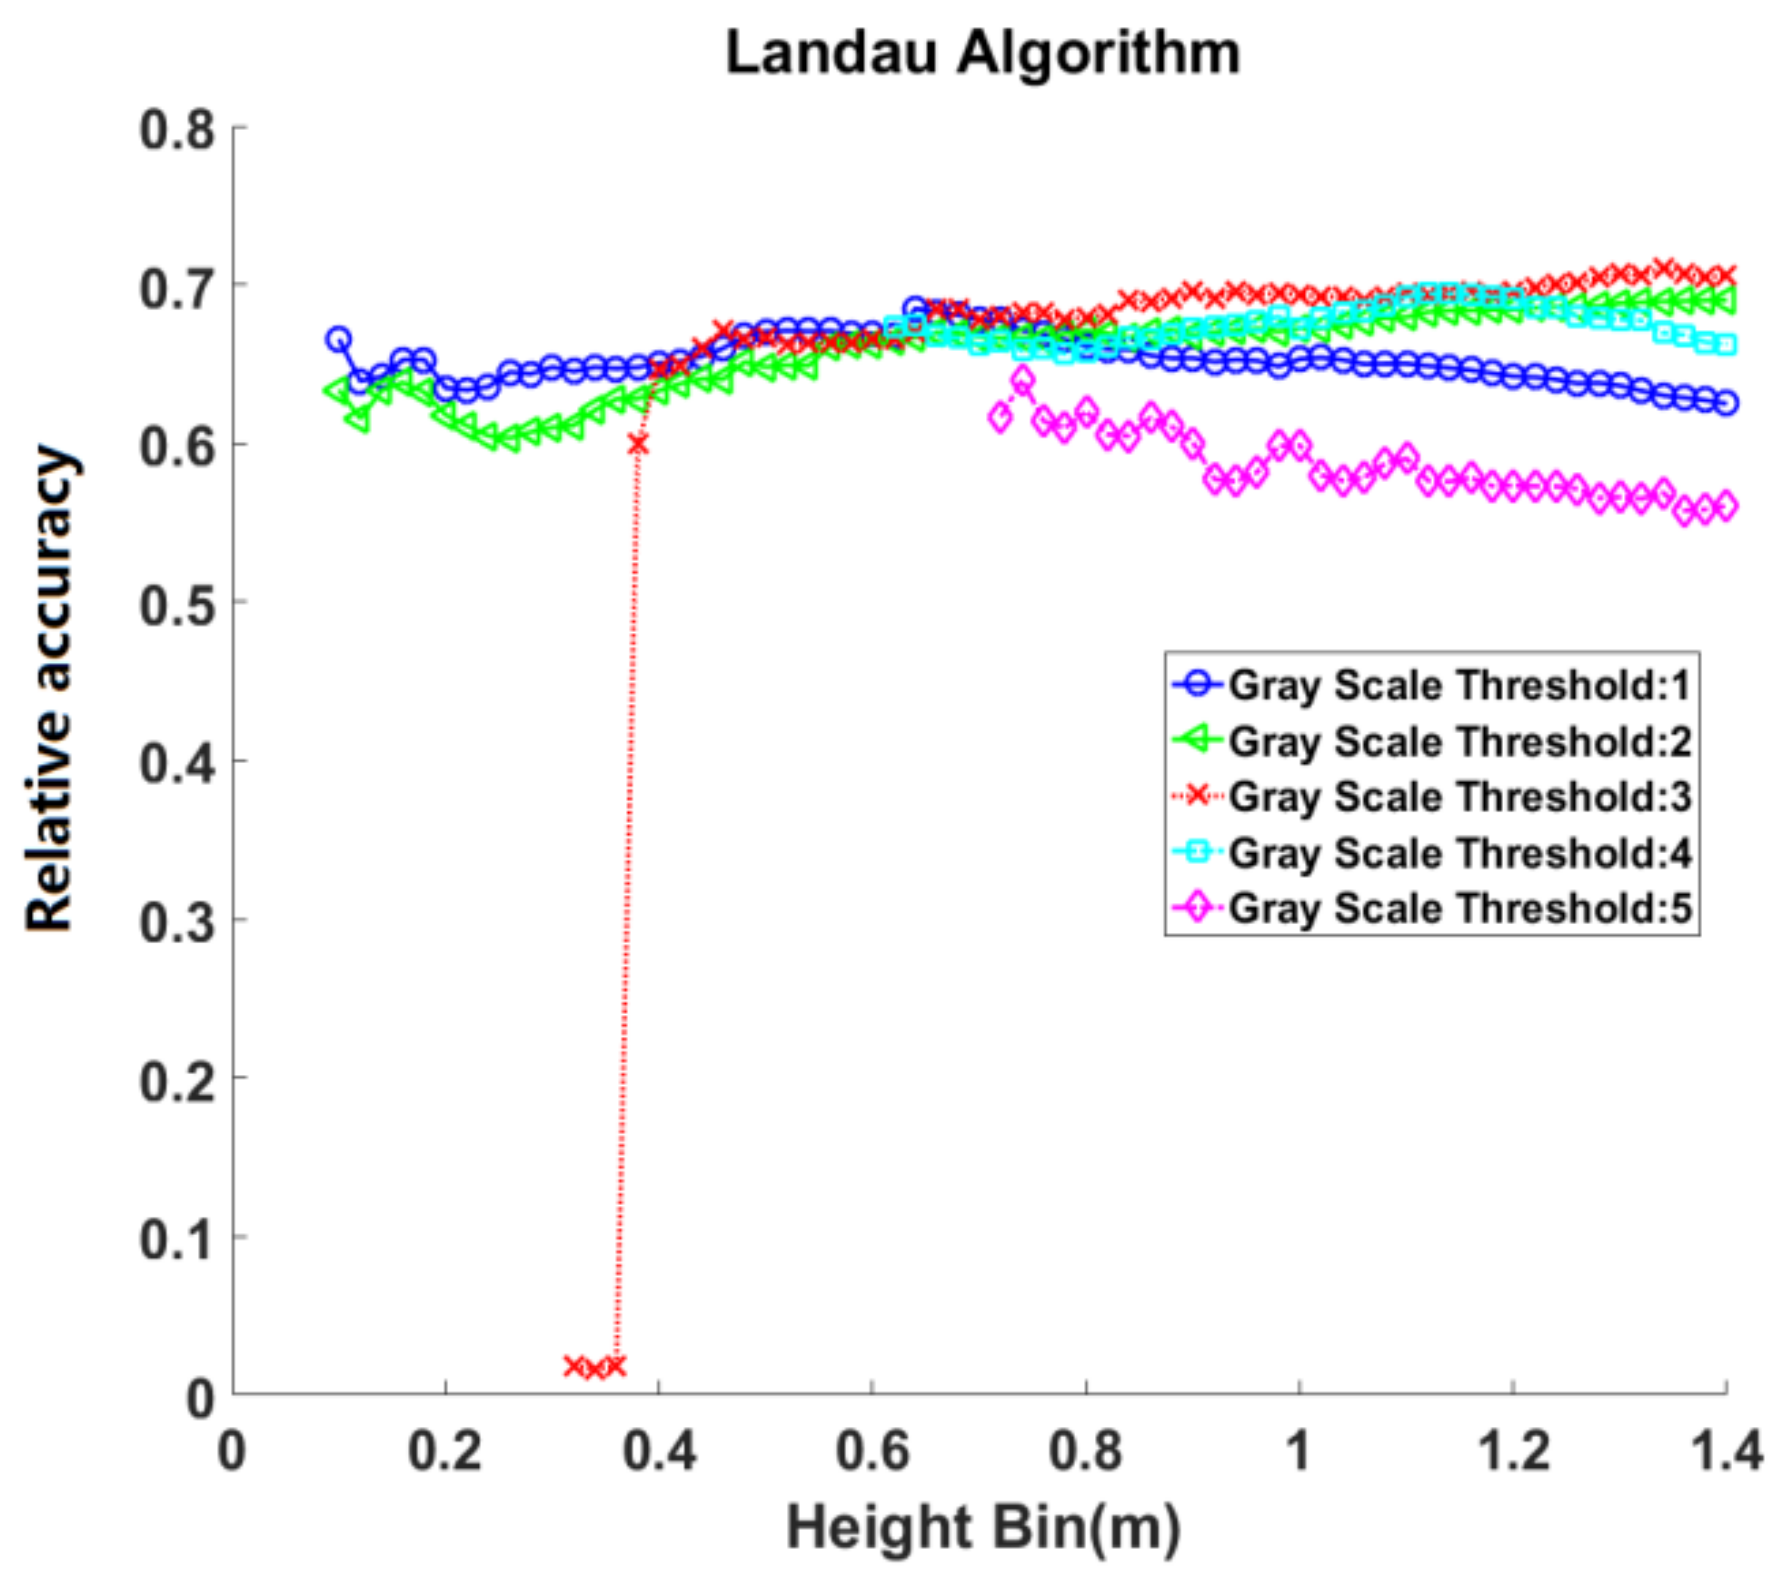
In single scan mode of the natural secondary forest, the maximum accuracy of the Landau algorithm was obtained under the height bin of 1.34 m and the gray scale threshold of 3:
R2 0.85, RMSE 4.38 cm and relative RMSE 29.3%. At the gray scale threshold of one and four, the accuracy of the Landau algorithm showed an increasing and then a declining trend (
Figure 16). The accuracy increased at thresholds of two and three and decreased at a threshold of five as the height bin increased. The Landau algorithm was more accurate when the gray scale threshold ranged from two to four, and the height bin was 1.2–1.4 m. The highest accuracy was reached using a gray scale threshold of three. In previous studies [
19,
20,
26,
27,
29], slices corresponding to a large height bin, such as 1.34 m, had not been used.
The projection binary images had a lower SNR because of the low visibility of the trees in single-scan mode of the natural secondary forest (
Figure 6). When the height bin was relatively large, the projection binary images could contain more stem circumference information. Therefore, the Landau algorithm was able to perform well. At the same time, the projection binary images also contained more outlier points due to the larger height bin, decreasing the overall accuracy of the Landau algorithm. To ensure that there is sufficient capacity to remove the outlier points, the gray-scale threshold should be relatively large.
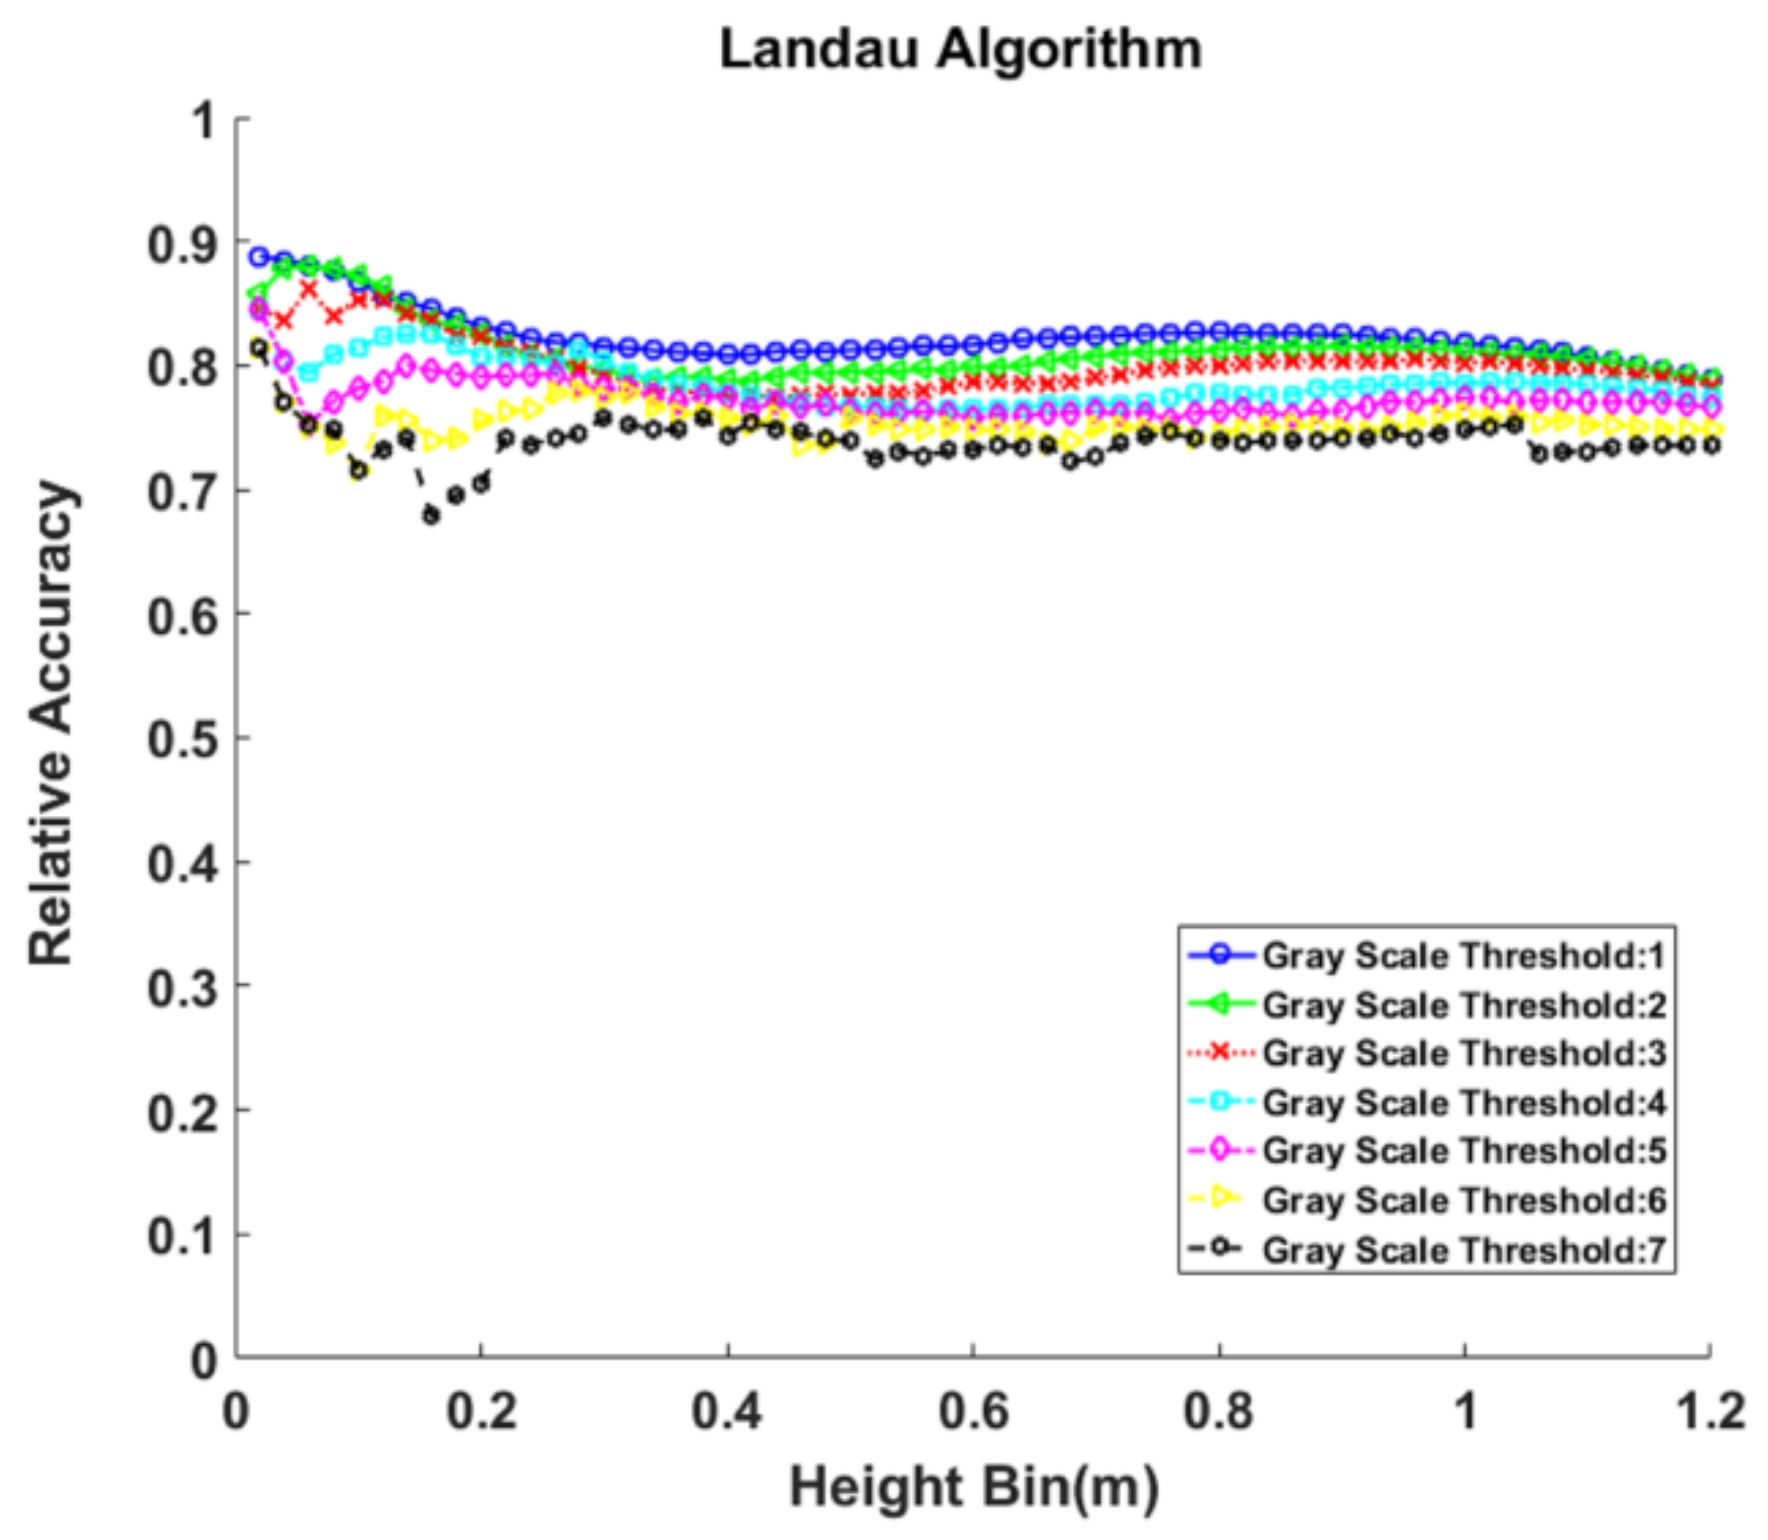
In plot 3, the Landau algorithm was most accurate under the height bin of 0.02 m with a gray scale threshold of 1. The
R2 was 0.64, the RMSE was 1.55 cm, and the relative RMSE was 11.2%. The accuracy decreased slightly as the height bin increased (
Figure 17). The reason why the accuracy decreased was similar to that of the Hough-Transform in plot 3. The algorithm had lower accuracy under a small height bin and a large gray scale threshold (5–7). The projection binary images had less stem points under a small height bin, meanwhile a large gray scale threshold removed more stem points, causing an incomplete of the stem circumference information. Therefore, the accuracy of the algorithm was low due to the lack of the stem circumference.
For gray scale threshold, the accuracy decreased as the gray scale threshold increased. The reason was similar to that of the Hough-Transform in plot 3. The accuracy of Landau algorithm had less variation under different preprocessing conditions. This implied that Landau algorithm was less depending on the chosen preprocessing conditions and therefore more robust than the other two algorithms.
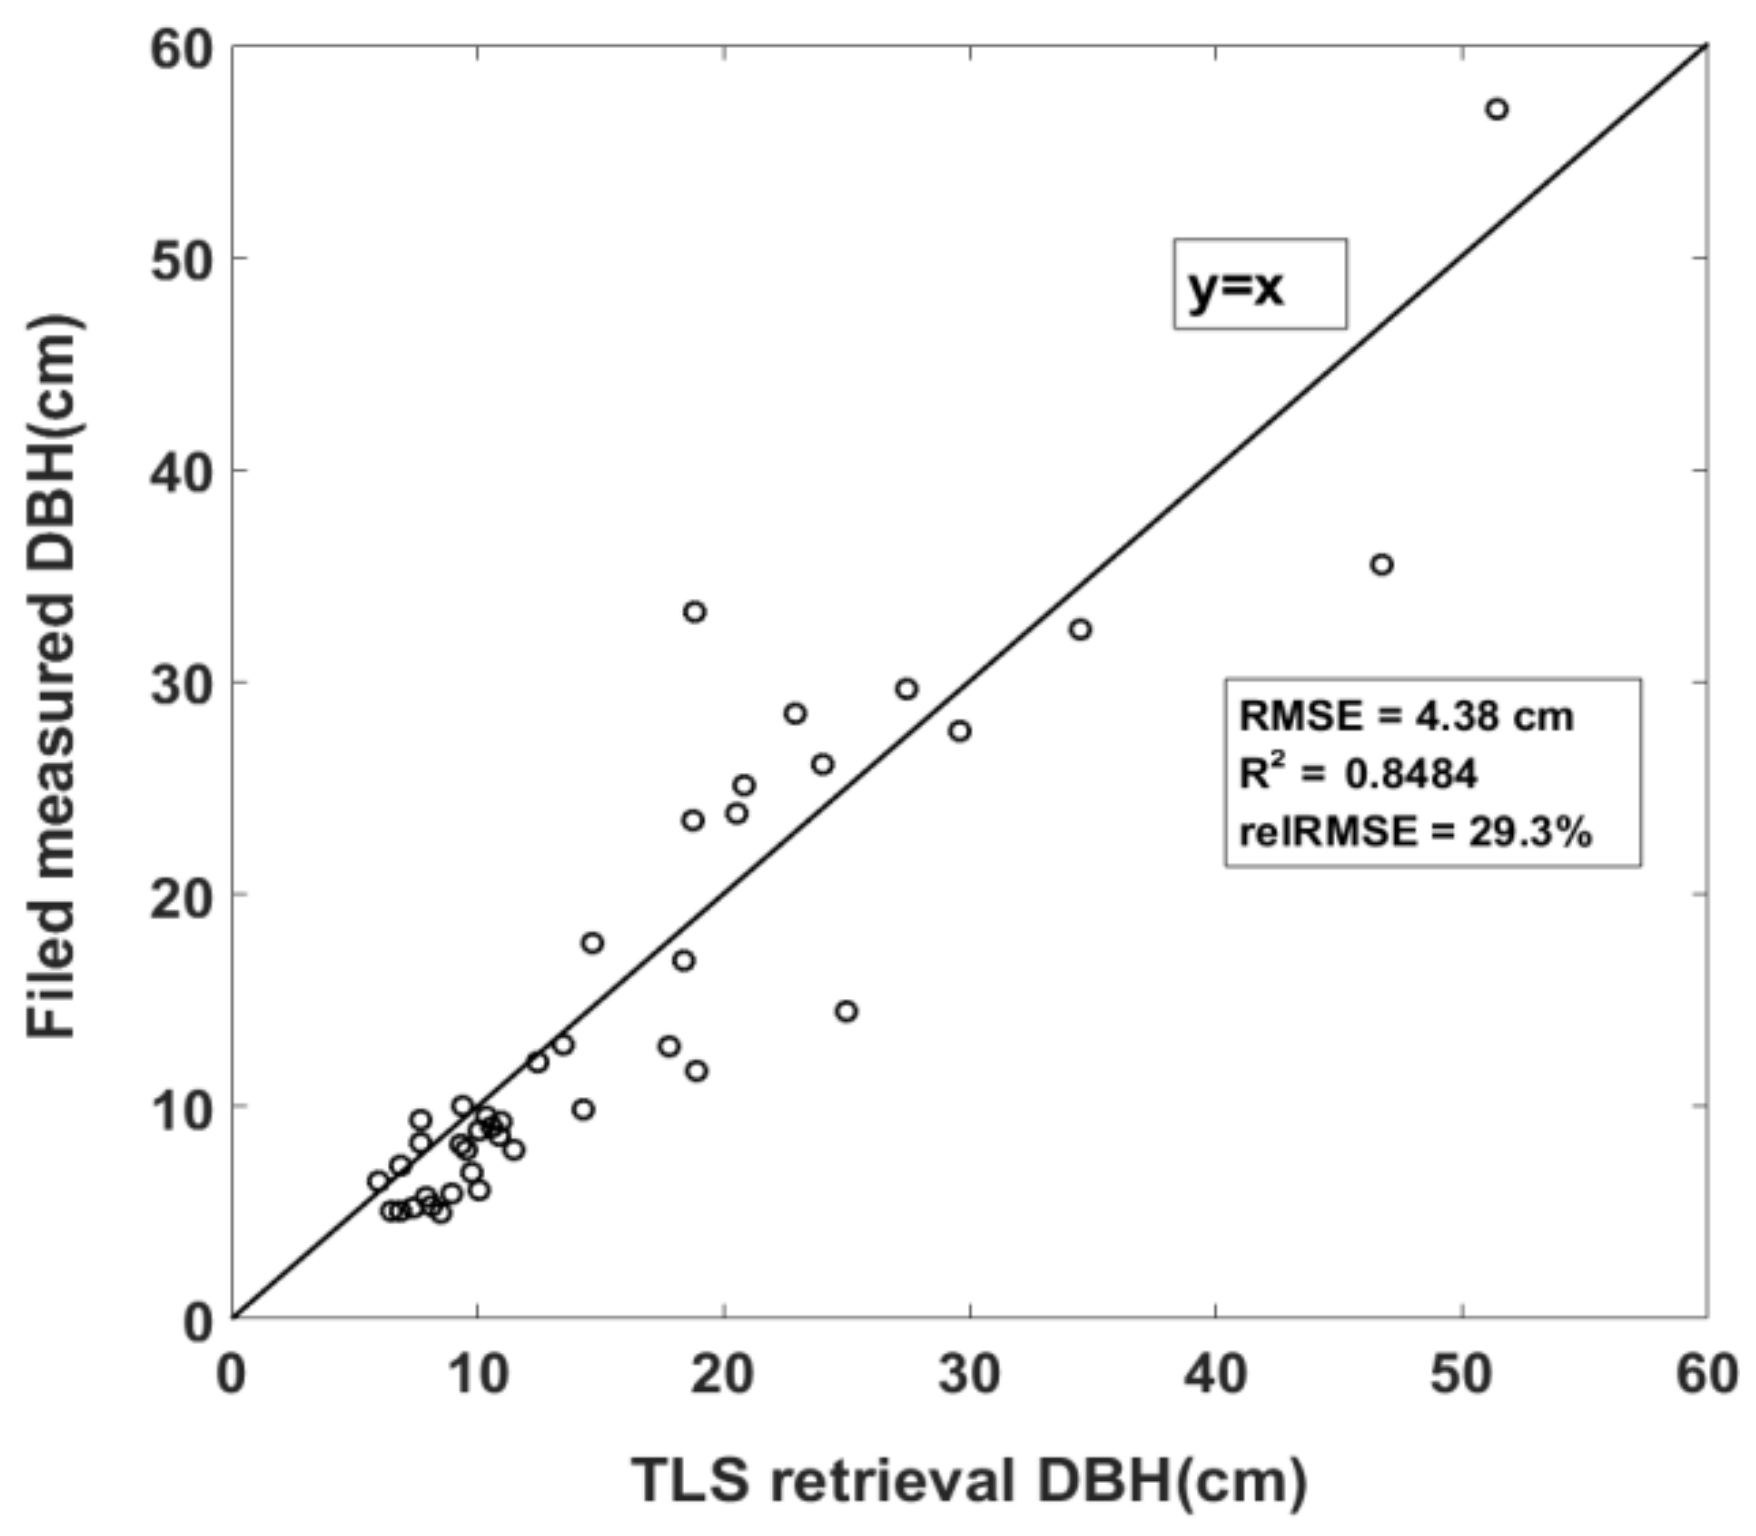
The Landau algorithm showed maximum accuracy of all algorithms tested in single-scan mode of the natural secondary forest.
Figure 18 shows the scatter plot of TLS estimated DBH and field measured DBH using the most accurate single-scan mode method in the natural secondary forest (Landau algorithm, a height bin of 1.34 m, and a gray scale threshold of 3).
The nonlinear least square algorithm obtained the most accurate results of all the tested algorithms in plot 3.
Figure 19 shows the scatter plot of TLS estimated DBH versus field measured DBH in the plantation, which provided the most accuracy (nonlinear least square algorithm, a height bin of 0.1 m, and a gray scale threshold of 1).
Compared with the results of multi-scan mode, the accuracy of the nonlinear least square algorithm was greatly influenced by the image quality. The accuracy was low and unstable when the tree circumference was incomplete, and the SNR of the slice image was low. The results showed that it was less robust than the Landau algorithm. This was due to the algorithm possibly converging to a local minimum rather than the global minimum, as described in
Section 2.4. However, compared with the results of plot 1 and 2, the nonlinear least square algorithm had a high accuracy due to the high SNR of the slice images in plot 3 (
Figure 7). The results showed that the nonlinear least square algorithm had the best performance among the three tested algorithms when the quality of the images was high.
In all the plots, the Landau algorithm was less depending on the preprocessing conditions and the quality of the images. The algorithm was more robust (the “zero point” rarely appeared) and had a higher accuracy for single-scan mode of the natural secondary forest with lower SNR. This implied that the Landau algorithm was most robust and stable among the three tested algorithms. However, the Landau algorithm’s accuracy was not as good as the nonlinear least square algorithm when the image quality was high. The performance of Hough-Transform was worse than the other two algorithms in all the plots. Overall, the nonlinear least square algorithm was preferable for the plantation with a higher quality of projection binary images. The Landau algorithm was preferable for the natural secondary forest with enormous numbers of outlier points and a lower SNR.
The accuracies of algorithms in plot 3 were higher (
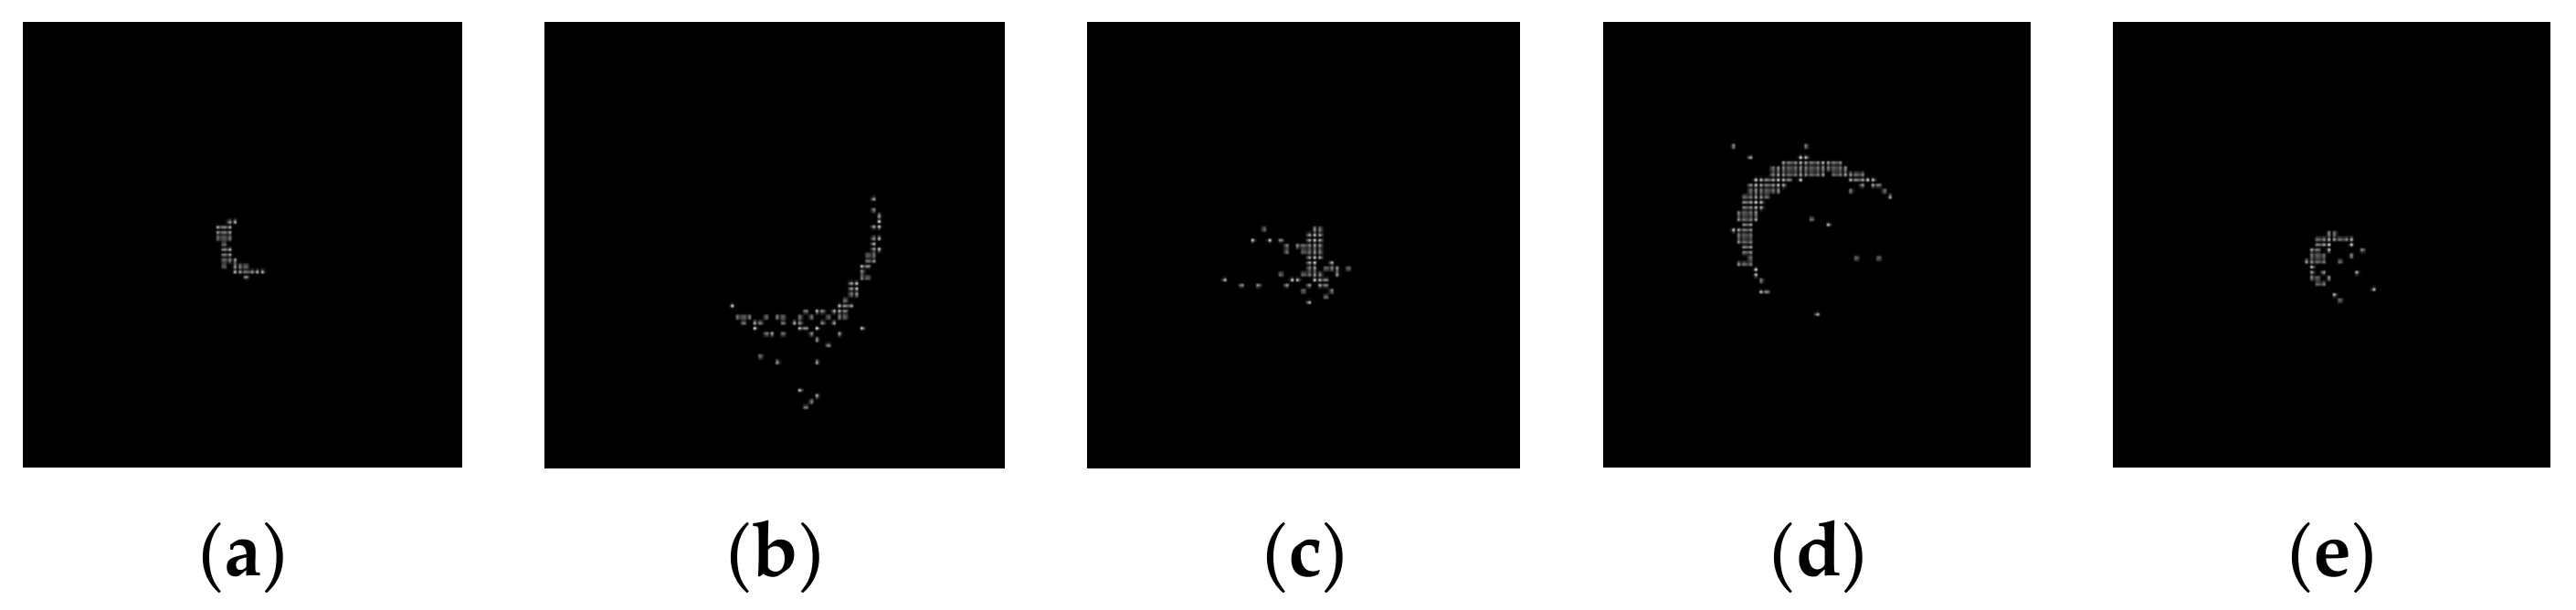
Table 3) and also had less variation compared with the results in plot 1 and 2. The differences of the forest condition between the plots may be the main cause. Plot 1 and 2 was inside a natural secondary forest. The forest condition was complex featuring dense understory vegetation and tree branches. This forest condition resulted in enormous numbers of outlier points and a relatively low SNR of the binary images, as shown in
Figure 5 and
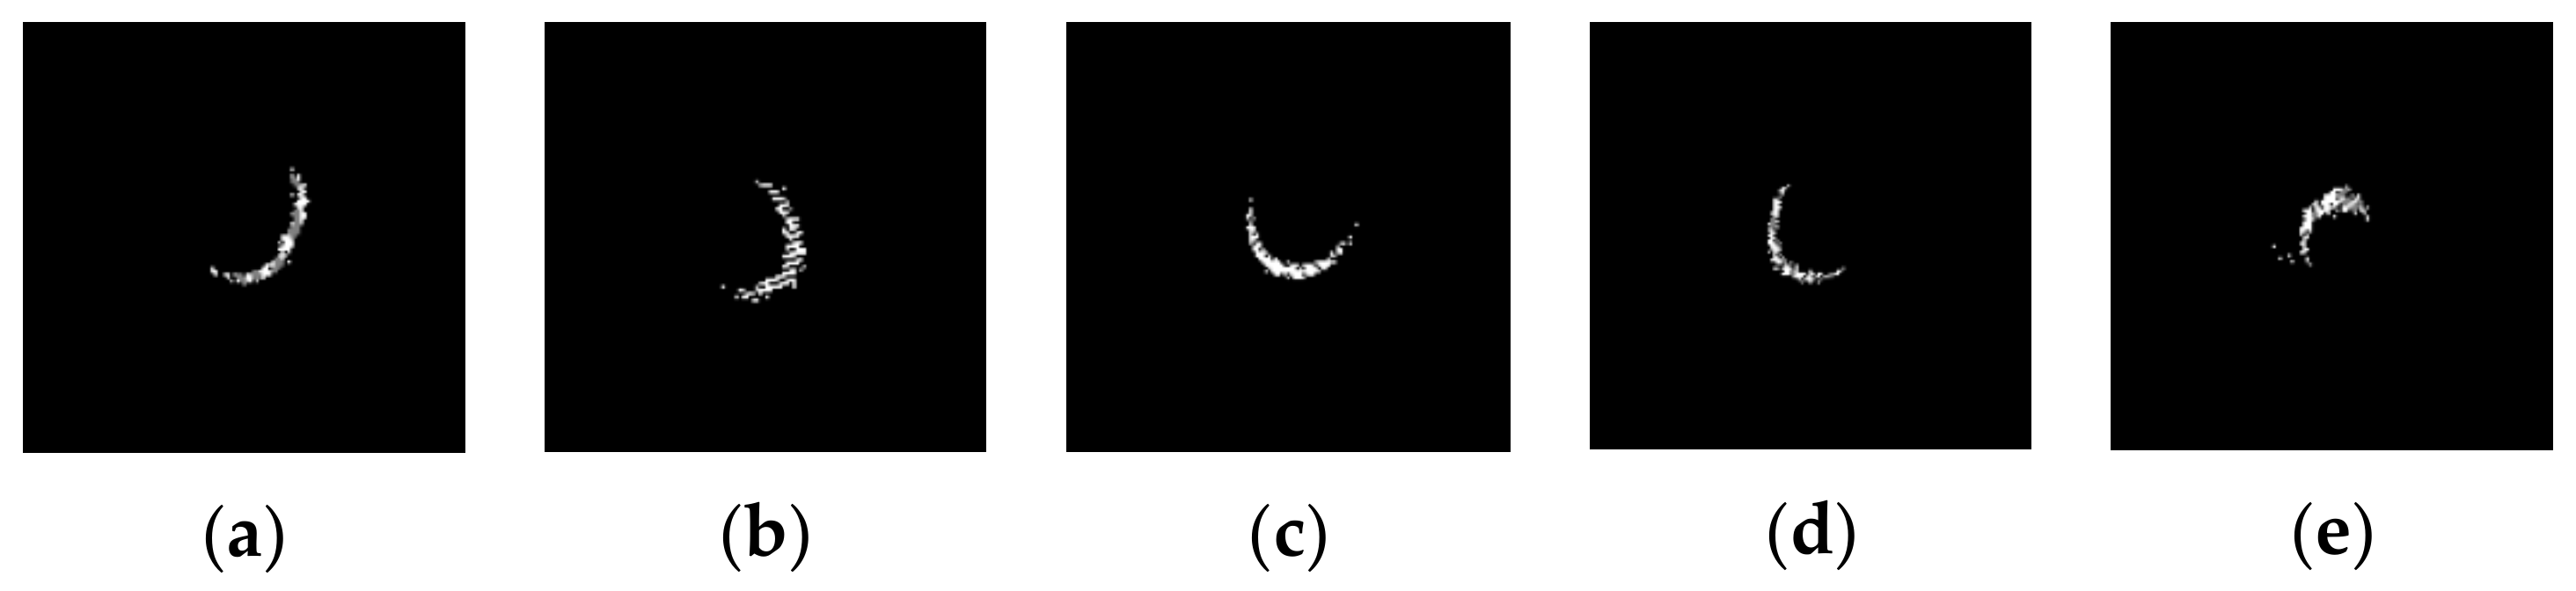
Figure 6. The algorithms may produce a large bias under some preprocessing conditions due to the low quality of the images. This would result in the worse accuracy and the high variations of the results. The forest condition of plot 3 was simple, featuring little understory vegetation and few tree branches. This resulted in fewer outlier points in the binary images (
Figure 7). The algorithms were more stable and accurate due to the high quality of the images, even though only the single-scan scanning method was conducted.
This study focused on evaluating different methods for extracting DBH and did not incorporate automatic stem delineation algorithms in order to ensure that all stems are identified. For an operational application, there were various methods of automatic stem map** from TLS data [
40]. Our results can be easily combined with these automatic stem map** methods to retrieve stem position and DBH rapidly with low time and labor cost.


