Geodetic Constraints on the Crustal Deformation along the Kunlun Fault and Its Tectonic Implications

Abstract
:
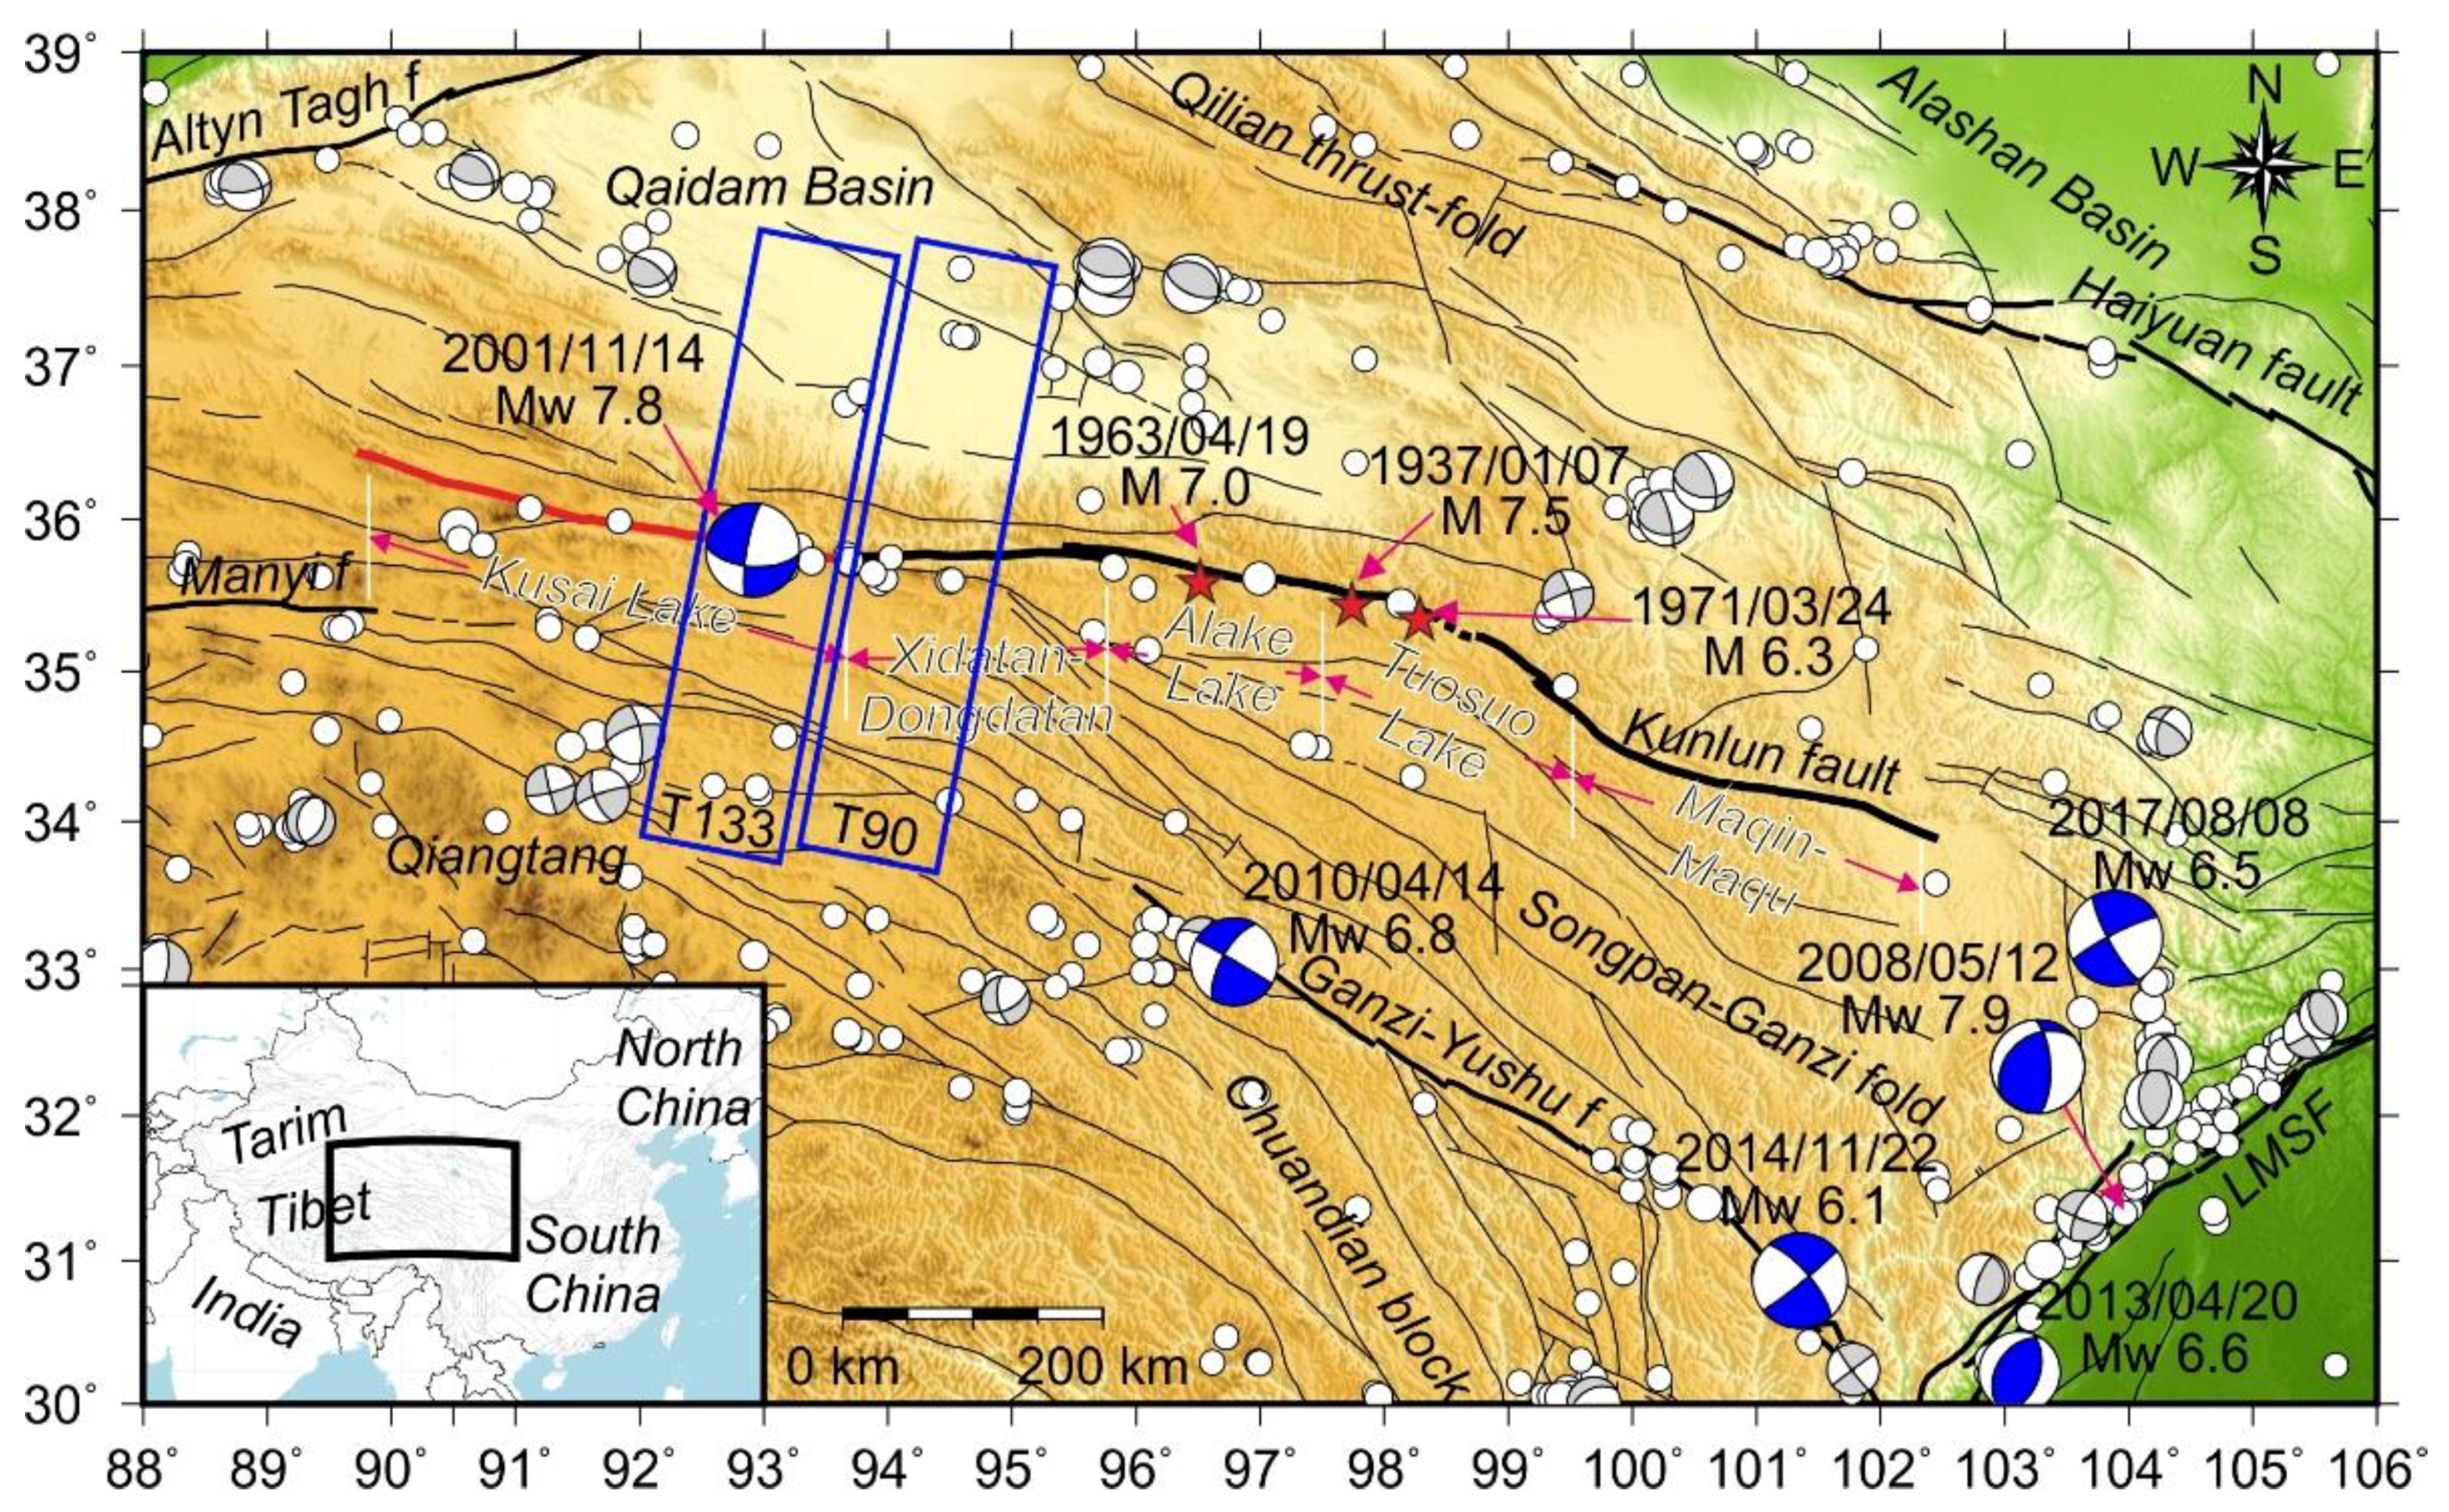
1. Introduction
2. Geodetic Data and Model
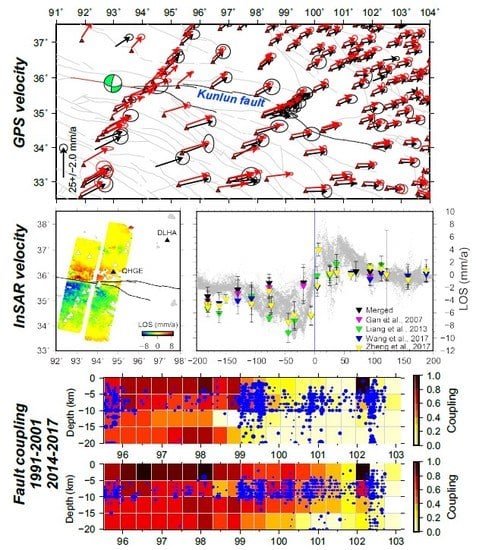
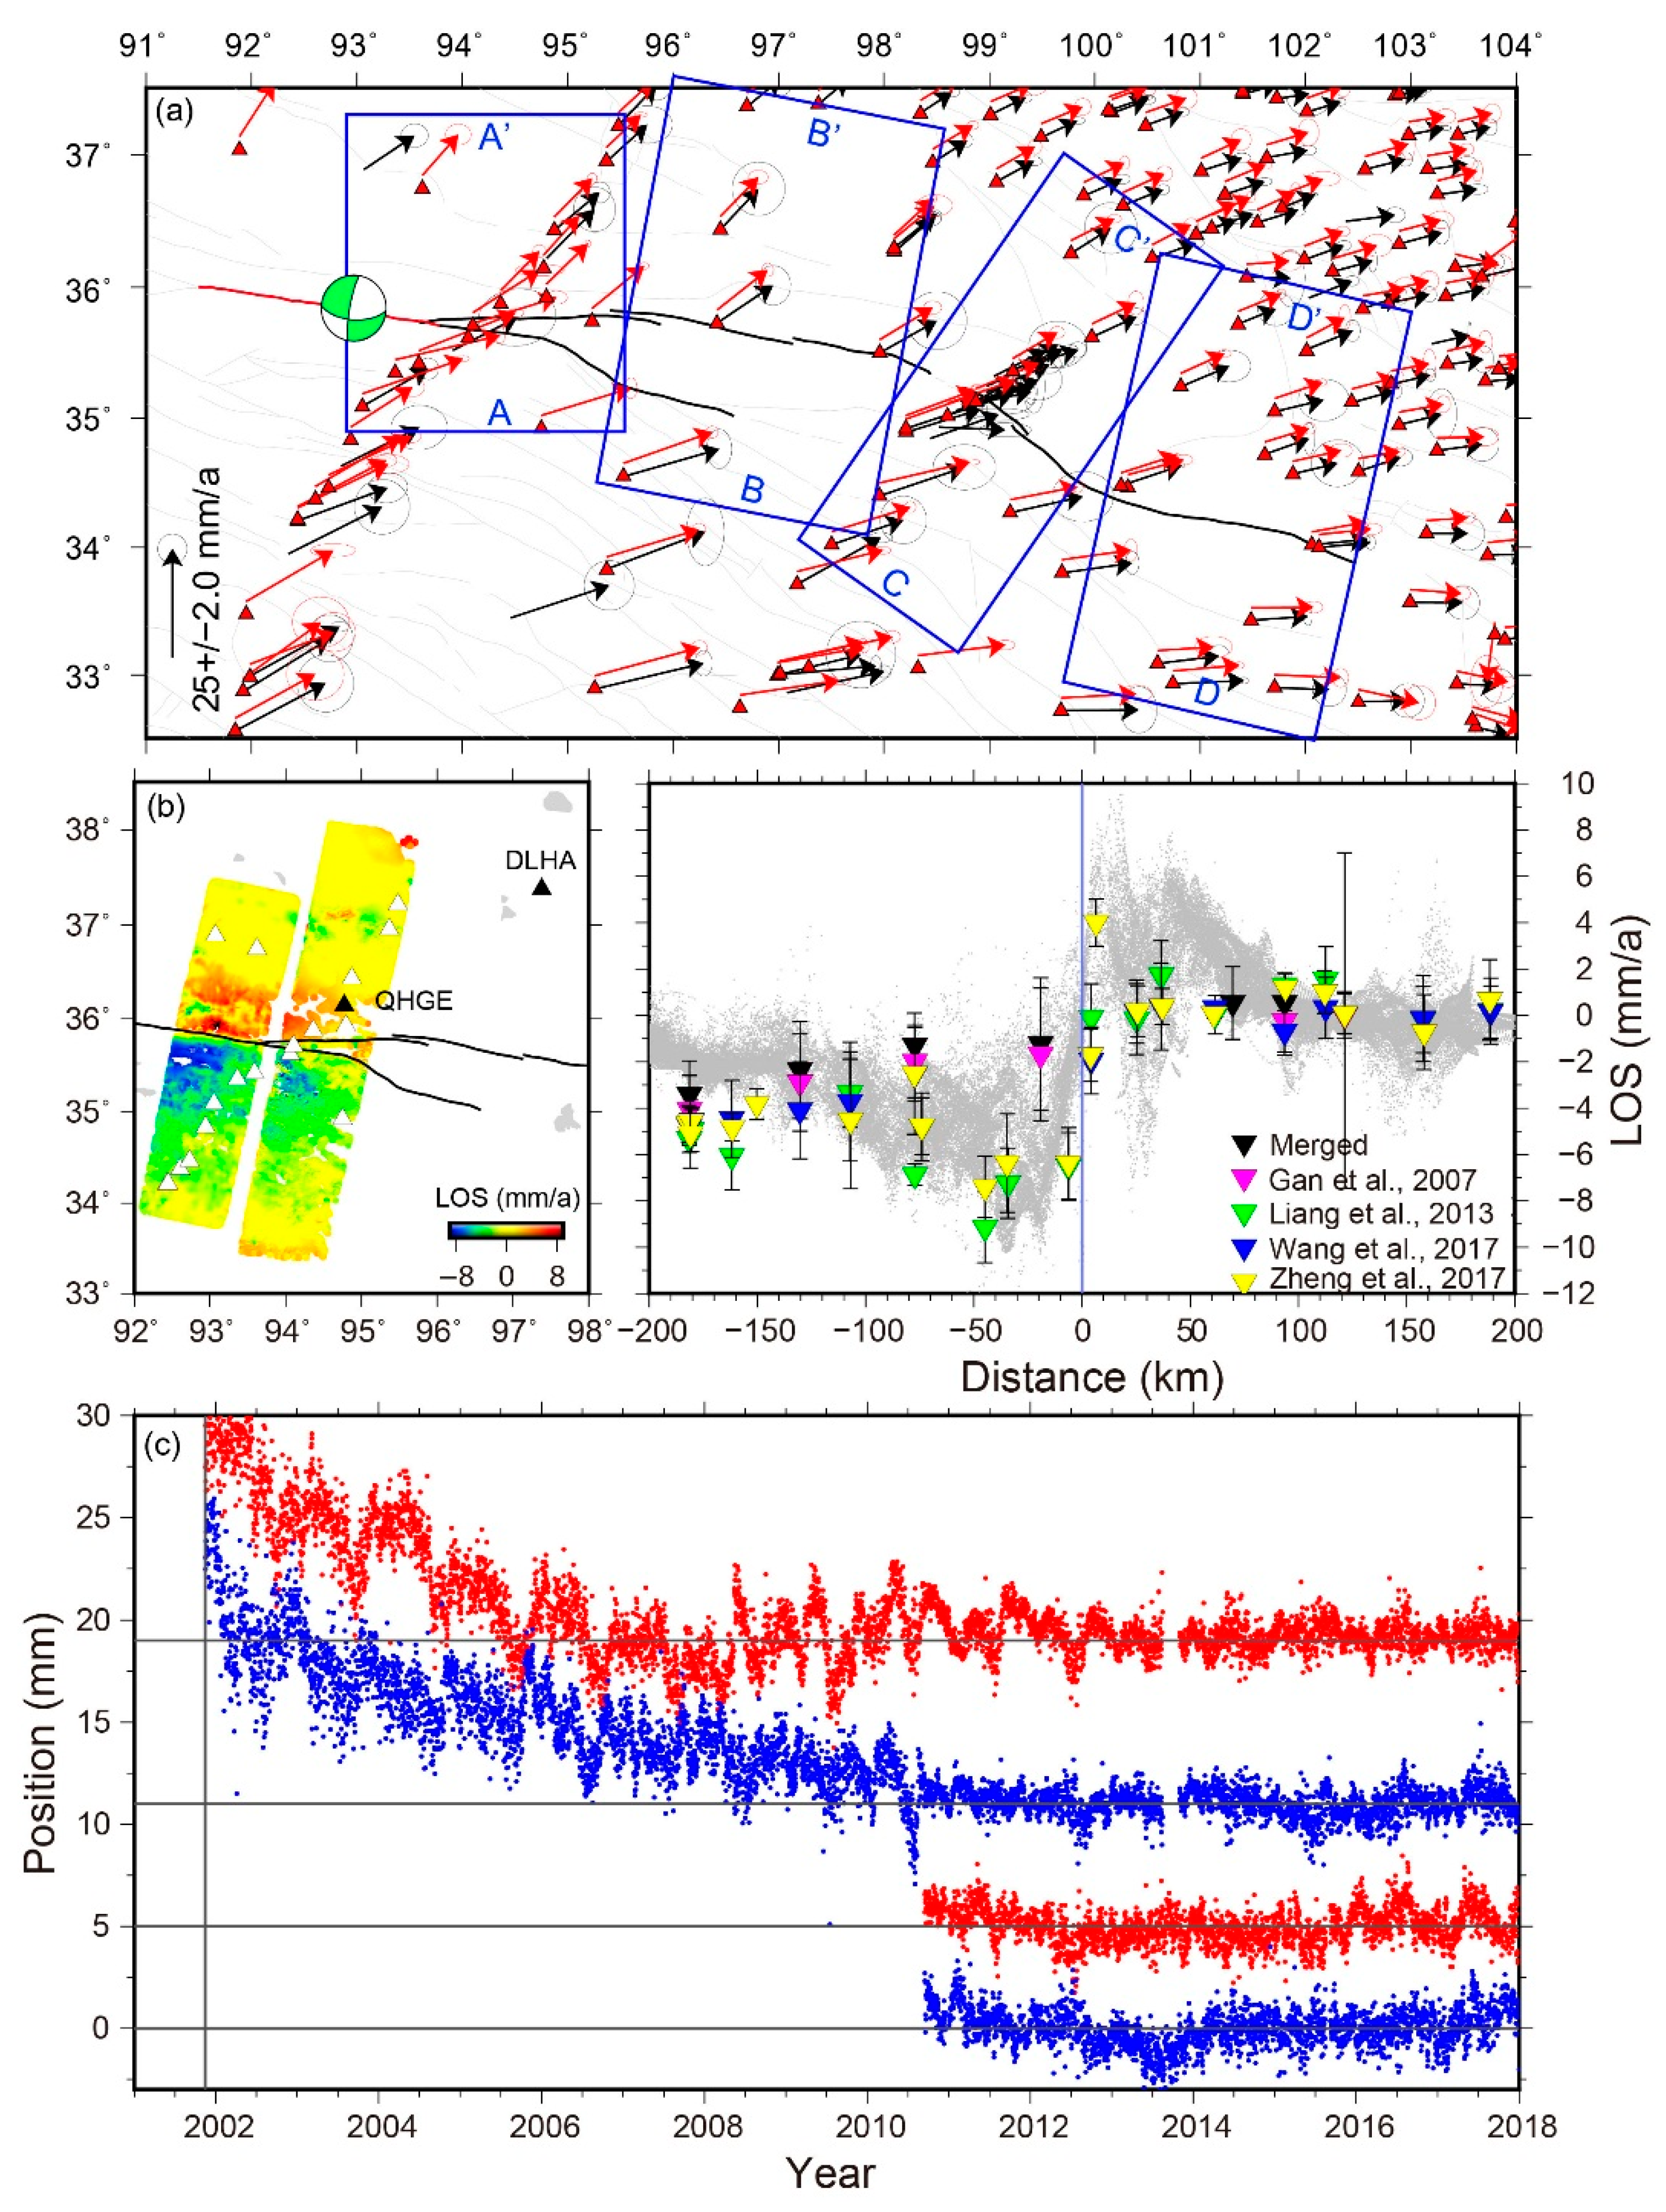
2.1. Geodetic Data
2.2. Strain Rate and Fault Dislocation Model
3. Results
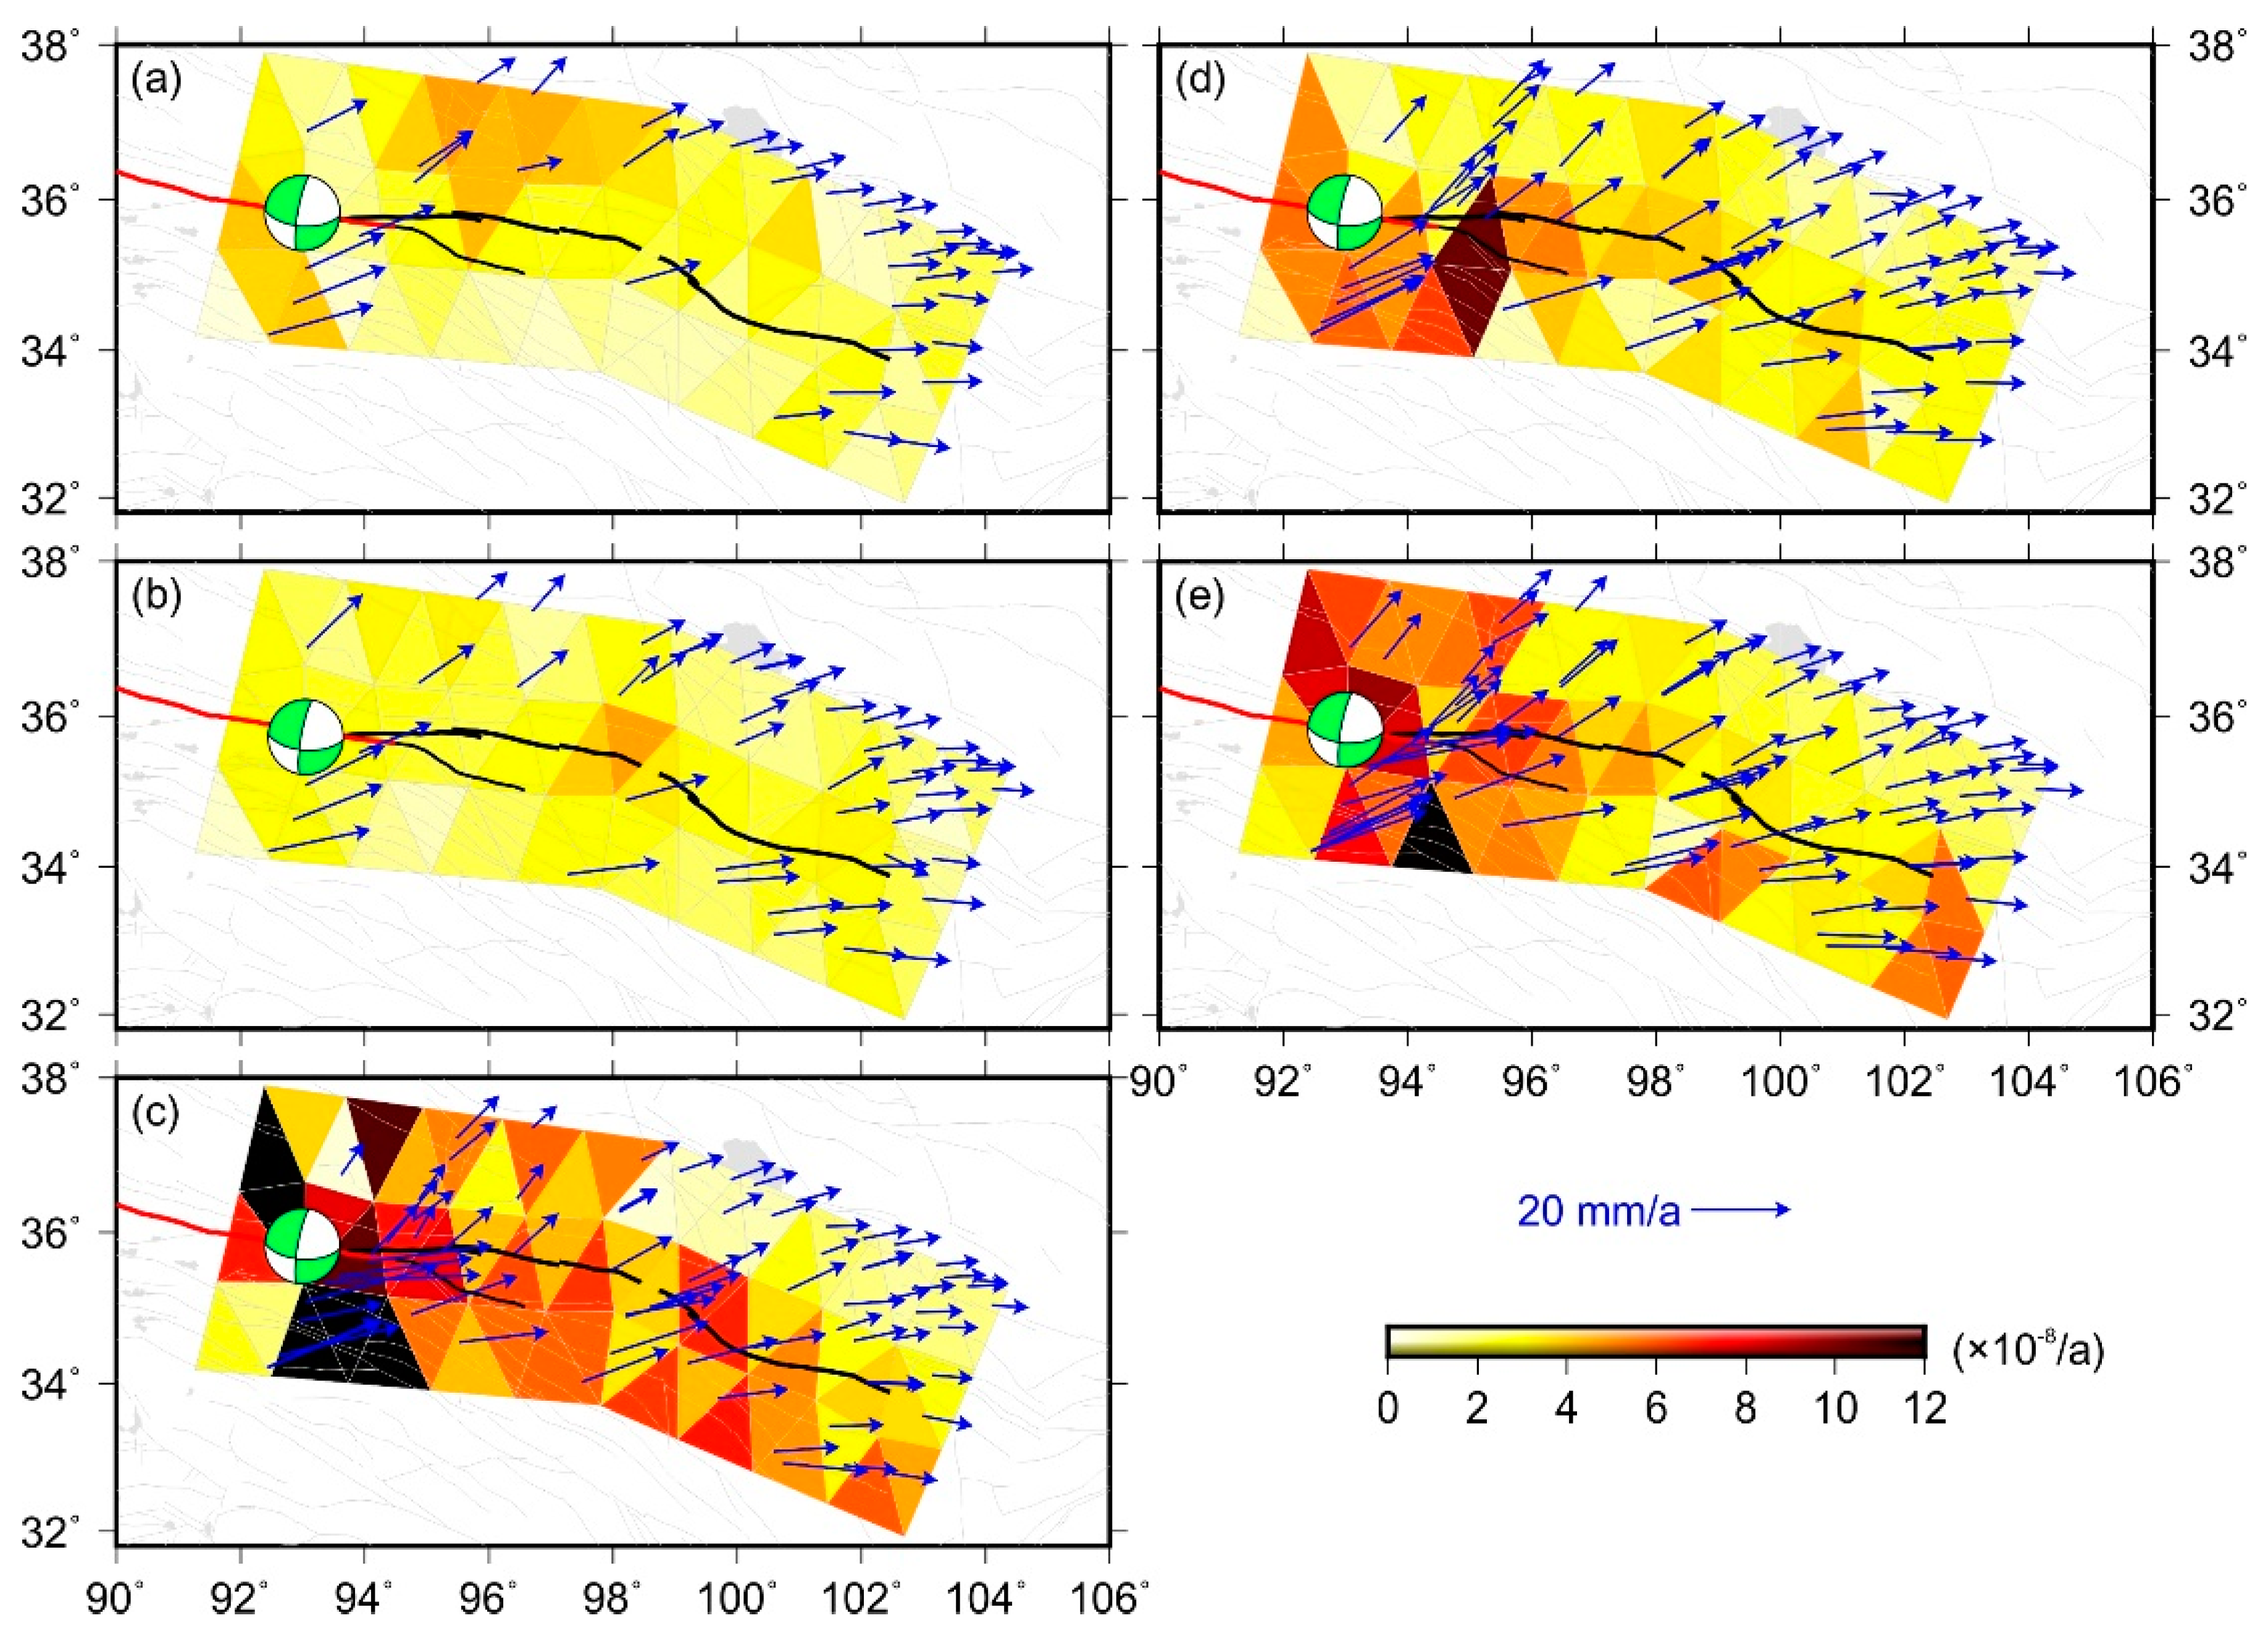
3.1. Strain Rate
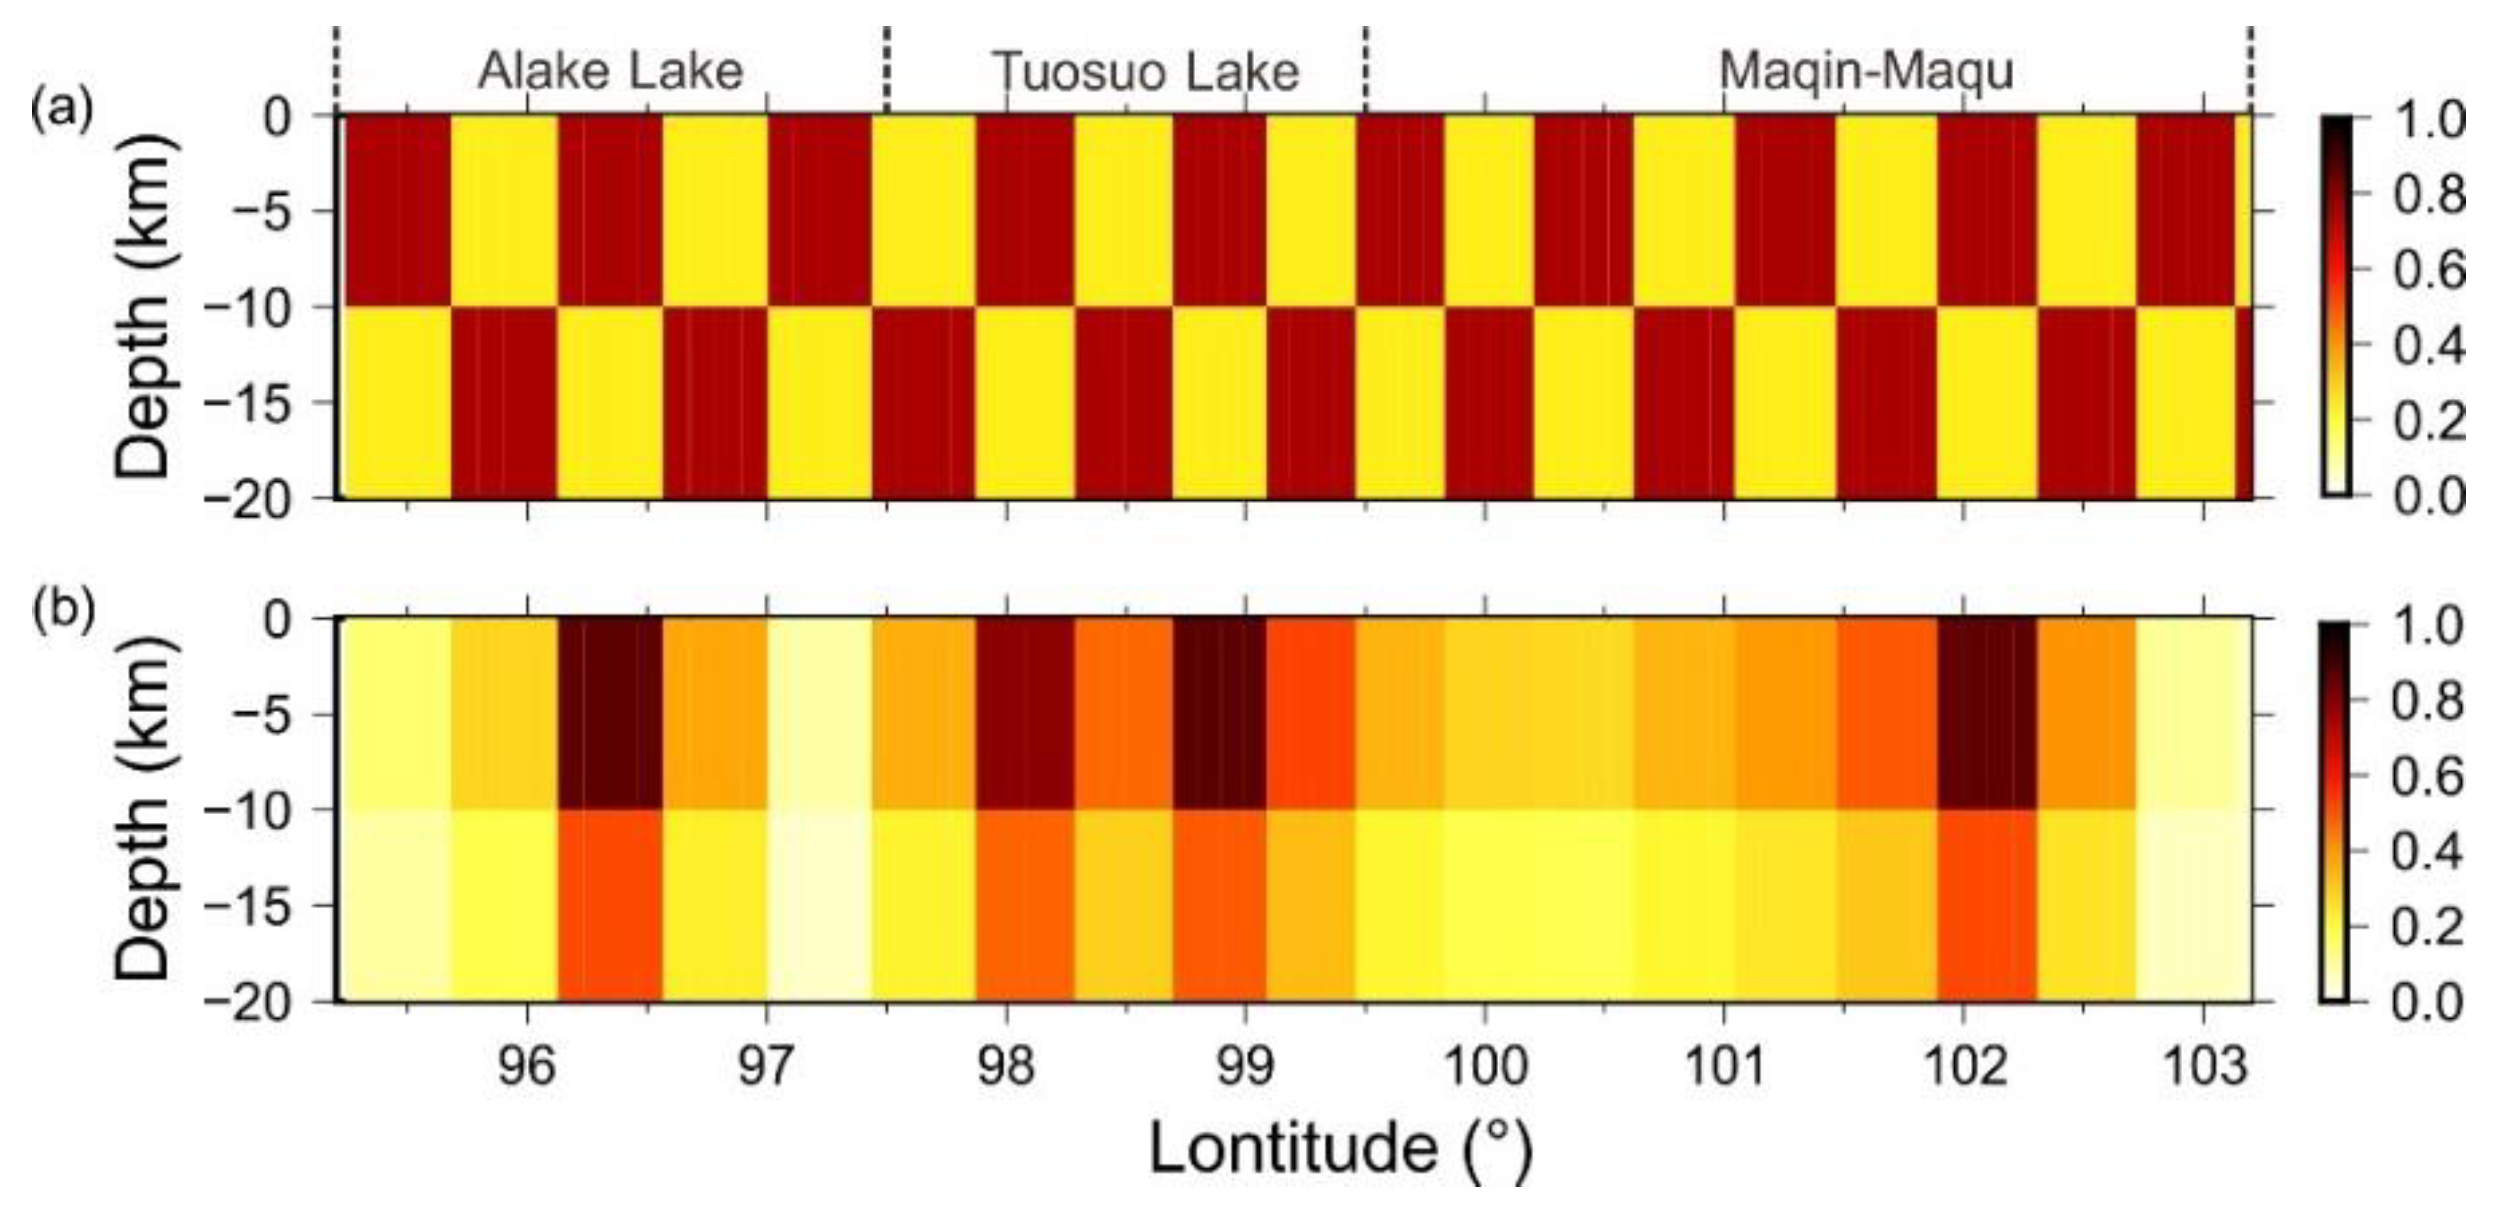
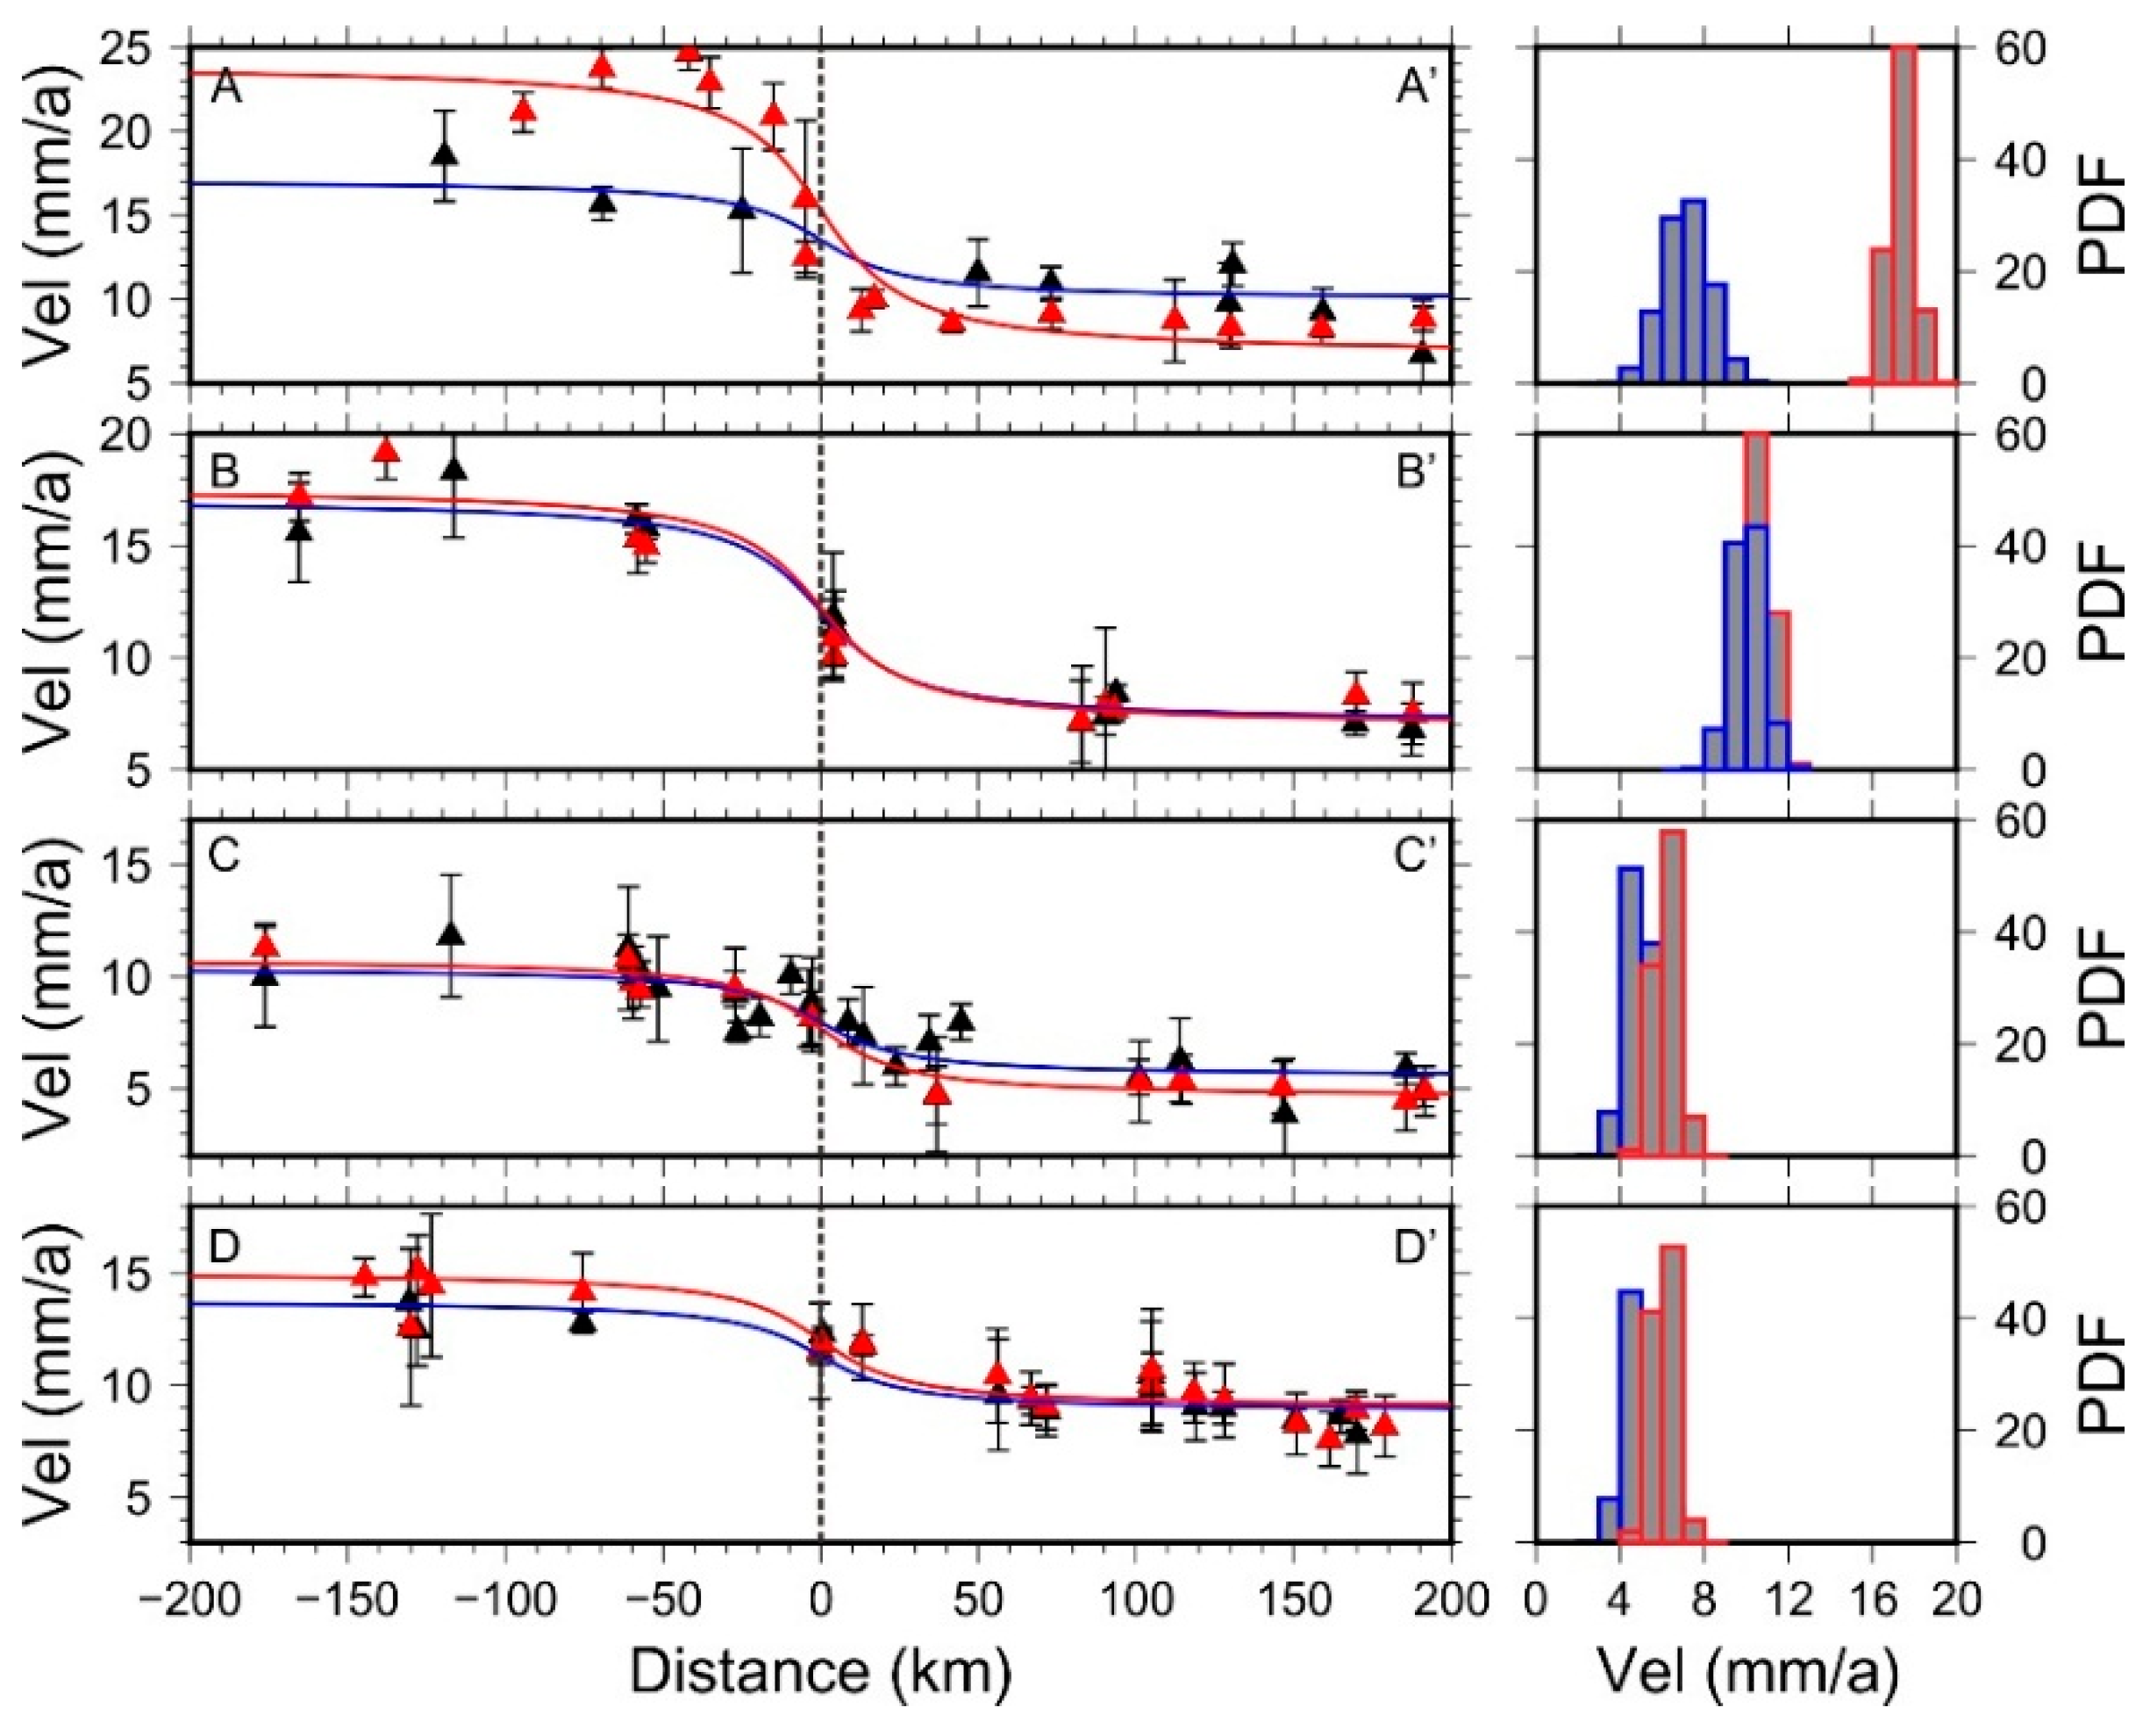
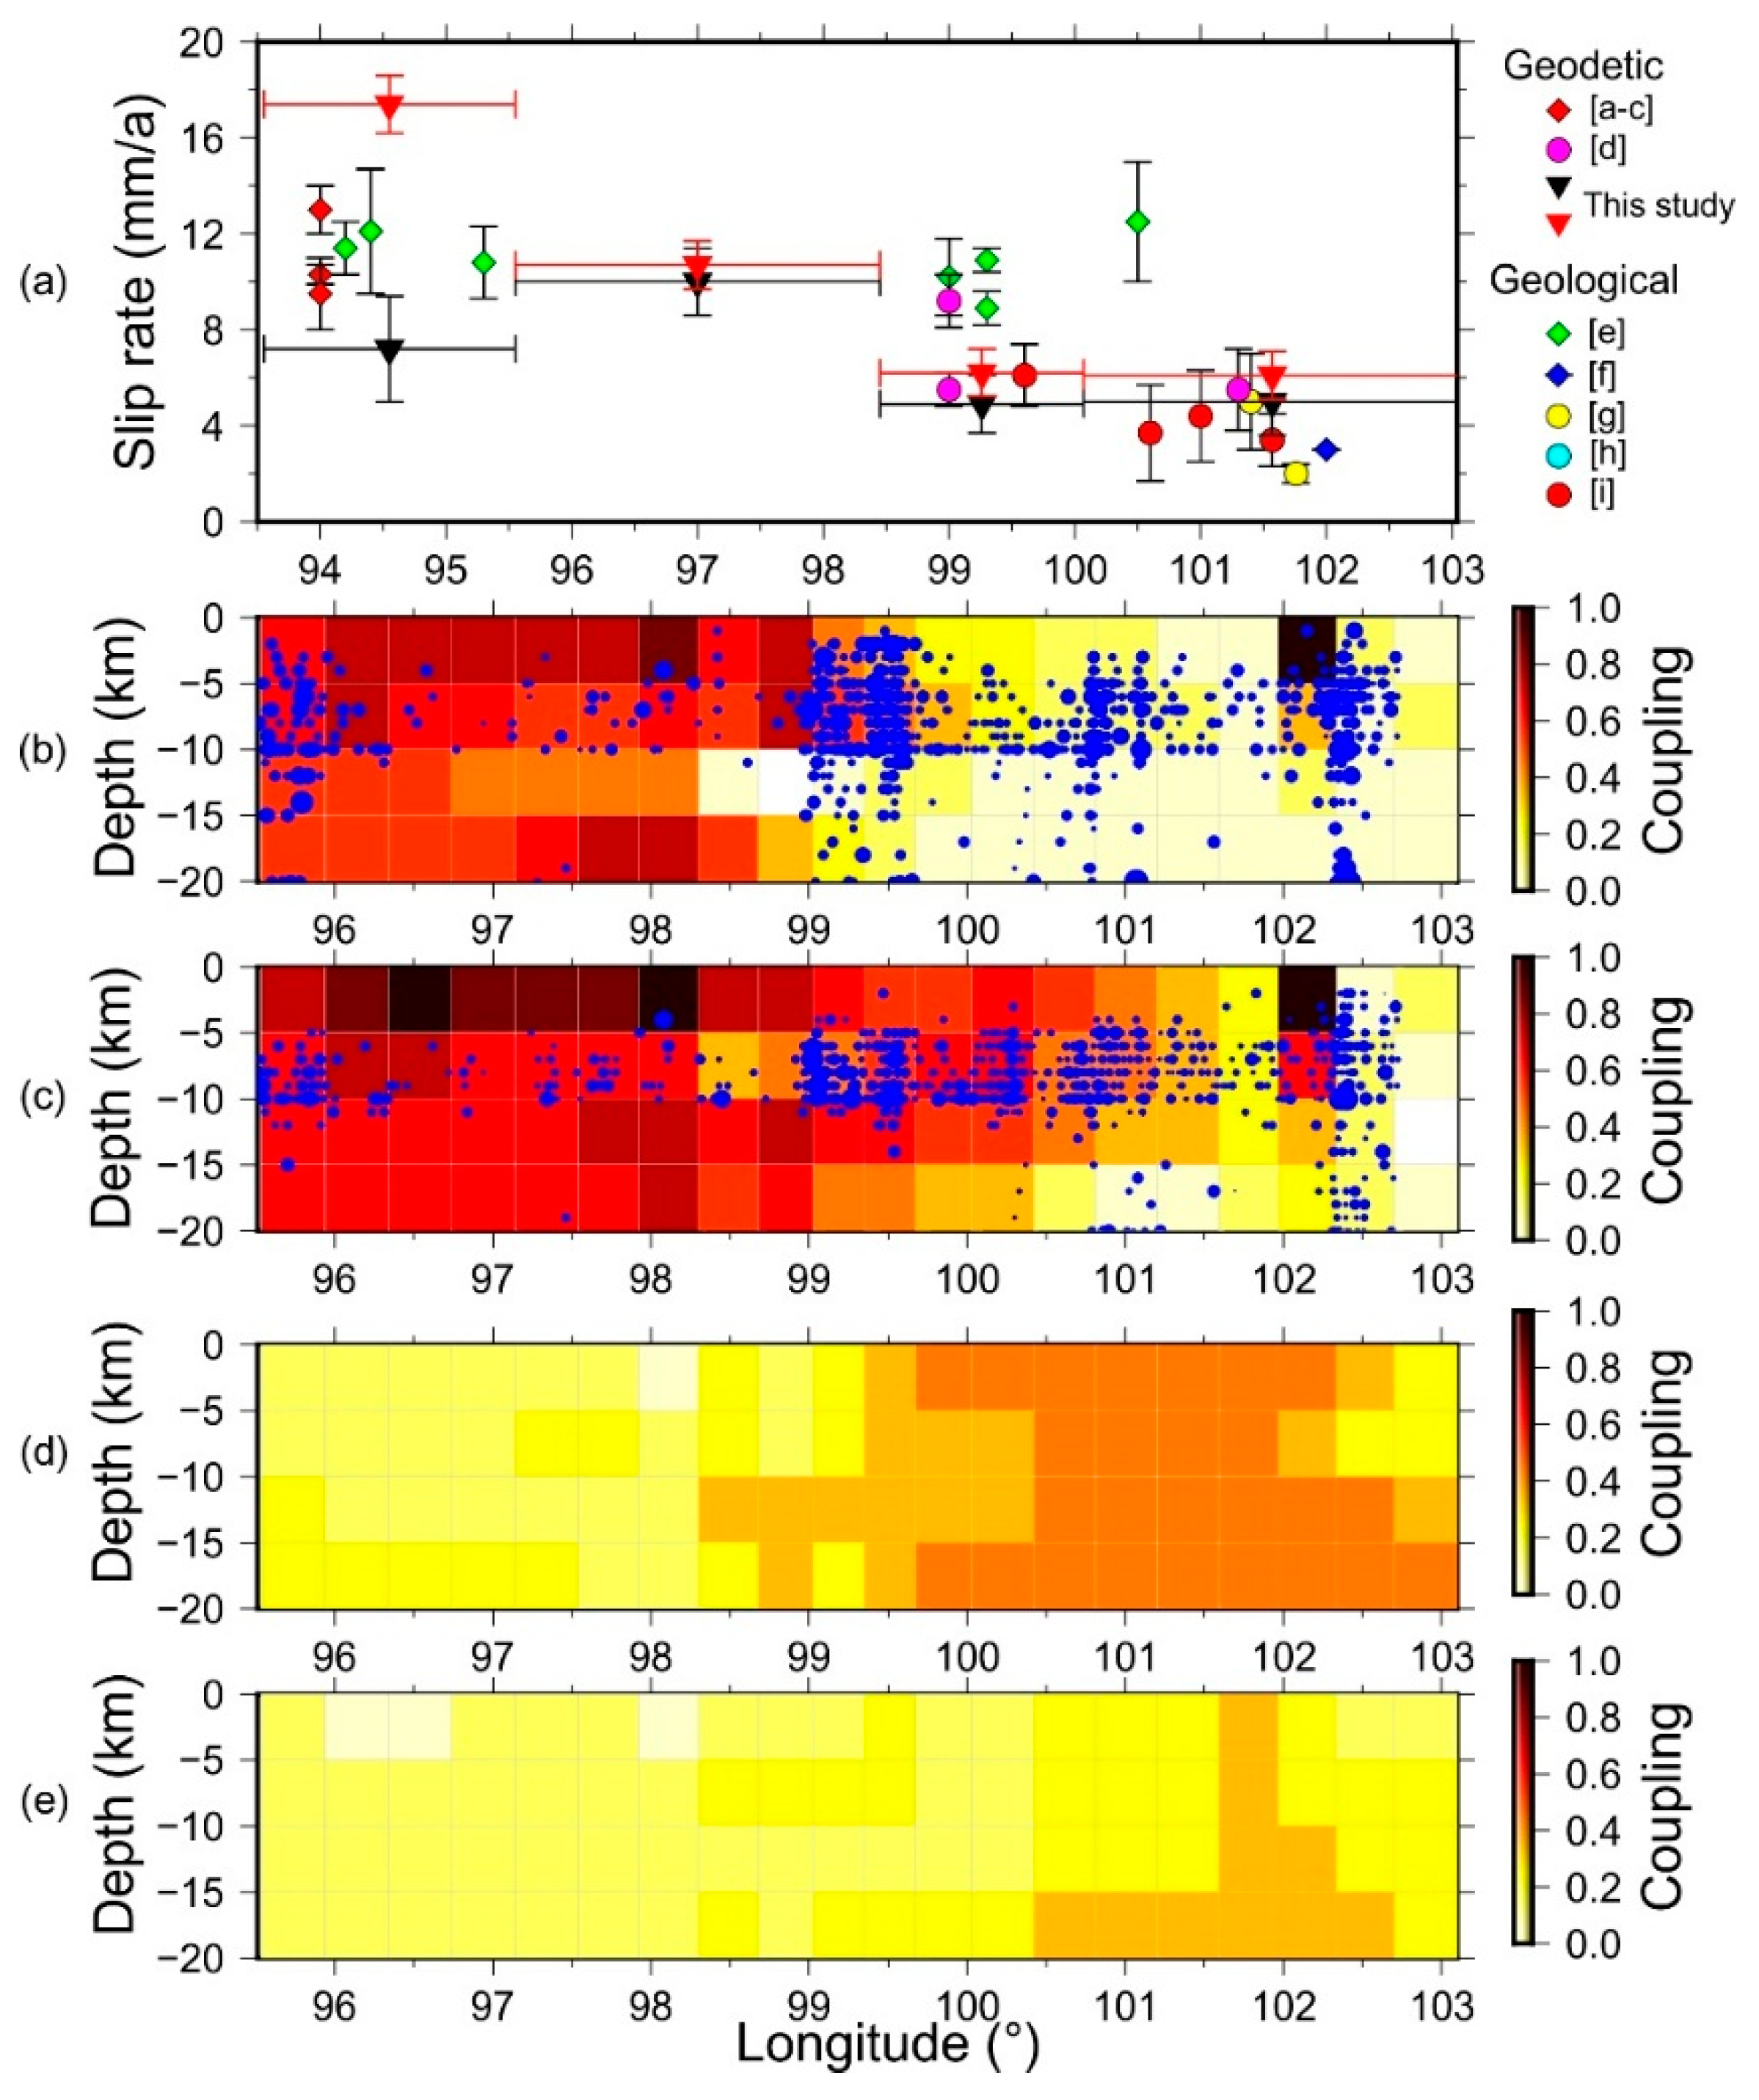
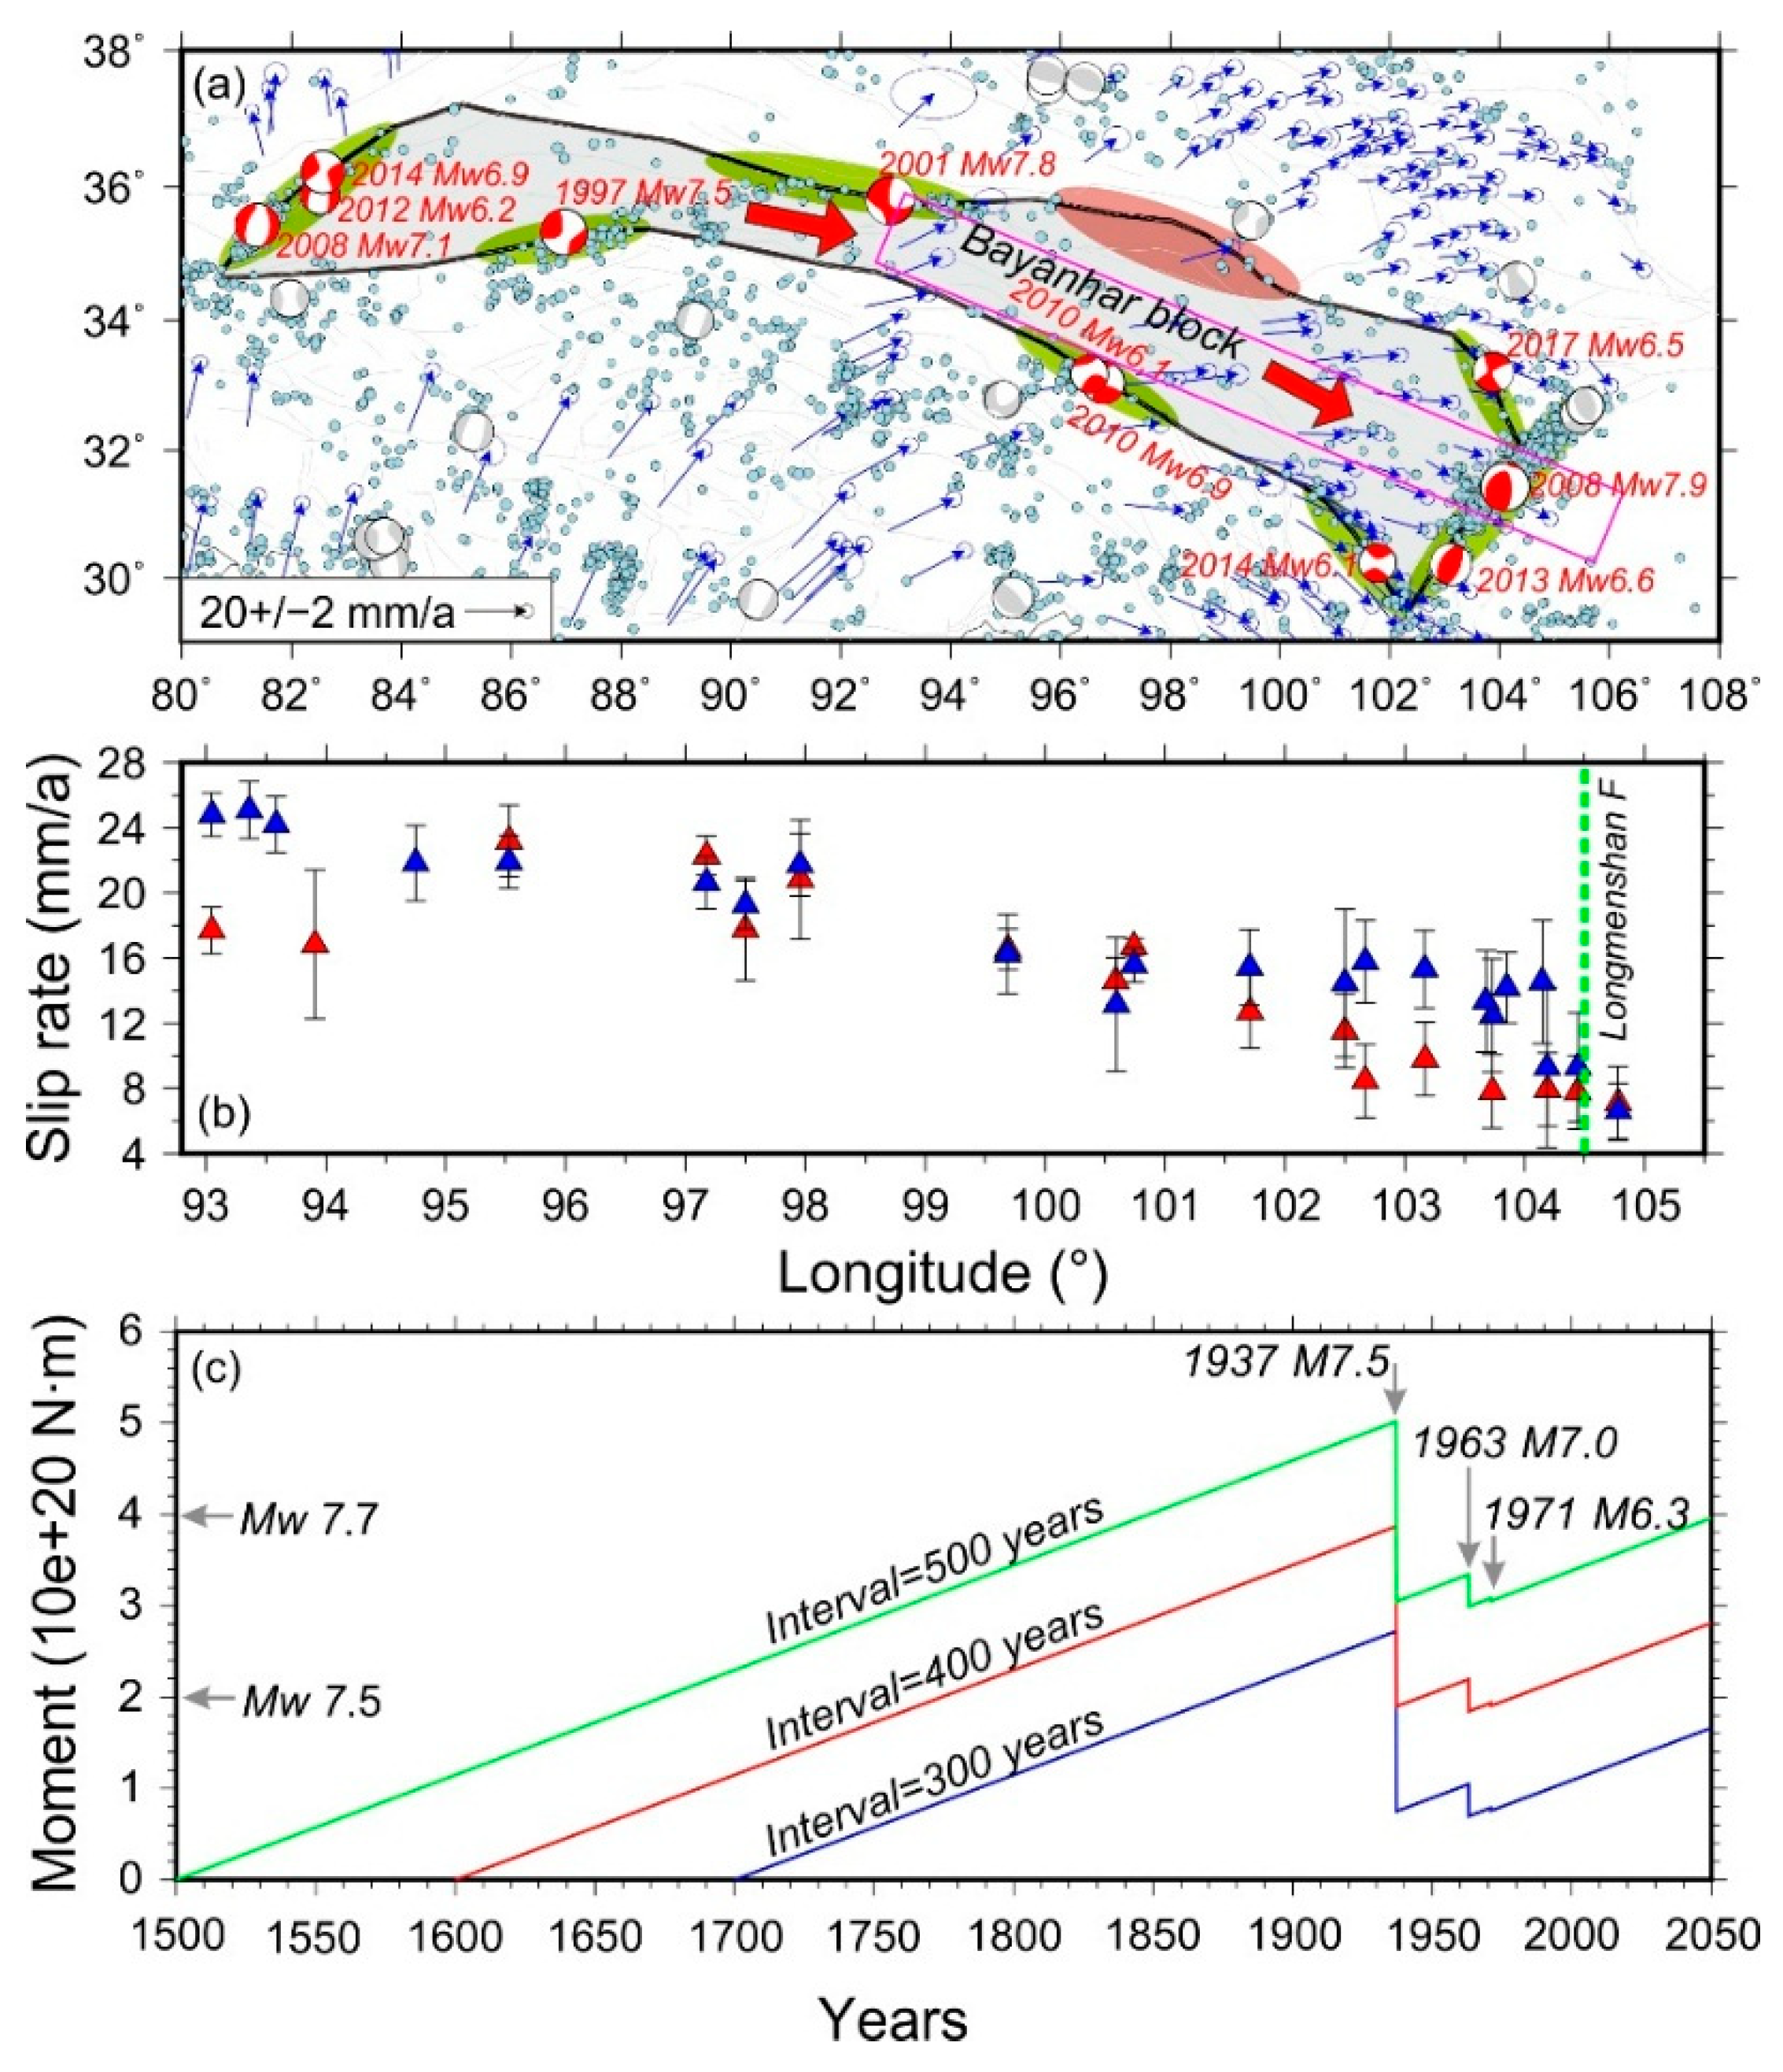
3.2. Slip Rate and Fault Coupling
5. Conclusions
Author Contributions
Funding
Acknowledgments
Conflicts of Interest
References
- Molnar, P.; Tapponnier, P. Cenozoic tectonics of Asia: Effects of a continental collision. Science 1975, 189, 419–426. [Google Scholar] [CrossRef] [PubMed]
- Rowley, D.B. Age of initiation of collision between India and Asia: A review of stratigraphic data. Earth Planet. Sci. Lett. 1996, 145, 1–13. [Google Scholar] [CrossRef]
- Avouac, J.P.; Tapponnier, P. Kinematic model of active deformation in central Asia. Geophys. Res. Lett. 1993, 20, 895–898. [Google Scholar] [CrossRef] [Green Version]
- Tapponnier, P.; Zhiqin, X.; Roger, F.; Meyer, B.; Arnaud, N.; Wittlinger, G.; **gsui, Y. Oblique stepwise rise and growth of the Tibet Plateau. Science 2001, 294, 1671–1677. [Google Scholar] [CrossRef] [PubMed]
- Wright, T.J.; Parsons, B.; England, P.C.; Fielding, E.J. InSAR observations of low slip rates on the major faults of western Tibet. Science 2004, 305, 236–239. [Google Scholar] [CrossRef] [PubMed]
- Thatcher, W. Microplate model for the present-day deformation of Tibet. J. Geophys. Res. 2007, 112, B01401. [Google Scholar] [CrossRef]
- Shen, Z.K.; Wang, M.; Li, Y.; Jackson, D.D.; Yin, A.; Dong, D.; Fang, P. Crustal deformation along the Altyn Tagh fault system, western China, from GPS. J. Geophys. Res. 2001, 106, 30607–30621. [Google Scholar] [CrossRef]
- Chen, Q.; Freymueller, J.T.; Wang, Q.; Yang, Z.; Xu, C.; Liu, J. A deforming block model for the present-day tectonics of Tibet. J. Geophys. Res. 2004, 109, B01403. [Google Scholar] [CrossRef]
- Gan, W.; Zhang, P.; Shen, Z.K.; Niu, Z.; Wang, M.; Wan, Y.; Zhou, D.; Cheng, J. Present-day crustal motion within the Tibetan Plateau inferred from GPS measurements. J. Geophys. Res. 2007, 112, B08416. [Google Scholar] [CrossRef]
- Garthwaite, M.C.; Wang, H.; Wright, T.J. Broadscale interseismic deformation and fault slip rates in the central Tibetan Plateau observed using InSAR. J. Geophys. Res. 2013, 118, 5071–5083. [Google Scholar] [CrossRef]
- Liang, S.; Gan, W.; Shen, C.; **ao, G.; Liu, J.; Chen, W.; Ding, X.; Zhou, D. Three-dimensional velocity field of present-day crustal motion of the Tibetan Plateau derived from GPS measurements. J. Geophys. Res. 2013, 118, 5722–5732. [Google Scholar] [CrossRef]
- Zheng, G.; Wang, H.; Wright, T.J.; Lou, Y.; Zhang, R.; Zhang, W.; Shi, C.; Huang, J.; Wei, N. Crustal deformation in the India-Eurasia collision zone from 25 years of GPS measurements. J. Geophys. Res. 2017, 122, 9290–9312. [Google Scholar] [CrossRef]
- Reigber, C.; Michel, G.W.; Galas, R.; Angermann, D.; Klotz, J.; Chen, J.Y.; Papschec, A.; Arslanov, R.; Tzurkov, V.E.; Ishanov, M.C. New space geodetic constraints on the distribution of deformation in Central Asia. Earth Planet. Sci. Lett. 2001, 191, 157–165. [Google Scholar] [CrossRef]
- Farolfi, G.; Del Ventisette, C. Monitoring the Earth’s ground surface movements using satellite observations: Geodinamics of the Italian peninsula determined by using GNSS networks. In Proceedings of the 2016 IEEE Metrology for Aerospace (MetroAeroSpace), Florence, Italy, 22–23 June 2016; pp. 479–483. [Google Scholar]
- Feng, W.; Samsonov, S.; Almeida, R.; Yassaghi, A.; Li, J.; Qiu, Q.; Li, P.; Zheng, W. Geodetic Constraints of the 2017 Mw 7.3 Sarpol Zahab, Iran Earthquake, and Its Implications on the Structure and Mechanics of the Northwest Zagros Thrust-Fold Belt. Geophys. Res. Lett. 2018, 45, 6853–6861. [Google Scholar] [CrossRef]
- Bilham, R.; Larson, K.; Freymueller, J. GPS measurements of present-day convergence across the Nepal Himalaya. Nature 1997, 386, 61–64. [Google Scholar] [CrossRef]
- Elliott, J.R.; Jolivet, R.; González, P.J.; Avouac, J.P.; Hollingsworth, J.; Searle, M.P.; Stevens, V.L. Himalayan megathrust geometry and relation to topography revealed by the Gorkha earthquake. Nat. Geosci. 2016, 9, 174–180. [Google Scholar] [CrossRef] [Green Version]
- Shen, Z.K.; Sun, J.; Zhang, P.; Wan, Y.; Wang, M.; Bürgmann, R.; Zeng, Y.; Gan, W.; Liao, H.; Wang, Q. Slip maxima at fault junctions and rupturing of barriers during the 2008 Wenchuan earthquake. Nat. Geosci. 2009, 2, 718–724. [Google Scholar] [CrossRef]
- Li, Y.; Zhang, G.; Shan, X.; Liu, Y.; Wu, Y.; Liang, H.; Qu, C.; Song, X. GPS-Derived Fault Coupling of the Longmenshan Fault Associated with the 2008 Mw 7.9 Wenchuan Earthquake and Its Tectonic Implications. Remote Sens. 2018, 10, 753. [Google Scholar] [CrossRef]
- Shen, Z.K.; Lü, J.; Wang, M.; Bürgmann, R. Contemporary crustal deformation around the southeast borderland of the Tibetan Plateau. J. Geophys. Res. 2005, 110, B11409. [Google Scholar] [CrossRef]
- Daout, S.; Doin, M.P.; Peltzer, G.; Lasserre, C.; Socquet, A.; Volat, M.; Sudhaus, H. Strain Partitioning and Present-Day Fault Kinematics in NW Tibet from Envisat SAR Interferometry. J. Geophys. Res. 2018, 123, 2462–2483. [Google Scholar] [CrossRef]
- Li, Y.; Shan, X.; Qu, C.; Liu, Y.; Han, N. Crustal Deformation of the Altyn Tagh Fault Based on GPS. J. Geophys. Res. 2018, 123, 10309–10322. [Google Scholar] [CrossRef]
- Van Der Woerd, J.; Tapponnier, P.; Ryerson, F.J.; Meriaux, A.S.; Meyer, B.; Gaudemer, Y.; Finkel, R.; Caffee, M.; Zhao, G.; Xu, Z. Uniform postglacial slip-rate along the central 600 km of the Kunlun Fault (Tibet), from 26Al, 10Be, and 14C dating of riser offsets, and climatic origin of the regional morphology. Geophys. J. Int. 2002, 148, 356–388. [Google Scholar] [CrossRef]
- Deng, Q.; Cheng, S.; Ma, J.; Du, P. Seismic activities and earthquake potential in the Tibetan Plateau. Chin. J. Geophys. 2014, 57, 2025–2042. [Google Scholar]
- Ryder, I.; Bürgmann, R.; Pollitz, F. Lower crustal relaxation beneath the Tibetan Plateau and Qaidam Basin following the 2001 Kokoxili earthquake. Geophys. J. Int. 2011, 187, 613–630. [Google Scholar] [CrossRef] [Green Version]
- Wen, Y.; Li, Z.; Xu, C.; Ryder, I.; Bürgmann, R. Postseismic motion after the 2001 Mw 7.8 Kokoxili earthquake in Tibet observed by InSAR time series. J. Geophys. Res. 2012, 117, B08405. [Google Scholar] [CrossRef]
- Huang, M.H.; Bürgmann, R.; Freed, A.M. Probing the lithospheric rheology across the eastern margin of the Tibetan Plateau. Earth Planet. Sci. Lett. 2014, 396, 88–96. [Google Scholar] [CrossRef]
- Diao, F.; Wang, R.; Wang, Y.; **ong, X.; Walter, T.R. Fault behavior and lower crustal rheology inferred from the first seven years of postseismic GPS data after the 2008 Wenchuan earthquake. Earth Planet. Sci. Lett. 2018, 495, 202–212. [Google Scholar] [CrossRef] [Green Version]
- Zhao, D.; Qu, C.; Shan, X.; Bürgmann, R.; Gong, W.; Zhang, G. Spatiotemporal Evolution of Postseismic Deformation Following the 2001 Mw7. 8 Kokoxili, China, Earthquake from 7 Years of Insar Observations. Remote Sens. 2018, 10, 1988. [Google Scholar] [CrossRef]
- Wang, Q.; Zhang, P.; Freymueller, J.; Bilham, R.; Larson, K.; Lai, X.; You, X.; Niu, Z.; Wu, J.; Li, Y.; et al. Present-day crustal deformation in China constrained by global positioning system measurements. Science 2001, 294, 574–577. [Google Scholar] [CrossRef]
- Chen, Z.H.; Burchfiel, B.C.; Liu, Y.; King, R.W.; Royden, L.H.; Tang, W.; Wang, E.; Zhao, J.; Zhang, X. Global Positioning System measurements from eastern Tibet and their implications for India/Eurasia intercontinental deformation. J. Geophys. Res. 2000, 105, 16215–16227. [Google Scholar] [CrossRef]
- Zhang, P.Z.; Shen, Z.K.; Wang, M.; Gan, W.; Bürgmann, R.; Molnar, P.; Wang, Q.; Niu, Z.; Sun, J.; Wu, J.; et al. Continuous deformation of the Tibetan Plateau from global positioning system data. Geology 2004, 32, 809–812. [Google Scholar] [CrossRef]
- Wang, W.; Qiao, X.; Yang, S.; Wang, D. Present-day velocity field and block kinematics of Tibetan Plateau from GPS measurements. Geophys. J. Int. 2017, 208, 1088–1102. [Google Scholar] [CrossRef]
- Xu, X.; Yu, G.; Klinger, Y.; Tapponnier, P.; Van Der Woerd, J. Reevaluation of surface rupture parameters and faulting segmentation of the 2001 Kunlunshan earthquake (Mw 7.8), northern Tibetan Plateau, China. J. Geophys. Res. 2006, 111, B05316. [Google Scholar]
- Toda, S.; Lin, J.; Meghraoui, M.; Stein, R.S. 12 May 2008 M = 7.9 Wenchuan, China, earthquake calculated to increase failure stress and seismicity rate on three major fault systems. Geophys. Res. Lett. 2008, 35, L17305. [Google Scholar] [CrossRef]
- **ong, X.; Shan, B.; Zheng, Y.; Wang, R. Stress transfer and its implication for earthquake hazard on the Kunlun Fault, Tibet. Tectonophysics 2010, 482, 216–225. [Google Scholar] [CrossRef] [Green Version]
- Bürgmann, R.; Schmidt, D.; Nadeau, R.M.; d’Alessio, M.; Fielding, E.; Manaker, D.; McEvilly, T.V.; Murray, M.H. Earthquake potential along the northern Hayward fault, California. Science 2000, 289, 1178–1182. [Google Scholar] [CrossRef]
- Li, Q.; Tan, K.; Zhao, B.; Zhang, C.; Lu, X.; Wang, D.; Yu, J. Slip rate change of East Kunlun fault and its stress effect on 2017 Jiuzhaigou earthquake. Chin. J. Geophys. 2019, 62, 912–922. [Google Scholar]
- Zhu, L.; Ji, L.; Jiang, F. Variations in Locking Along the East Kunlun Fault, Tibetan Plateau, China, Using GPS and Leveling Data. Pure Appl. Geophys. 2019, 1–17. [Google Scholar] [CrossRef]
- McCaffrey, R.; Qamar, A.I.; King, R.W.; Wells, R.; Khazaradze, G.; Williams, C.A.; Stevens, C.A.; Vollick, J.J.; Zwick, P.C. Fault locking, block rotation and crustal deformation in the Pacific Northwest. Geophys. J. Int. 2007, 169, 1315–1340. [Google Scholar] [CrossRef] [Green Version]
- Ge, M.; Gendt, G.; Dick, G.; Zhang, F.P.; Rothacher, M. A new data processing strategy for huge GNSS global networks. J. Geodesy 2016, 80, 199–203. [Google Scholar] [CrossRef]
- Diao, F.; **ong, X.; Wang, R.; Walter, T.R.; Wang, Y.; Wang, K. Slip rate variation along the Kunlun Fault (Tibet): Results from new GPS observations and a viscoelastic earthquake-cycle deformation model. Geophys. Res. Lett. 2019, 46, 2524–2533. [Google Scholar] [CrossRef]
- Herring, T.A.; King, R.W.; Floyd, M.A.; McCluskey, S.C. Introduction to GAMIT/GLOBK, Release 10.6; Massachusetts Institue of Technology: Cambridge, MA, USA, 2016. [Google Scholar]
- Altamimi, Z.; Collilieux, X.; Métivier, L. ITRF2008: An improved solution of the international terrestrial reference frame. J. Geodesy 2011, 85, 457–473. [Google Scholar] [CrossRef]
- Nikolaidis, R. Observation of Geodetic and Seismic Deformation with the Global Positioning System. Ph.D. Thesis, University of California, San Diego, CA, USA, 2004. [Google Scholar]
- Savage, J.C.; Gan, W.; Svarc, J.L. Strain accumulation and rotation in the Eastern California Shear Zone. J. Geophys. Res. 2001, 106, 21995–22007. [Google Scholar] [CrossRef]
- Wang, H.; Wright, T.J. Satellite geodetic imaging reveals internal deformation of western Tibet. Geophys. Res. Lett. 2012, 39, L07303. [Google Scholar] [CrossRef]
- Okada, Y. Surface deformation due to shear and tensile faults in a half-space. Bull. Seismol. Soc. Am. 1985, 75, 1135–1154. [Google Scholar]
- Savage, J.C. A dislocation model of strain accumulation and release at a subduction zone. J. Geophys. Res. 1983, 88, 4984–4996. [Google Scholar] [CrossRef]
- Savage, J.C.; Burford, R.O. Geodetic determination of relative plate motion in central California. J. Geophys. Res. 1973, 78, 832–845. [Google Scholar] [CrossRef] [Green Version]
- Minson, S.E.; Simons, M.; Beck, J.L. Bayesian inversion for finite fault earthquake source models I—Theory and algorithm. Geophys. J. Int. 2013, 194, 1701–1726. [Google Scholar] [CrossRef]
- Lasserre, C.; Peltzer, G.; Crampé, F.; Klinger, Y.; Van Der Woerd, J.; Tapponnier, P. Coseismic deformation of the 2001 Mw = 7.8 Kokoxili earthquake in Tibet, measured by synthetic aperture radar interferometry. J. Geophys. Res. 2005, 110, B12408. [Google Scholar] [CrossRef]
- Amey, R.M.J.; Hooper, A.; Walters, R.J. A Bayesian Method for Incorporating Self-Similarity into Earthquake Slip Inversions. J. Geophys. Res. 2018, 123, 6052–6071. [Google Scholar] [CrossRef]
- Jolivet, R.; Lasserre, C.; Doin, M.P.; Peltzer, G.; Avouac, J.P.; Sun, J.; Dailu, R. Spatio-temporal evolution of aseismic slip along the Haiyuan fault, China: Implications for fault frictional properties. Earth Planet. Sci. Lett. 2013, 377, 23–33. [Google Scholar] [CrossRef]
- Kirby, E.; Harkins, N.; Wang, E.; Shi, X.; Fan, C.; Burbank, D. Slip rate gradients along the eastern Kunlun fault. Tectonics 2007, 26, TC2010. [Google Scholar] [CrossRef]
- Harkins, N.; Kirby, E. Fluvial terrace riser degradation and determination of slip rates on strike-slip faults: An example from the Kunlun fault, China. Geophys. Res. Lett. 2008, 35, L05406. [Google Scholar] [CrossRef]
- Lin, A.; Guo, J. Nonuniform slip rate and millennial recurrence interval of large earthquakes along the eastern segment of the Kunlun fault, northern Tibet. Bull. Seismol. Soc. Am. 2008, 98, 2866–2878. [Google Scholar] [CrossRef]
- Harkins, N.; Kirby, E.; Shi, X.; Wang, E.; Burbank, D.; Chun, F. Millennial slip rates along the eastern Kunlun fault: Implications for the dynamics of intracontinental deformation in Asia. Lithosphere 2010, 2, 247–266. [Google Scholar] [CrossRef] [Green Version]
- Thatcher, W. Nonlinear strain buildup and the earthquake cycle on the San Andreas Fault. J. Geophys. Res. 1983, 88, 5893–5902. [Google Scholar] [CrossRef] [Green Version]
- Liu, S.; Shen, Z.K.; Bürgmann, R. Recovery of secular deformation field of Mojave Shear Zone in Southern California from historical terrestrial and GPS measurements. J. Geophys. Res. 2015, 120, 3965–3990. [Google Scholar] [CrossRef]
- Shen, Z.K.; Zeng, Y.; Wang, M.; Wang, Q.; Wang, Q.L.; Wan, Y.; Gan, W.; Zhang, Z. Postseismic deformation modeling of the 2001 Kokoxili earthquake, western China. In Proceedings of the EGS-AGU-EUG Joint Assembly, Nice, France, 6–11 April 2003. [Google Scholar]
- Ren, J.; Wang, M. GPS measured crustal deformation of the Ms 8.1 Kunlun earthquake on November 14th, 2001 in Qinghai-**zang plateau. Quat. Sci. 2005, 25, 34–44. [Google Scholar]
- Meade, B.J.; Hager, B.H. Block models of crustal motion in southern California constrained by GPS measurements. J. Geophys. Res. 2005, 110, B03403. [Google Scholar] [CrossRef]
- Van Der Woerd, J.; Ryerson, F.J.; Tapponnier, P.; Gaudemer, Y.; Finkel, R.; Mériaux, A.S.; Caffee, M.; Zhao, G.; He, Q. Holocene left-slip rate determined by cosmogenic surface dating on the **datan segment of the Kunlun fault (Qinghai, China). Geology 1998, 26, 695–698. [Google Scholar] [CrossRef]
- Stevens, V.L.; Avouac, J.P. Interseismic coupling on the main Himalayan thrust. Geophys. Res. Lett. 2015, 42, 5828–5837. [Google Scholar] [CrossRef] [Green Version]
- Stein, R.S.; Barka, A.A.; Dieterich, J.H. Progressive failure on the North Anatolian fault since 1939 by earthquake stress triggering. Geophys. J. Int. 1997, 128, 594–604. [Google Scholar] [CrossRef] [Green Version]
- Li, H.; Van der Woerd, J.; Tapponnier, P.; Klinger, Y.; Xuexiang, Q.; **gsui, Y.; Yintang, Z. Slip rate on the Kunlun fault at Hongshui Gou, and recurrence time of great events comparable to the 14/11/2001, Mw~7.9 Kokoxili earthquake. Earth Planet. Sci. Lett. 2005, 237, 285–299. [Google Scholar]


© 2019 by the authors. Licensee MDPI, Basel, Switzerland. This article is an open access article distributed under the terms and conditions of the Creative Commons Attribution (CC BY) license (http://creativecommons.org/licenses/by/4.0/).
Share and Cite
Li, Y.; Shan, X.; Qu, C. Geodetic Constraints on the Crustal Deformation along the Kunlun Fault and Its Tectonic Implications. Remote Sens. 2019, 11, 1775. https://doi.org/10.3390/rs11151775
Li Y, Shan X, Qu C. Geodetic Constraints on the Crustal Deformation along the Kunlun Fault and Its Tectonic Implications. Remote Sensing. 2019; 11(15):1775. https://doi.org/10.3390/rs11151775
Chicago/Turabian StyleLi, Yanchuan, **njian Shan, and Chunyan Qu. 2019. "Geodetic Constraints on the Crustal Deformation along the Kunlun Fault and Its Tectonic Implications" Remote Sensing 11, no. 15: 1775. https://doi.org/10.3390/rs11151775