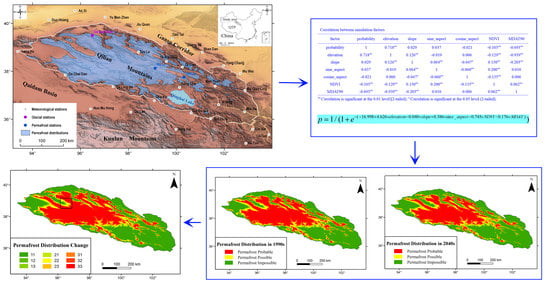
The data source used in this research includes a bench-mark map of the mountain permafrost distribution in the Qilian Mountains, topographic parameters, land coverage factors and MDAT data.
3.1.2. Topographic Parameters
Topographic parameters include elevation, slope, and the sine and cosine values of the aspect.
Elevation reflects the roughness and height degree of the ground surface [
22], which is the main factor affecting the distribution of mountain permafrost, because elevation has an important effect on the distribution of natural environment conditions, such as climate and vegetation [
23]. In this research, the elevation data are acquired by processing Shuttle Radar Topographic Mission data with 3-arc seconds spatial resolution. In spatial processing, the elevation data have a spatial resolution of 0.001° and geographic projection, which are the same for other factors. In the final elevation data, the highest, lowest and average elevations in the Qilian Mountains are 5763 m asl, 1576 m asl and 3586 m asl respectively.
Slope reflects the oblique degree of the ground surface, which can determine the scale and intensity of the flow and energy transformation of ground materials [
24,
25]. Slope factor is acquired based on elevation data through spatial calculation. In the Qilian Mountains, the value range and mean value of the slope data are 0–69.3° and 12.1°, respectively.
Aspect can result in a difference in solar radiation energy, so it can affect the lower limit of the mountain permafrost distribution. Aspect is an important factor for many mountain permafrost simulation models [
12,
22,
26]. Based on elevation data, aspect is computed through spatial calculation. The values of the aspect are circular data ranging from 0–360°, so it is difficult to directly use them in the simulation model. To solve this problem, the sine and cosine values of the aspect are computed.
3.1.3. Land Coverage Factor
The land coverage factor is used to present the distribution status of the ground surface. In this research, it is represented by the Normalized Difference Vegetation Index (NDVI), which is used to monitor the coverage degree and growth status of ground vegetation through band computation of remote sensing images [
27]. The value range of NDVI is from −1 to 1. Negative values indicate that the ground coverage is cloud, water or snow, etc.; 0 represents rock or exposed soil; and positive values indicate that the ground is covered by vegetation; these values increase with the increase of the vegetation coverage.
The NDVI data are acquired by processing the 1km AVHRR Global Land Dataset, and the acquisition time is August, 1995. Through spatial processing, the final NDVI data have the same resolution and projection as other factors. In the final NDVI data, the value range is from −0.99 to 0.80, which represents the different land coverage statuses.
3.1.4. MDAT Data
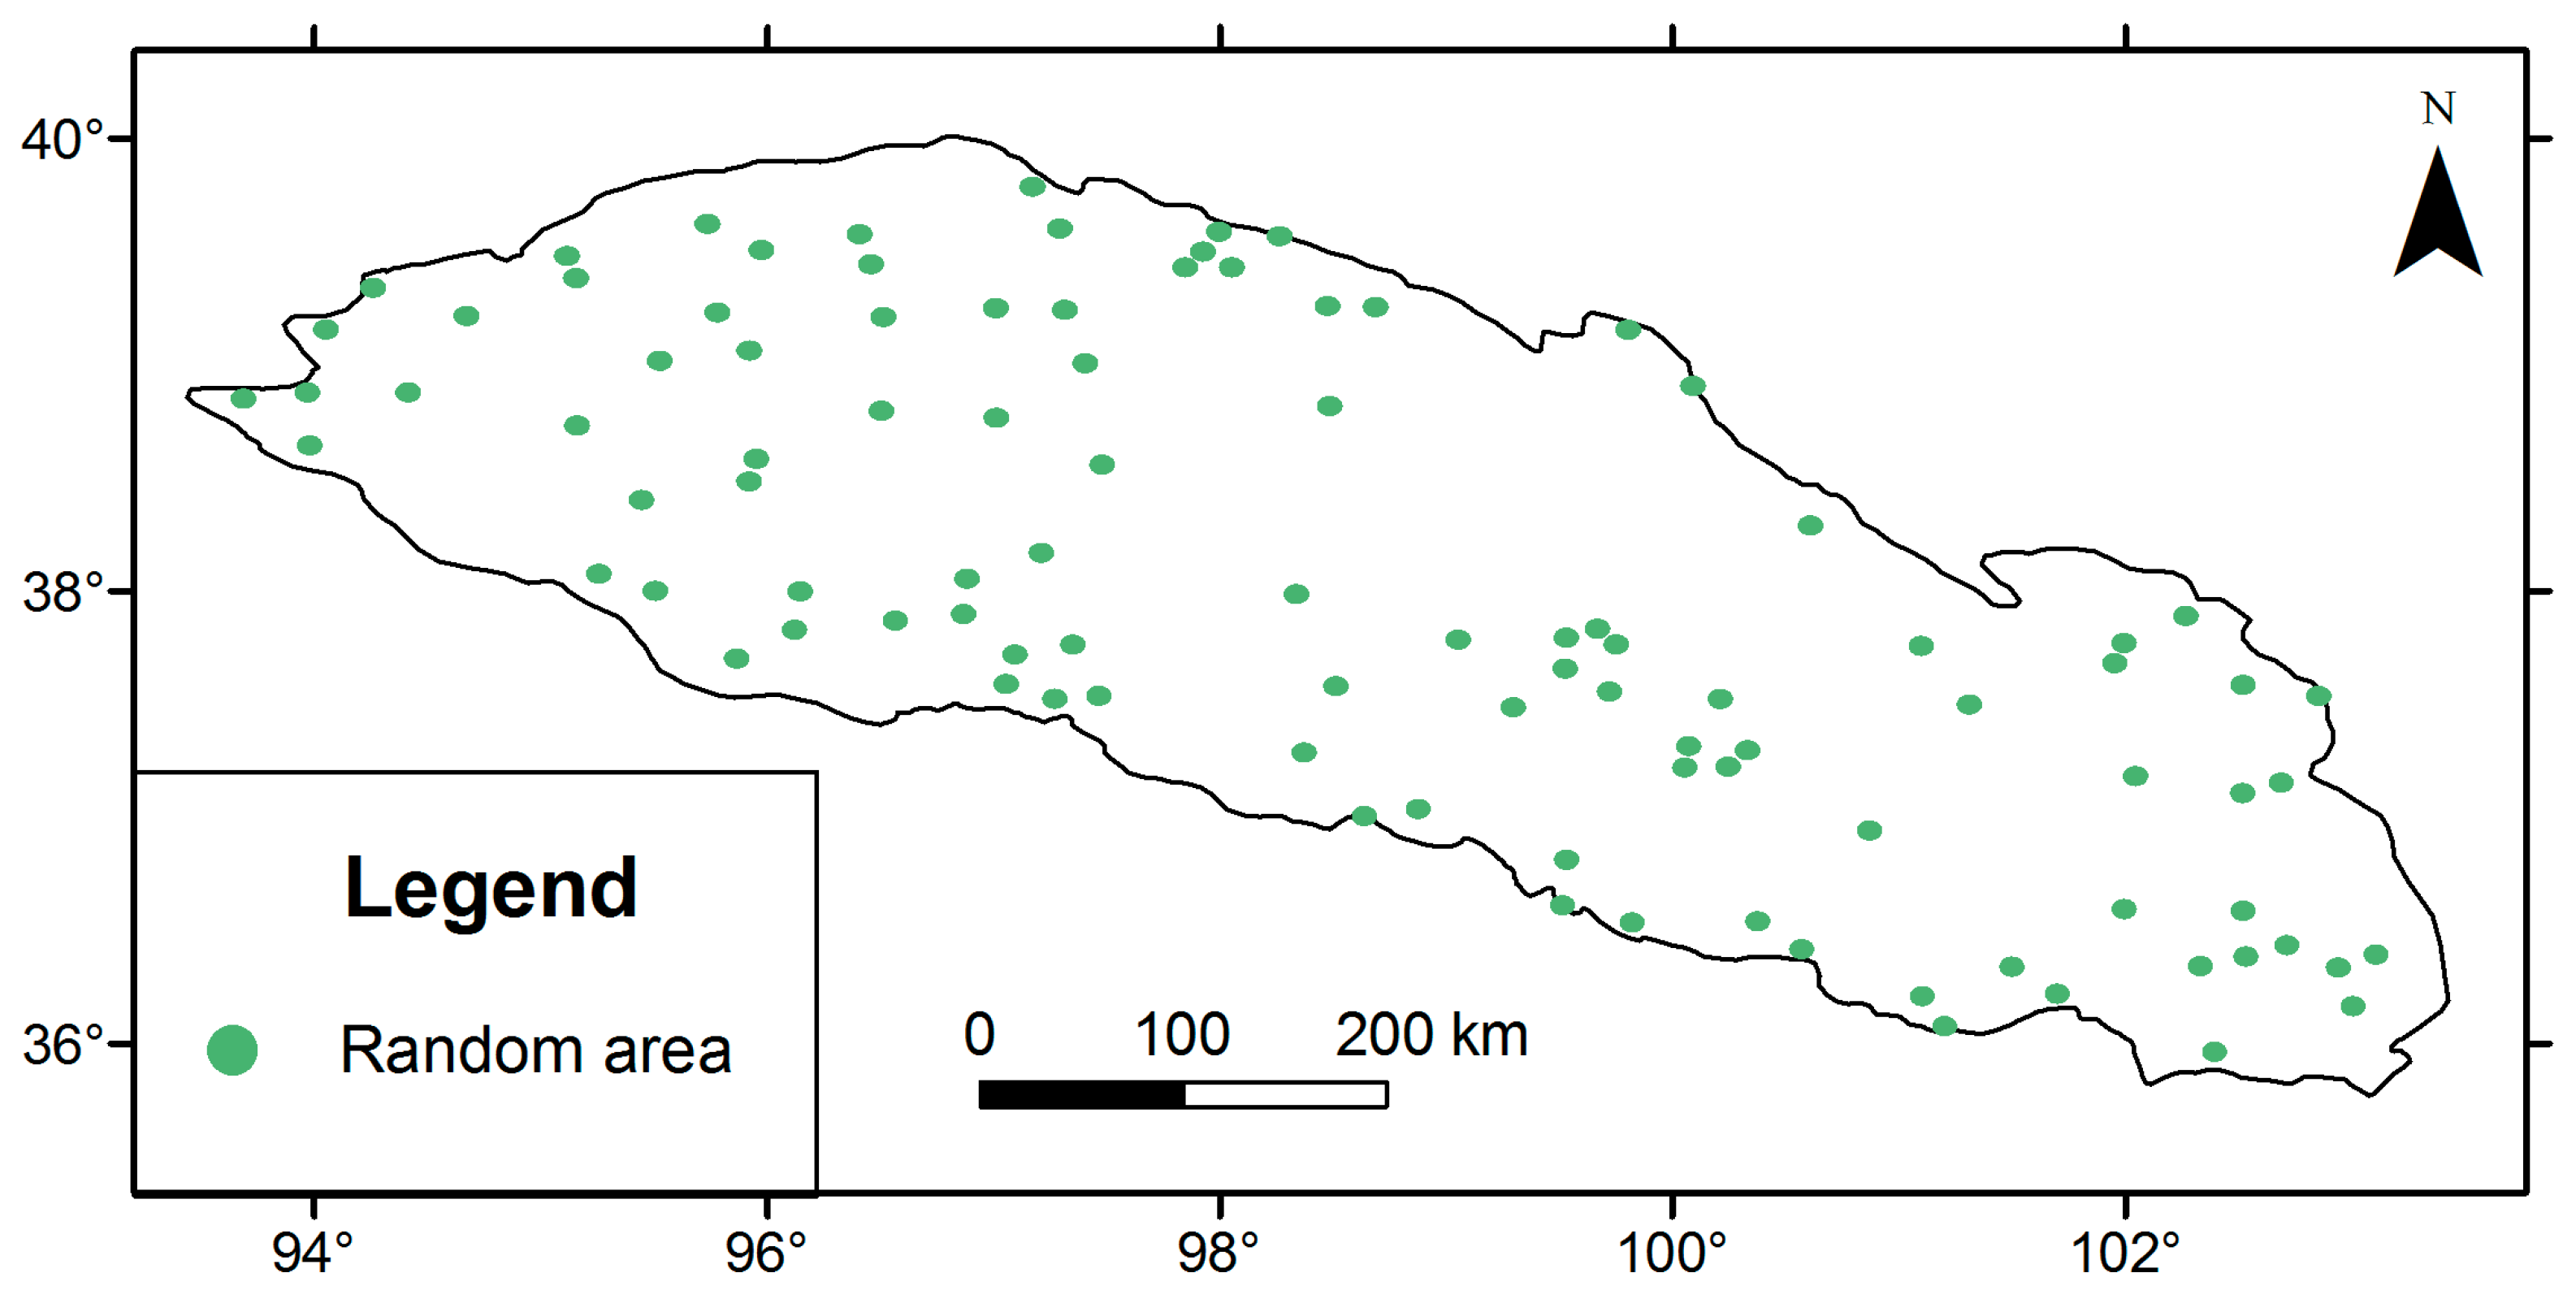
MDAT data are acquired based on the survey data of 27 meteorological stations in and around the Qilian Mountains, which are shown in
Figure 1. From the survey data, the MDAT data for every decade from the 1960s to the 2000s, at every meteorological station, can be computed.
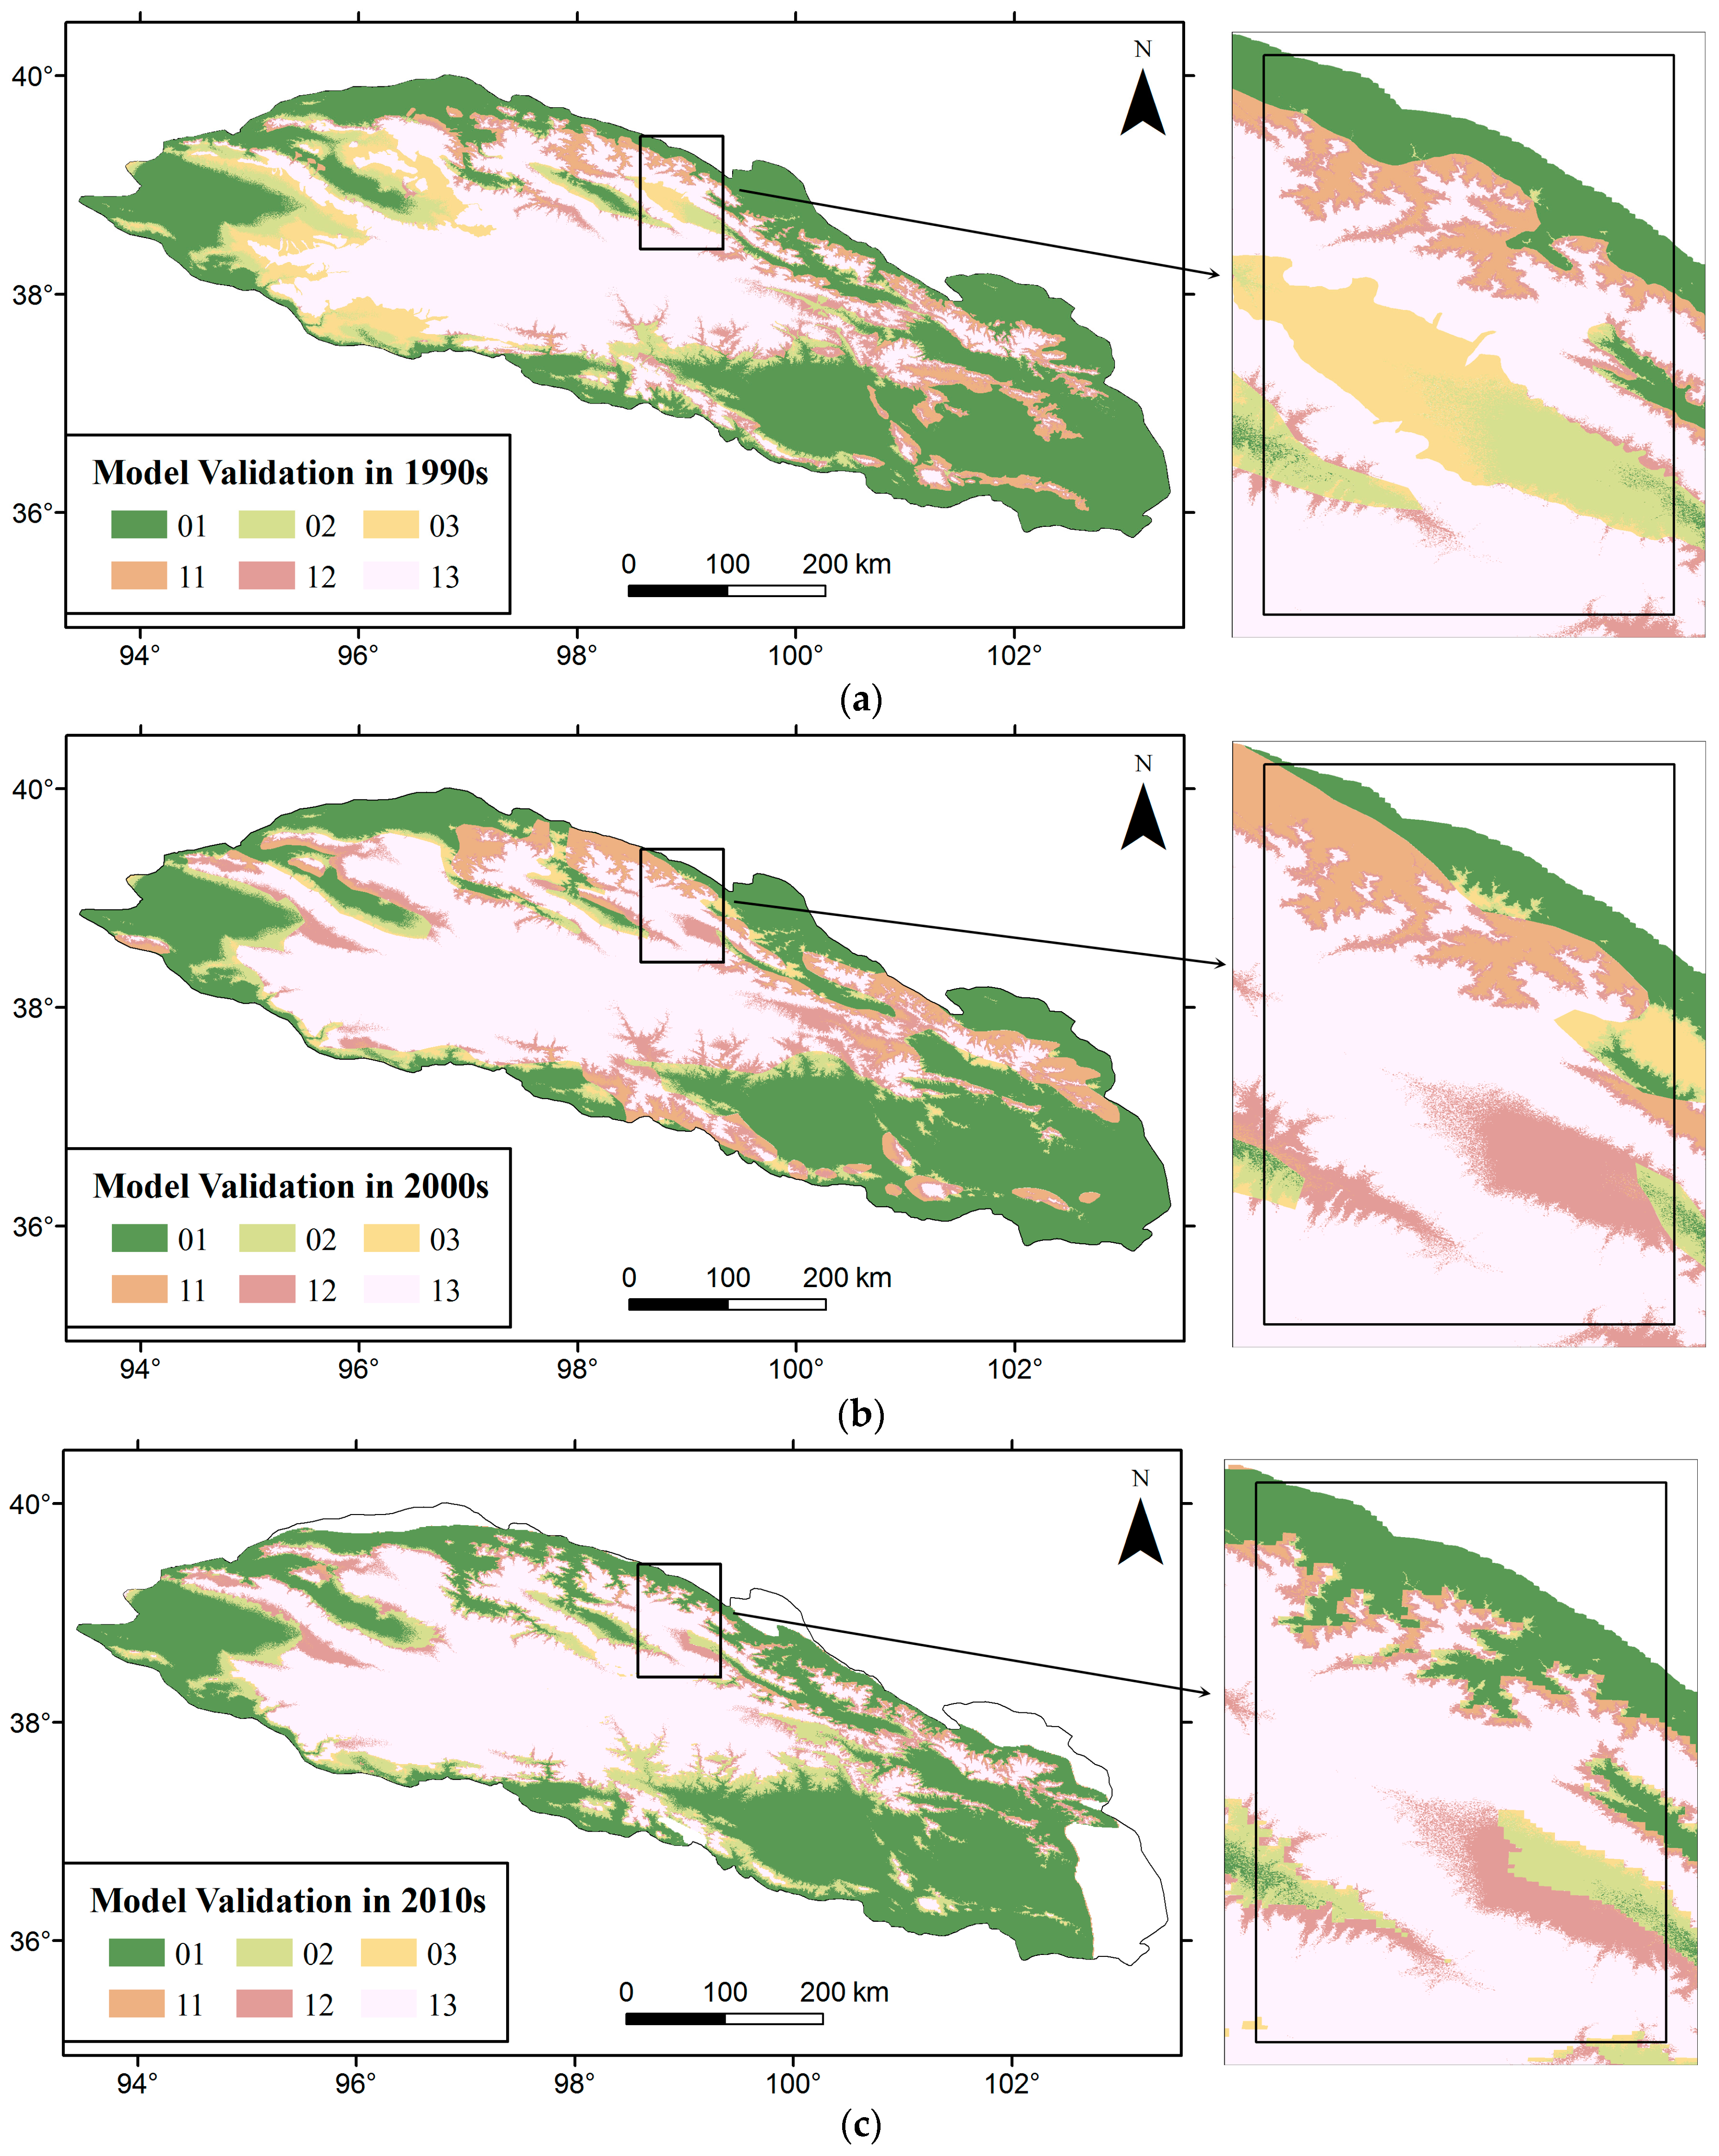
For every meteorological station, a curve estimation regression is carried out on the MDAT data for every decade, from the 1960s to the 2000s, using different regression models, including linear, quadratic, compound, growth, logarithmic, cubic, S, exponential, inverse, power and logistical. By estimating the Sig. and R2 of every regression model, the best regression model can be determined. Generally, the selected model has a Sig. below 0.05 and an R2 greater than 0.8 for every meteorological station. Thus, the predicted value can be credible, and the MDAT data in every decade from the 2010s to the 2040s can be predicted for every meteorological station.
Based on the MDAT data for every decade from the 1990s to the 2040s at the meteorological stations, the linear regression model is built using the MDAT data, topographic factors (including elevation, slope, sine value and cosine value of the aspect), and location parameters (latitude and longitude) at the F probability of 0.05, which is shown in
Table 1.
The following can be found in
Table 1: MDAT data have a close relation to elevation, latitude and longitude, and the R
2 is above 0.90, so it is acceptable to simulate MDAT data for the whole of the Qilian Mountains using these linear regression models for the decades from the 1990s to the 2040s.
The longitude and latitude factors are built first. The final raster data of latitude and longitude have the same resolution and projection as other factors, and the value of every pixel in the data is the latitude or longitude of the pixel.
Then, the MDAT data for the whole of the Qilian Mountains can be simulated using the linear regression models in
Table 1. By subtracting the simulation data from the survey data at every meteorological station, the residual MDAT data are acquired. Using the proper interpolation method, the residual MDAT data for the whole of the Qilian Mountains can be computed. By adding the interpolated residual MDAT data to the simulation data, the final MDAT data for the whole of the Qilian Mountains have the same values with as original data from the meteorological stations. The final MDAT data in the 1990s and the 2040s are shown in
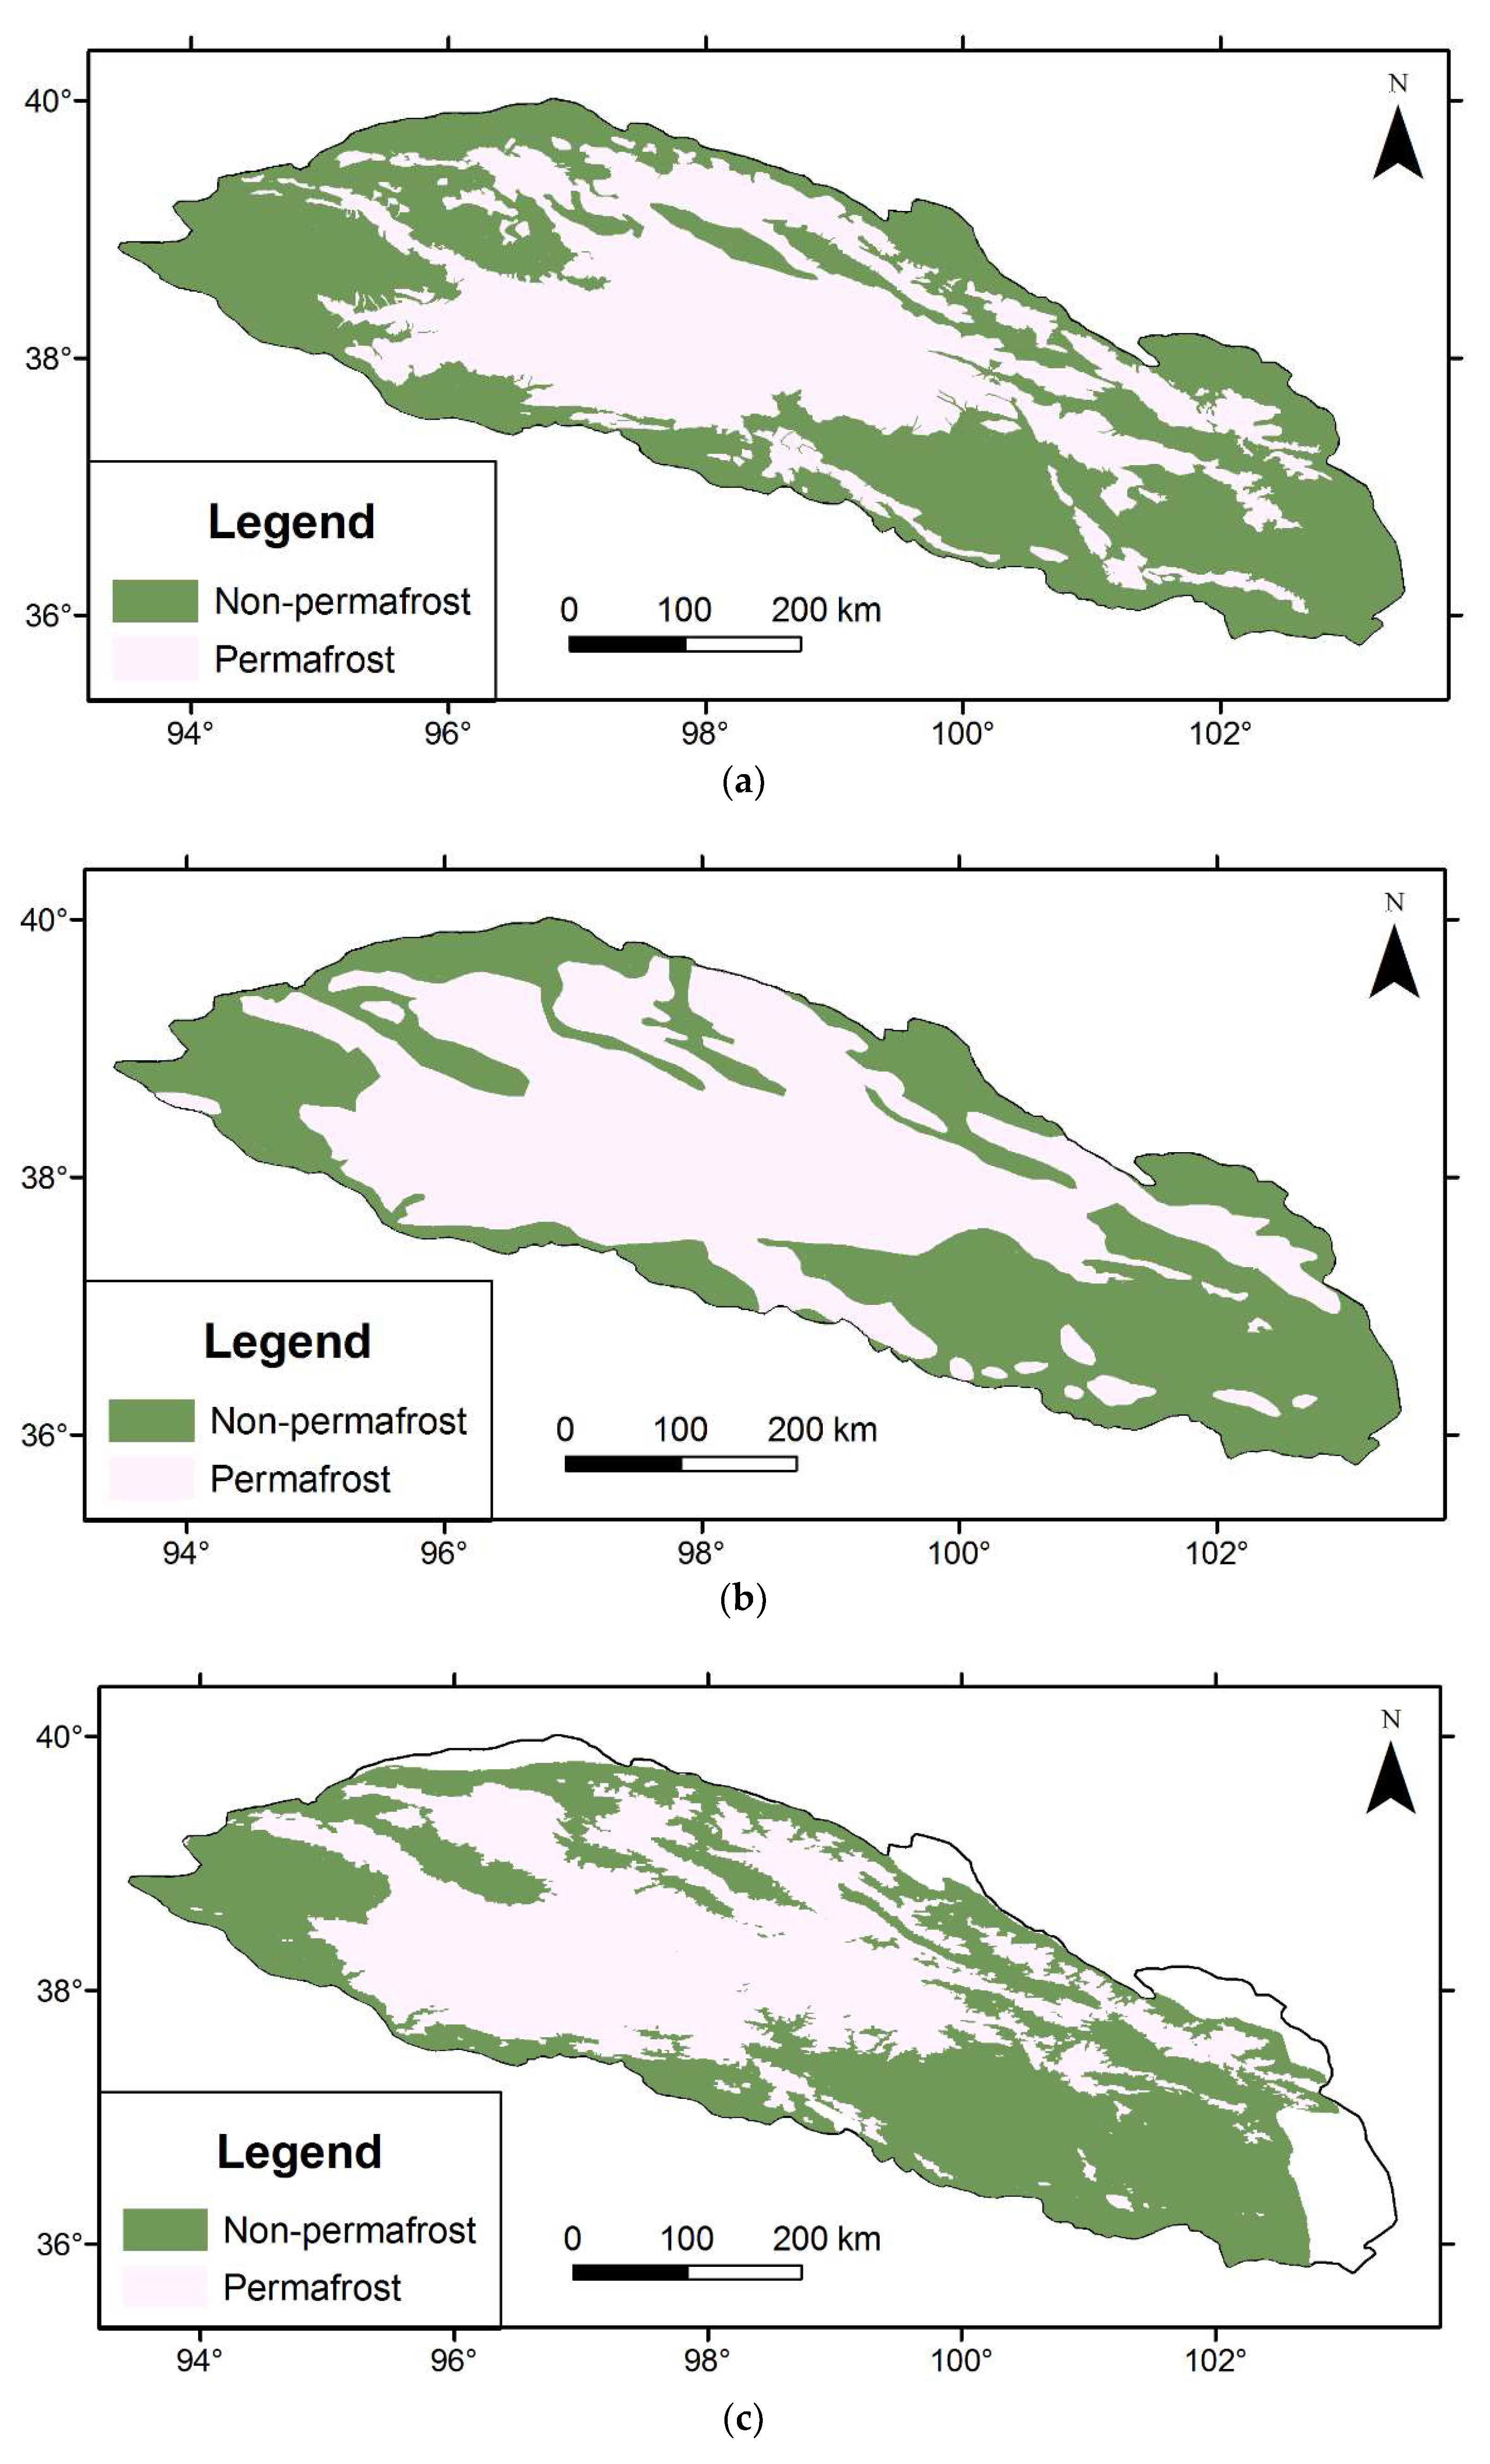
Figure 2.
The final MDAT have similar distribution in the 1990s and 2040s, so the data in other decades are omitted in
Figure 2. In the final MDAT data, the values at the meteorological stations are equal to the survey data from the same meteorological stations. To quantitatively analyze the MDAT data, a statistical analysis is conducted, as shown in
Table 2.
The MDAT data are low in the eastern part, basins and lakes, such as the Qinghai Lake, which is high in the upper part of the mountains with high elevations, as shown in
Figure 3 and
Table 2. From the 1990s to the 2040s, the MDAT data continually increased, and the mean value increased by nearly 2.0 °C.


