1. Introduction
Water thickness measurement is important in the fields of aircraft icing [
1], rain-wind induced cable vibration [
2,
3,
4,
5,
6], fluid mechanics [
7,
8,
9,
10], gallo** of cables with ice accretion, etc. It is beneficial to reveal the fundamental microphysical processes associated with aircraft icing phenomena, explain the wind-water-cable coupling in rain-wind induced cable vibration, measure the phase of a turbulence state on a free surface, and reveal the formation of ice accretion on stay cables. Several nonintrusive techniques have been developed to measure the thickness distribution of water film/rivulets, including structured light techniques (e.g., [
1,
11,
12,
13,
14]), ultrasonic techniques [
3,
15,
16], stereoscopic imaging techniques [
17,
18], density-based techniques (e.g., [
19,
20]), and laser-induced fluorescence imaging technique (e.g., [
21,
22,
23,
24]).
Cobelli et al. [
11] and Salvi et al. [
13] described the principle of a structured light technique, which is an optical profilometric technique and mainly consists of a projector and a digital camera. In this technique, a fringe pattern of known characteristics is projected onto the test object and then recorded by a digital camera from a different direction. Since the registered fringe pattern is distorted by the object, the object’s depth information can be derived from the deformed fringe pattern using information theory. Structured light techniques have been successfully employed for the topography of solid structures in a wide variety of fields, such as three-dimensional (3D) sensing systems, mechanical engineering, machine vision, robotic control, industry monitoring and quality assessment, and biomedicine. Structured light techniques have also been applied in free surface measurements. For instance, Zhang and Su [
14] reconstructed vortex shapes at a free surface using a fringe projection technique. Cochard and Ancey [
25] utilized a similar method to monitor the time evolution of a dam break in a laboratory. Cobelli et al. [
11] experimentally investigated the surface deformations of a water flow using a digital fringe projection system. More recently, Hu et al. [
12] developed a digital fringe projection system to quantify the transient behavior of wind-driven water droplet and rivulet flows over a flat test plate. Zhang et al. [
1] developed a digital image projection system to measure water film and rivulet flows on airfoil surfaces. However, structured light techniques always require a complicated process to calculate the changes between the modulated pattern and the registered reference correctly. In addition, imperfections in the projected pattern might cause significant measurement error [
1].
Li et al. [
3] and Chen et al. [
15] proposed an ultrasonic technique to measure the shape, thickness, position, and movement of rivulets on an inclined cable model in a wind tunnel test. Their experiments demonstrated the effectiveness of this technique in water thickness measurement. Liu et al. [
16] developed a multitransducer ultrasonic pulse-echo technique to measure water film thickness and successfully employed this technique to reveal the characteristics of surface water film flows driven by boundary layer winds over a test plate. However, since the test point of the ultrasonic technique is limited, the ultrasonic technique could not measure the thickness field of a water film.
A density-based technique was developed by Zhang et al. [
20] to measure surface gradients of water. The technique requires parallel light beams to illuminate the water surface. The reflected rays from the free surface were captured by a charge-coupled device color camera above the surface. The water thickness variation is calculated by integrating the slopes that are derived from the color images after calibration. The density-based technique was successfully applied to quantify near-surface turbulence by Zhang et al. [
20] and to reconstruct the surface motion of a water film by Wright et al. [
19]. However, this density-based technique always requires an array of lenses to transform the rays of a light source into a series of color-coded parallel light beams, which are complicated and expensive.
Benetazzo [
17] and Benetazzo et al. [
18] developed a wave acquisition stereo system to derive sea surface elevation fields from image sequences that were captured by two synchronized cameras. This technique utilizes binocular stereogrammetry to recover topographic information and is able to measure surface discontinuities [
26]. However, this technique requires high-resolution and high-speed cameras to achieve measurement accuracy. In addition, a large distance between the cameras and the inclination angle of the cameras’ lines of sight always results in measurement uncertainty.
Laser-induced fluorescence techniques are widely used in flow visualizations. When these techniques are combined with a charge-coupled device camera, the new system is referred to as a laser-induced fluorescence imaging technique system and is able to measure the thickness of water film/rivulets or the liquid-gas free boundary. Liu et al. [
7] measured the dynamic thickness of film flows due to gravity-driven instabilities using this technique. Johnson et al. [
8,
9] developed a laser-induced fluorescence imaging technique system to quantify the transient behavior of water films flowing over flat surfaces. Xue et al. [
24] developed a measurement platform based on laser-induced fluorescence and a virtual stereo vision sensor and experimentally verified that their method can give a detailed and accurate description of a liquid film in annular flows. Lel et al. [
21], Chinnov et al. [
22], and Schagen and Modigell [
23] also used a similar technique to measure film thickness under various experimental settings. However, this technique is usually temperature-dependent. Furthermore, special lights (e.g., laser or ultraviolet) and special fluorescent material are required to induce the shine of fluorescence.
Under these circumstances, this study proposed a digital imaging method to measure the thickness of water film/rivulets based on the grayscale index. Ye et al. [
27,
28,
29] developed a vision-based structural displacement measurement system based on a digital image processing approach and verified its effectiveness and accuracy. In addition, digital imaging methods with advantages of the nonintrusion, nondestruction, multipoint measurement, high resolution, and cost-effectiveness have also been widely used in crack identification [
30], characterization of blood samples [
31], and three-dimensional reconstruction [
32]. In the proposed method, pigment was diluted in a water film, images of the water film were captured by a digital camera, and finally, the thickness distribution was identified based on the grayscale index of the water film. In the present study, the relationship between the grayscale index and water thickness was theoretically derived and experimentally validated. Both the theoretical and experimental results showed that for a thin colored water film, the water thickness is inversely proportional to the grayscale index. This linear relationship was then utilized to measure the distribution and profile of a water rivulet flowing on the lower surface of a cable model. The proposed method has great potential in quality inspection or three-dimensional reconstruction of small-size curved surface structures.
2. Theoretical Analysis
For a colored water film, the pigment is considered uniformly distribute in the water and the color density (q) is defined as the ratio of the pigment volume to the water volume, which is expressed as:
where
is the pigment volume and
is the volume of water.
As water is a transparent liquid, only the pigment elements are visible, and the other areas are blank. In a top view, as shown in
Figure 1, the pigments in the top layer might overlap those in a lower layer. It is supposed that a water-soluble pigment will be utilized to color the water and the testing time is short; therefore, the sedimentation of pigment is negligible.
To calculate the visible pigment in the top view, the water is uniformly divided into n layers and the thickness of each layer is defined as . Consequently, the pigment volume in each layer is calculated as and the whole thickness of the water is equal to . When the number of layers, , becomes very large and the thickness of each layer, , is very thin, the pigment in each layer can be treated as a uniform distribution without overlap.
When considering the topmost layer
, there is no overlap and the area without pigment in the top view is calculated as:
where
is the area of the target water film.
However, when considering the top two layers, some pigment in the lower layer becomes visible through the blank area of the topmost layer. Consequently, when only considering the top two layers, the area without pigment in the top view becomes:
By this analogy, when considering the total
n layers, the area without pigment in the top view is calculated as:
Finally, the area of visible pigment in the top view is calculated as:
As the thickness of each layer becomes very thin and the number of layers approaches infinity (
), Equation (5) becomes equivalent to:
Then, using the Taylor expansion and dividing by
on both sides, Equation (6) is rewritten as:
where
is the nondimensional area of the visible pigment in the top view, which varies with parameters
and
.
In the present study, a thin water film (
T close to zero) is considered; therefore, the 2
nd and higher-order terms on the right-hand side of Equation (7) become negligible. It becomes:
This equation indicates that under a certain density, q, the nondimensional area of visible pigment per unit area in the top view, , can be simplified as a linear function of the water thickness.
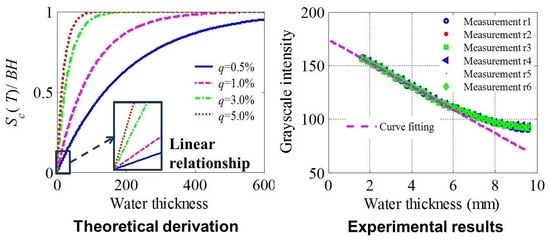
Figure 2 shows the relationship between the nondimensional area
and the water thickness
for different cases of
q, as indicated in Equation (8). For all cases of
q, the variation in
has a similar tendency as that of
with increasing
T, its rate of increase decreases when
T increases, and finally,
tends to 1.0. For cases with higher value of
q, the curves have a higher rate of increase and
reaches 1.0 at lower water thickness.
Figure 2b confirms that the nondimensional area
linearly increases with the water thickness when the water film is thin.
As the color intensity is proportional to the visible pigment in per unit area, based on Equation (8), the color intensity should also linearly increase with the water thickness when the water film is thin. Consequently, in a digital image, the grayscale index
of the water film is a function of the water thickness as follows:
where
is constant and
is the slope of the grayscale index relative to the water thickness. Both
and
are sensitive to light condition considering the absorption and scattering of light. However, the influence of light condition on the parameters
and
is not investigated in the present study. For an 8-bit grayscale image, the grayscale index
varies in the range of 0 to 255. When the image is dark,
is equal to 0, which represents the strongest grayscale intensity. When the image is white,
is equal to 255, which represents the lowest grayscale intensity. As the grayscale index
decreases with the grayscale intensity, the grayscale index
decreases with the water thickness
T and the slope,
, should be negative.
Equation (10) is the inverse of Equation (9):
where
, and
.
This equation indicates that the water thickness is inversely proportional to its grayscale index in digital images. The linear relationship in Equation (10) will be experimentally validated and the parameters, and , will be calibrated through experiments.
4. Measurement of the Profile of a Water Rivulet Flowing on a Cable Surface
The theoretical analyses and experimental results validated that for a thin colored water film, the grayscale index linearly decreases as the water thickness increases. The water thickness can be detected by the grayscale index based on their linear relationship. In this section, the profile of a water rivulet flowing on a cable surface is measured, which is a factor of interest in the field of rain-wind induced cable vibration.
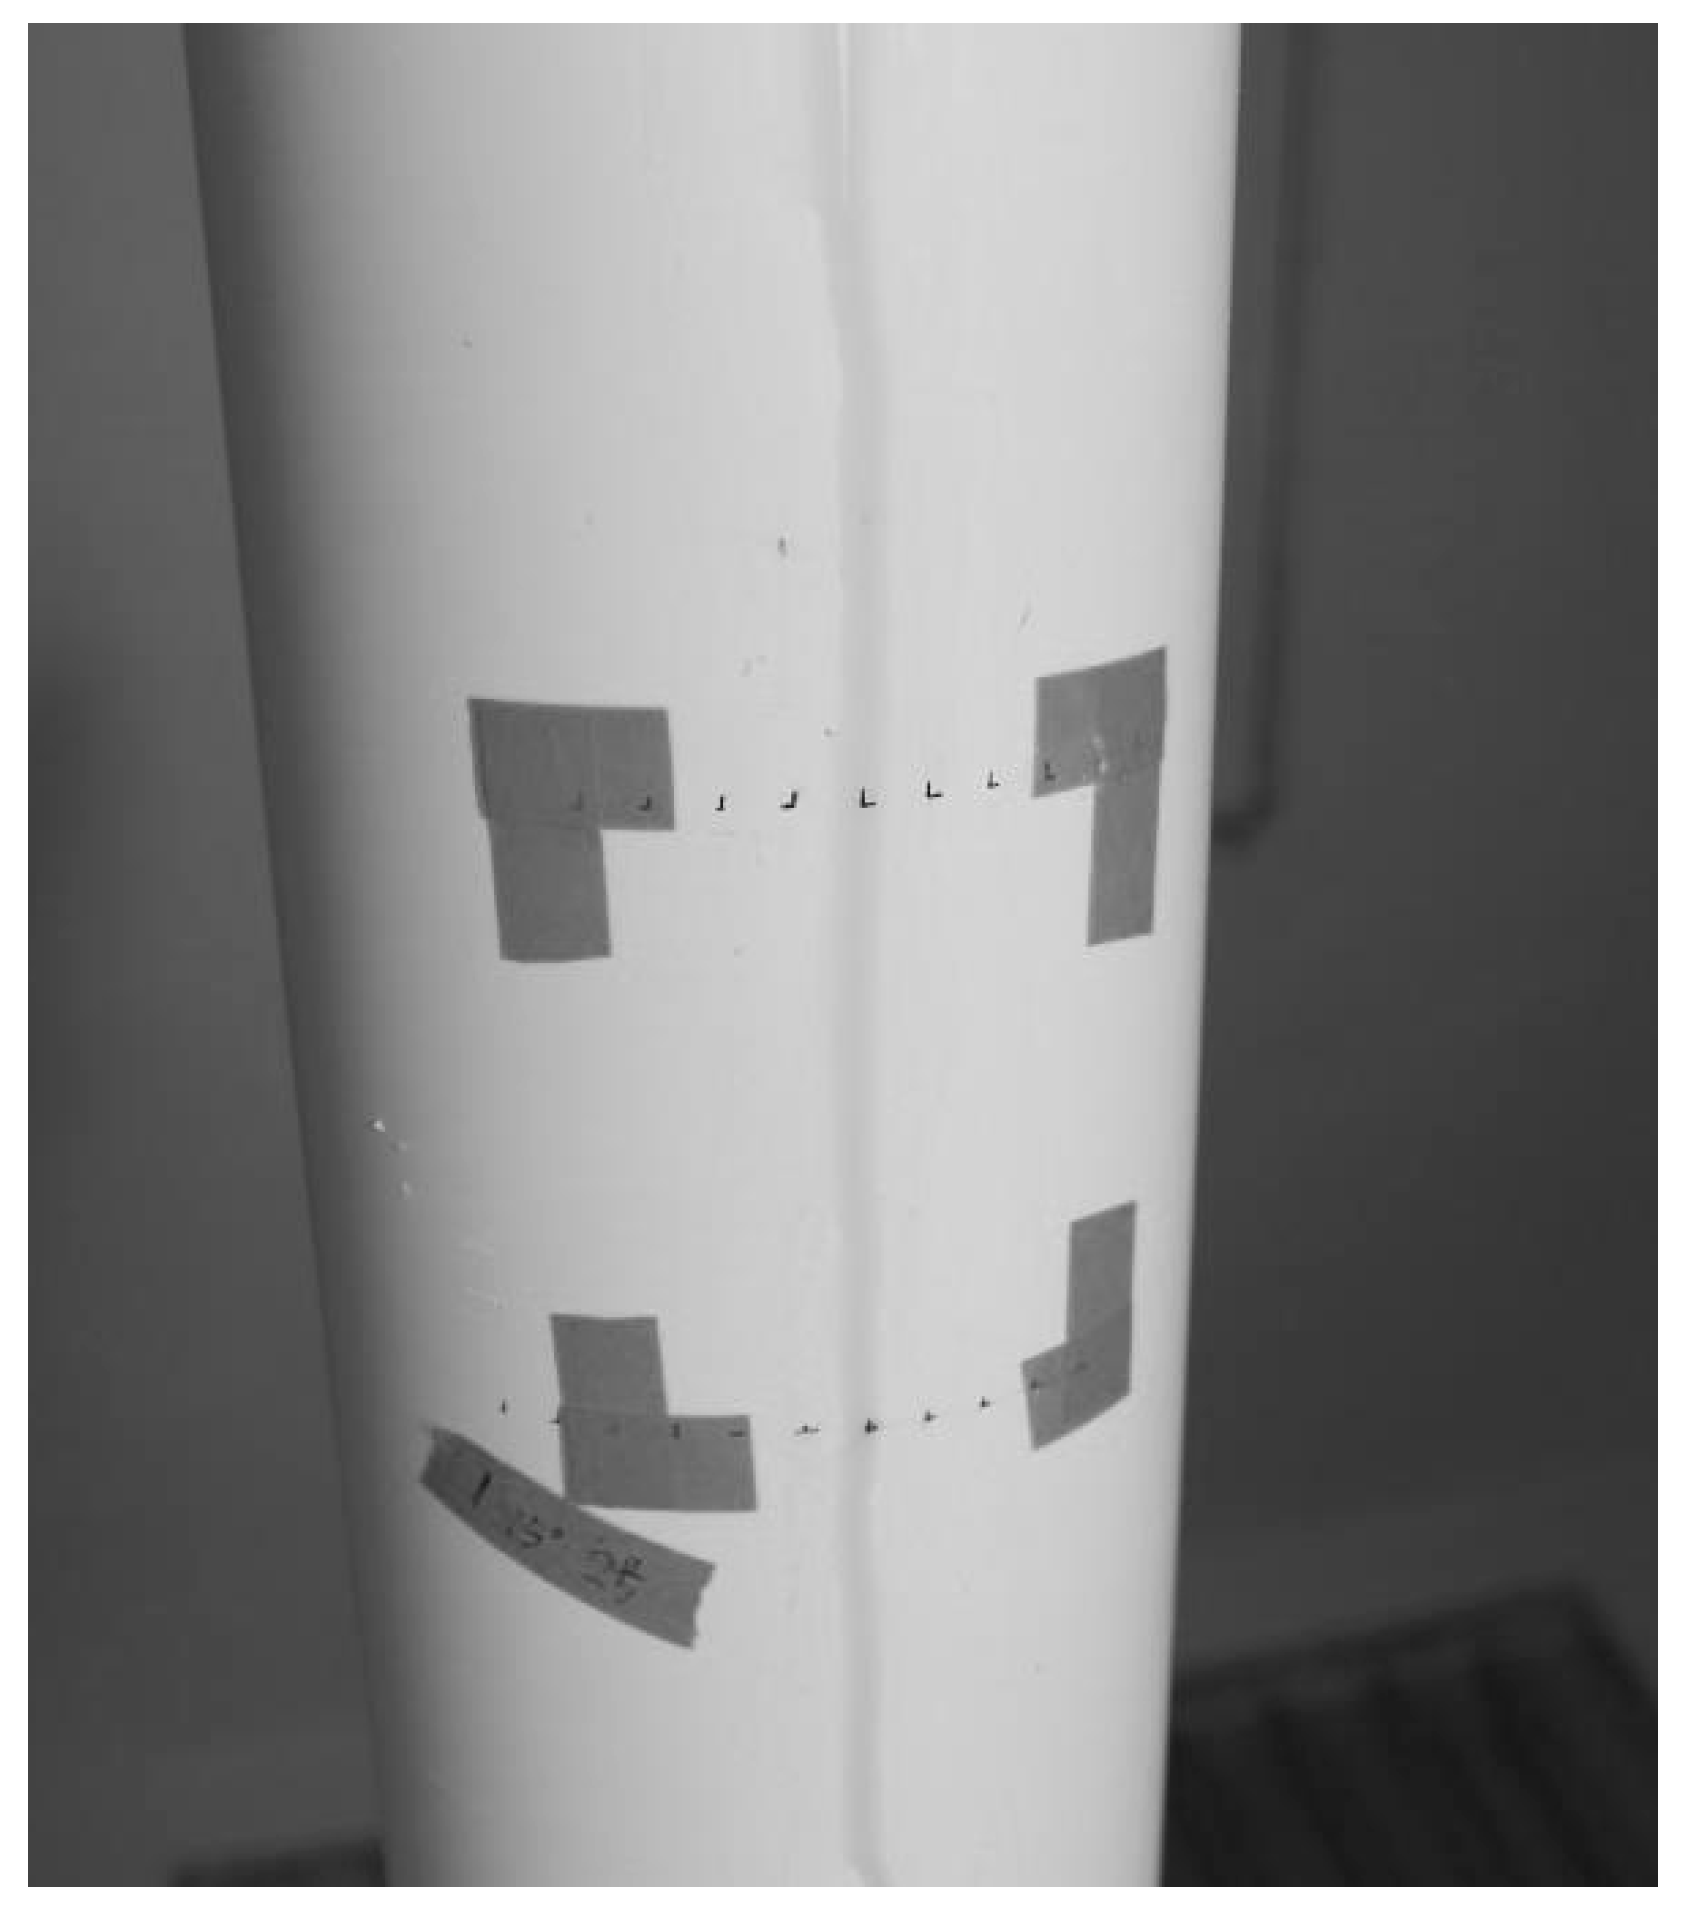
Figure 10 shows the experimental setup. A segment of polyvinyl chloride pipe is fixed on an inclined aluminum rod to simulate an inclined stay cable. A plastic pipe is installed to guide the colored water to the upper end of the cable model. Due to the influence of gravity, the water could flow along the cable surface to the lower end [
34], as shown in
Figure 10. The flowing water simulates the lower water rivulet. A fill light is equipped to adjust the luminous intensity. The measurement area is highlighted on the cable surface as shown in
Figure 10. The longitudinal distance,
, and the circumferential distance,
, are indicated by black marks.
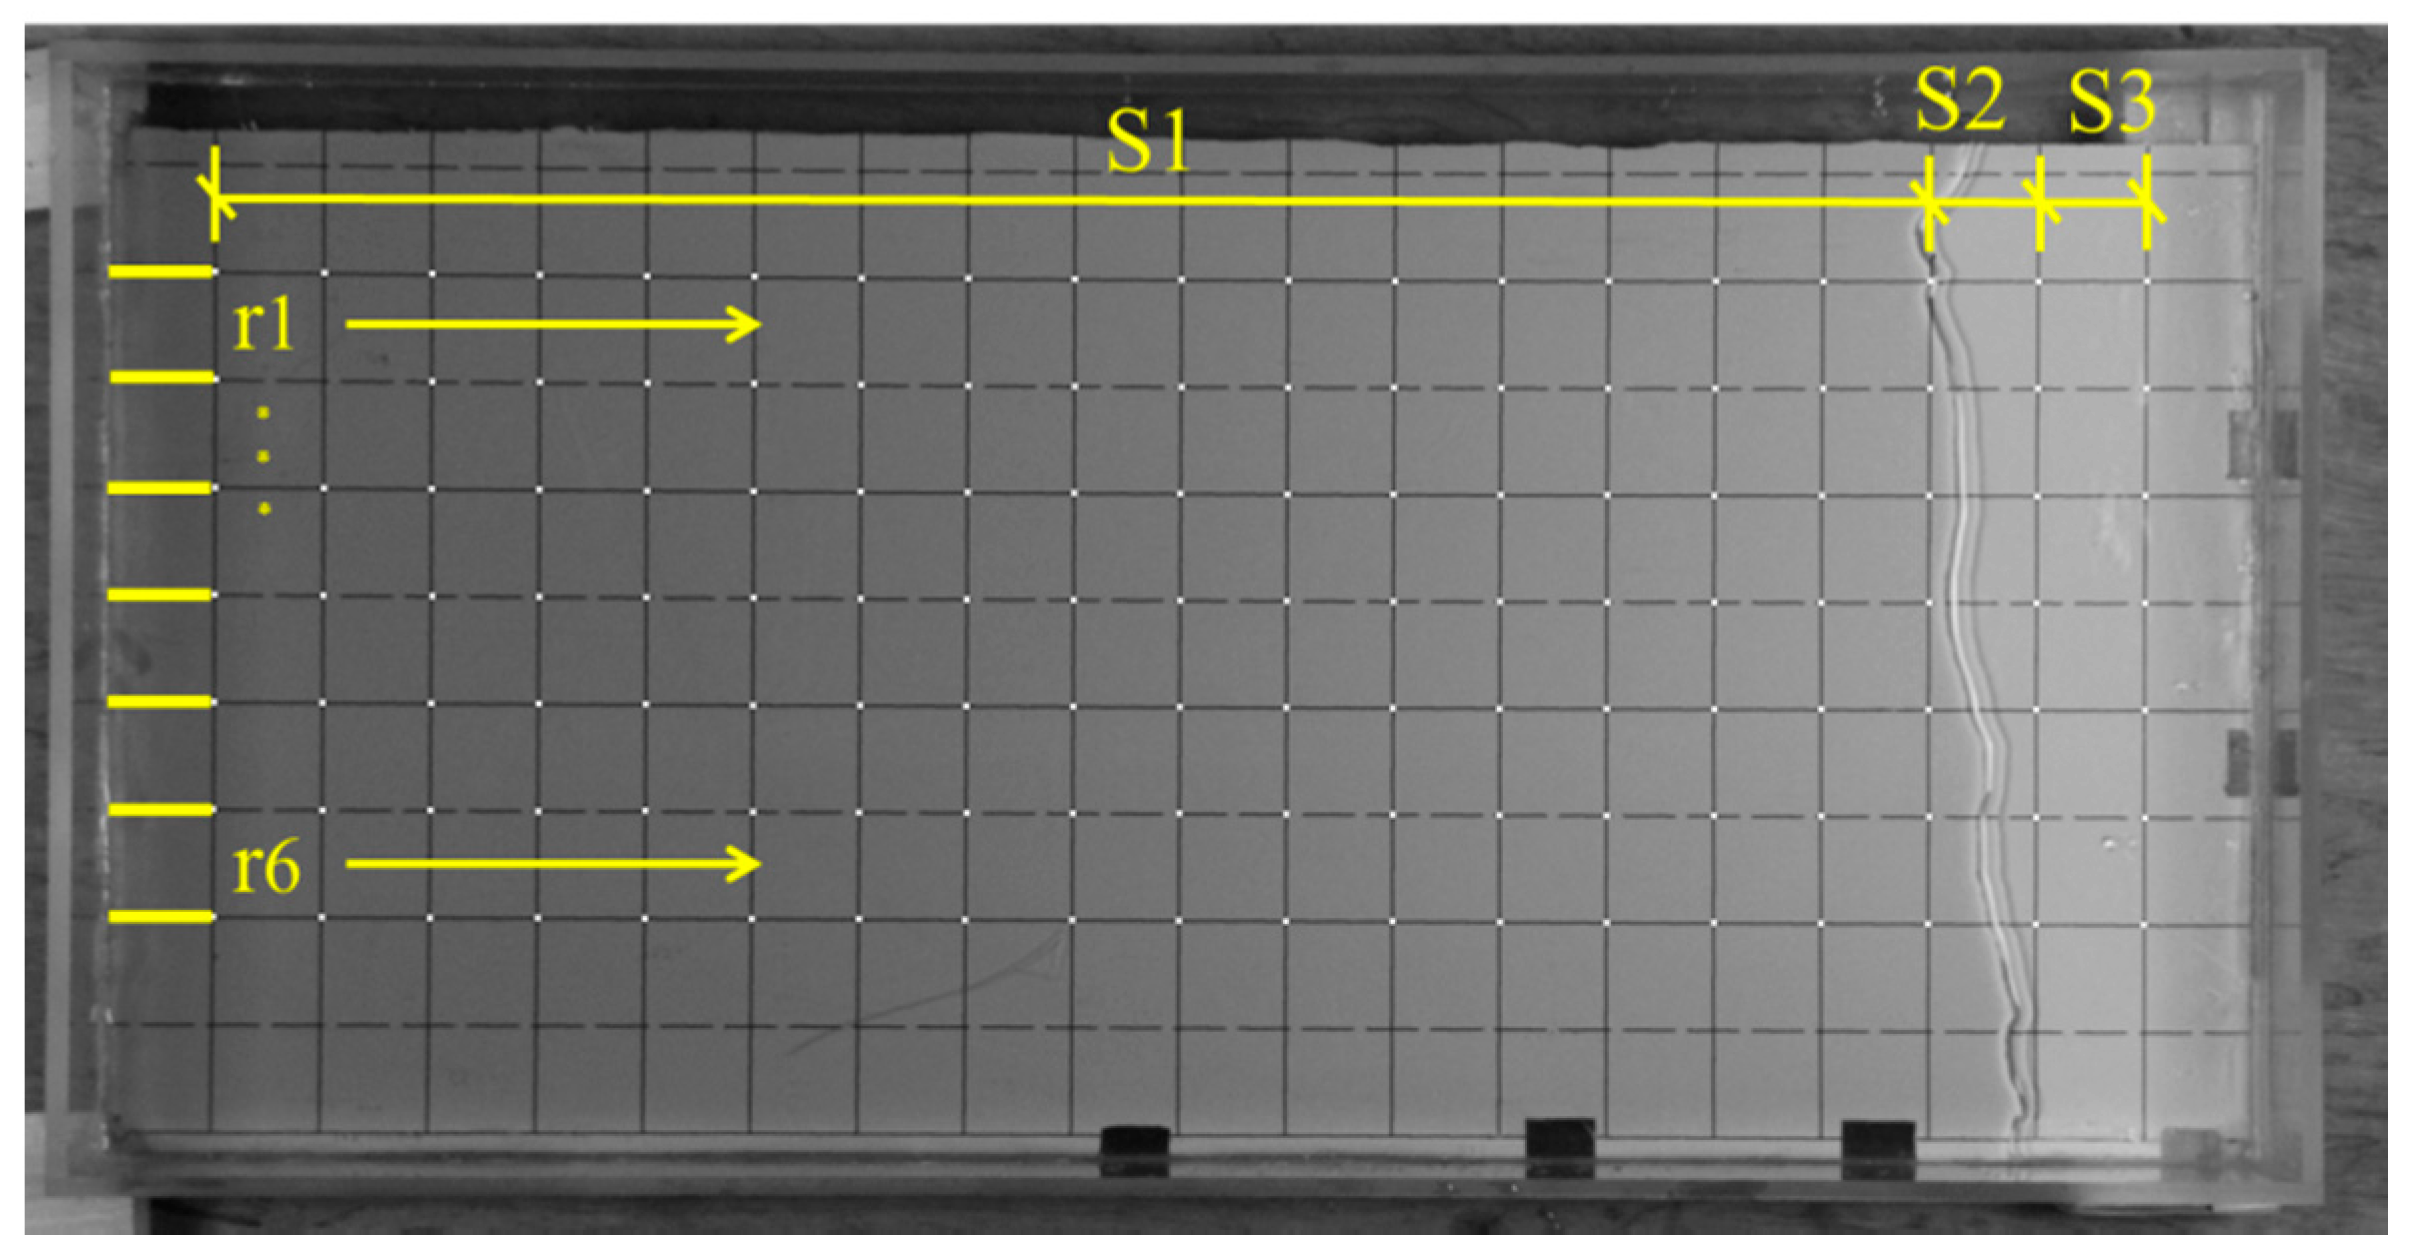
Figure 11 shows a raw image of the water rivulet recorded by a digital camera. It shows that the water rivulet is relatively uniform in the longitudinal direction. In the circumferential direction, it is thicker in the centerline and thinner on both sides. Consequently, the present study mainly focuses on the section profile of the water rivulet.
Figure 12a shows the measured grayscale index varying with the circumferential coordinate. It is worth noting that the lens aperture, luminous intensity, and incident angle are not the same as those adopted in
Section 3. Consequently, the parameters b0 and b1 identified in
Section 3 are inapplicable here. In this section, the parameter b0 is eliminated by subtracting the grayscale index of the background. The grayscale index of the background increases with the circumferential coordinate and it can be well fitted using a quadratic polynomial formula. The dashed purple line in
Figure 12a represents the grayscale index of the background.
Figure 12b shows the grayscale index without the effect of the background.
The parameter b1 is calibrated by setting the shadow area,
, which is referred to as the measured sectional area, equal to the actual sectional area of the water rivulet,
. This kind of calibration method was used by **g et al. [
6].
The measured sectional area is calculated as 121.3 mm, through numerical integration as follows [
6]:
where
is the width of the water rivulet and
is the circumferential coordinate.
The actual sectional area of the water rivulet
is calculated as 1.44 mm
2 through the following equation [
6]:
where
is the flow rate, which is calculated as 0.072 ml/s by testing the water volume flowing out of the plastic pipe in unit time, and
is the flow speed calculated as 0.05 m/s by a high-speed video.
Finally, the parameter
is calculated as −0.012 mm. When multiplied by
, the data in
Figure 12b become the cross profile of the water rivulet, as shown in
Figure 13. The form line of the cross-section of the water rivulet is close to a parabola. The water thickness is approximately 0.25 mm at the center and the width of the water rivulet is approximately 9 mm.
As it is very difficult to simultaneously measure a thin water film under such complicated conditions using other methods, the measurement accuracy of the proposed method will be further investigated through comparison with other methods in a simpler condition in the future.


 q = 0.5%,
  q = 1.0%,
  q = 3.0%,
  q = 5.0%).


