4.1. Spatiotemporal Features of U. prolifera
The spatiotemporal features of
U. prolifera were compared from three viewpoints: the drift path, the overall situation, and the growth stages. First of all, this study found that the origination and the drift path of
U. prolifera in 2016 and 2018 were still consistent with previous years. A large number of studies have shown that the green tides originate along the Jiangsu coast [
30,
31,
32,
33], which was first proposed by Liu et al. [
2]. According to the growth of
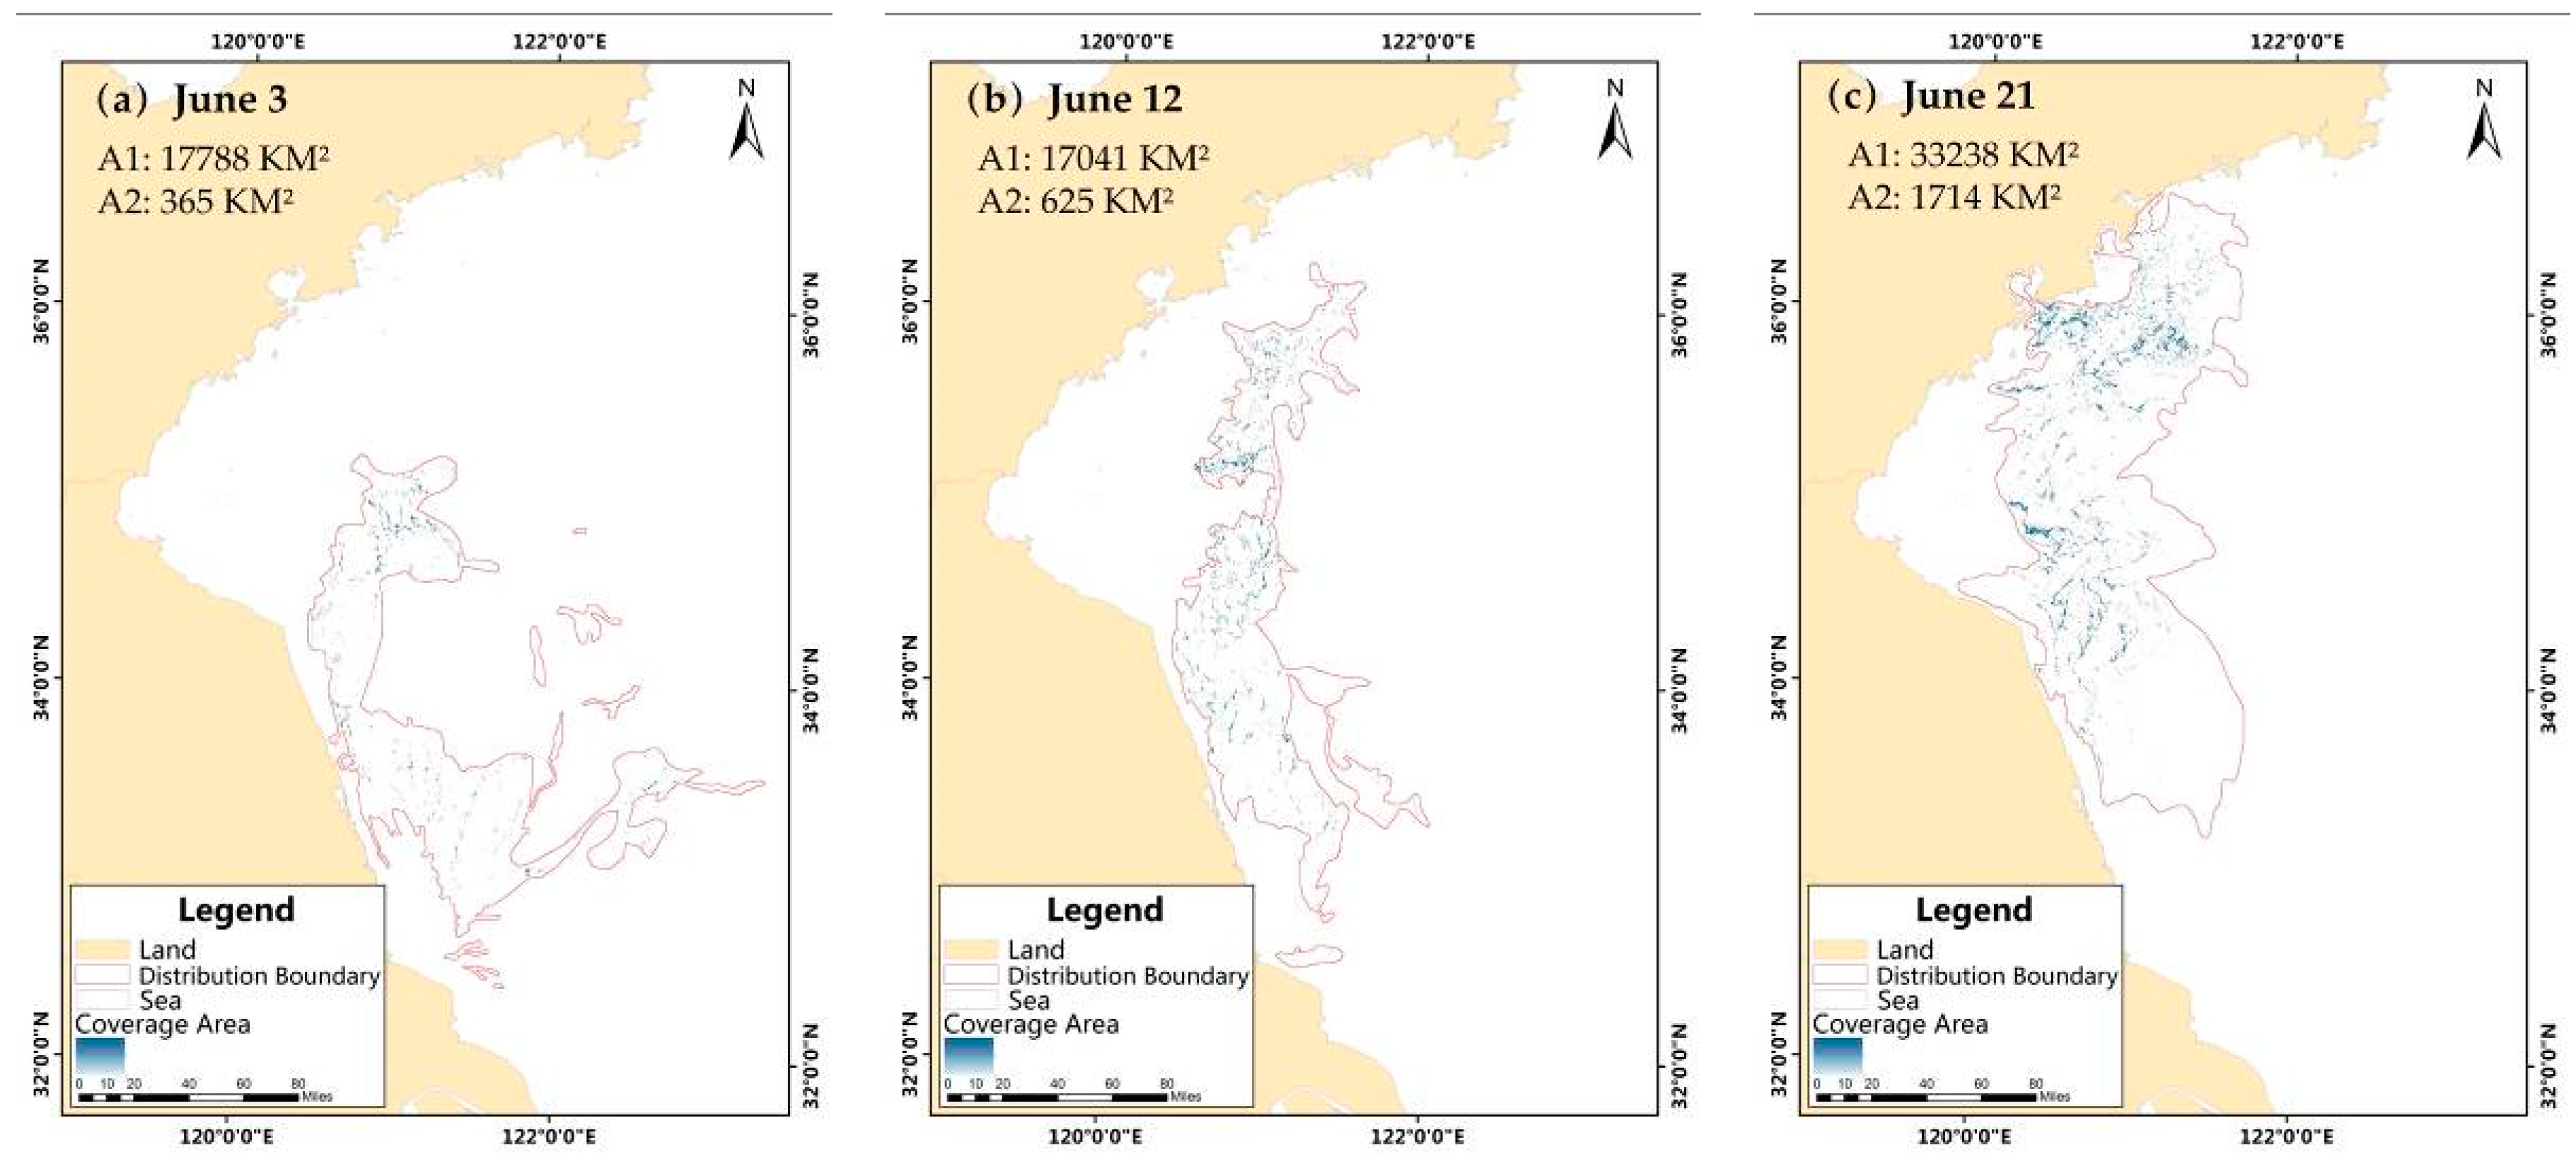
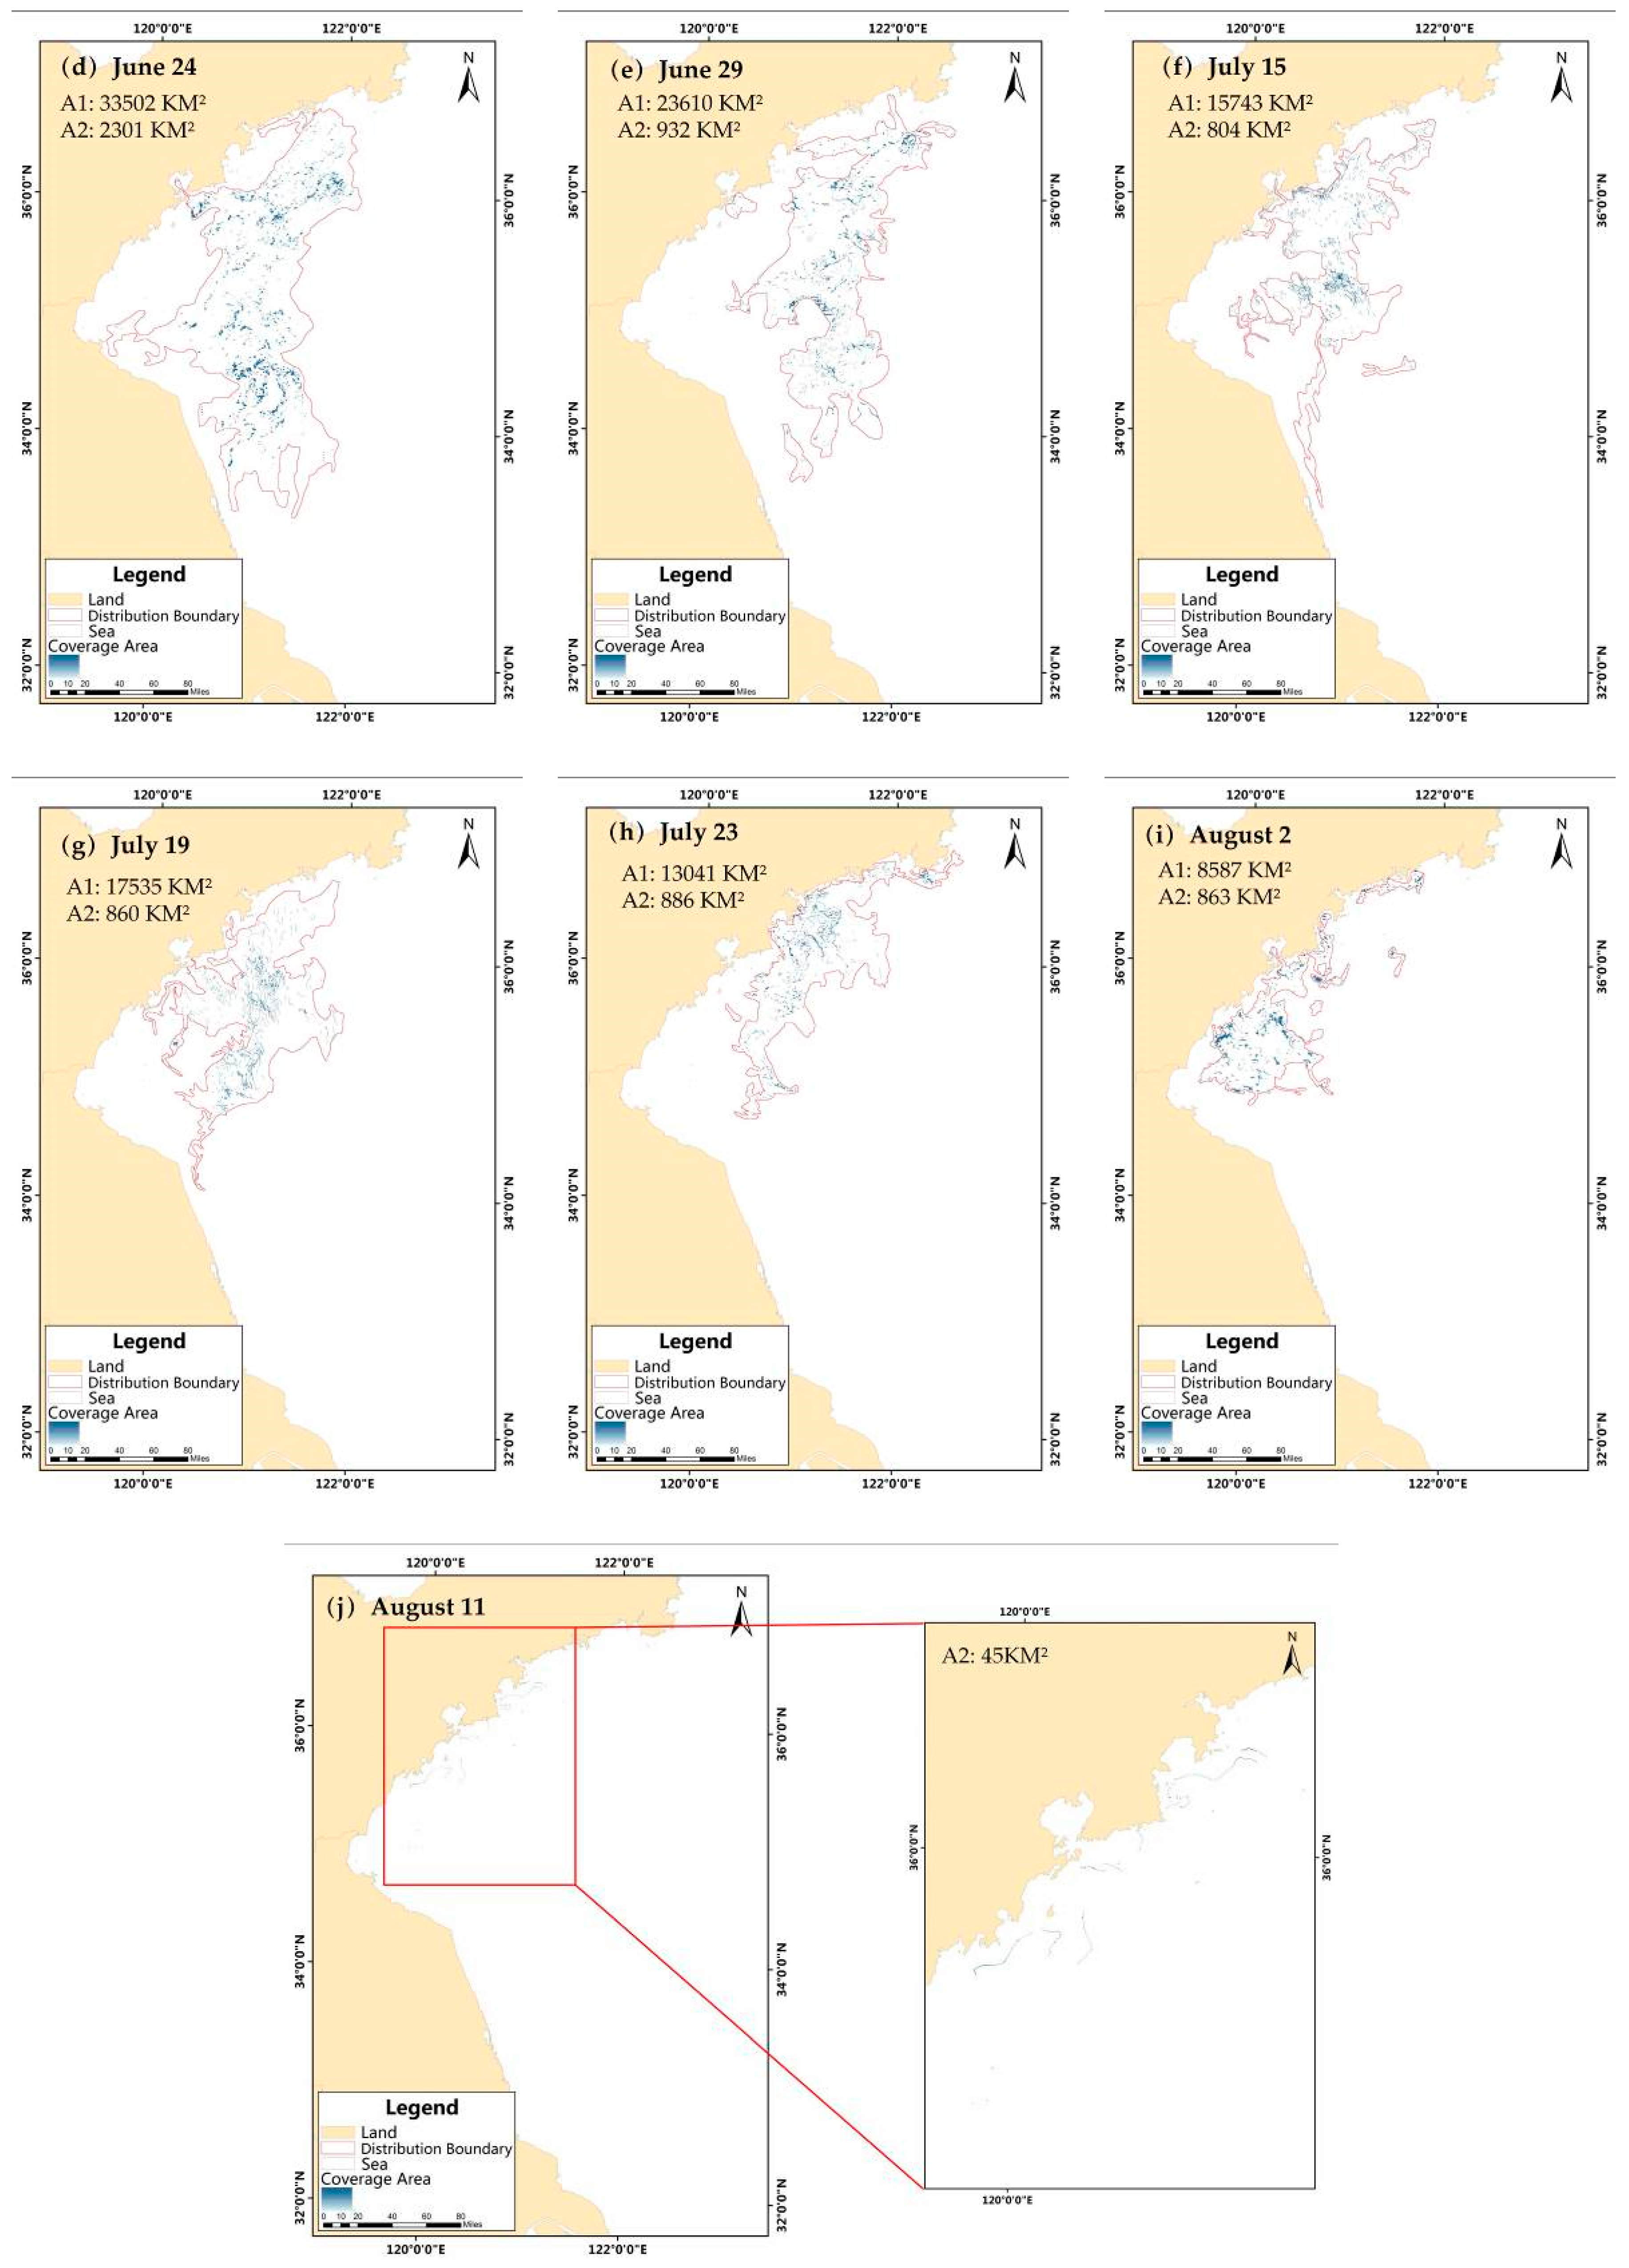
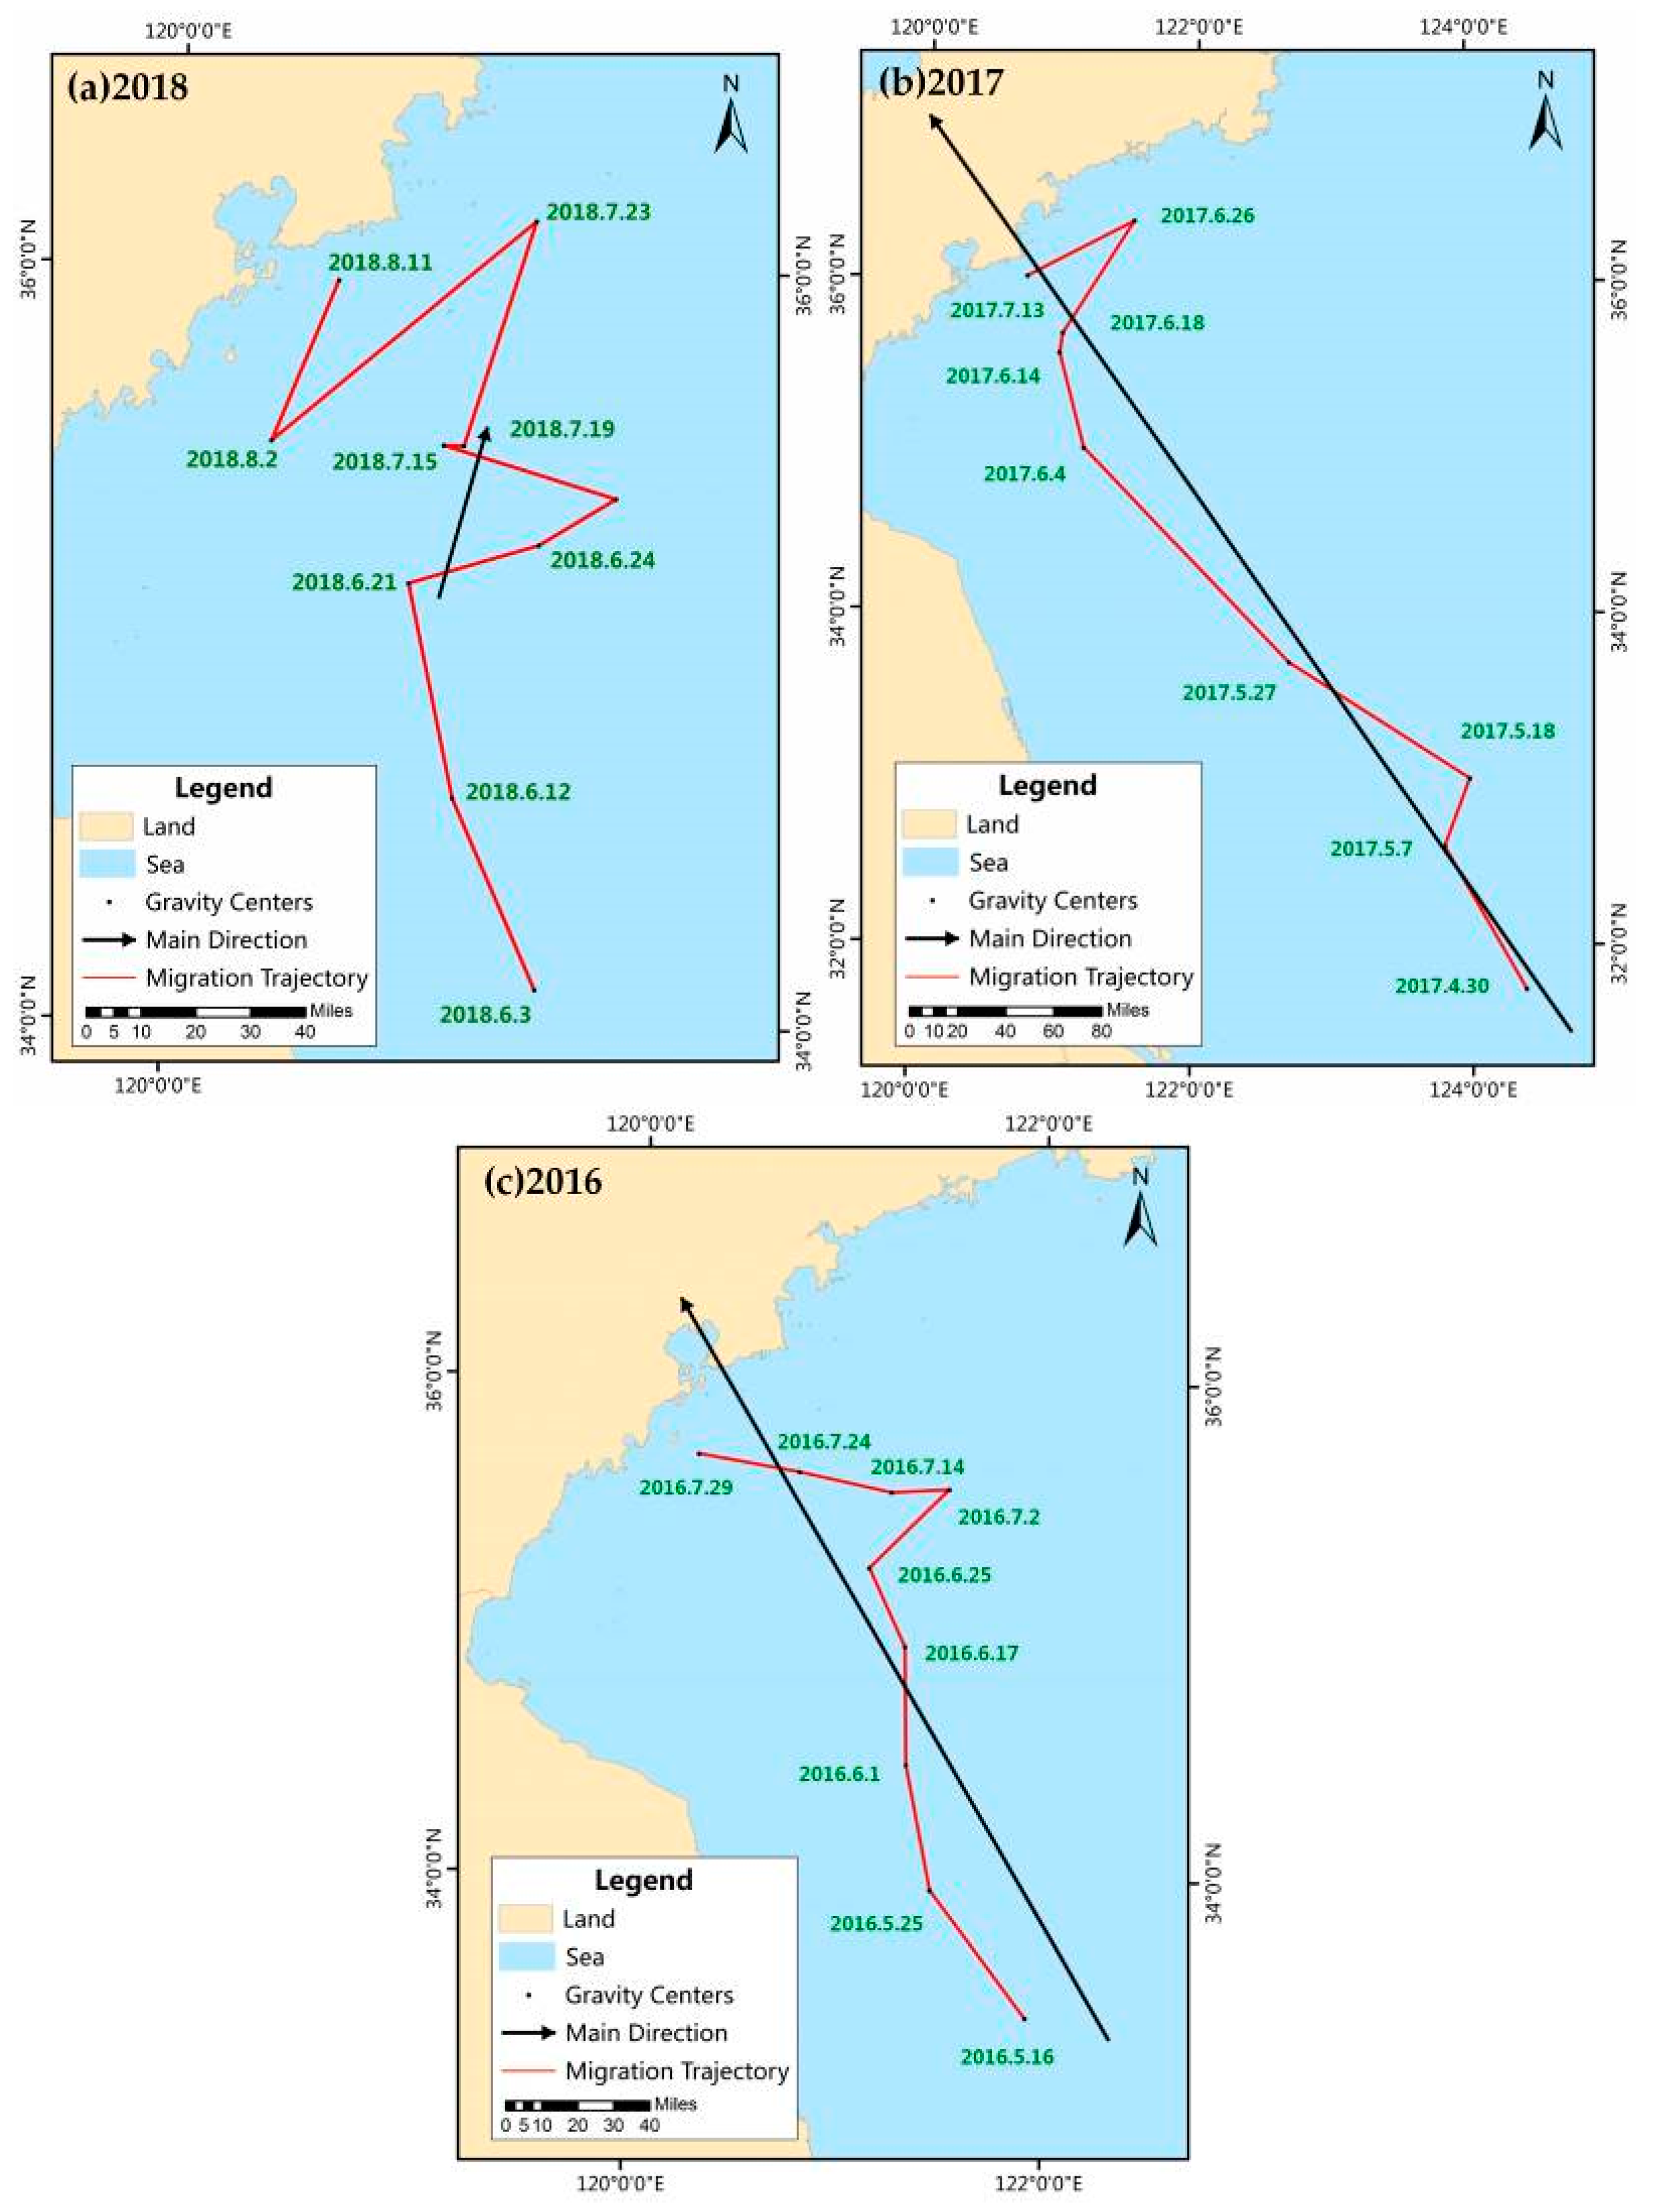
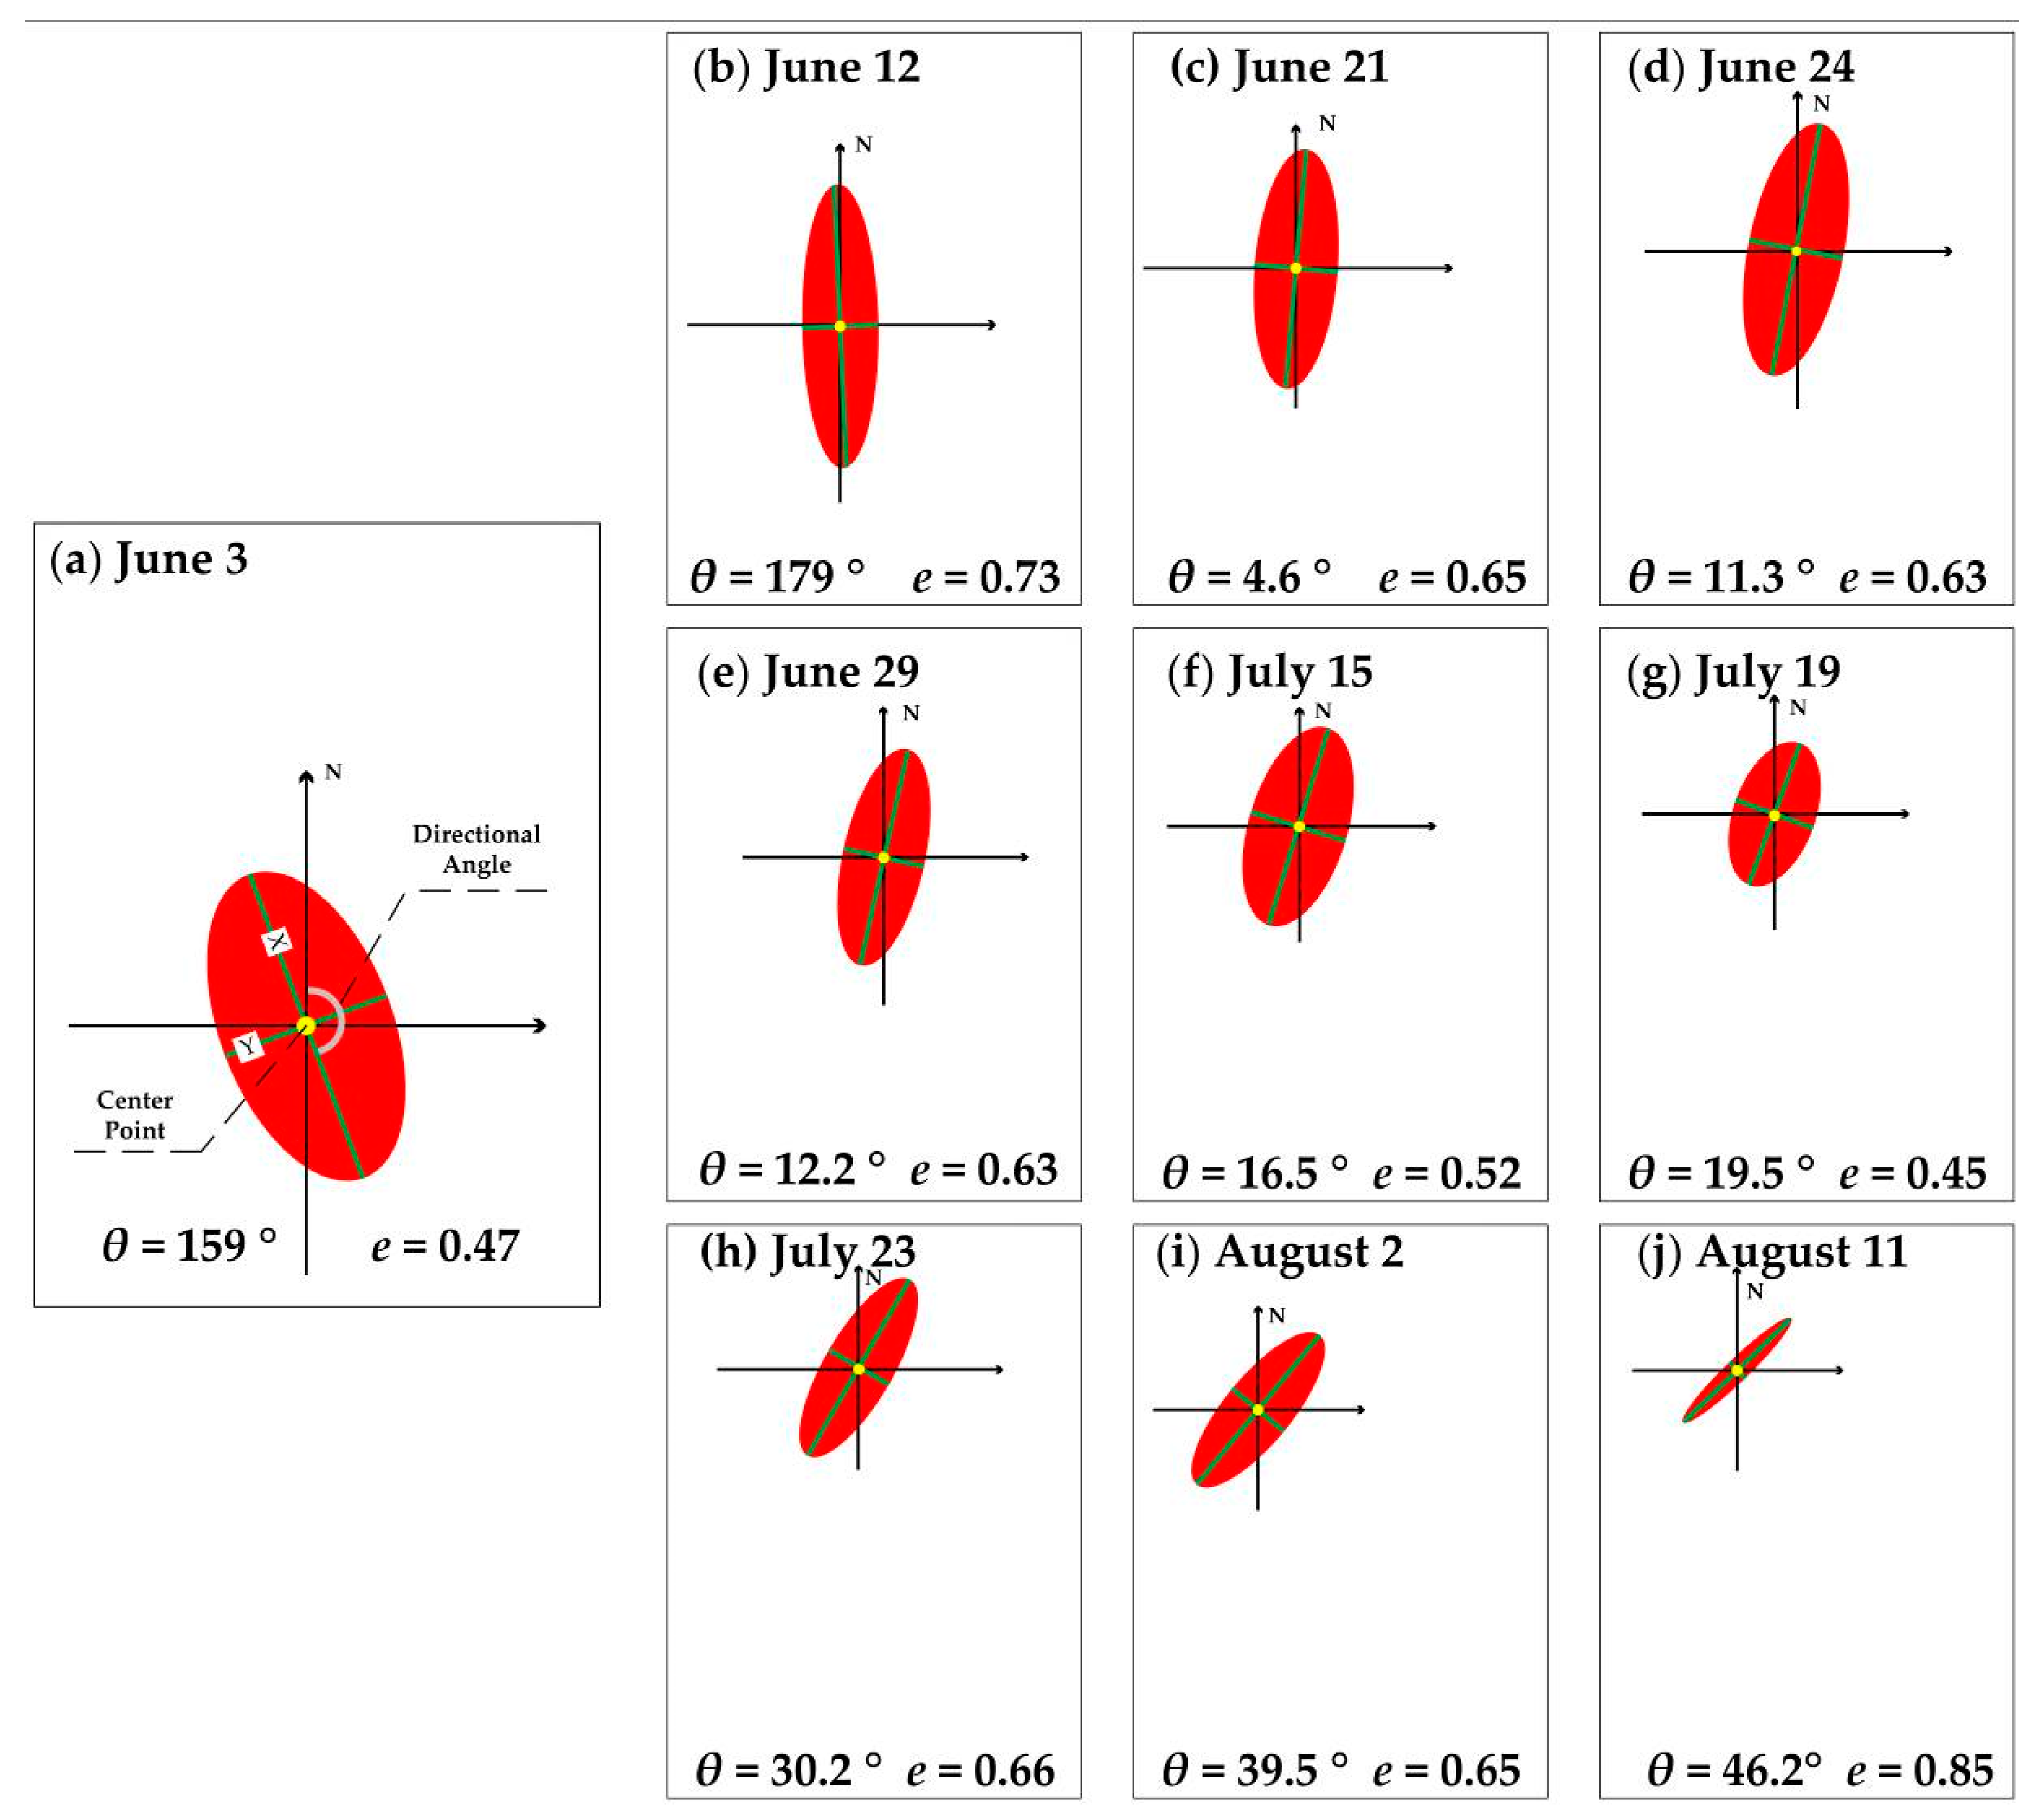
U. prolifera discovered for the first time on June 3 in 2018 (
Figure 4a), the scale was still small, and growth was mainly distributed along the coastline of Jiangsu Province. However, because of the poor quality of MODIS images due to meteorological factors in this year, it was impossible to judge the exact starting position and time of
U. prolifera. Fortunately, the initial time that
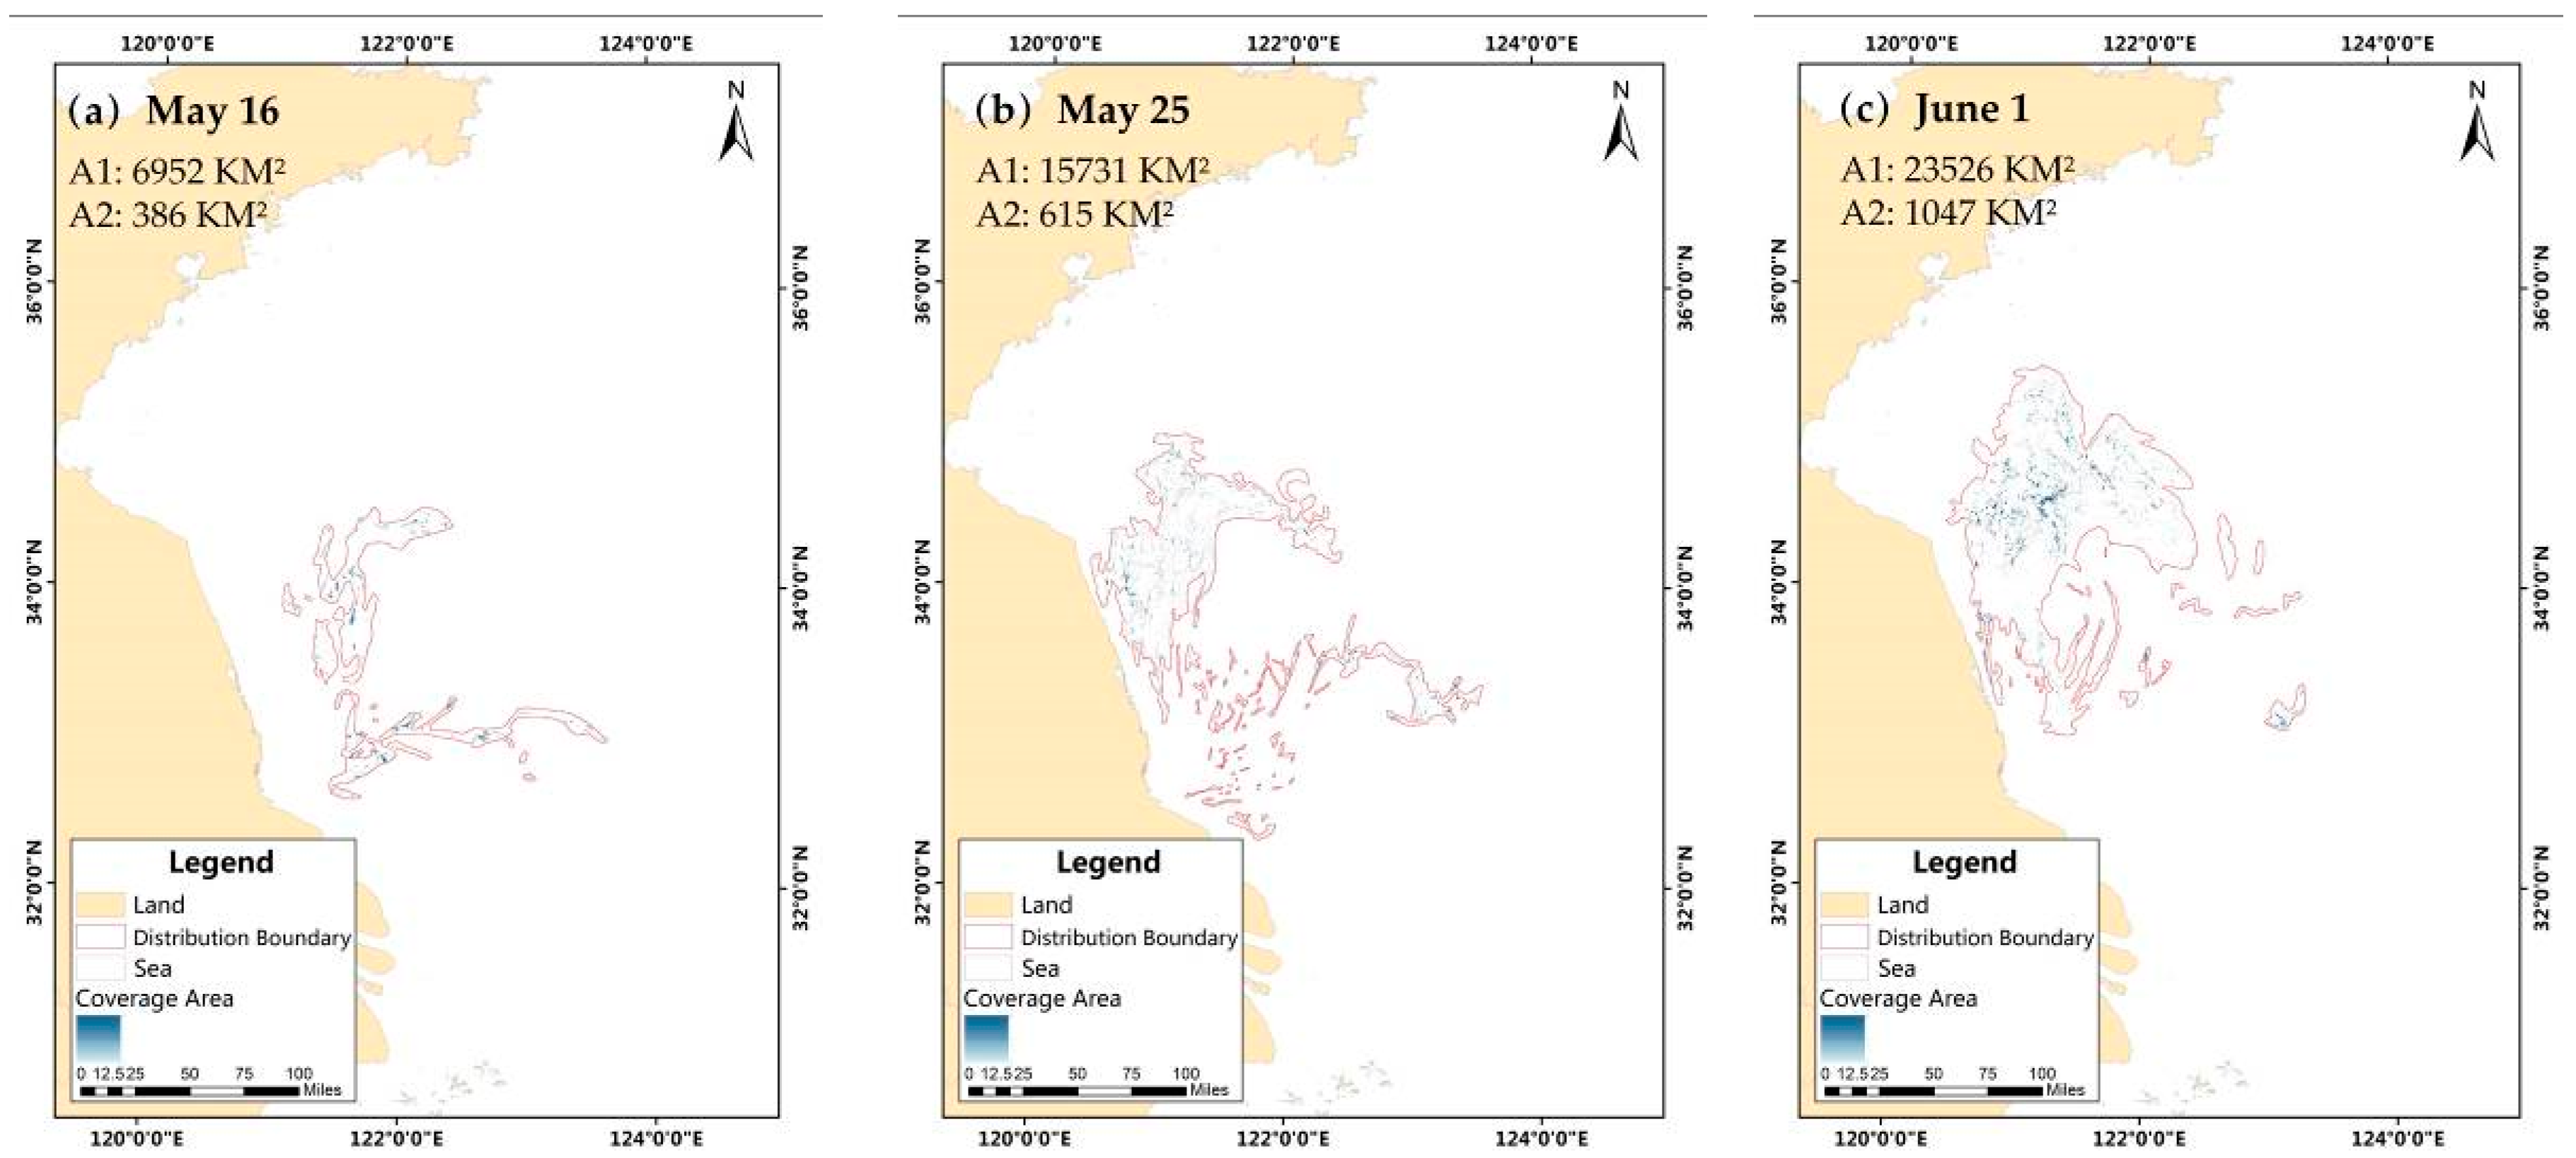
U. prolifera was found in 2016 was May 15, with a smaller distribution area and a similar position as in 2018 (
Figure 5a). This discovery may help with speculation on the origination of
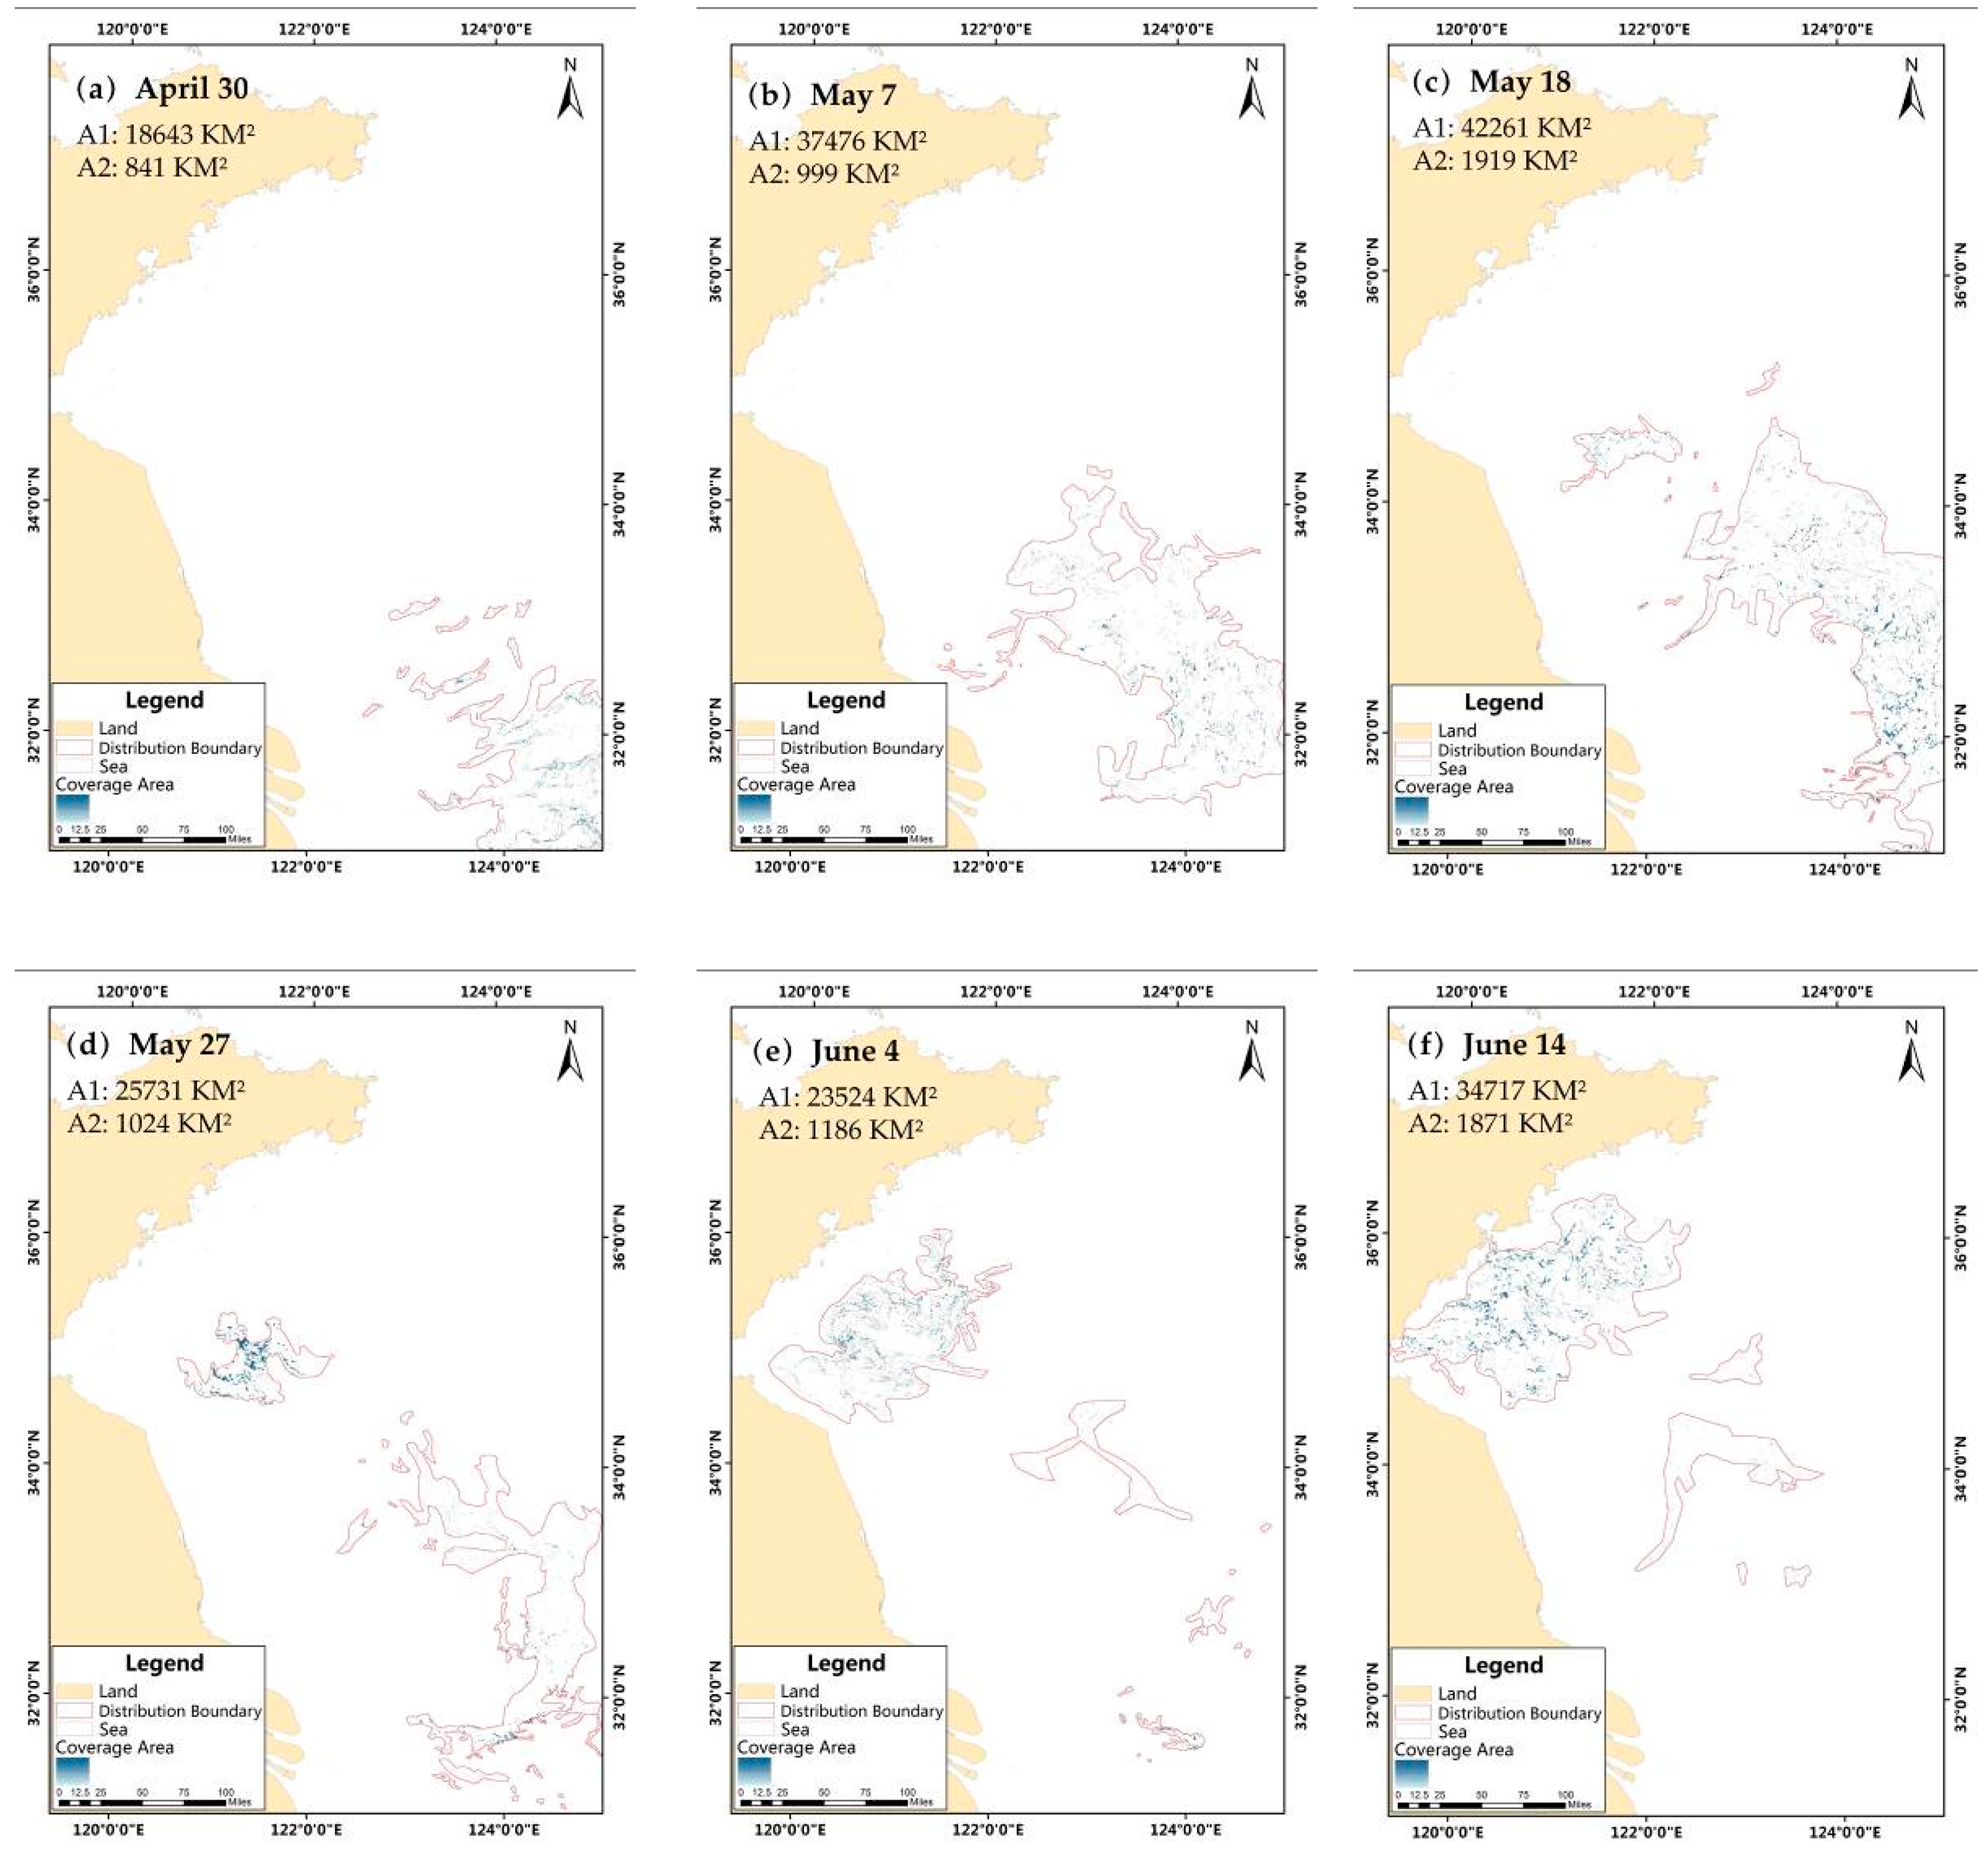
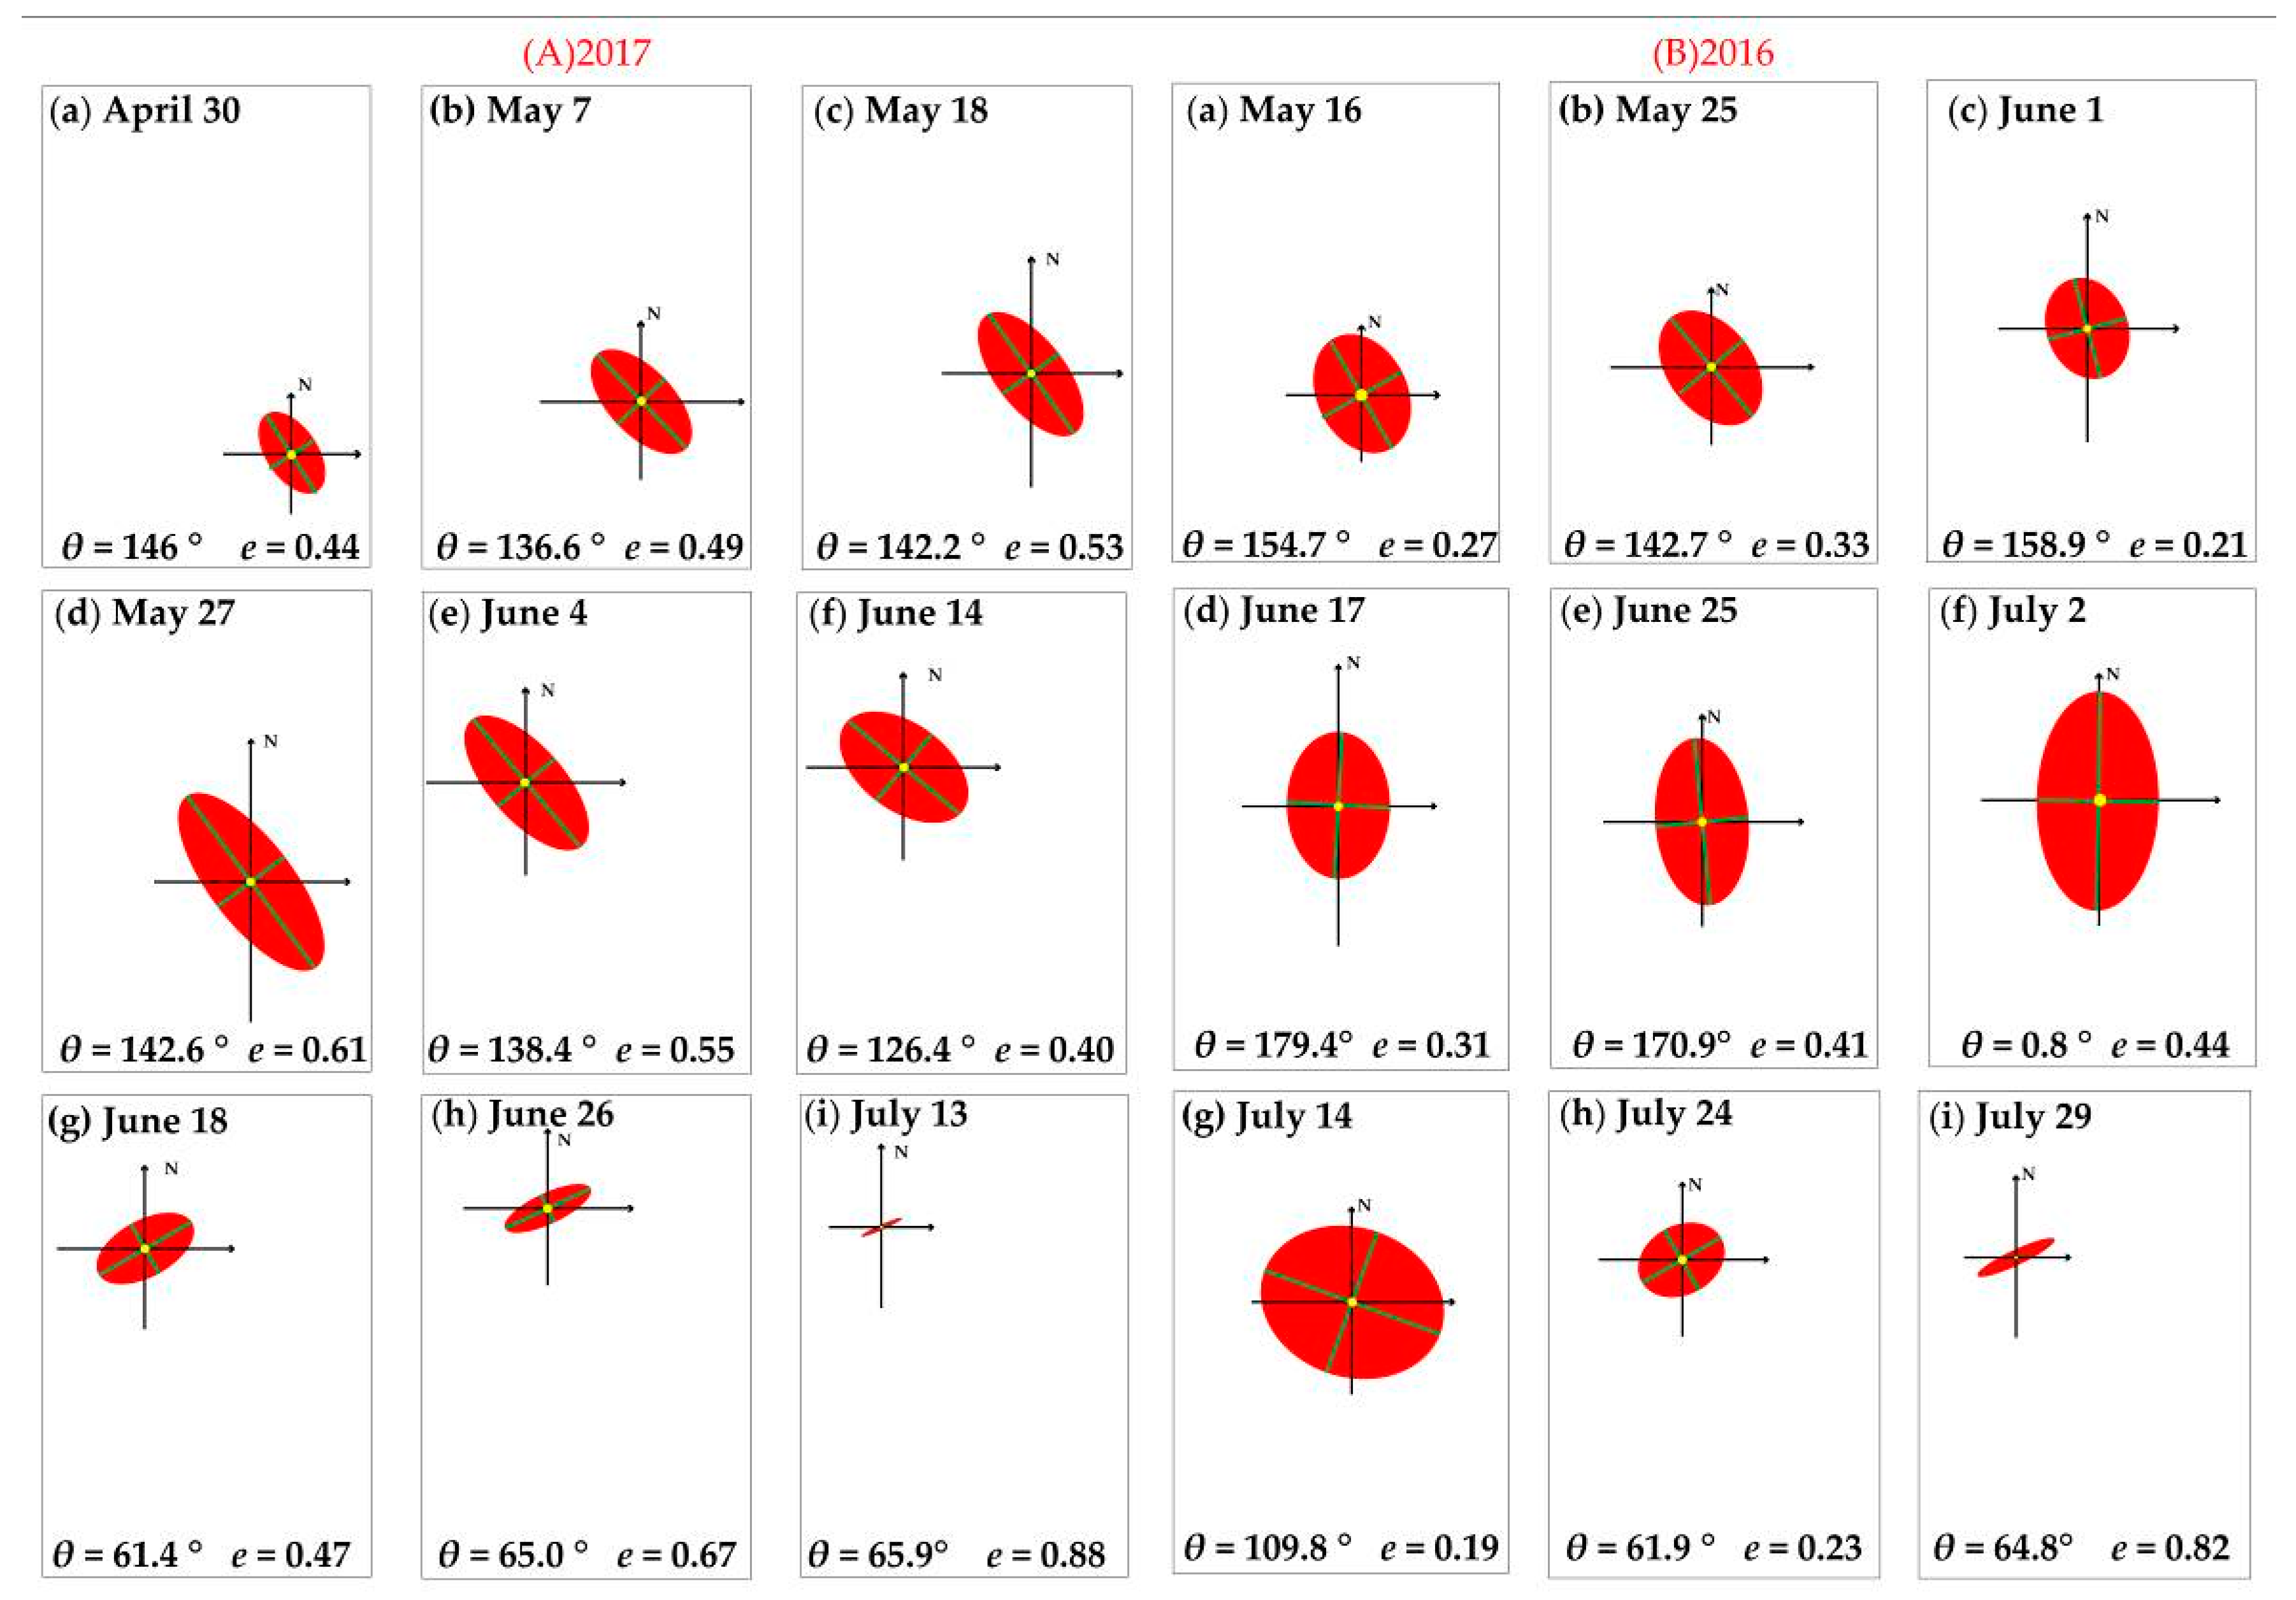
U. prolifera in 2018. In terms of source tracing, unlike other years, 2017 presented a double-source phenomenon. On April 30 (
Figure 6a), the
U. prolifera was firstly discovered in the southeast corner of the Yellow Sea. On May 18 (
Figure 6c),
U. prolifera was founded near Jiangsu Province. Since the location span was very large, the time interval was short, and since then the growth of enteromorpha shown an obvious characteristic of rapid outbreak of one end and rapid disappearance of the other end, two different sources may be considered. Based on the analysis above, the hypothesis that Subei Shoal was the source of phytoplankton was confirmed again, though it was probably not the only source. Earlier investigations also indicated that the free-floating green tides in the Yellow Sea drifted to the southern coast of Shandong Province from June to August [
10,
16]. From 2016 to 2018, the floating angle has maintained a trend of gradual northward drift, accompanied by one or more north-to-south detours and finally drifted and died out near the vicinity of Qingdao.
Secondly, the overall situation of green tide events in 2016–2018 remained serious. Wu et al. [
34] stated that from 2008 to 2012, the areas in 2008 and 2009 were obviously larger than in other years, with a maximum coverage area of 3451.19 km
2 and 2767 km
2 and an affected area of 23,475 km
2 and 26,234 km
2 in 2008 and 2009 respectively. From 2010 to 2012, the area was greatly reduced and relatively stable. However, Yang et al. [
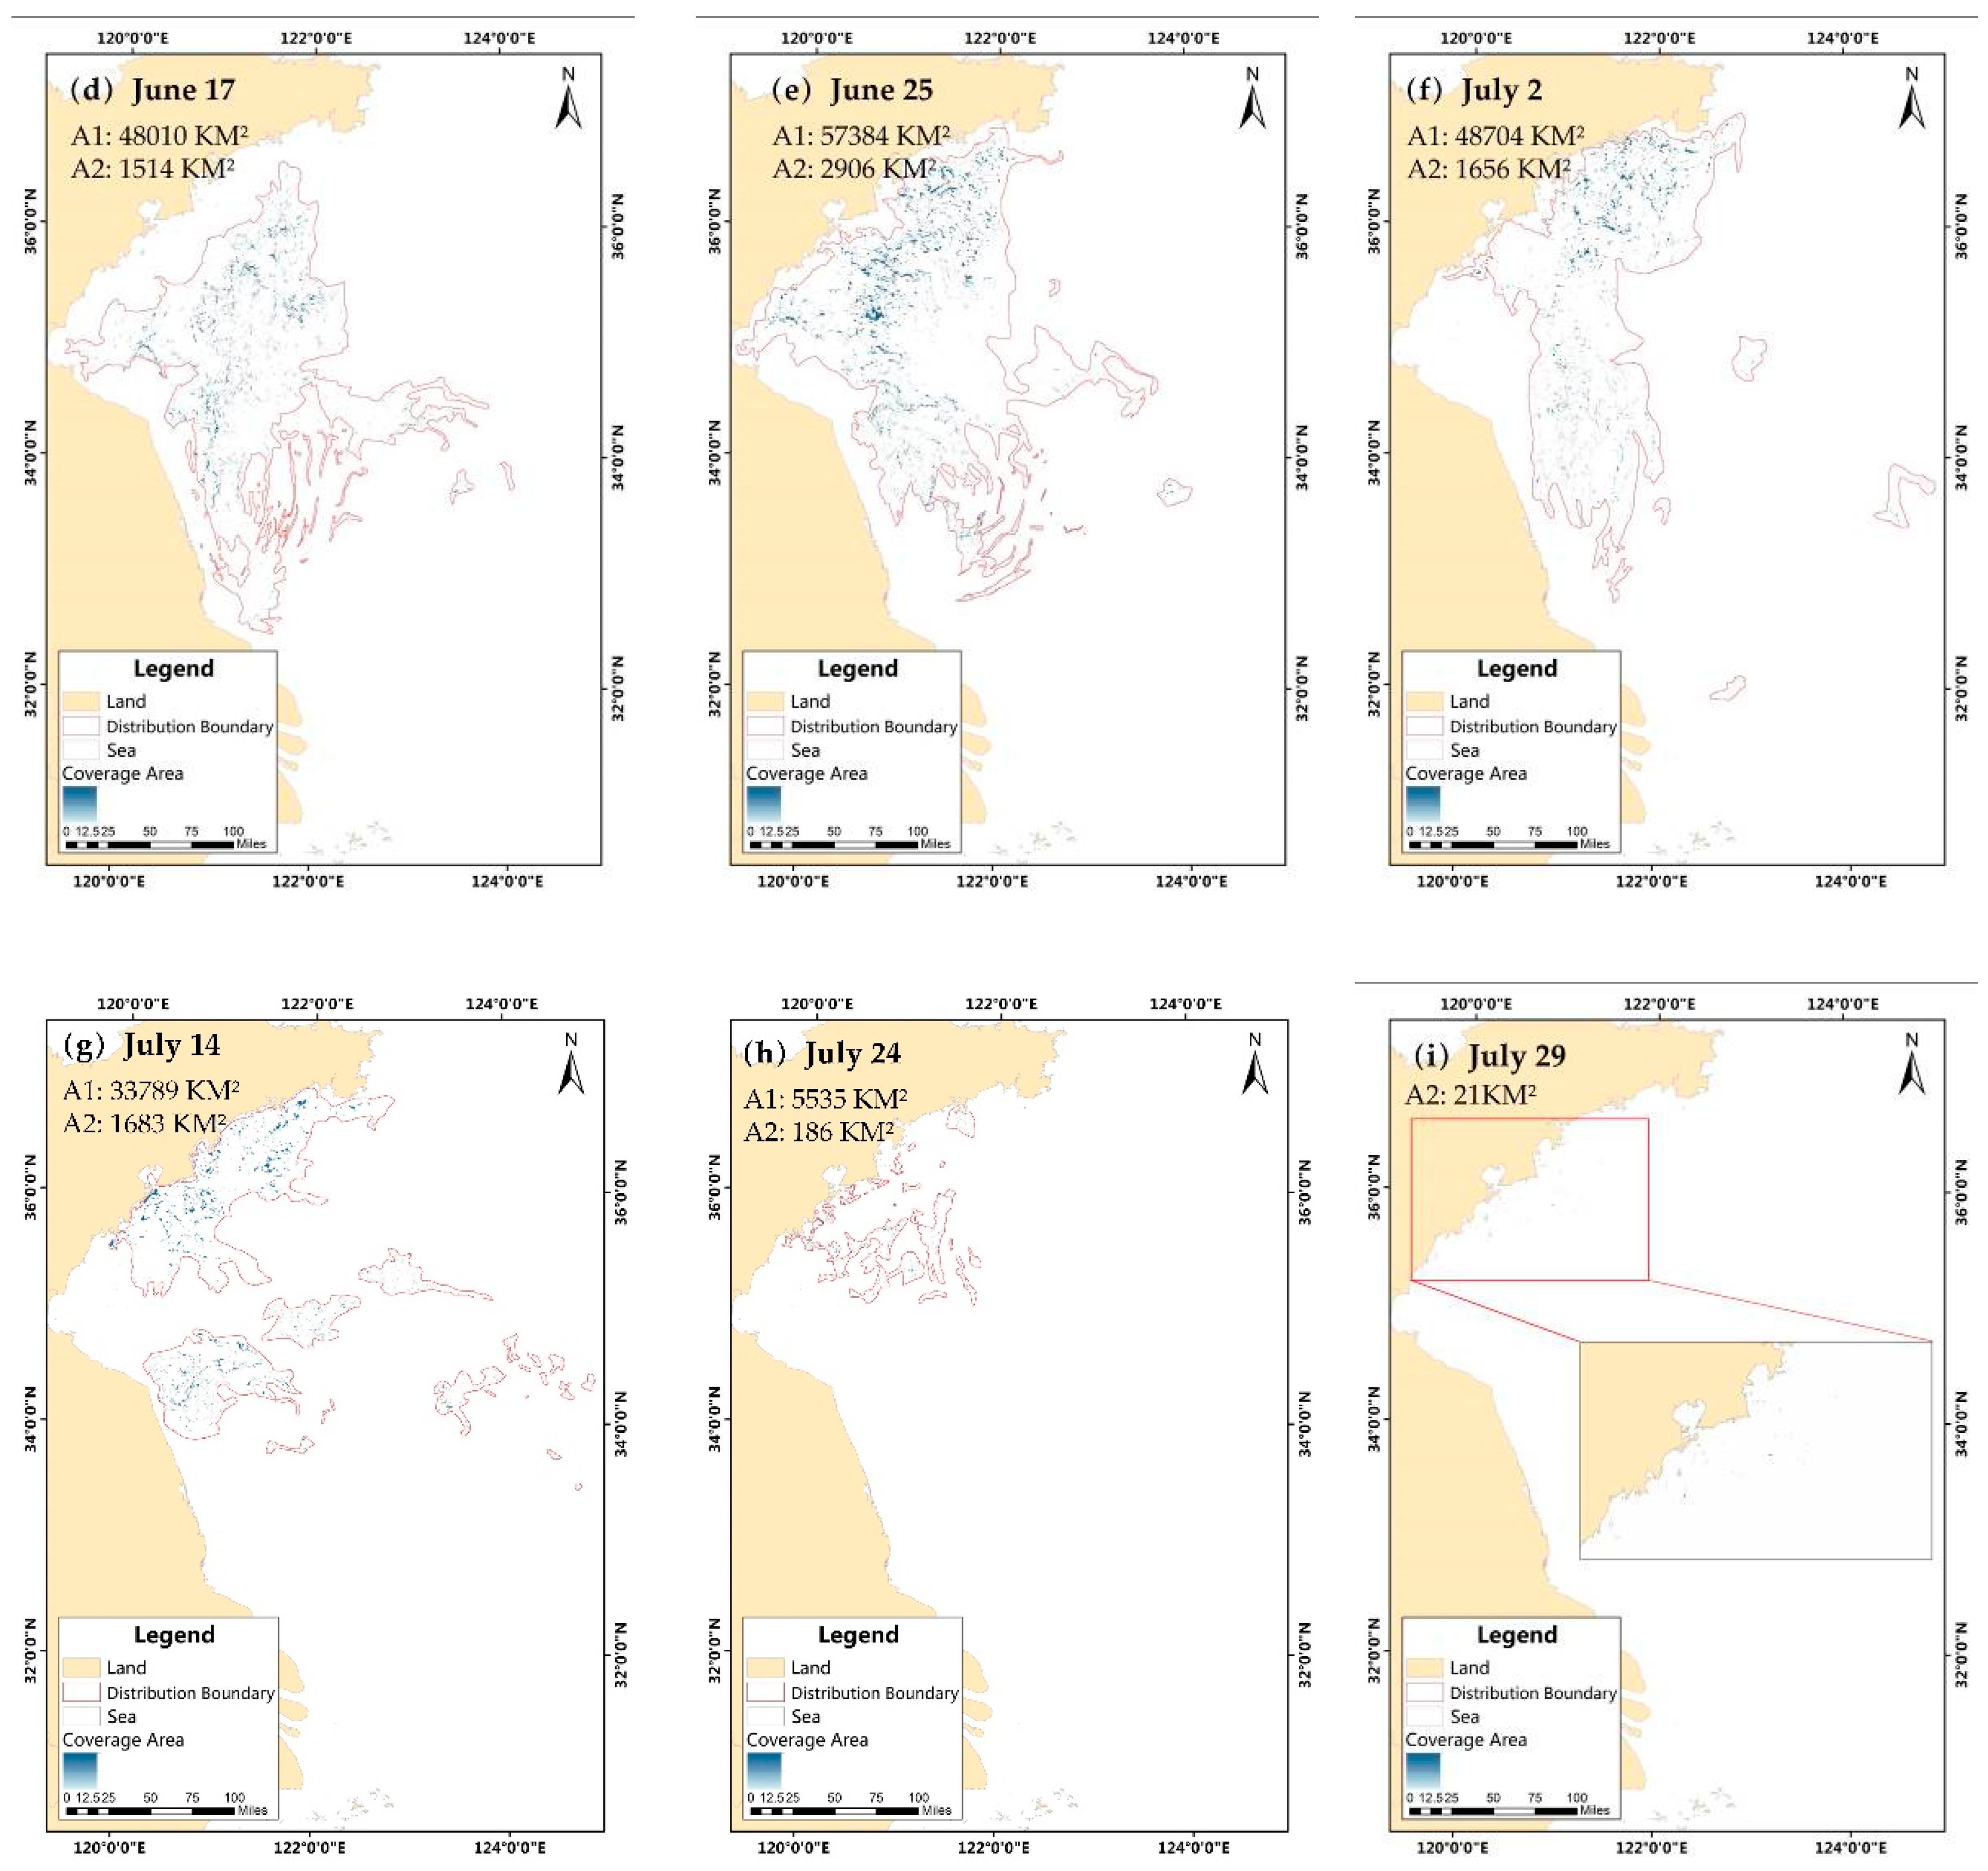
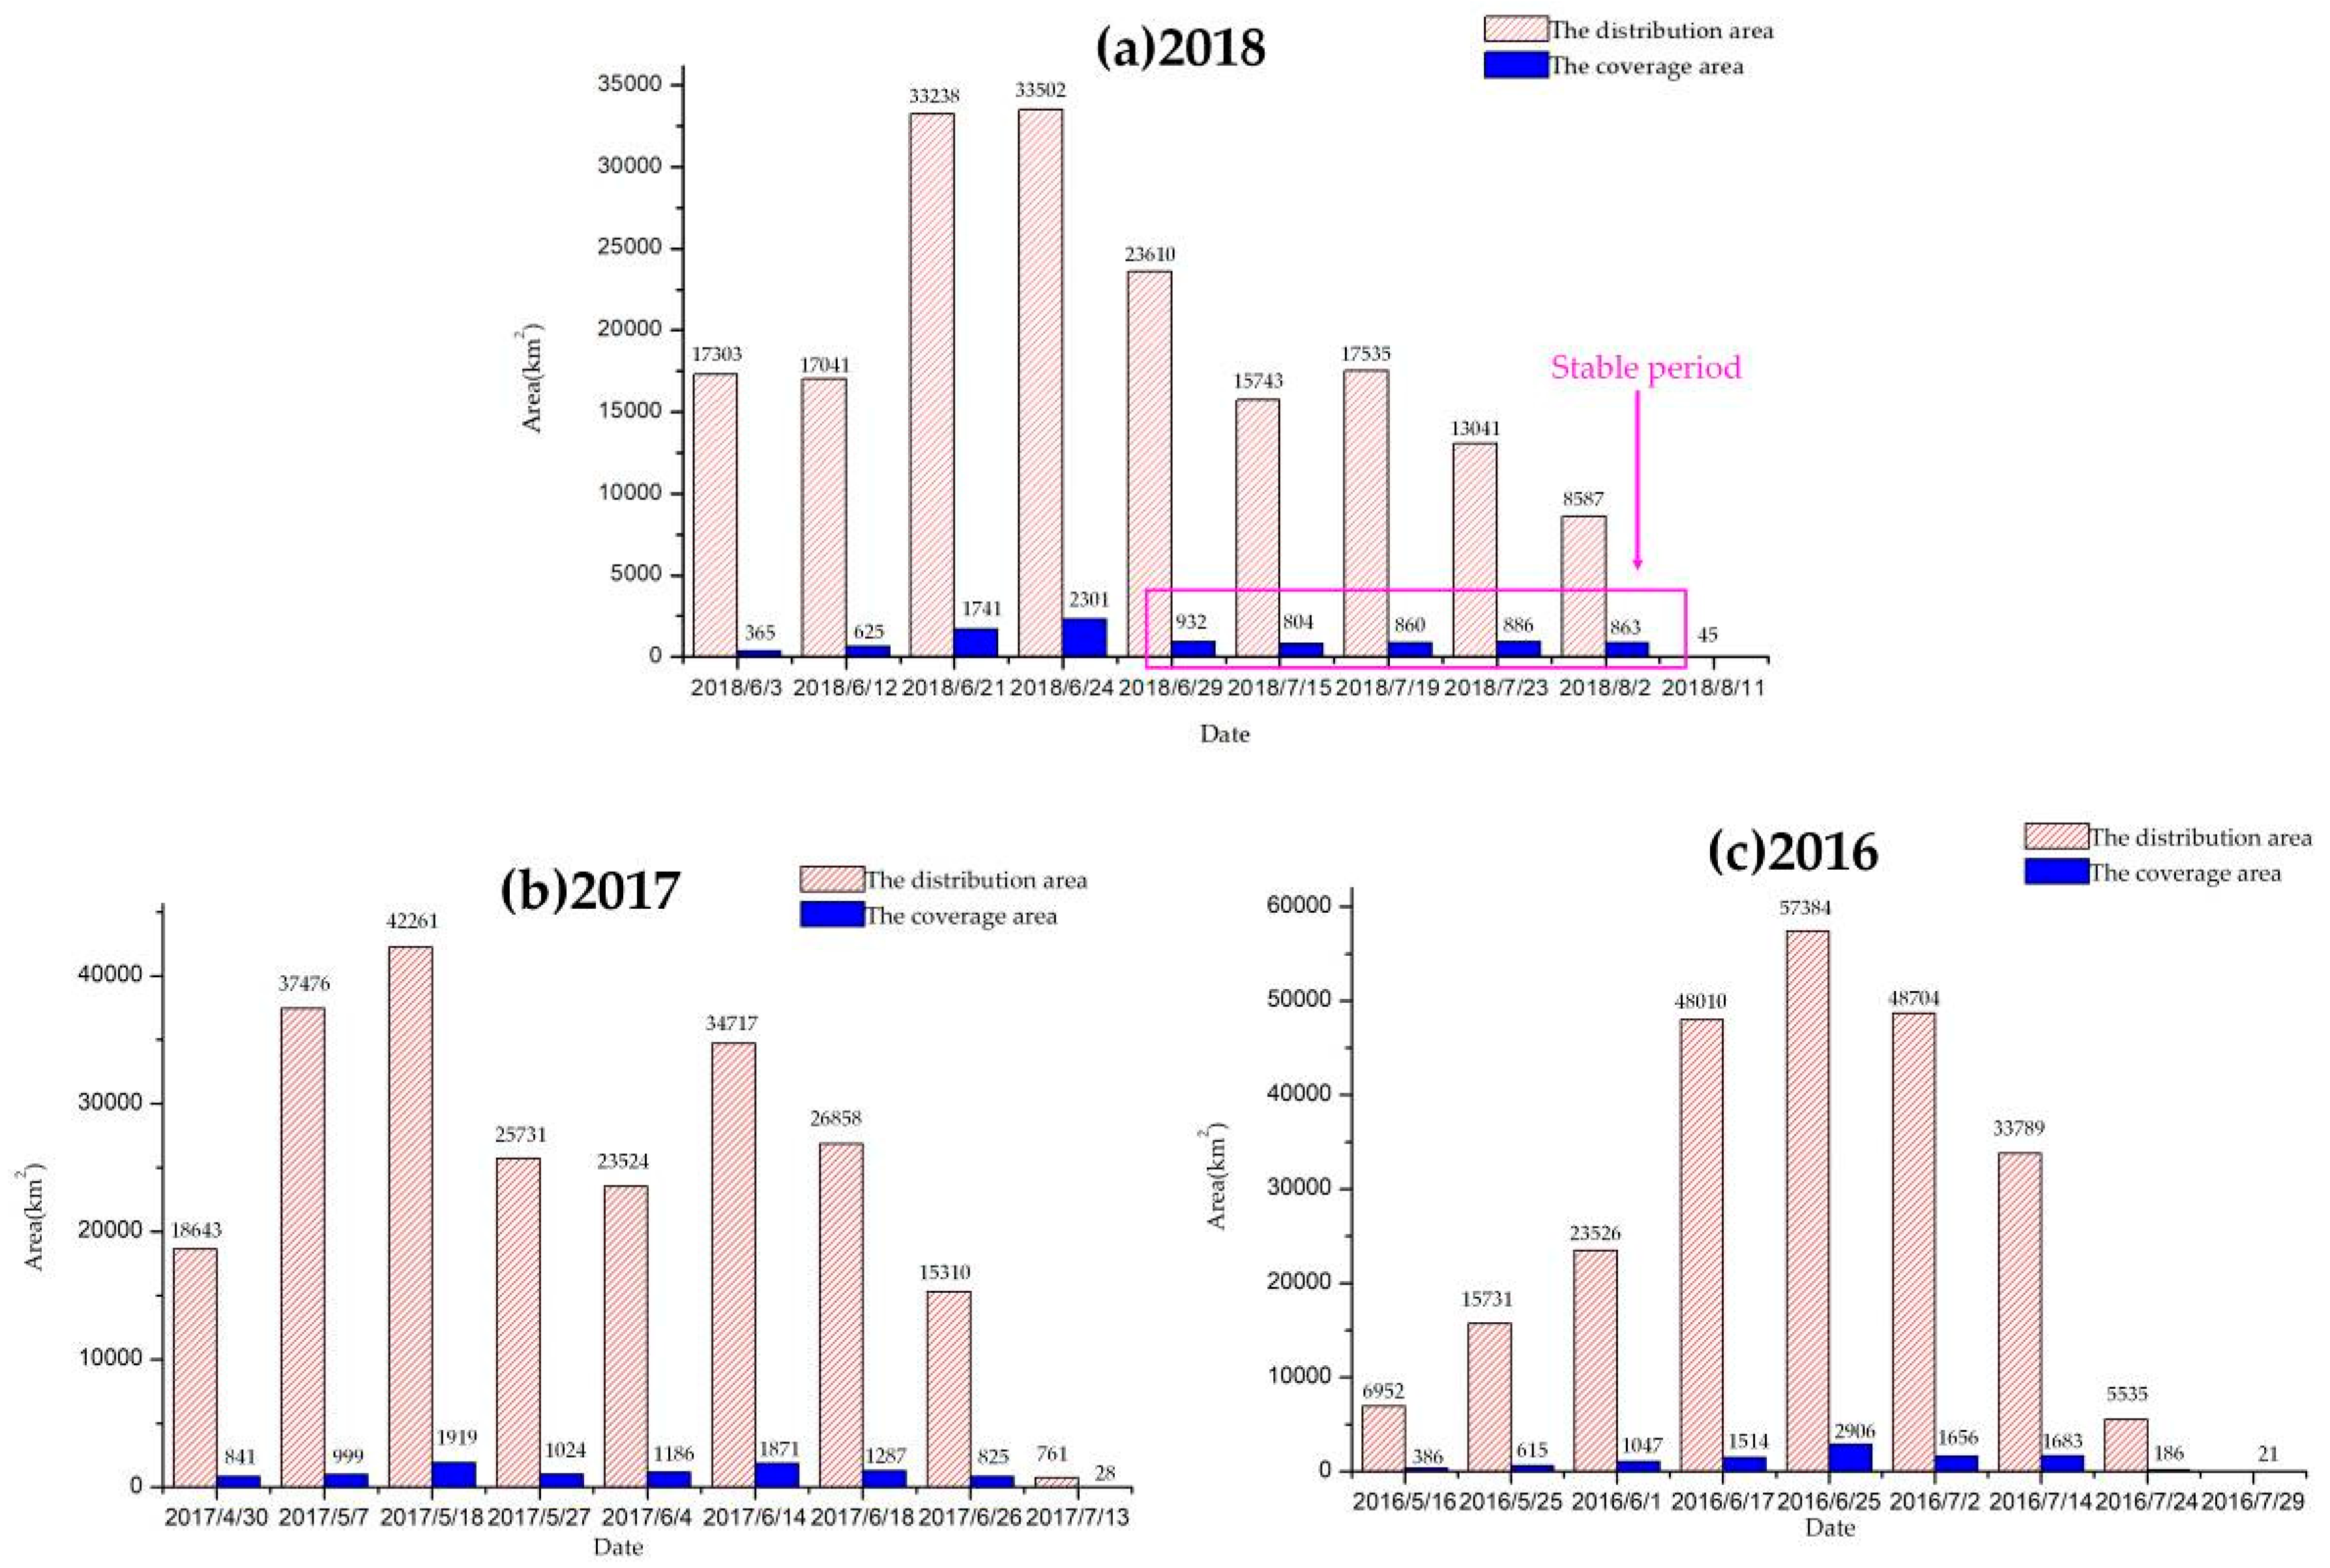
35] claimed that the maximum distribution area of green tide was increasing year by year from 2011 to 2016. During the three years 2016–2018 in this study, the maximum distribution and coverage area were 57,384 km
2 and 2906 km
2 in 2016. In the following two years, the distribution and coverage area relatively decreased, but still lead to a tremendous influenced marine area.
Normally, the development of macroalgal blooms in the Yellow Sea goes through five major stages: appearance, development, outbreak, decline (management), and disappearance [
36]. From an interannual perspective, the five stages occur at different time periods in different years. Generally speaking, the earliest time of emergence was between the end of April and the beginning of May [
31], with a relatively small coverage area and taking the form of algae filaments floating on the sea surface. In mid- to late May, as temperature, nutrient concentration, and other factors increased, the green tide continuously expanded. After the outbreak period in June and July, some green tide landfall occurred. Following a decrease in the coverage and distribution areas, the extinction period occurred in August [
34].
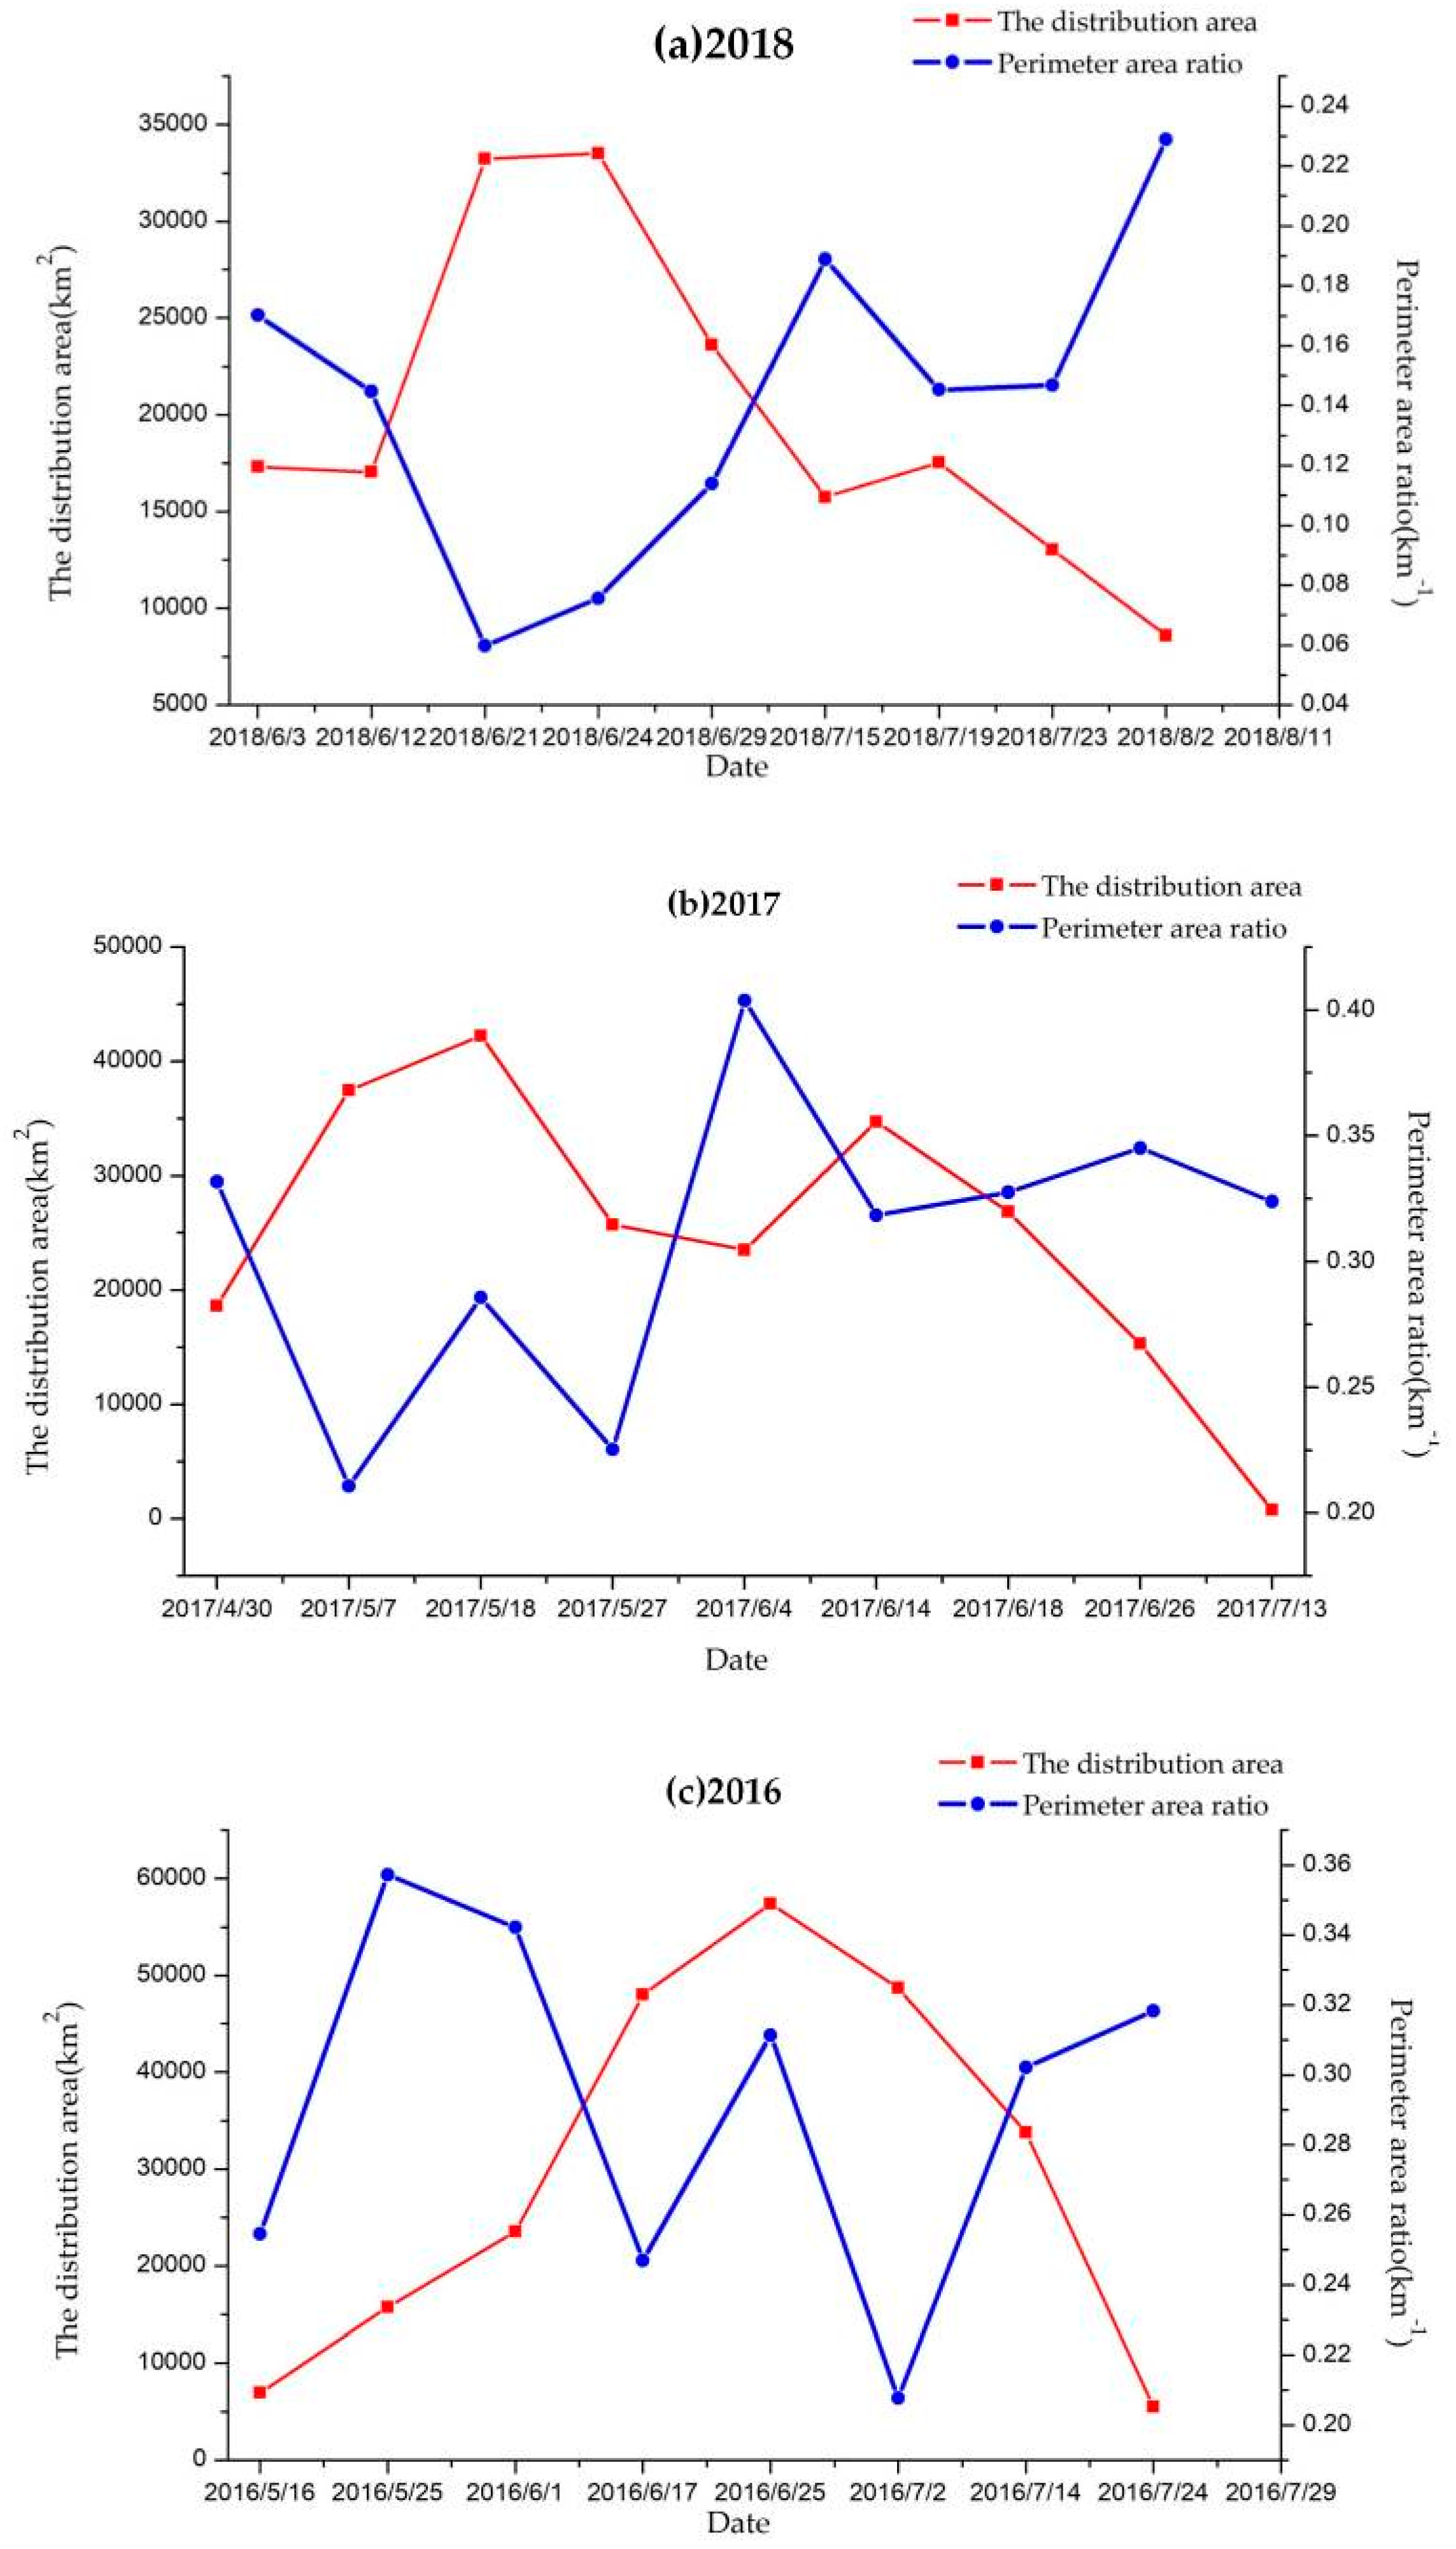
In 2016 (
Figure 14c), the growth of
U. prolifera conformed to five growth stages, which appeared in mid-May, after a period of development, broke out in June. Since peaking on June 25, it declined rapidly and disappeared in late July. In contrast, the growth rules of
U. prolifera in 2017 were quite different. In contrast, the growth rules of
U. prolifera in 2017 (
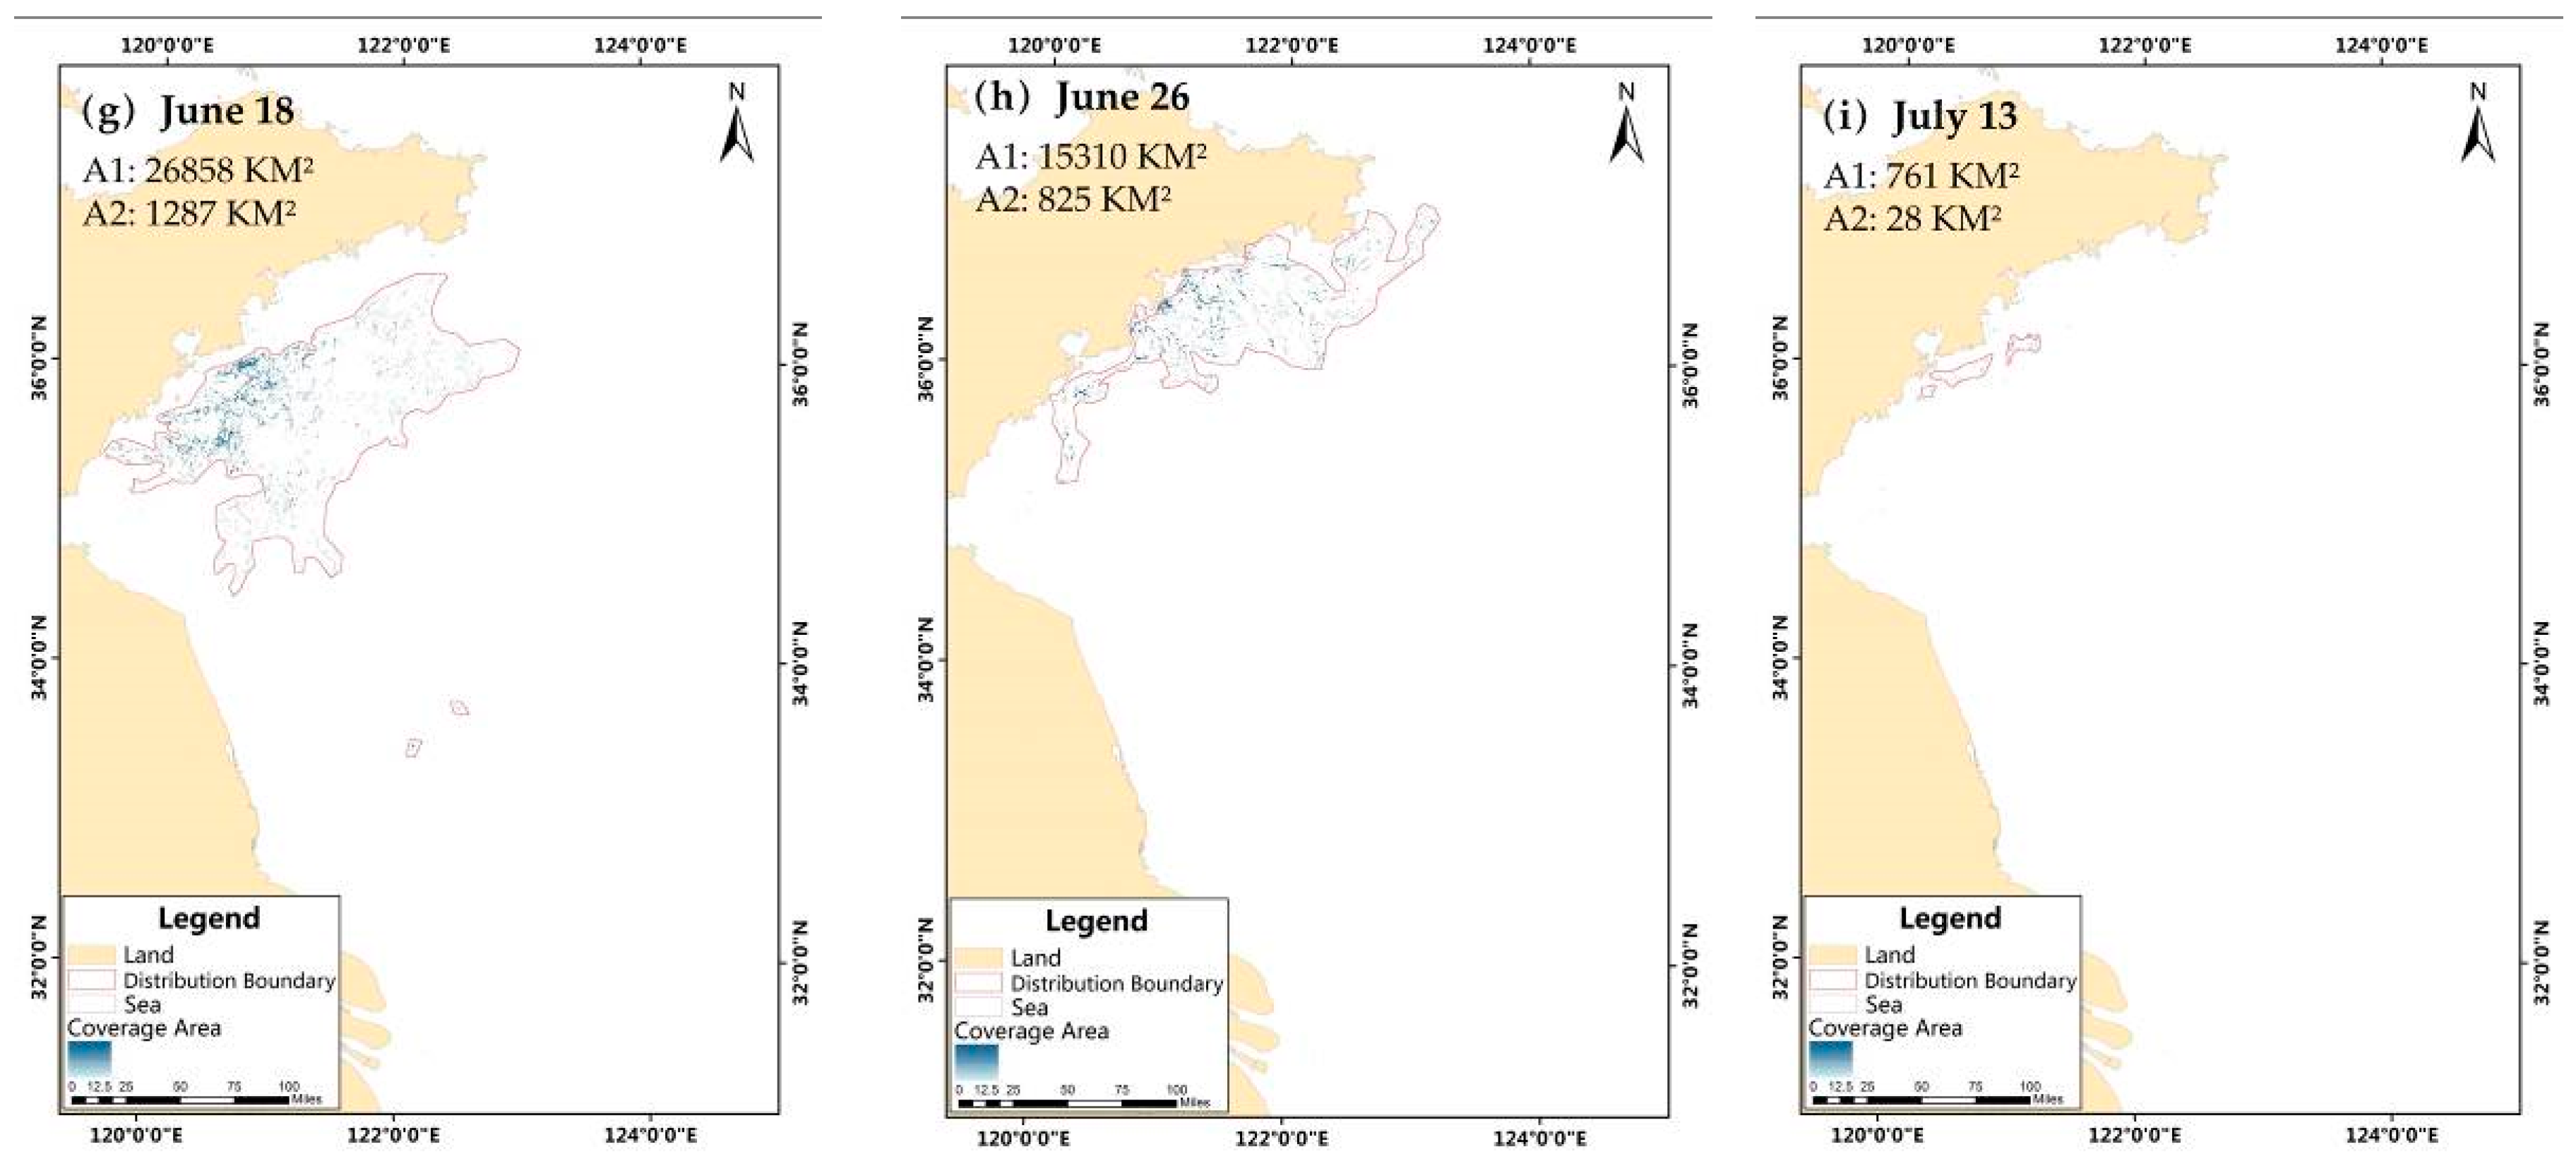
Figure 14b) were quite different, where two peaks occurred. From the end of April to the end of June, the scale of the floating angle was maintained at a relatively large level. The distribution area expended first, with a maximum occurring on May 18, and then it decreased until early June. In the middle of June,
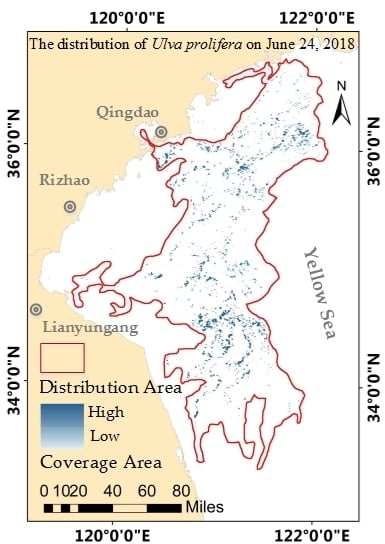
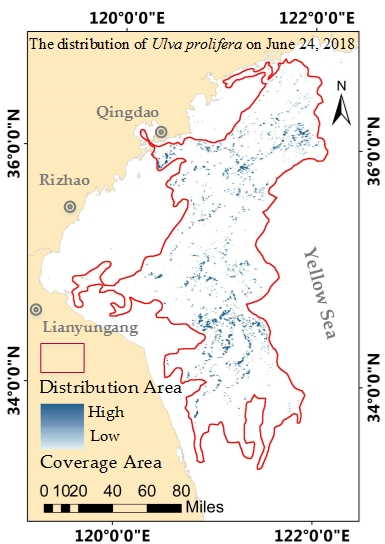
U. prolifera increased again and the coverage area reached the largest value of this year. After that, it shrunk quickly and almost died out in mid-July. In 2018 (
Figure 14a), the variation in distribution area was almost consistent with previous years. Before June 3, the growth of
U. prolifera was stable at the development stage. The outbreak began in mid-June, reached its peak on June 24, and then gradually decreased. It is worth noting that the coverage area change was governed by a different law. Between June 3 and 12, when the distribution area was stable, the coverage area doubled. After reaching a peak on June 24, the coverage area contracted sharply at first, and then remained on a plateau for nearly one month. This raises the problem of whether the coverage area was truly unchanged during this period. To answer this question, the migration trajectory was examined. From June 29 to August 2, when the macroalgal mat remained stable, there was a significant shift in the center of gravity of the coverage area. The interaction of the wind and tide fields most likely accounted for this dynamic change (this was discussed in
Section 4.2).
4.2. Influencing Factors of U. prolifera Migration
Generally, the changes in
U. prolifera distribution are closely related to environmental factors. The growth of
U. prolifera has a wide range of adaptation to seawater temperature, salinity, pH, and light intensity due to its undemanding requirements for marine environmental conditions [
29]. Therefore, the main reasons for the migration were considered to be wind fields and ocean currents. Bao et al. [
16] used a coastal ocean model to identify the processes that drive green algae drift. The results showed that, without wind, the research object displayed a tendency to move northward, but it was unable to move out of Subei Shoal. According to the drift path shown in
Figure 8, a large area of algae was distributed outside Subei Shoal. Hence, this study focused on the relationship between
U. prolifera migration and wind direction and speed.
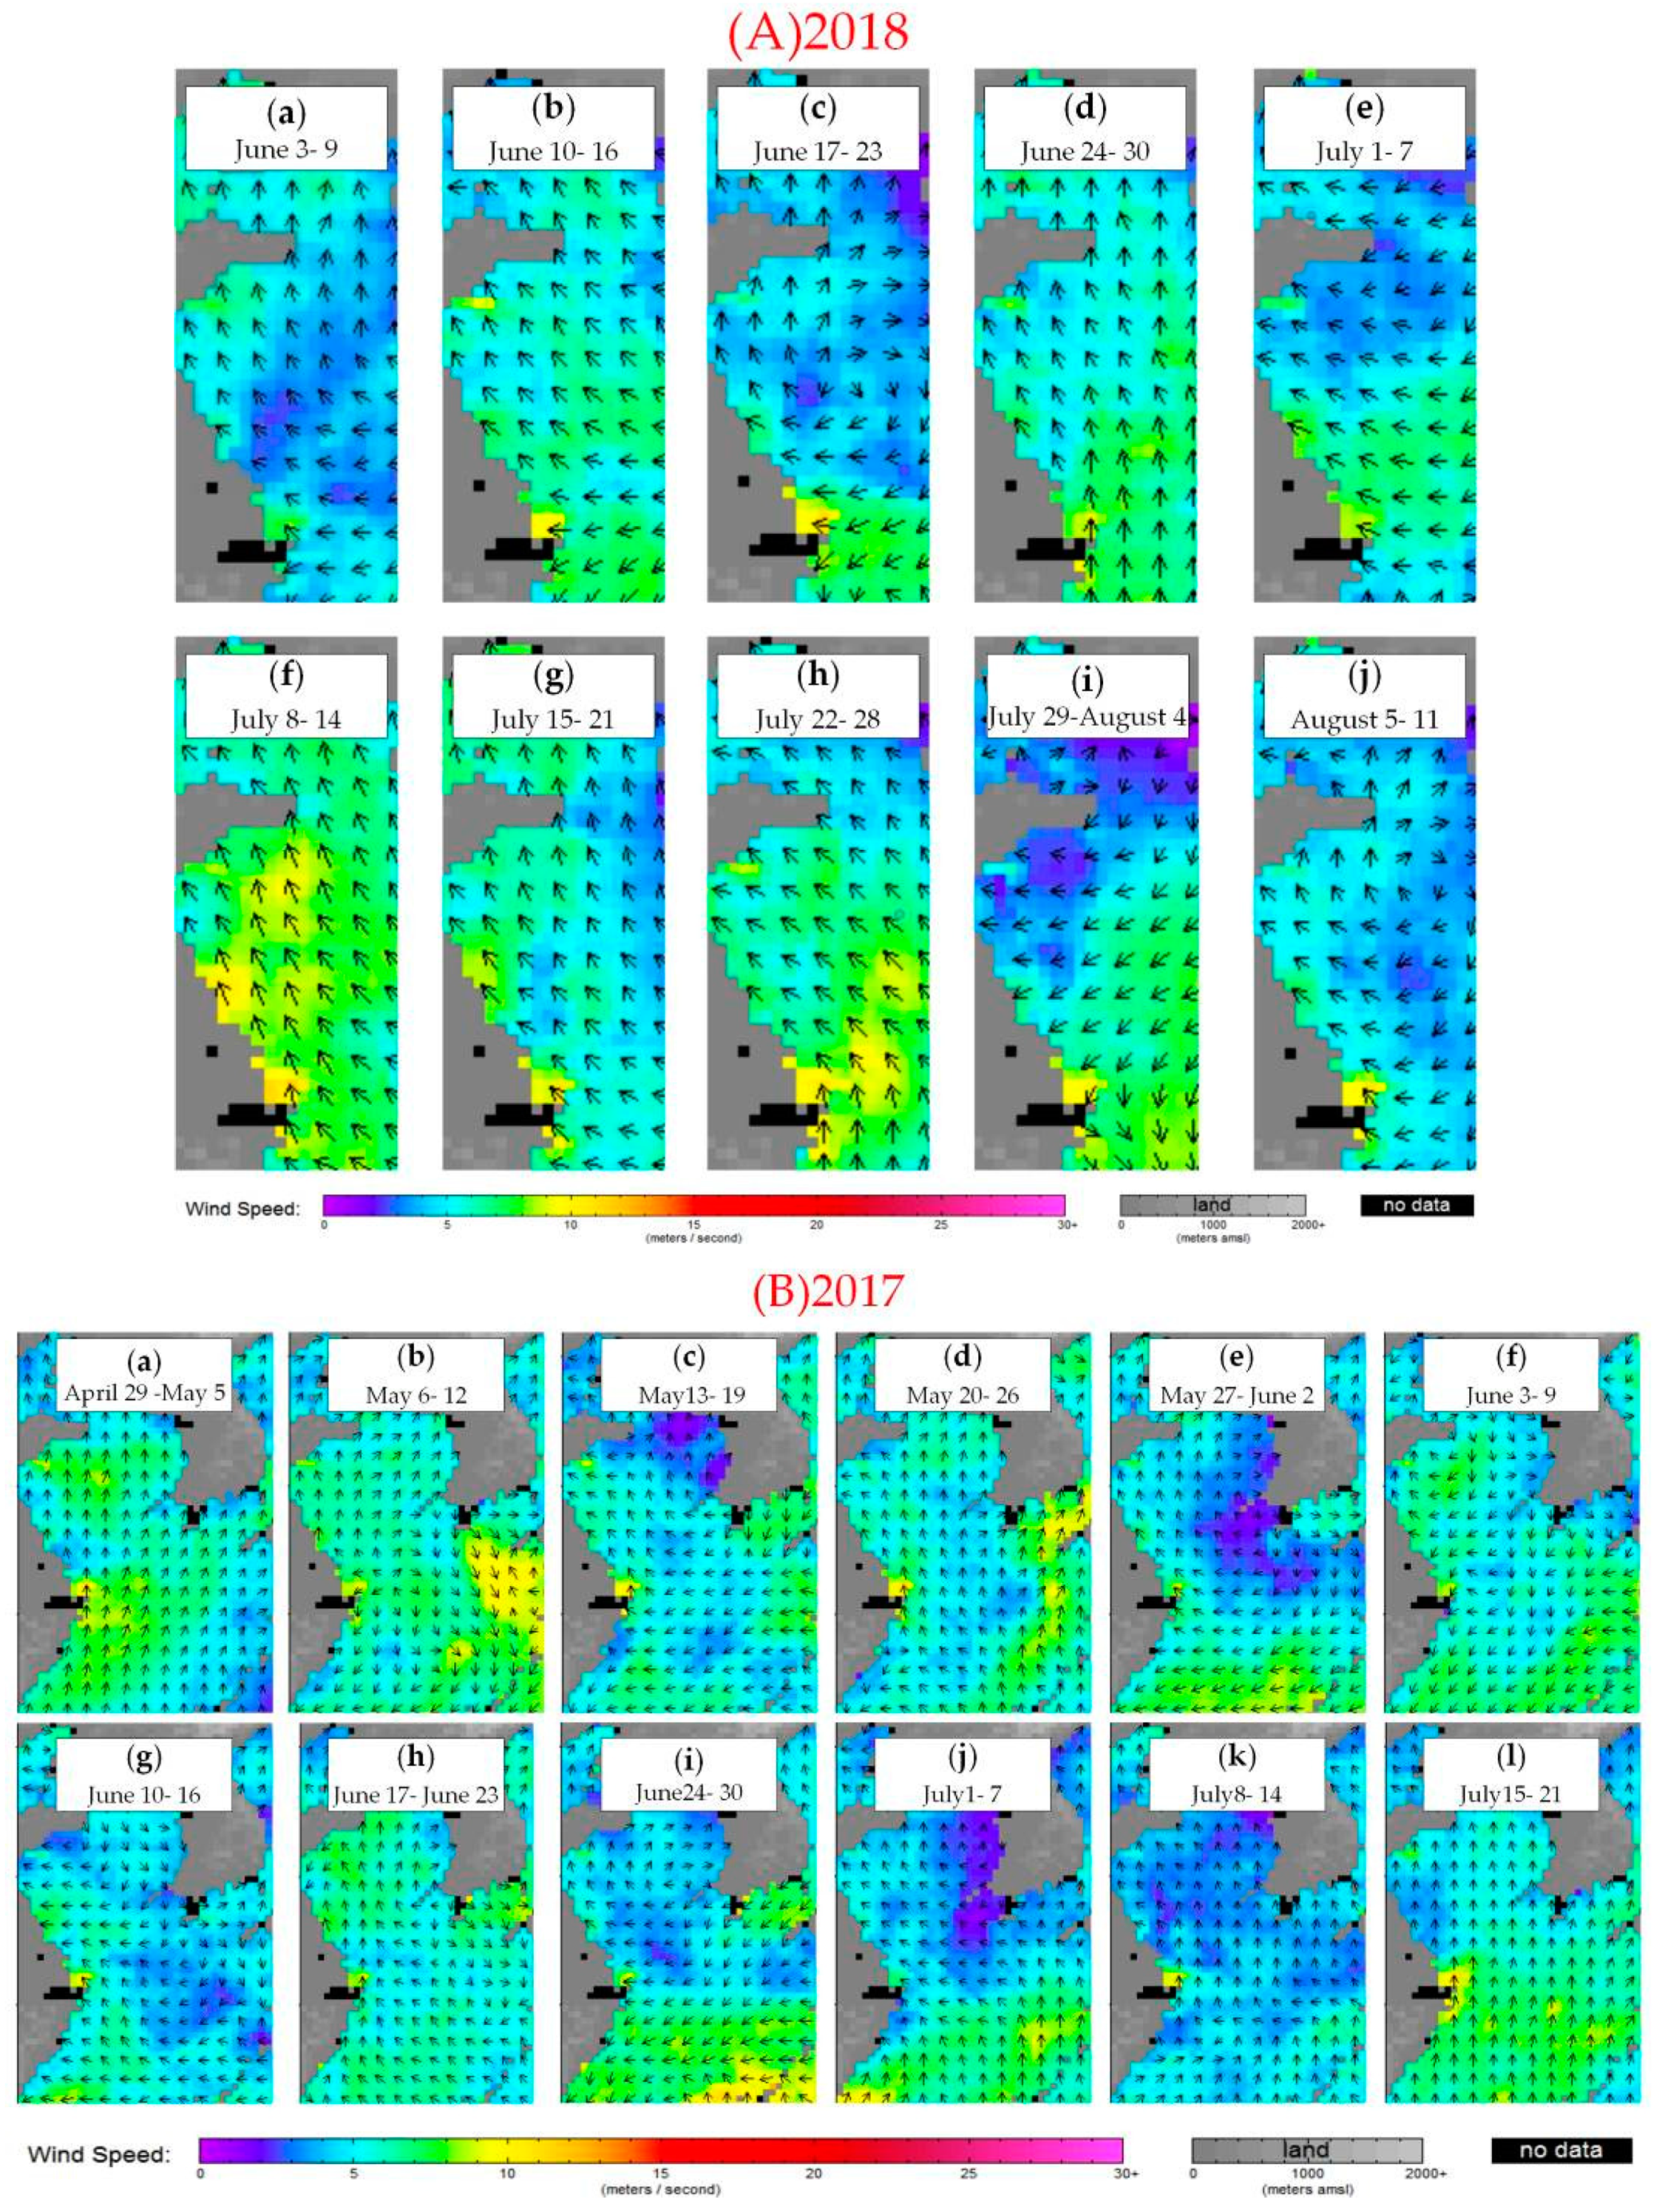
To achieve the aim mentioned above, weekly average sea-surface wind (SSW) in the Yellow Sea during the monitoring periods in 2016–2018 was obtained from remote-sensing systems, (RSS) and is shown in
Figure 15. Taking 2018 as an example, the detailed analysis is as follows: clearly, from early to mid-June, the northwest SSW gradually strengthened. During this period, the center of gravity of
U. prolifera presented a constant northwesterly movement, with an increasing amplitude of variation. From June 17 to June 23, a circular wind in the clockwise direction appeared. In the occurrence area of
U. prolifera, the wind direction changed from northwest to northeast, which led to a sudden change in the migration path of the center of gravity. Starting from June 21, the barycenter moved eastward, reaching its easternmost position of this year on June 29. However, after the beginning of July, the direction of the SSW reversed again, resulting in the center of gravity turning from east to west until mid-July. After that, the SSW remained constant from the northwest for a long time, and the wind speed was relatively stable. From the end of July to early August, the wind speed obviously weakened, and the direction deflected southward from the northwest. This explained the abnormal phenomenon of the southward barycenter movement. After August 4,
U. prolifera moved northward again as the SSW turned north, and the wind speed slightly increased. Based on the above analysis, the time nodes of SSW changed in direction and speed, and they were consistent, with changes in the
U. prolifera trajectory during the whole monitoring period in 2018.
Most of time during 2017, the drift trajectory of
U.prolifera basically coincided with the direction of the sea wind. It was worth noting that from May 18 to June 4, the movement of the trajectory to the west was tremendous. Especially from May 27 to June 4, in a short period of one week, the span of distance was extremely significant, regardless of the north–south or east–west directions. During this period, although the direction of the sea breeze was consistent, there was no sudden increase in wind speed. It was hard to imagine that such large-span movements were caused by the influence of the sea breeze. Therefore, based on the results of the
U. prolifera growth situation analysis in
Section 4.1, it could be speculated that two sources of
U. prolifera existed in 2017, with great possibility of this being the case.
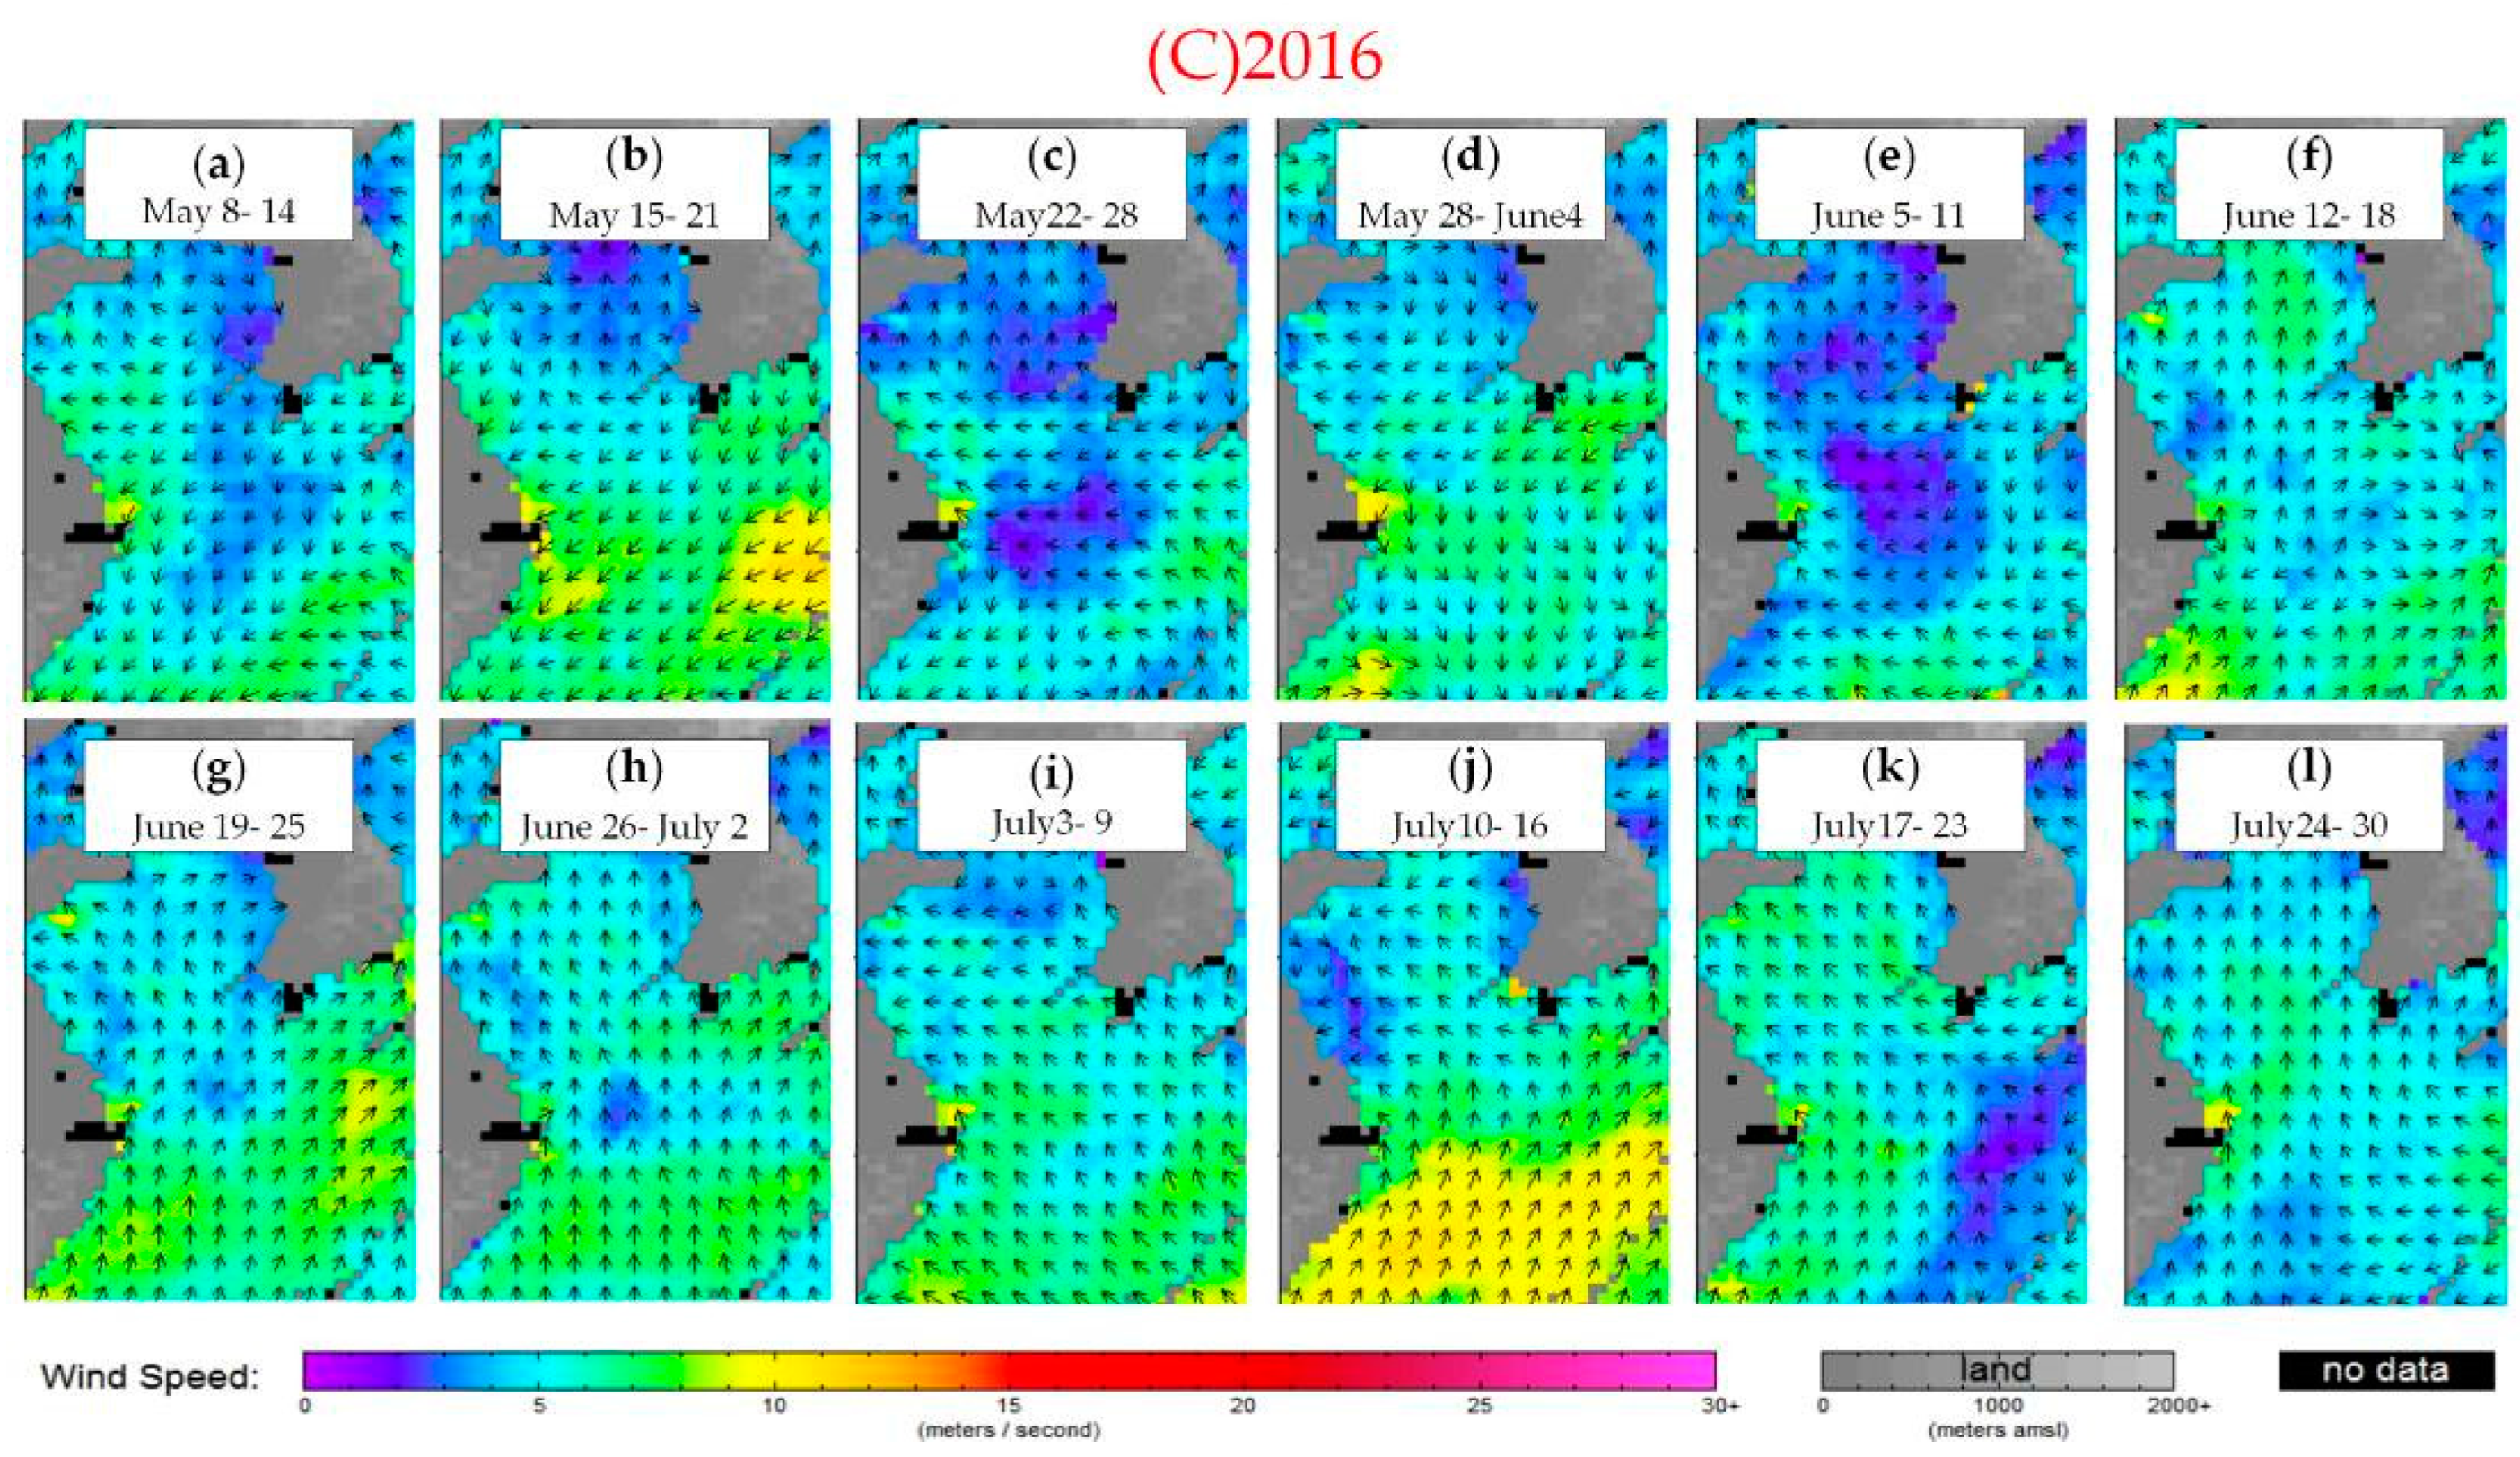
The tight relationship between the trajectory and the SSW also occurred in 2016. During the growth period of U.prolifera, from mid-May to the end of July, the wind direction of the SSW is basically northwest, which is consistent with the movement law of the trajectory. The period from June 25 to July 2 was only time period in the year where the track moved significantly eastwards. It then moved back from east to west during July 2–14, and it continued to move westward thereafter. From the corresponding SSW vector diagram, it can be found that in the first time period, the wind direction that originated in northwest direction was rotated upward toward the north, and the wind speed was also slightly reduced. In the second period, the wind returned to the original northwest direction, and then a southerly sea breeze with low wind speed appeared. This could also explain why the trajectory moved back to the west during this phase, and also moved slightly southward.
From a holistic point of view, the main direction of the SSW in the Yellow Sea in summer 2016–2018 was northwest, which was highly consistent with the main direction angles of the 2016 and 2017 tracks. In this study, the main direction of barycenter migration obtained by trajectory analysis in 2018 was 16° north by east, which was probably caused by the substantial eastward drift in late June. Furthermore,
Figure 15 shows that the weekly average wind speed in the study area was low. The maximum wind speed was about 10 m/s, and the time period was quite short. For most of the time, the wind speed was 5 m/s to 7 m/s. Accordingly, a gentle SSW was enough to affect the distribution of
U. prolifera and cause its migration.
4.3. Directionality Change and Sea Wind
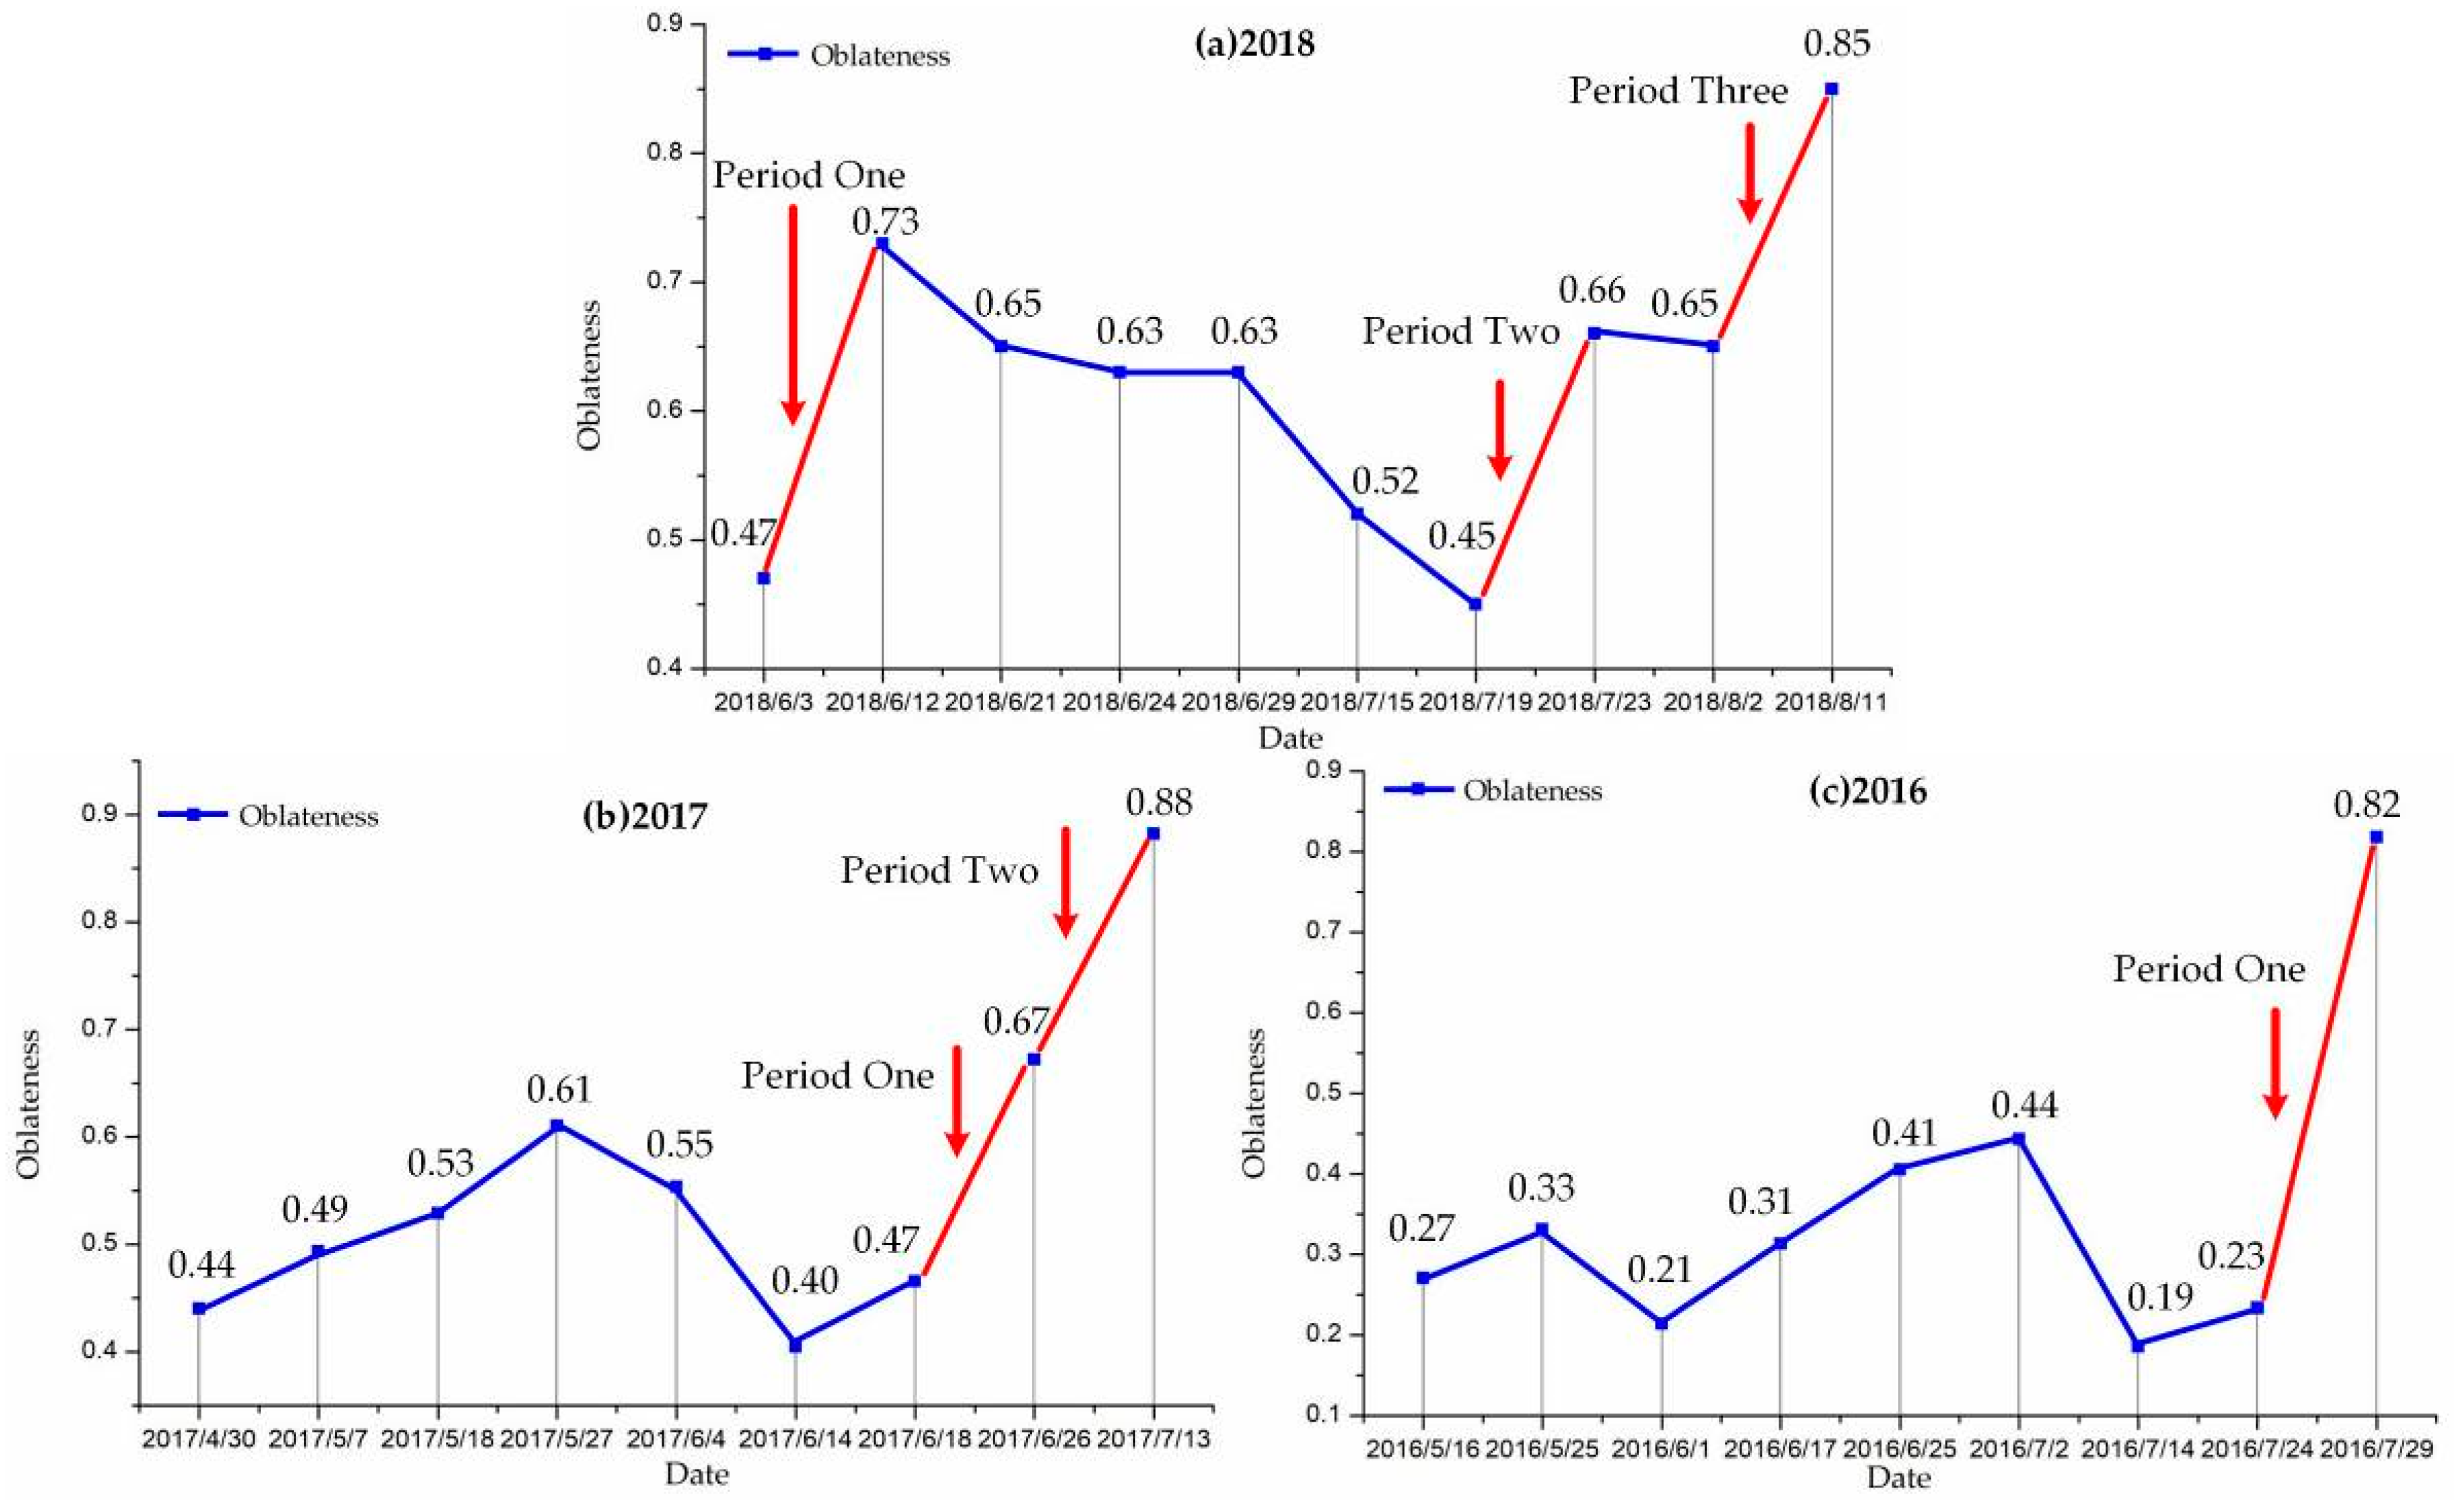
Based on the change in SDE parameters, the influencing factors on algae distribution were further explored. It was also assumed that the sea breeze was the main influencing factor. During the three monitoring years in this study, the changes in oblateness and direction angle were quite different. The patterns in 2018 was easy to find, with three sharp increases in SDE oblateness (
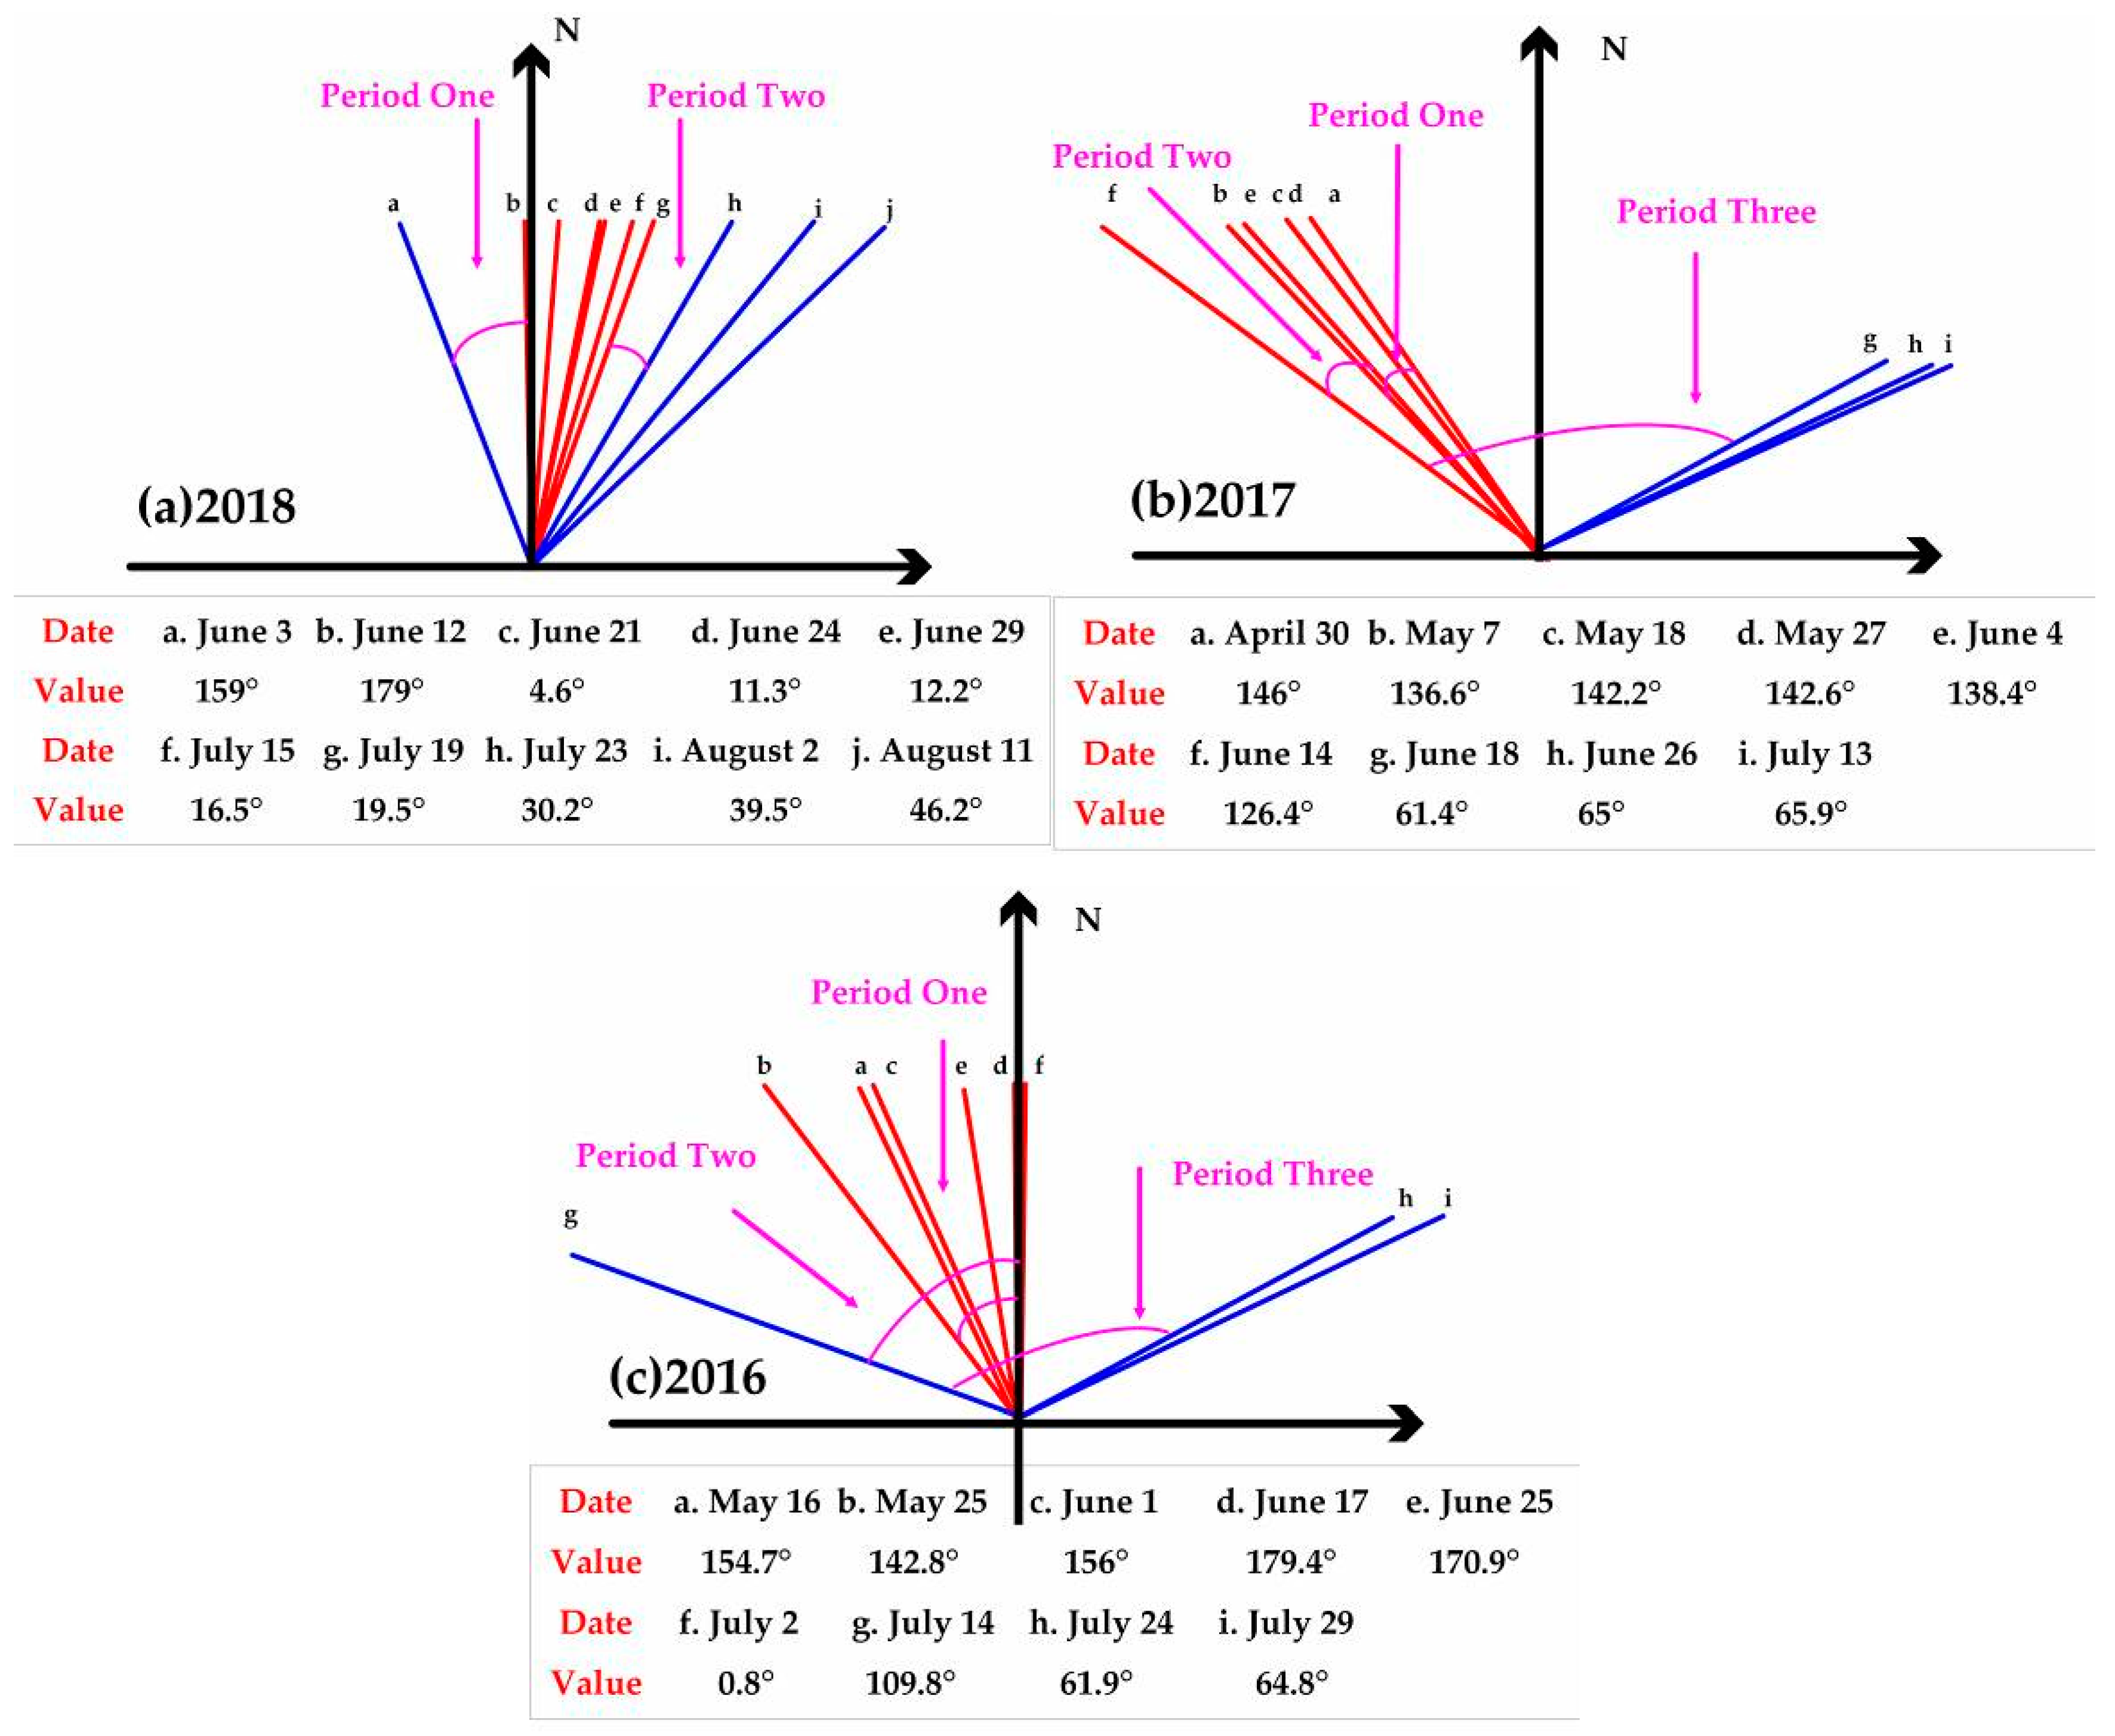
Figure 11a), and the direction being rotated clockwise with the passage of time (
Figure 11b). Furthermore, the time periods where the two parameters changed greatly were important. In 2017 and 2016, the direction angle of SDE swung back and forth with no certain regularity, and there was a time period for where the angle rotated more than 100° clockwise in both years. Moreover, as in 2018, the flatness mutation occurred in the death stage of
U. prolifera, with the maximum value of the oblateness occurring at the time when
U. prolifera was close to extinction.
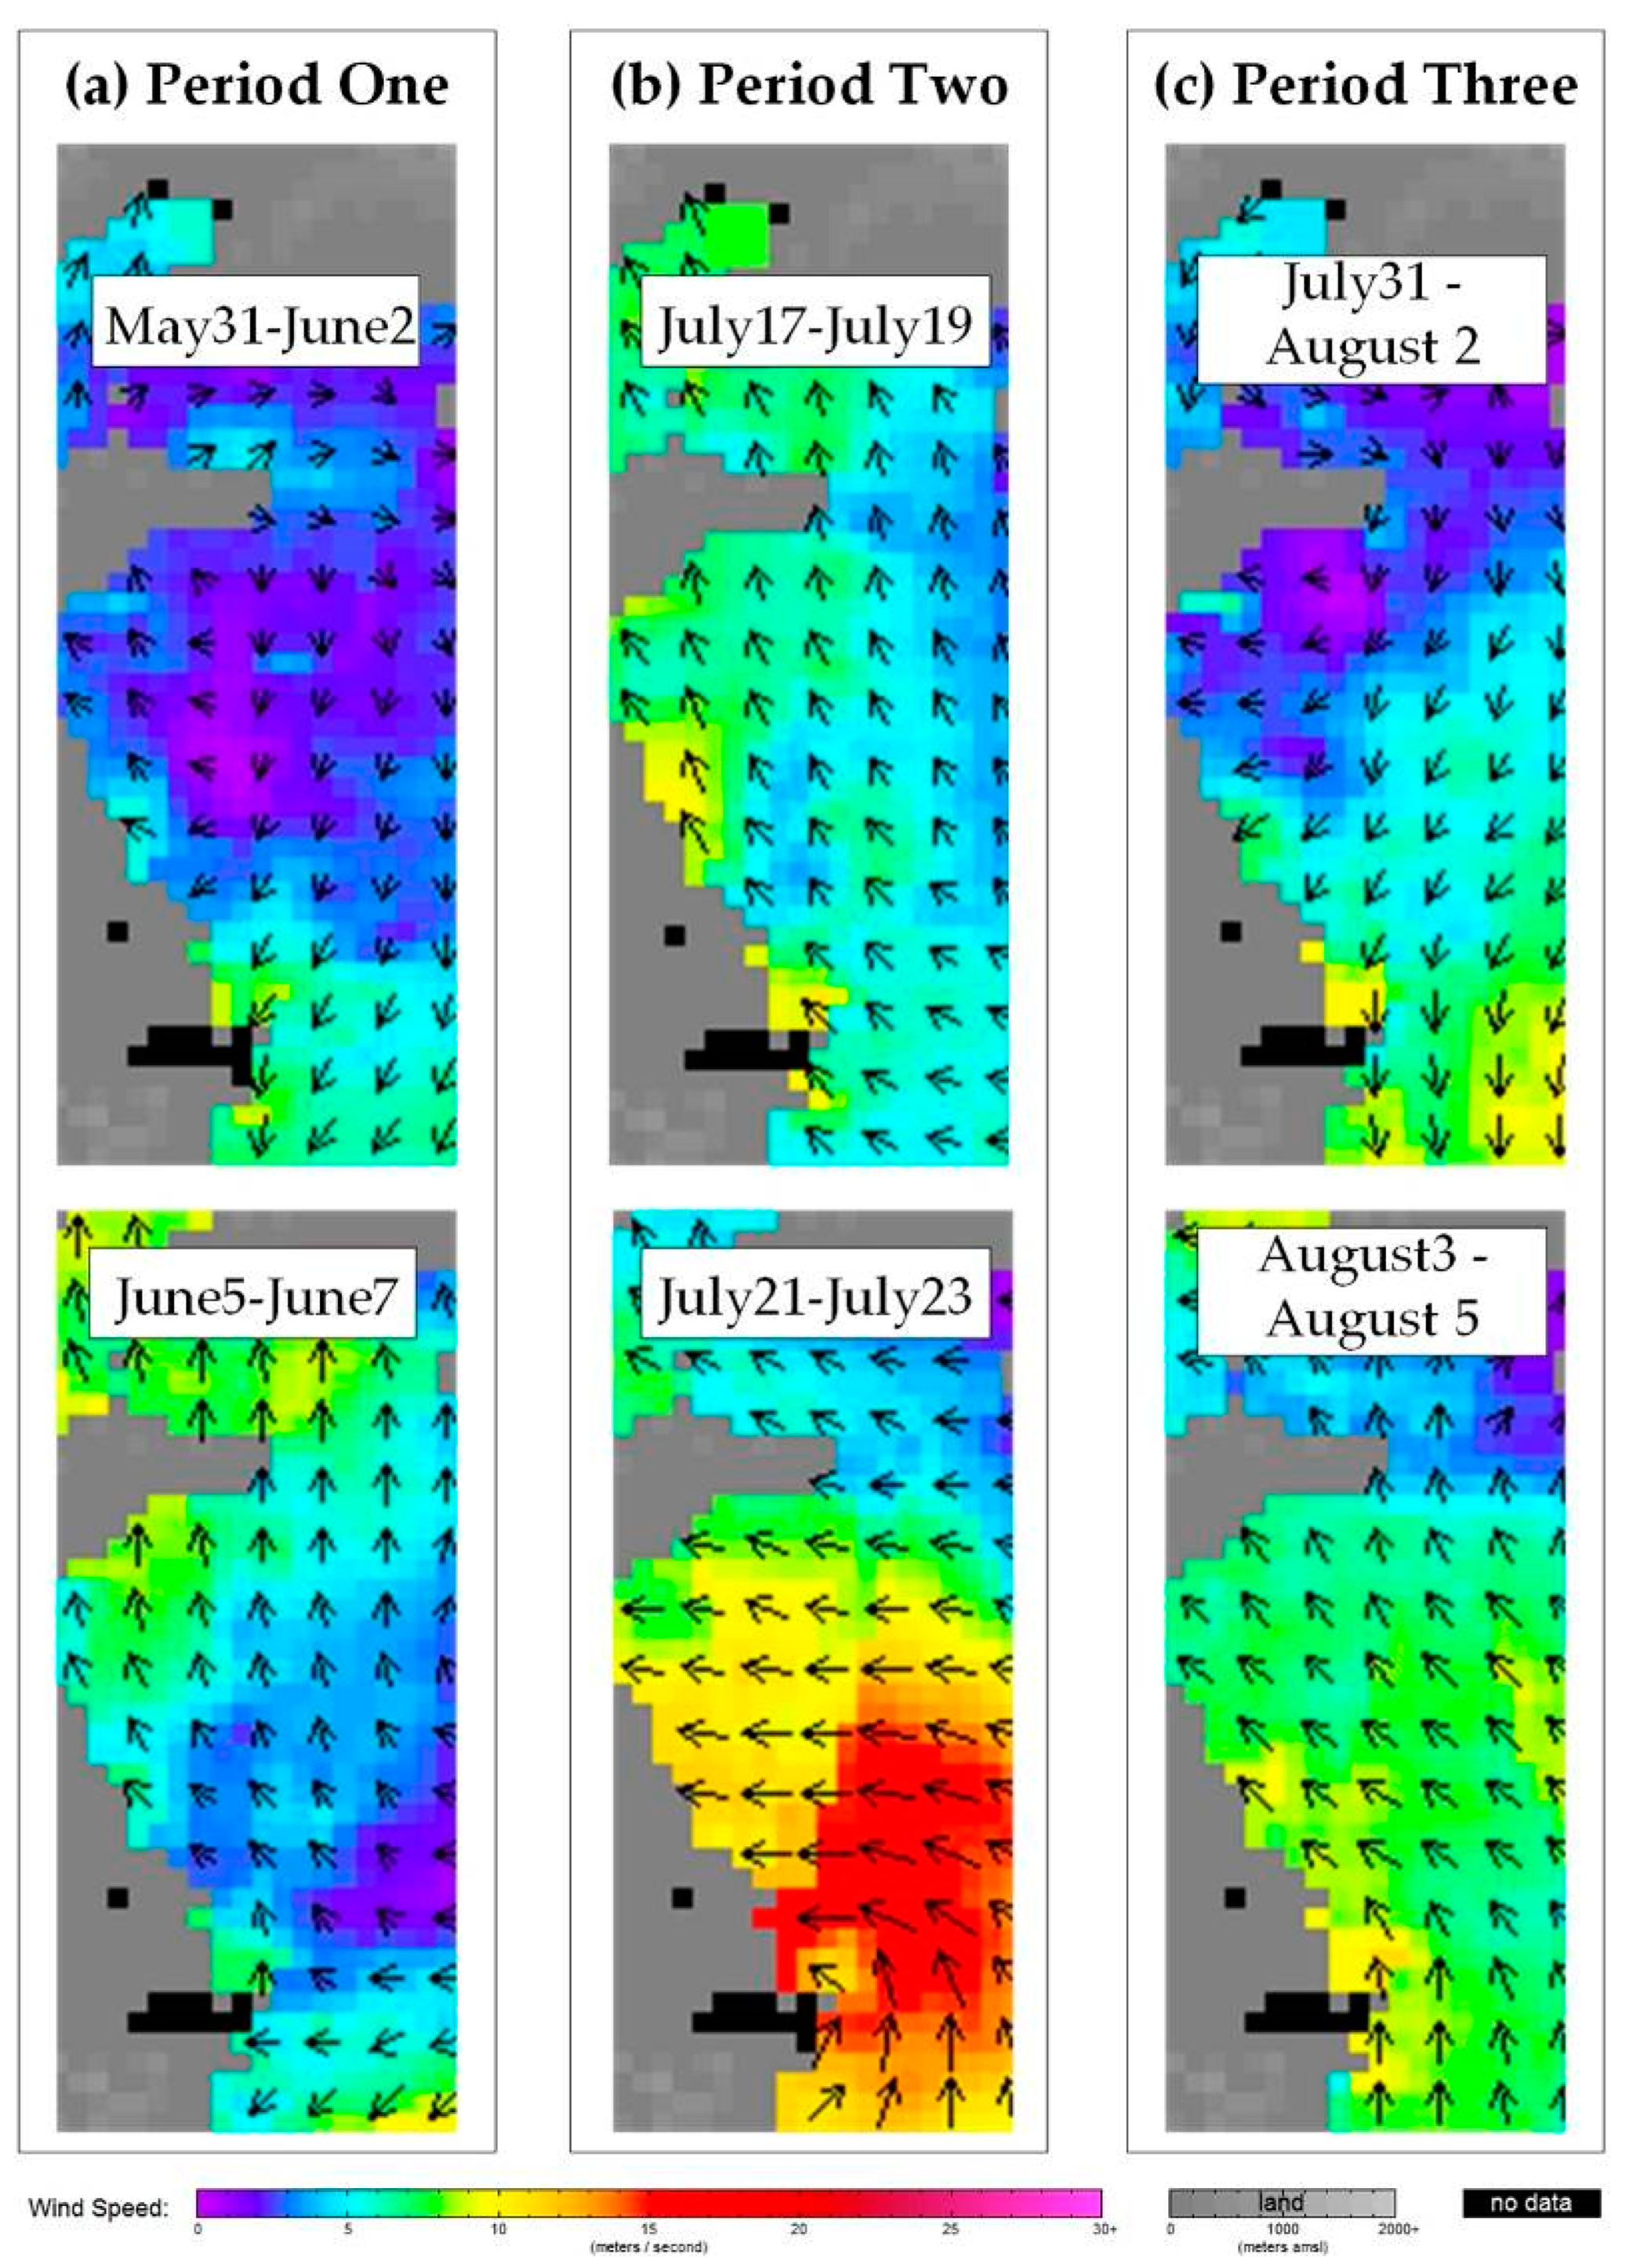
The analysis started from 2018. The three periods of oblateness change were in June 3 to 12, July 19 to 23, and August 2 to 11. In the first two time periods, the direction angle also changed greatly. Because the time span of the three periods was not long, the weekly averaged SSW data could not be used as a good basis. Therefore, a time interval of three days was used to determine whether the SSW changed suddenly, with the starting and ending date being taken as the search range. The results are shown in
Figure 16. In these three periods, the wind direction changed, and the wind speed increased greatly.
Period one: From the end of May to the beginning of June, the SSW in the Yellow Sea was about 2 m/s, with inconsistent directions. However, the direction changed significantly heading north, and the speed increased two or three times. On June 3, the direction angle of the U. prolifera distribution was 21° north by west, approaching the coastline of Jiangsu Province. By comparison, on June 12, the north–south trend of the distribution was prominent. The direction angle was rotated strongly northward, and it almost reached the north direction. During this time period, the dramatic change in the shape of the distribution was closely related to the change in the SSW direction and the increase in wind speed.
Period two: From July 21 to 23, the wind speed suddenly increased to a maximum of 20 m/s, forming a huge windy area in the southern part of the Yellow Sea. On July 19 and 23, the distribution direction angle was 19.5° and 30.2° north by east, respectively. During this period, the wind direction was west and northwest, and the wind speed decreased with increasing latitude. The southern part of the distribution area was more strongly affected by SSW than the northern part, which may have accounted for the clockwise rotation of the direction angle.
Period three: At the beginning of August, the SSW was weak, at about 2 m/s, and the direction was westerly in the area where U. prolifera was distributed. From August 2 to 11, the wind speed increased significantly. The northwest wind directly pointed to the coastline of Shandong Province. In early August, U. prolifera was distributed in the sea area near Shandong Province. When the wind strengthened and the direction changed, U. prolifera was pushed further towards the shoreline. Until August 11, although the direction angle of the morphological distribution did not change significantly, and the directionality was significant, reaching its maximum value in 2018 and approaching the direction of the coastline of Shandong Province.
The oblateness changes in 2017 and 2016 were similar to the third period of 2018. At the same time as the mutation occurred, the oblateness reached the maximum value of the year. The situations in the disappeared stages of these three years are shown in
Figure 4j,
Figure 5i, and
Figure 6i. It was obvious that
U. prolifera was distributed along the coastline of Shandong, resulting in a prominence in directionality.
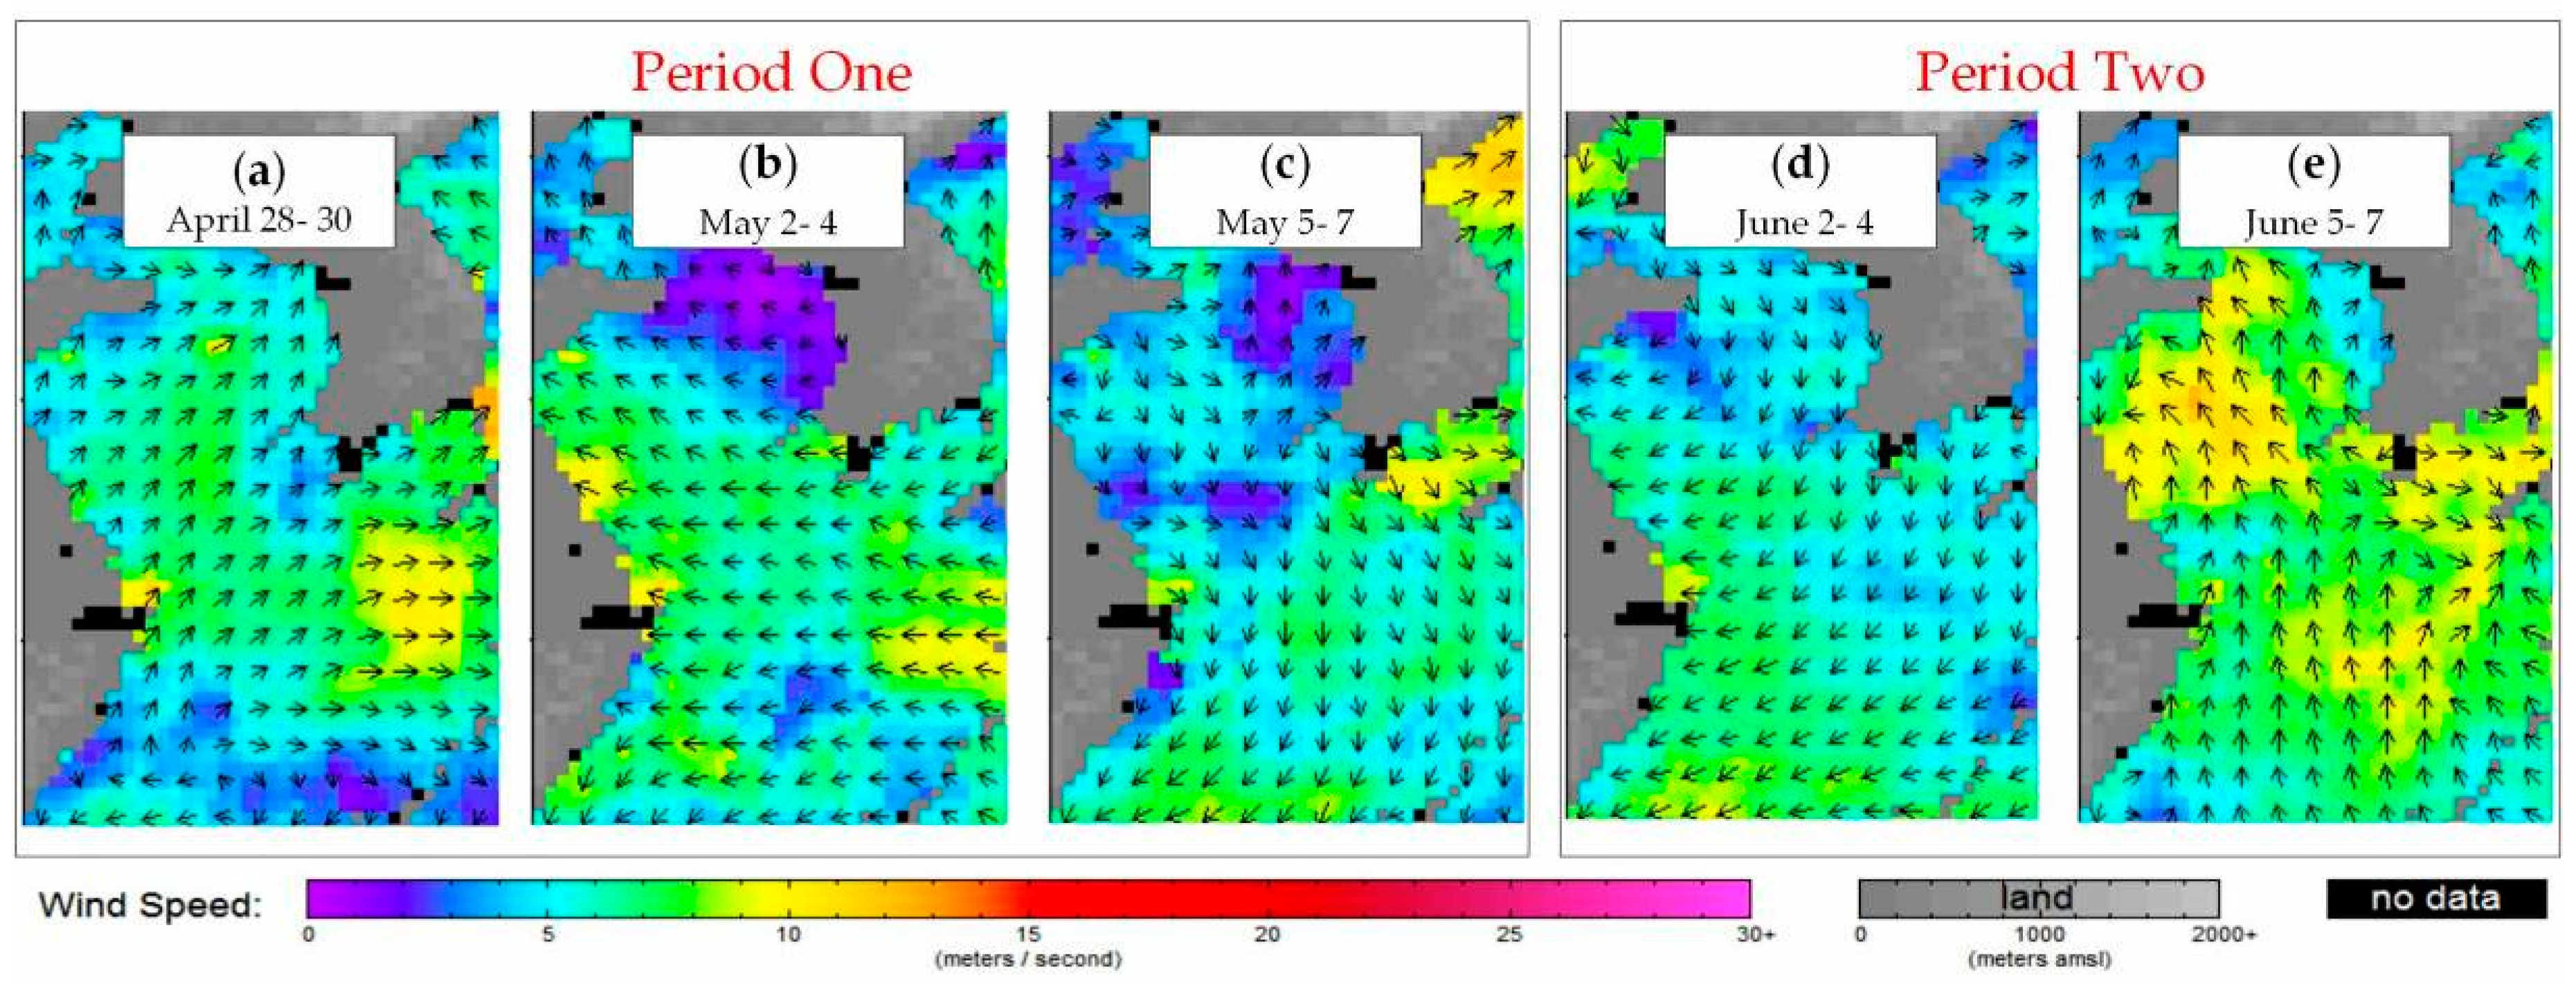
In 2017, a total of three sudden changes in the direction angle occurred. Similar to the analysis method in 2018, it took three days as a unit to find out whether there were great changes in the speed and direction of SSW in each period. Eventually, sudden changes in SSW were discovered during the first two periods, and the figures of SSW are shown in
Figure 17. In these two periods, the direction angle was rotated counterclockwise. When the SSW changed with the same characteristic in the first period, it has shown an opposite trend in the second period. During that time, although the wind direction changed clockwise and the wind speed increased significantly, the direction angle of
U. prolifera distribution still rotated counterclockwise. The abnormal phenomenon also occurred in the third period of time, during which the direction angle was reversed greatly, while no sudden change in wind speed or wind direction was observed. Based on the previous analysis of the
U. prolifera growth trend in 2017, there were two sources in different periods in this year. Periods two and three, when the direction angle was abrupt, were exactly the time nodes for when one end of algae broke out and the other end declined.
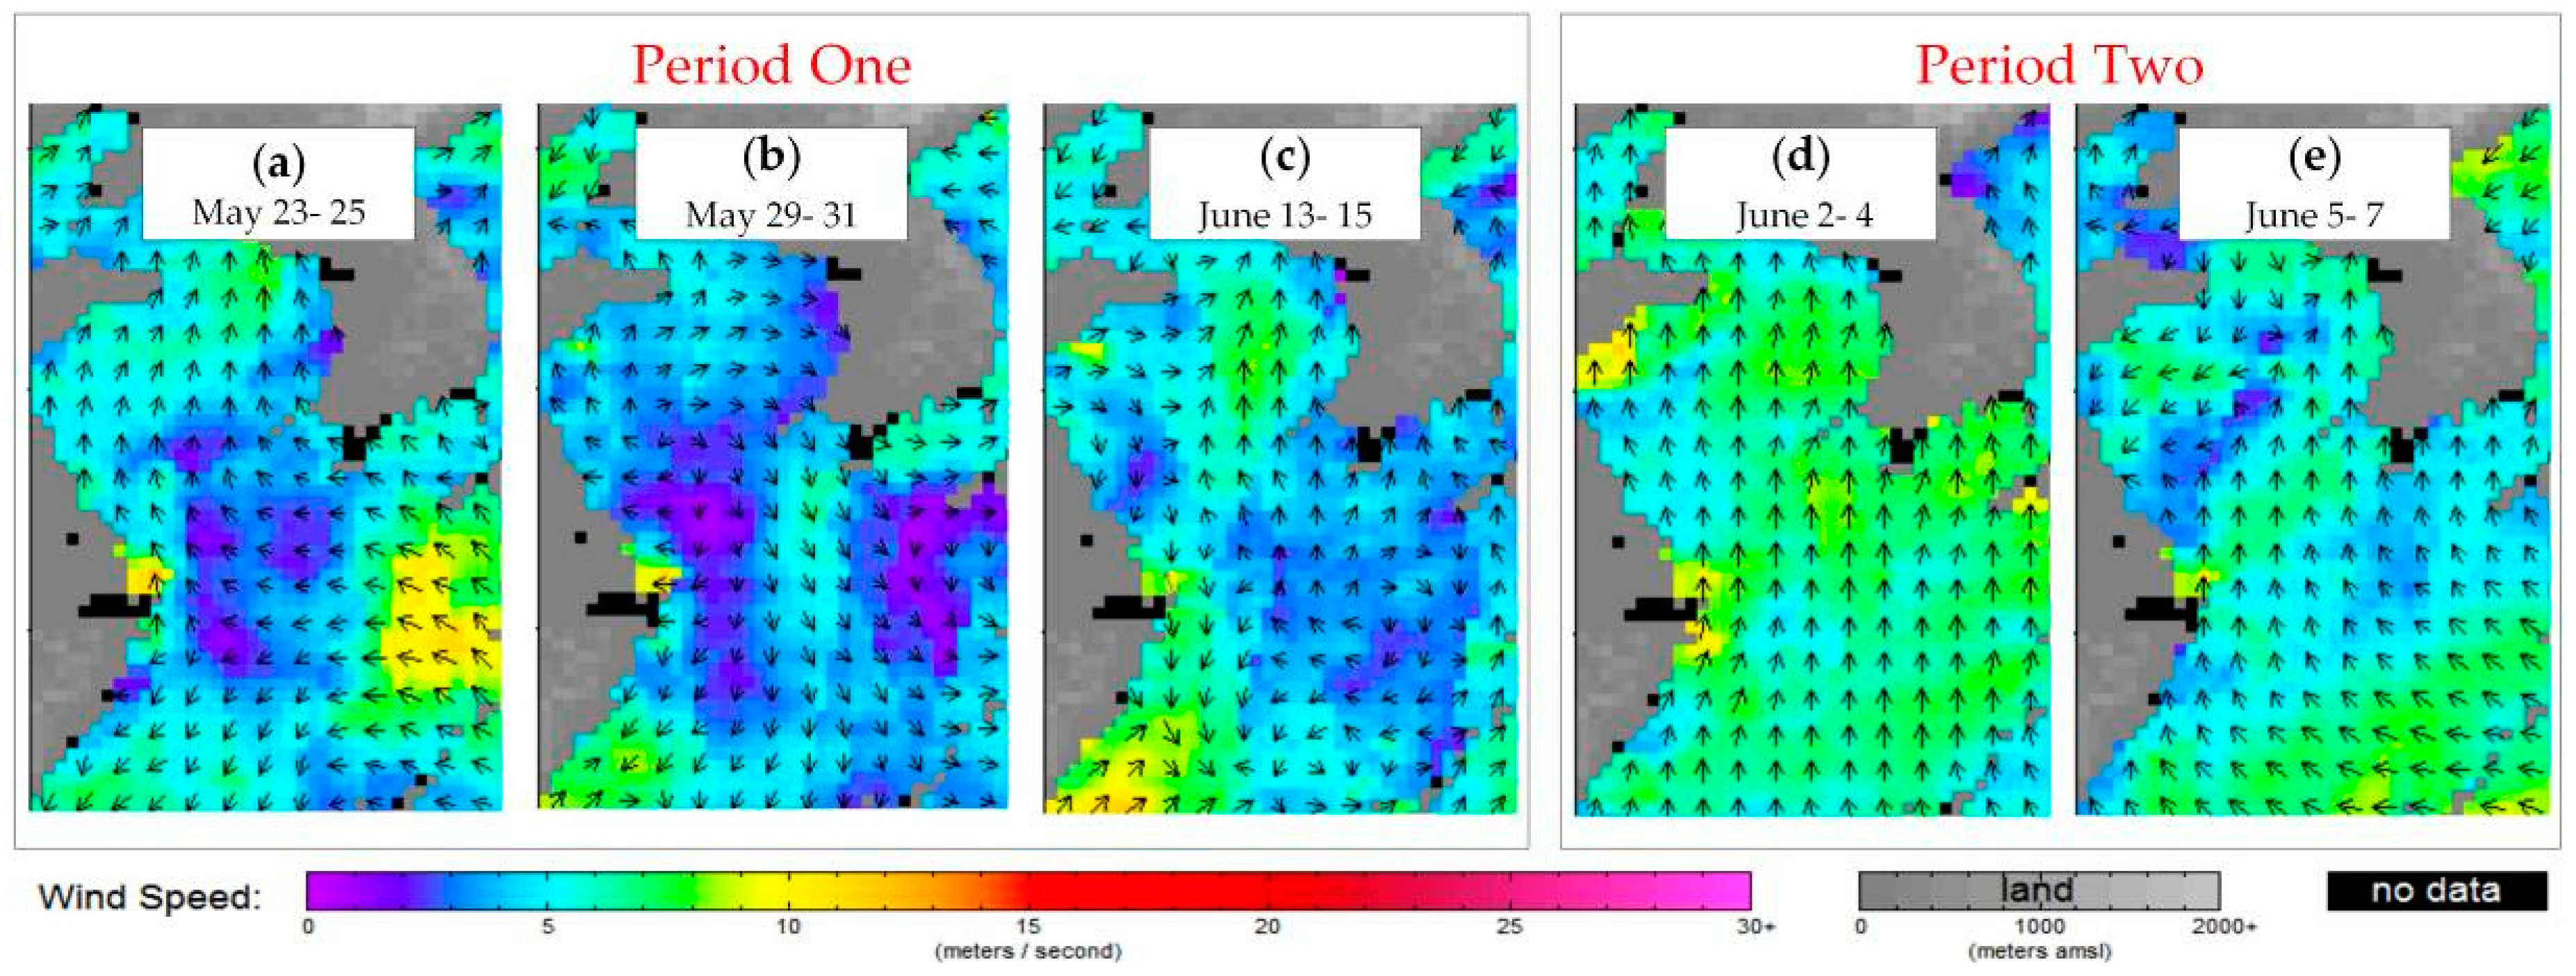
In 2016, there were also three sudden changes in direction angles. Among them, the sea breeze changes in the first two periods are shown in
Figure 18. During the first period, May 25 to June 17, the direction angle continued to rotate clockwise. Similar changes have taken place in the direction of the SSW. In the second period, July 2 to 14, in the area where the
U. prolifera grew, the SSW originally pointed to the northern direction and the wind speed was relatively high. As time went by, the wind speed decreased and the direction pointed northwest. An anticlockwise wind circle was formed in the study area, which explained the change in the direction angle. Since the oblateness of the SDE indicates the significance of the distribution direction, the larger the value, the more significant the directivity. Therefore, when the oblateness value is very small, the distribution has no directional characteristics. In the third period of 2016, although the direction angle changed greatly, the change was probably not caused by directional factors, for the reason that the oblateness values were very small throughout the period. The distribution situation of these two times nodes (
Figure 6g, h) were compared, during which the large-area scattered angle died rapidly. This was probably the main reason for the change in direction angle.
According to the analysis above, the change in SSW played a crucial role in influencing the distribution morphology of U. prolifera. The changes in direction angle caused by direction and speed of SSW were usually continuous, which could be confirmed by the three periods of 2018, the first period of 2017 and the first two periods of 2016. However, the sudden change of the SSW was not enough to cause the sharp reversal of the direction angle, which was found both in 2017 and 2016. The changes were most likely caused by the growth and decline of U. prolifera at different locations.


