1. Introduction
The coastal marine ecosystem is both complex and vulnerable [
1] as it is generally close to areas with high population density. As documented in previous studies [
2,
3], population density within 100 km of coastlines is approximately three times higher than the average density of the global population and a further increase is expected. Increased anthropogenic activities along the coasts have resulted in the degradation of water quality [
4], including runoff of agricultural fertilizers into rivers, resulting in high suspended solids with large nutrient inflows that can cause eutrophication. Eutrophication can further contribute to an increase in algal bloom events [
5]. These blooms can block sunlight, resulting in an anoxic condition, in which dissolved oxygen is depleted within the coastal environment. In addition, some of these blooms are toxic, with adverse effects on aquatic life and humans [
6,
7]. Due to the adverse consequences of water pollution, there is a need to monitor potential changes in water quality in any environmental impact assessment [
8,
9]. Water quality indicators (WQIs), such as chlorophyll-a (Chl-a), suspended solids (SS), and turbidity, have been used as indicators for monitoring coastal and inland water quality [
10,
11,
12,
13].
The concentration of Chl-a, a measure of phytoplankton biomass, is a key water quality indicator as it is the base of the marine food chain, and it can also be used to indicate algal blooms [
7]. Chl-a is an optically-active parameter as clean water absorbs most of the visible, and all infrared (IR) radiation, while nutrient-rich water with the presence of Chl-a, generally reflects green and IR radiation back to the atmosphere [
14]. Similarly, SS is also optically-active parameter as a high concentration of SS increases water leaving radiance across the whole visible spectrum. Routine monitoring of SS is critical as the high concentrations of SS have adverse effects on benthic invertebrates [
15].
Traditional methods using field measurements for measuring WQI offer high accuracy. However, these methods are labor-intensive and time-consuming, and hence are not able to provide efficient and concurrent water quality measurements at a regional scale [
16]. On the other hand, satellite remote sensing-based methods have potential to measure optically-active WQI, such as Chl-a, SS, colored dissolved organic matter (CDOM), and turbidity, at regular interval and over large areas. In situ sensing technologies, such as multispectral or hyperspectral radiometers, are of great importance as these are required for vicarious calibration and in situ spectral data along with WQI data are extensively used to develop or validated analytical, semianalytical, or empirical models for inland/marine water quality monitoring using corresponding satellite bands [
17,
18,
19]. Previous studies have evaluated satellite data for monitoring Chl-a and SS. For example, the Sea-viewing Wide Field-of-view Sensor (SeaWiFS) with 1.1-km resolution has been widely used to estimate the spatial distribution of Chl-a [
20,
21]. Miller and McKee [
12] used a 250 m Moderate Resolution Imaging Spectroradiometer (MODIS) to map total suspended solids concentration and Moses, Gitelson, Berdnikov and Povazhnyy [
10] combined MODIS and the Medium Resolution Imaging Spectrometer (MERIS) to map Chl-a in case-II waters. Other studies have used data of finer-resolution sensors, such as the Landsat 5 (L5) Thematic Mapper (TM), Landsat 7 (L7) Enhanced Thematic Mapper Plus, (ETM+) the Landsat 8 (L8) Operational Land Imager (OLI), the Earth Observation Advance Land Imager (EO-1 ALI), Huan**g-1 (HJ-1) A/B, and Sentinel-2 A/B to design a more comprehensive framework for water quality monitoring over inland, estuarine, and coastal environments [
11,
22,
23,
24].
However, these studies have several limitations, as they commonly apply linear or multivariate regression to estimate water quality, this may be suitable for a specific environment (e.g., inland lake and case-I waters) but may not work well in coastal environments. This is because multiple factors, such as tides and ocean currents, can influence the flow of water pollutants and the interaction among these factors cannot be explained by a simple linear relationship. Additionally, linear or multivariate regression is highly dependent on station-based water quality data for model development. Furthermore, the empirical predictive models (EPMs) developed from these linear/multivariate regressions cannot be simply applied to other areas of interest, because of the complexity of association among colored dissolved organic matter, Chl-a concentration, and type and size of SS, as the spectral response of water depends on these factors [
25,
26,
27]. Thus, several studies [
4,
28,
29] have examined alternatives such as machine learning techniques and radiative transfer functions to improve water quality modeling.
Compared with machine learning techniques, radiative transfer models such as Hydrolight and successive order of scattering (SOS) are physical-based, and therefore depend on Inherent Optical Properties (IOP) of water and extensive field data [
30]. In addition, deriving IOP from satellite data is challenging. In contrast, the decision-making process of machine learning may require fewer data and assumptions for training purposes (Kim et al., 2014). This implies that such techniques are more flexible for application to different types of coastal environments. For example, some studies have developed machine learning based models for predicting Chl-a and CDOM in temperate regions [
4,
31,
32] and to map phytoplankton cell counts on a subtropical coast [
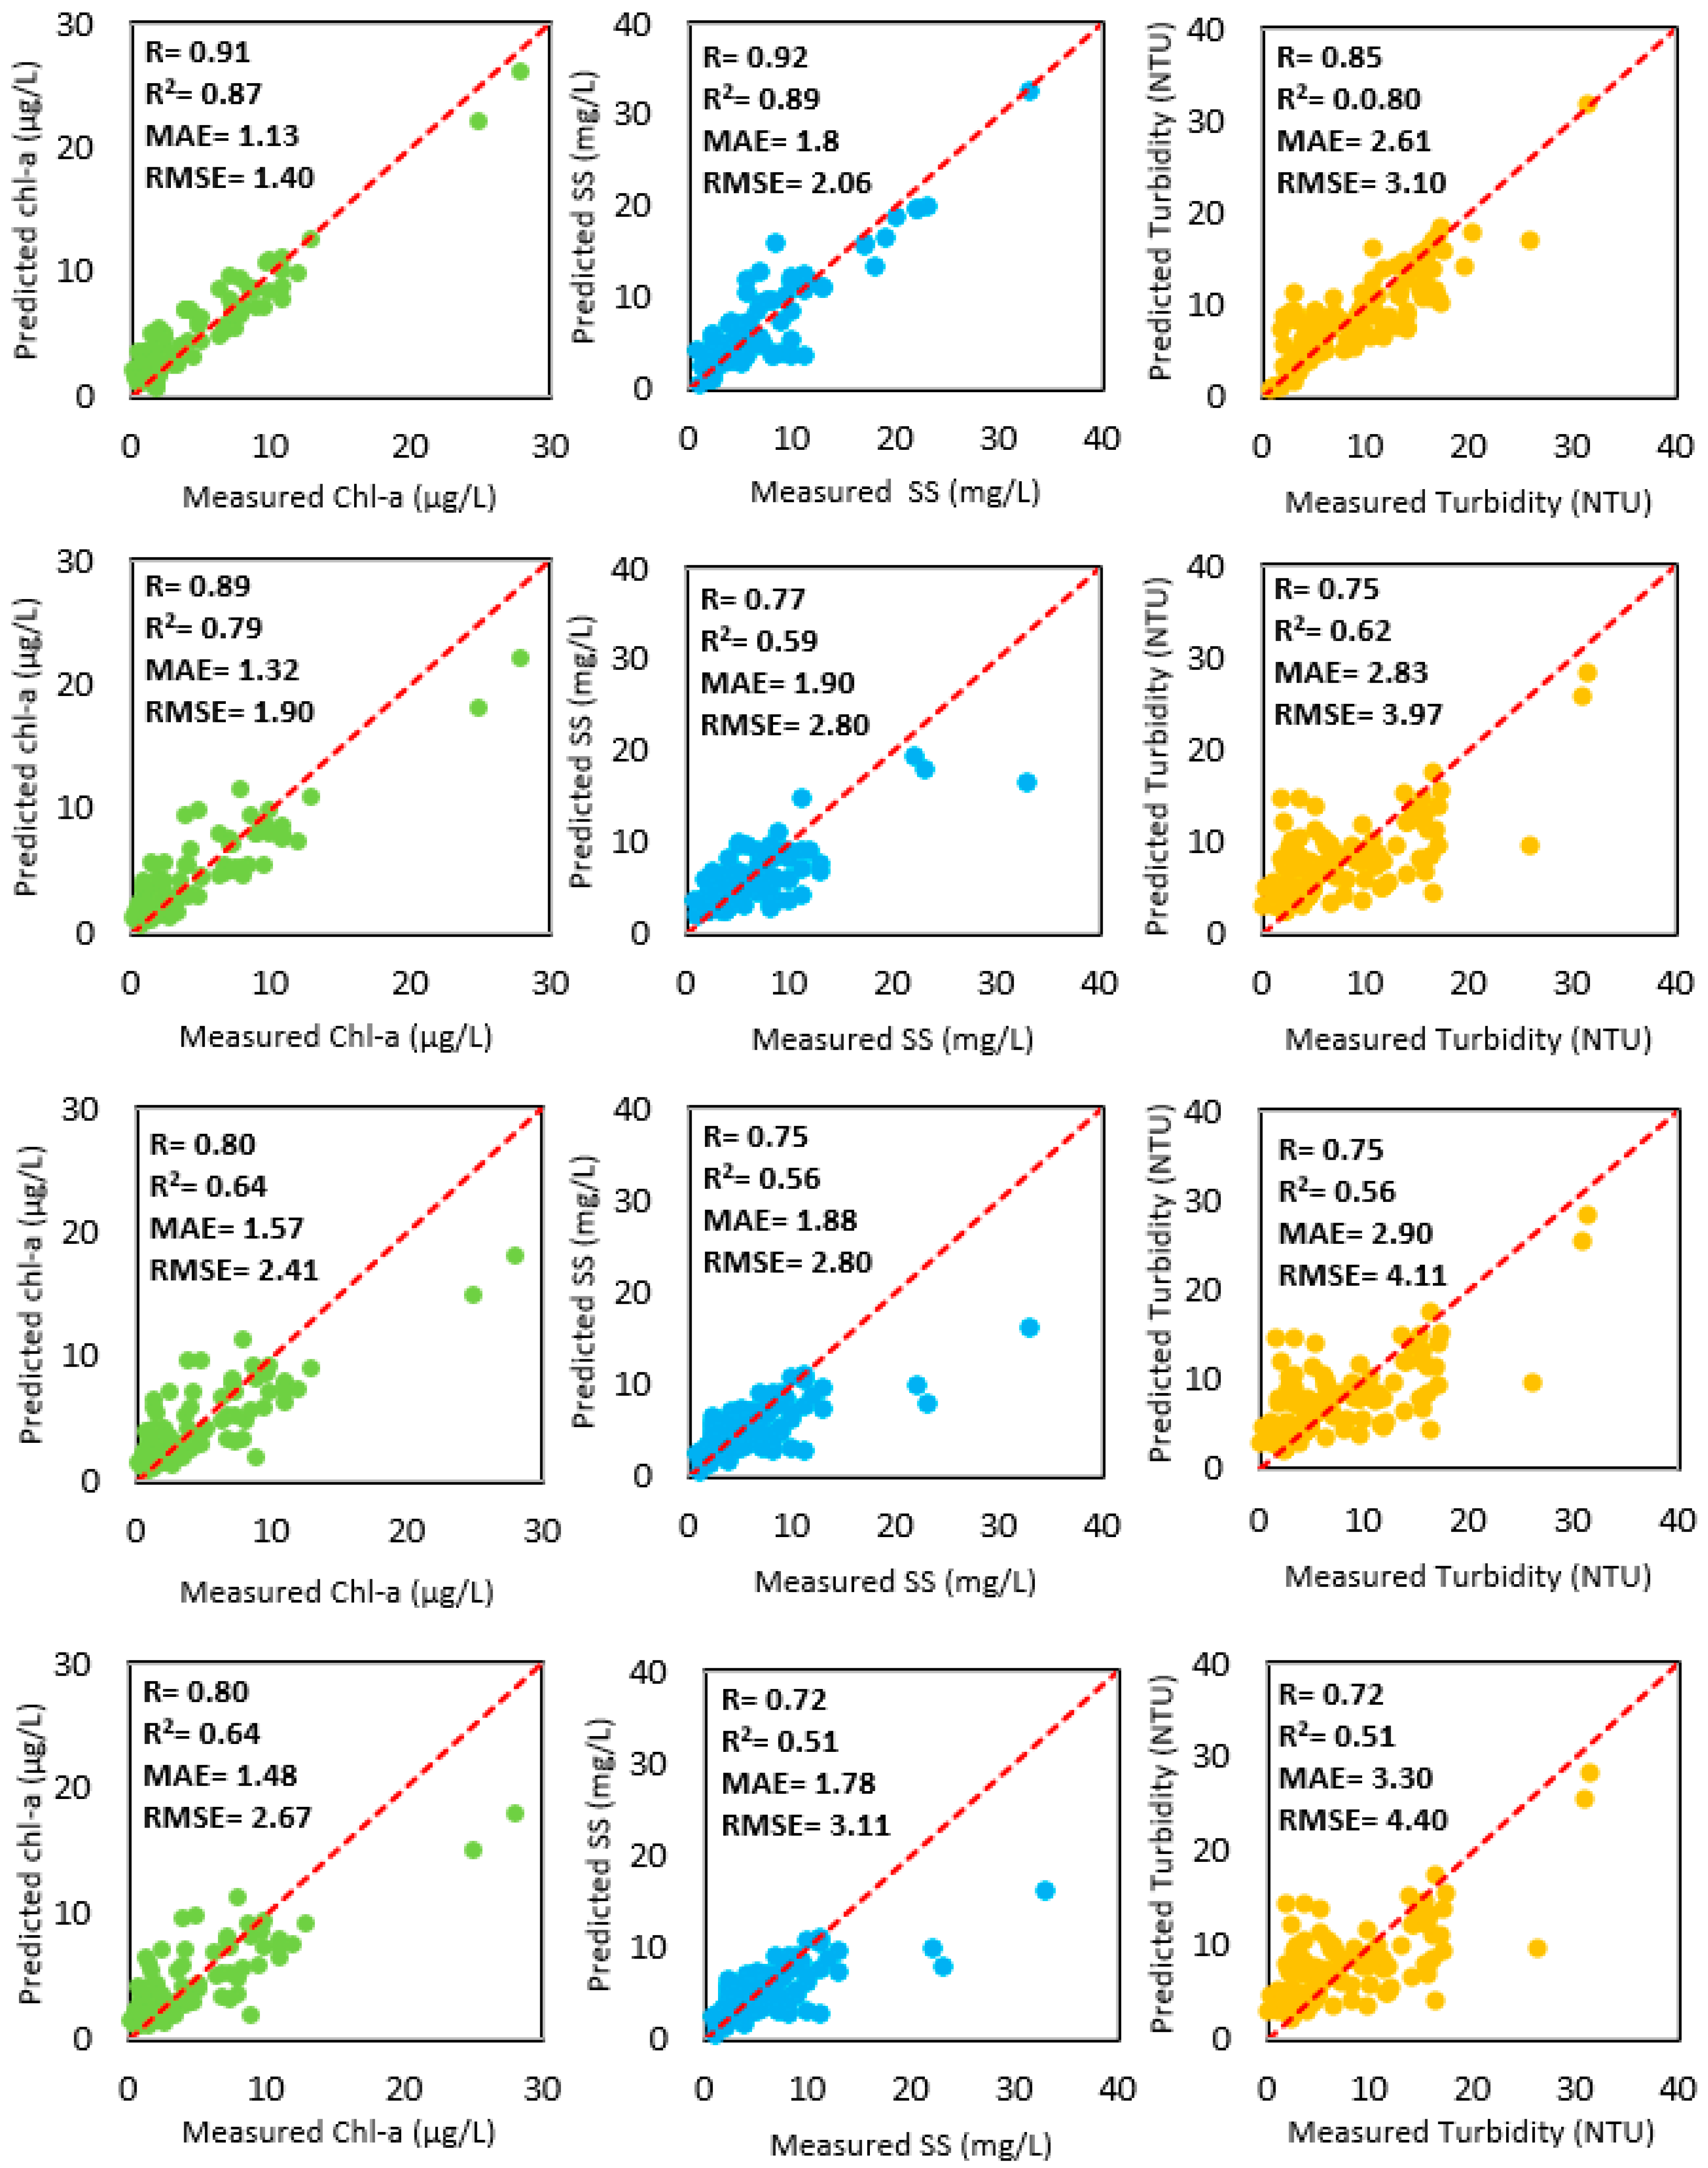
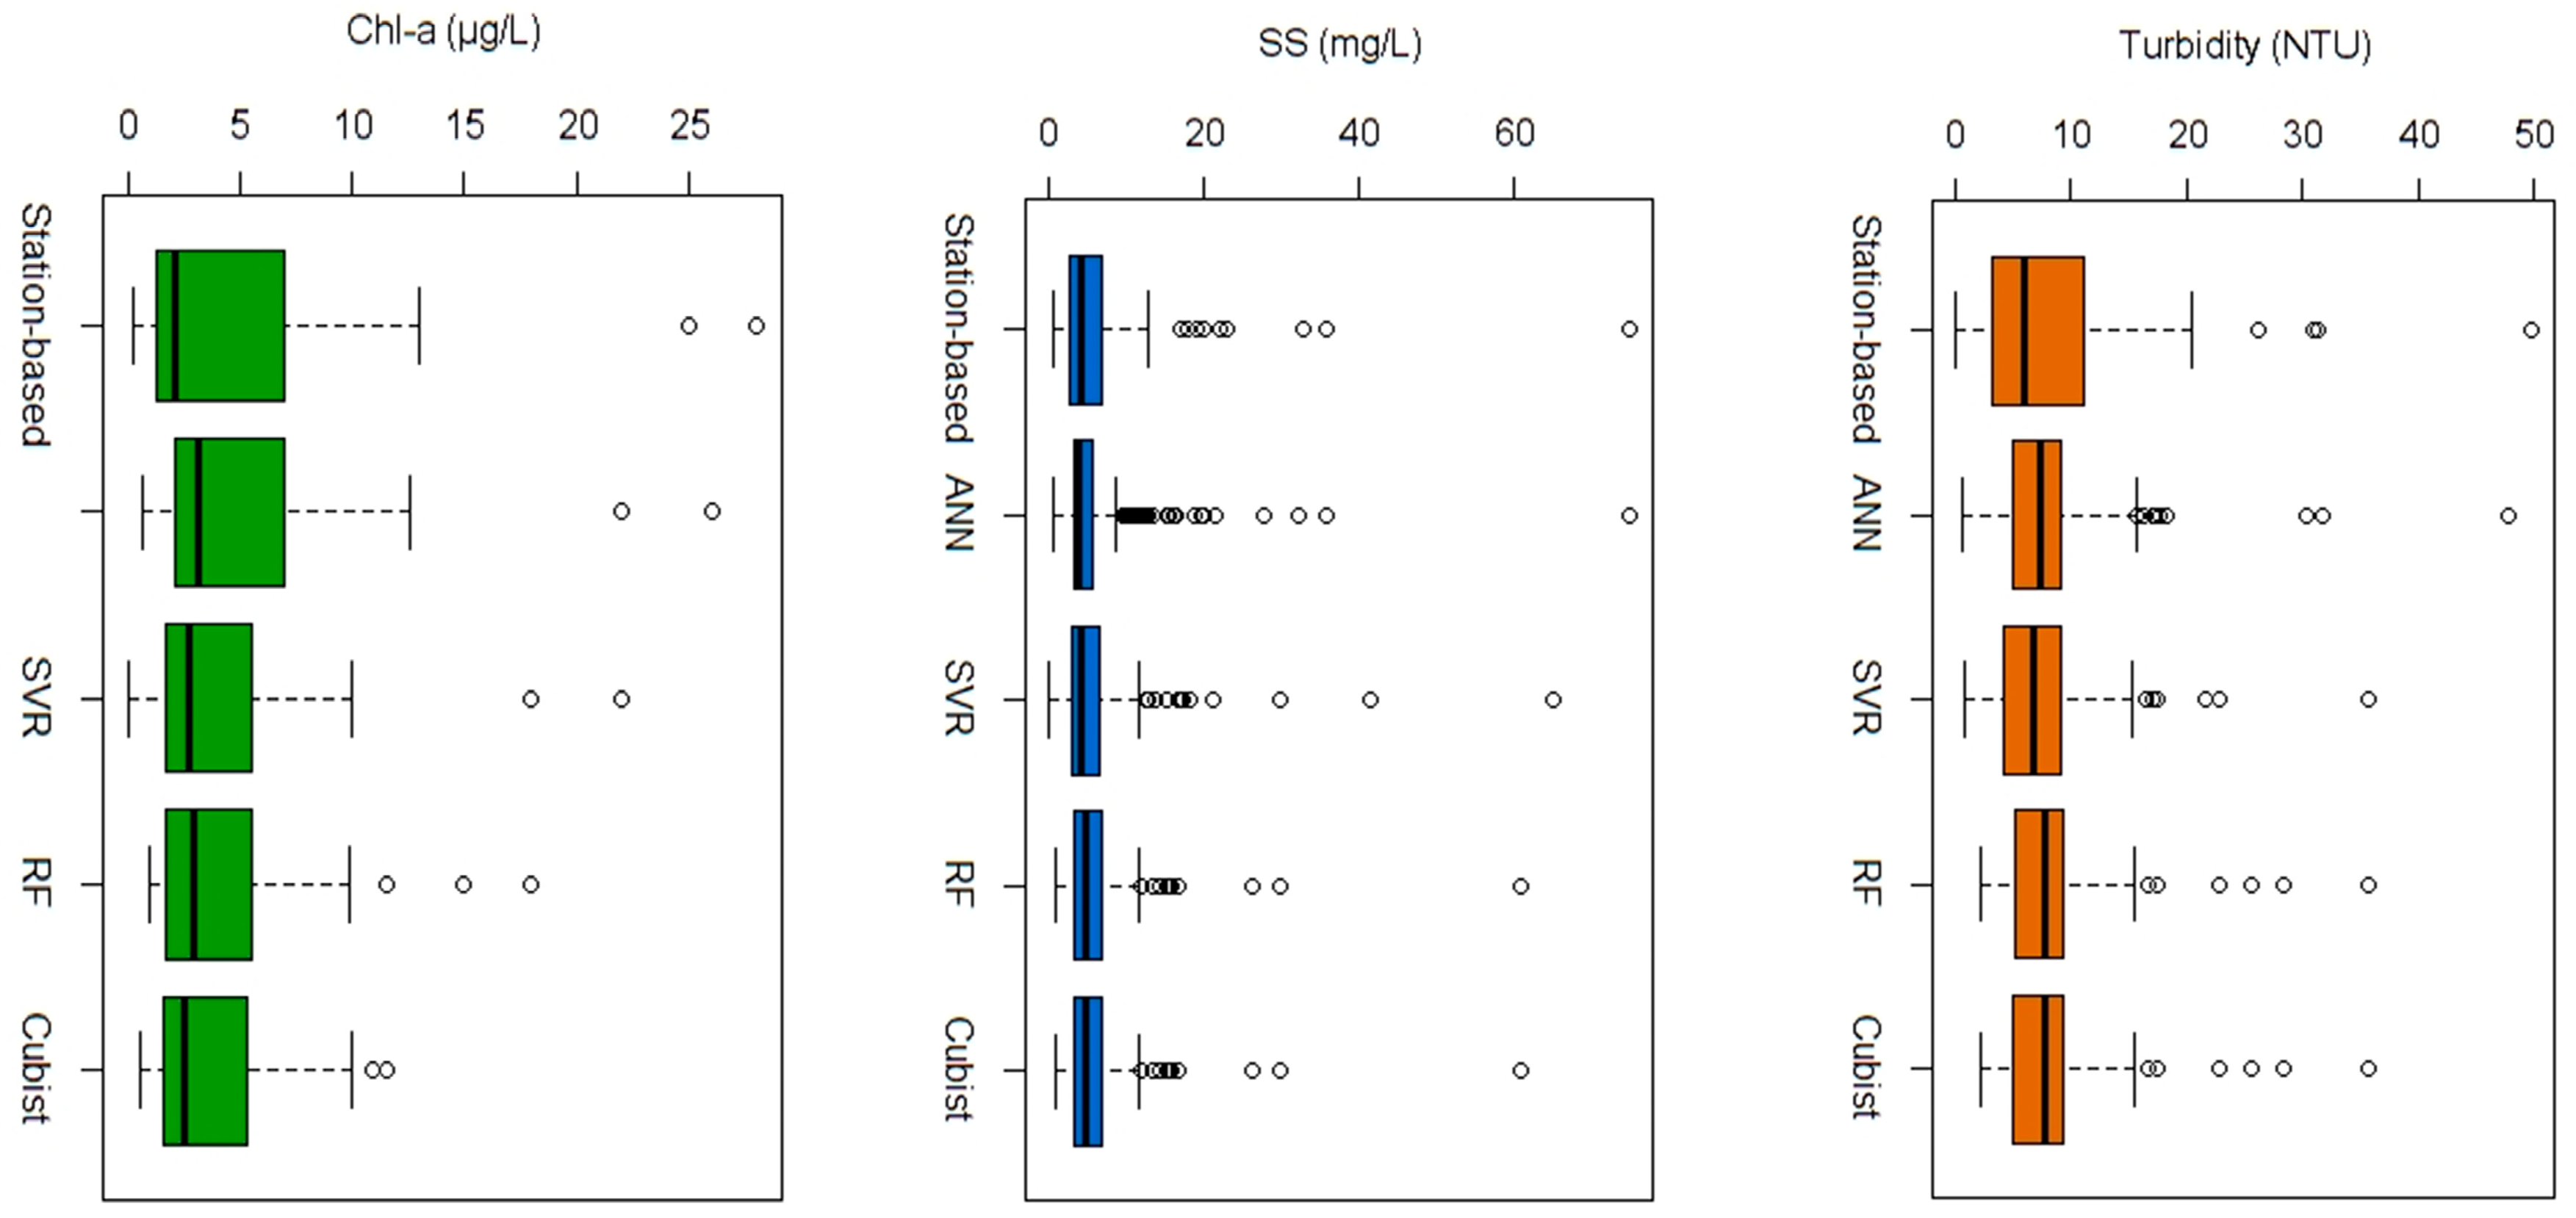
28]. Although machine learning techniques may be useful to improve the estimation of Chl-a and related WQIs in a coastal environment, there are two issues that need to be further addressed: (i) previous studies have used machine learning techniques for estimating WQIs in temperate regions. Since these machine learning techniques were based on different assumptions, it is necessary to evaluate such techniques for predicting water quality to determine which method may be better for map** WQIs in a coastal environment and (ii) subtropical areas are influenced by monsoons, typhoons, and high marine biological productivity, resulting in a more complex coastal system compared to temperate regions. Further investigation into remote sensing of water quality across the subtropical region is needed, to provide improved and routine monitoring. Based on these two core issues, the present study aims to develop a systematic approach to evaluate different machine learning algorithms for estimating water quality of subtropical case-II waters. The main objectives of this study include (1) an evaluation of four machine learning methods, including Artificial Neural Network (ANN), Random Forest (RF), Cubist regression (CB), and Support Vector Regression (SVR), using independent, in situ reflectance data and satellite-derived reflectance data (Landsat L5, L7, and L8) for water quality prediction over subtropical coastal waters; (2) a further comparison of machine learning models with EPMs; and (3) sensitivity analysis of spectral bands for modeling water quality based on variable importance analysis.
4. Conclusions
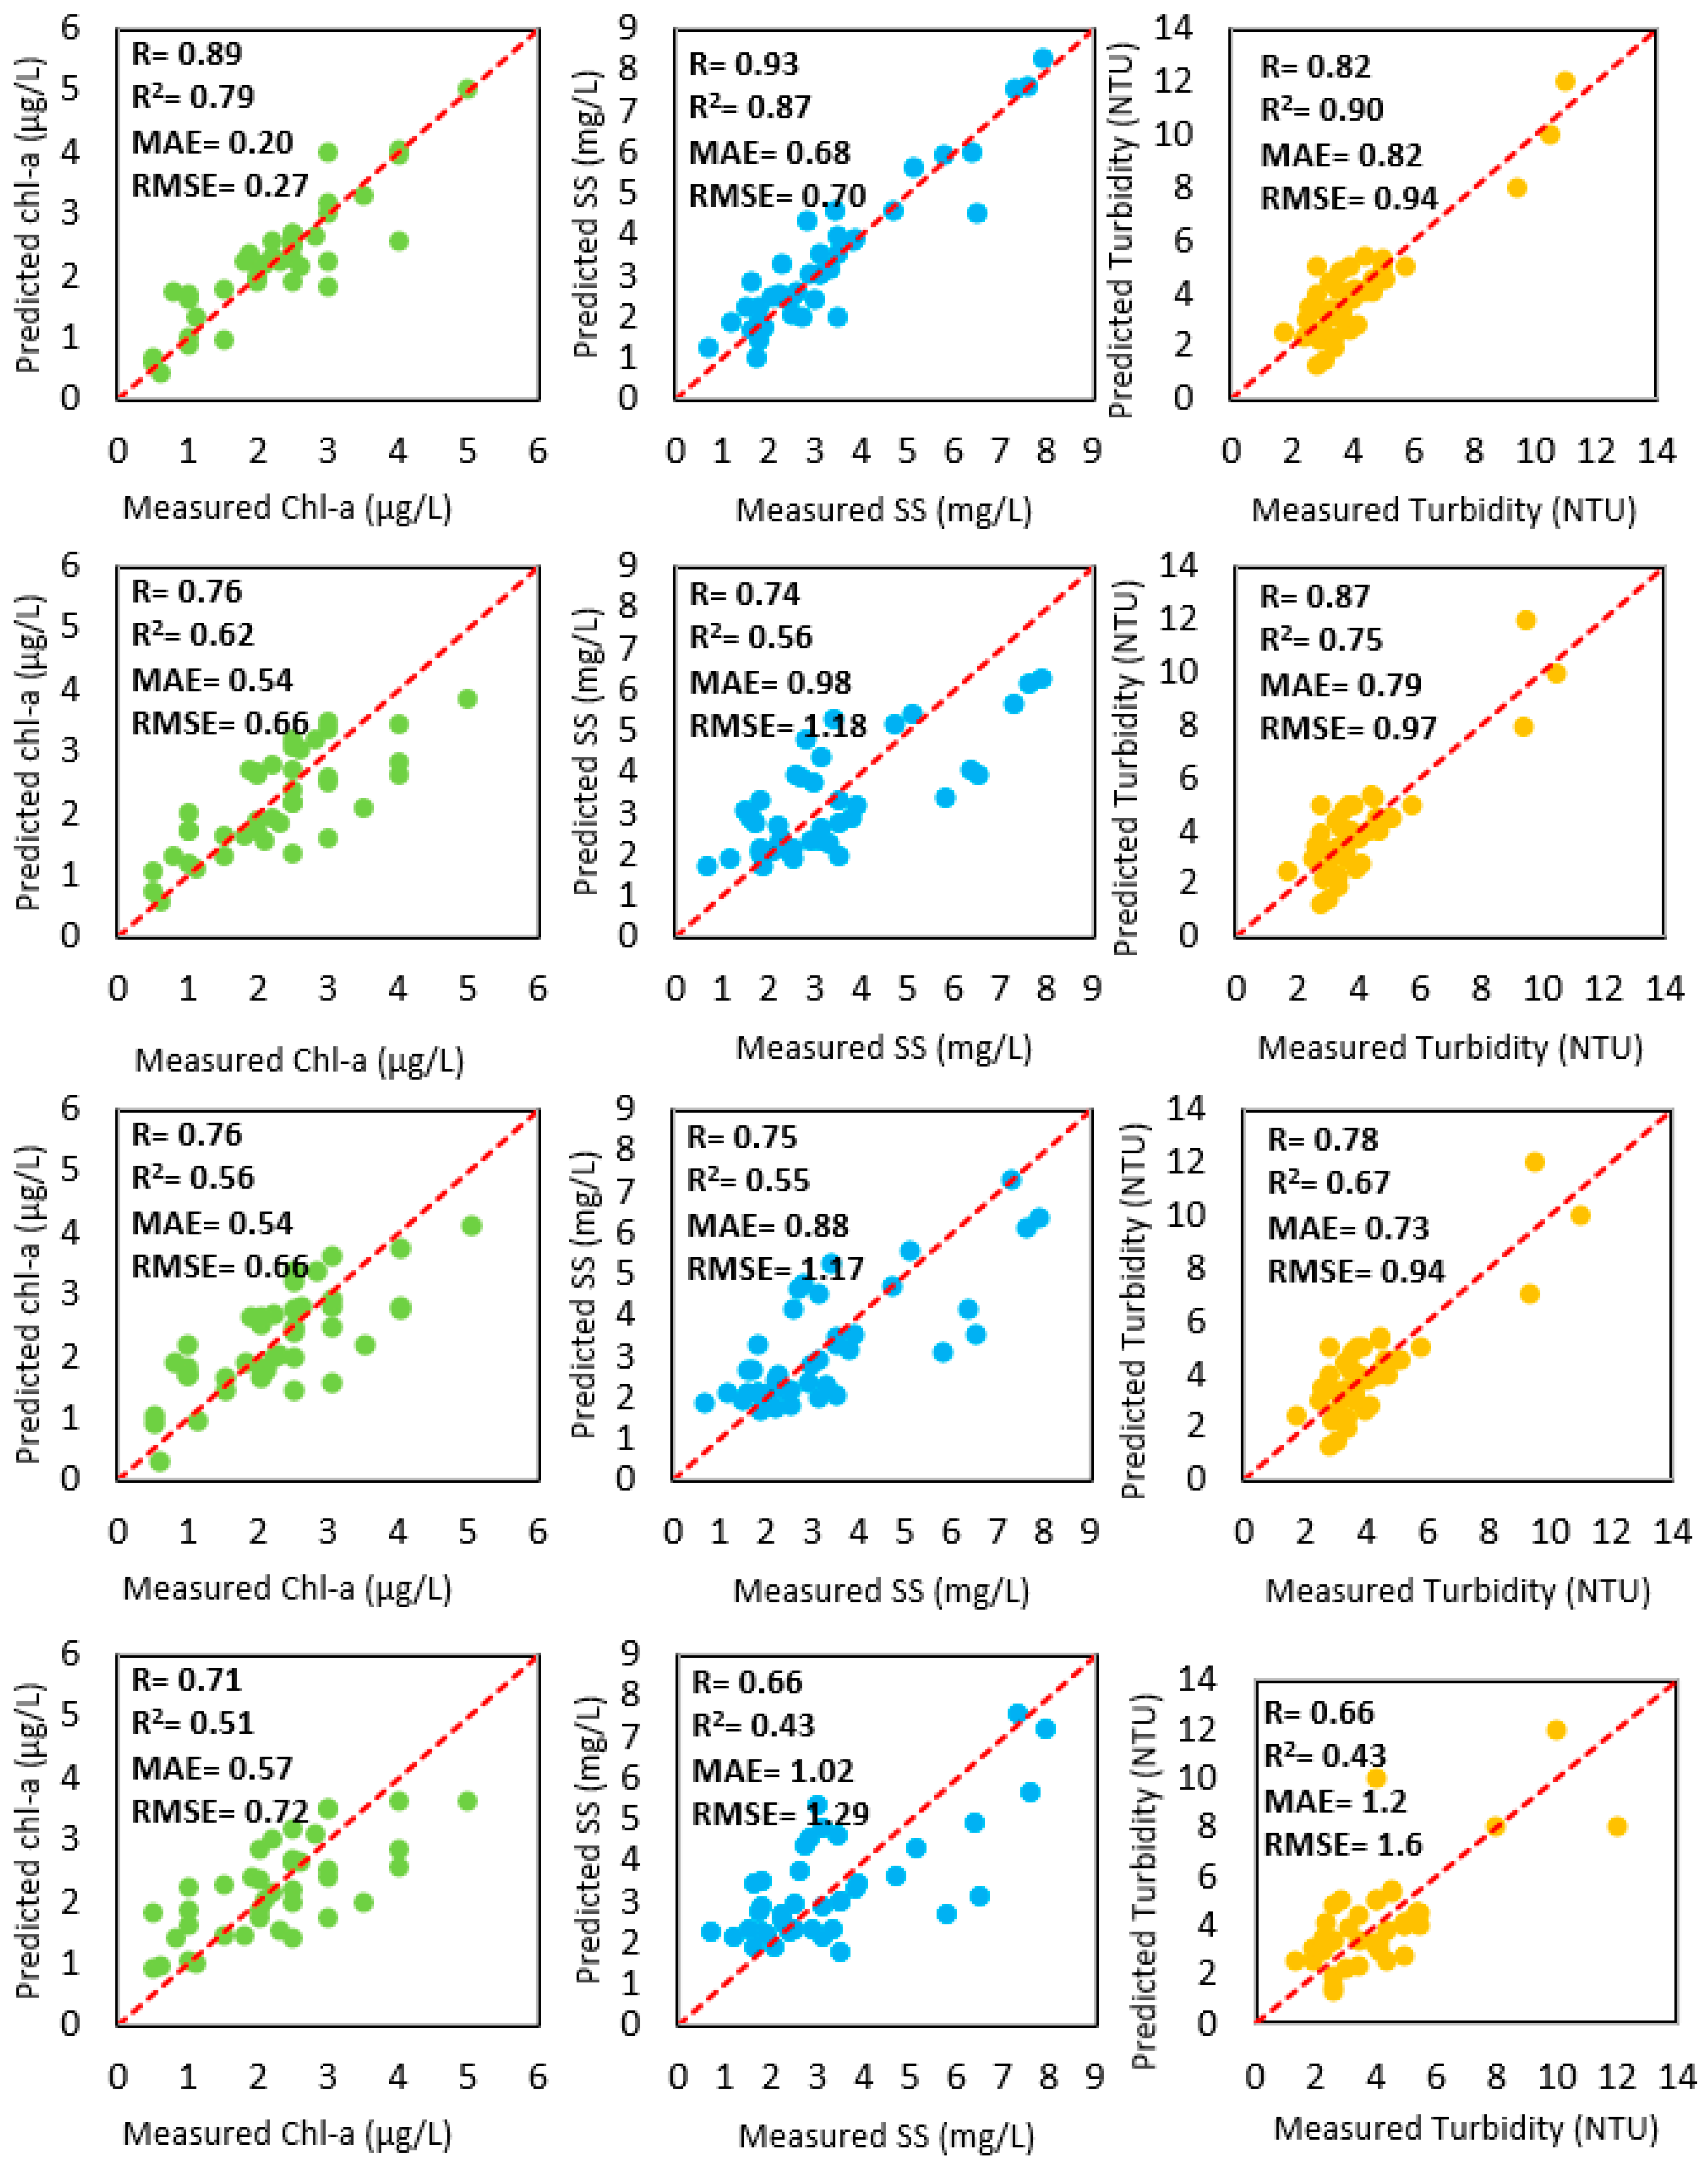
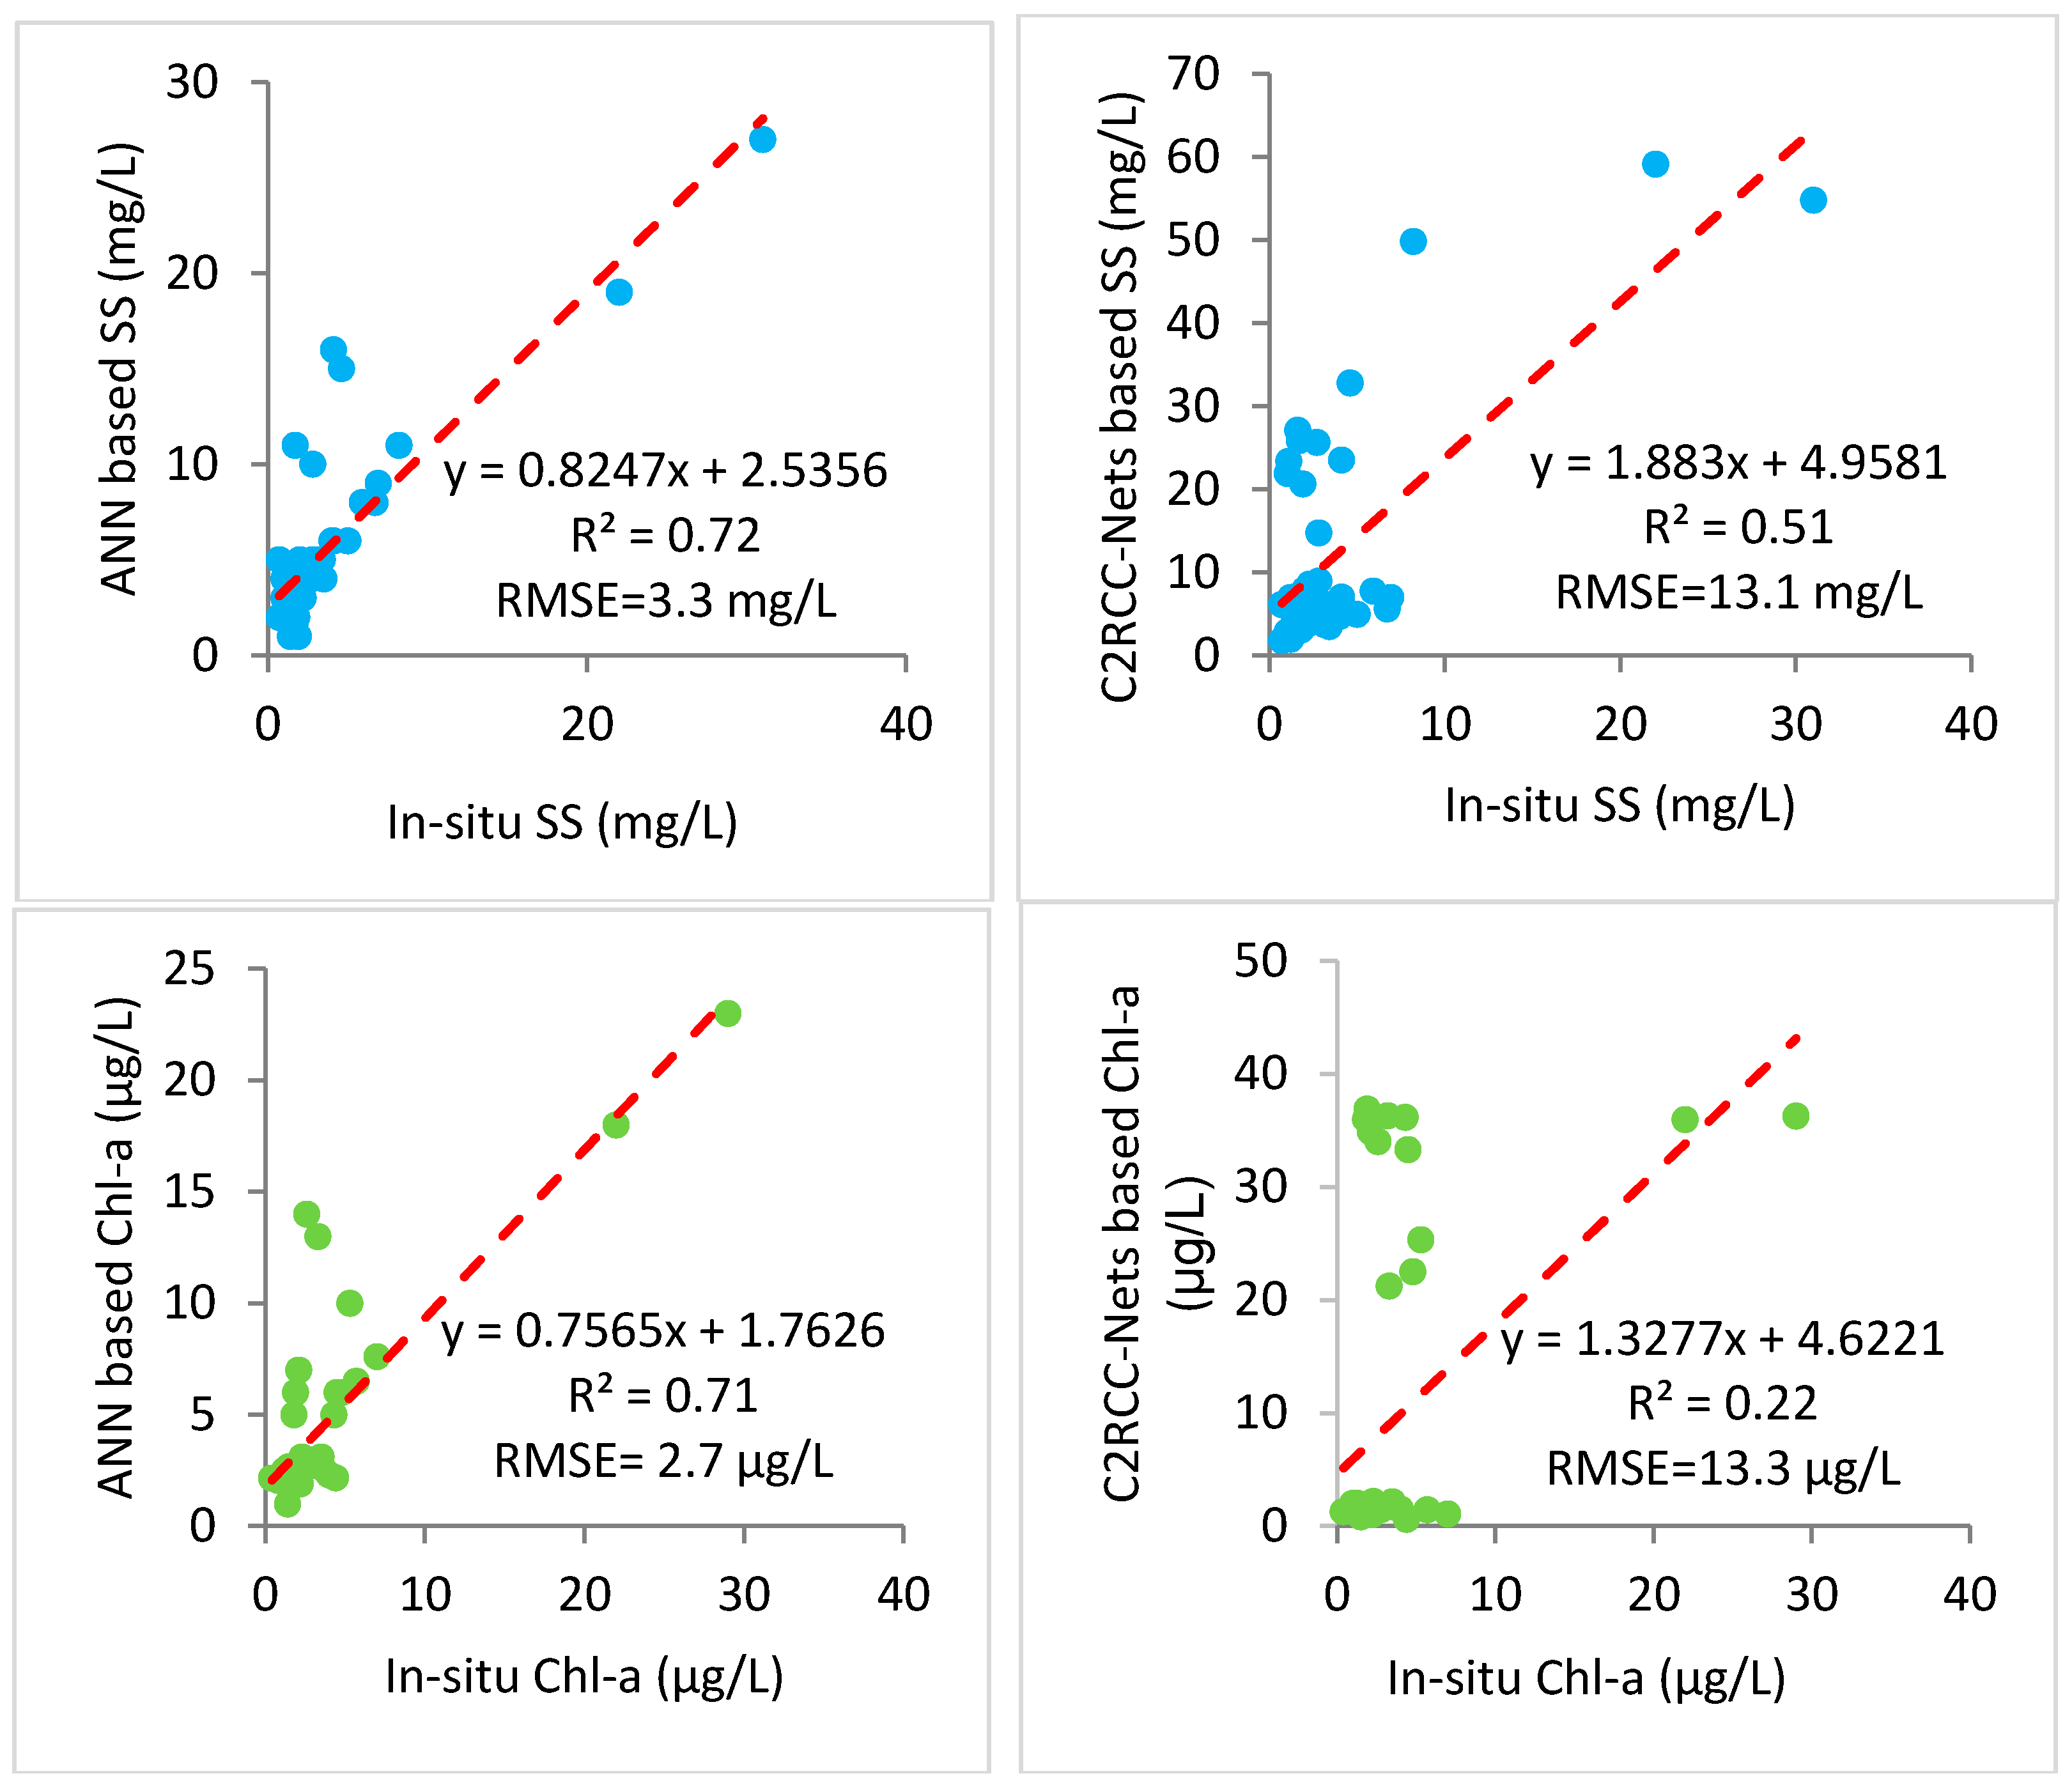
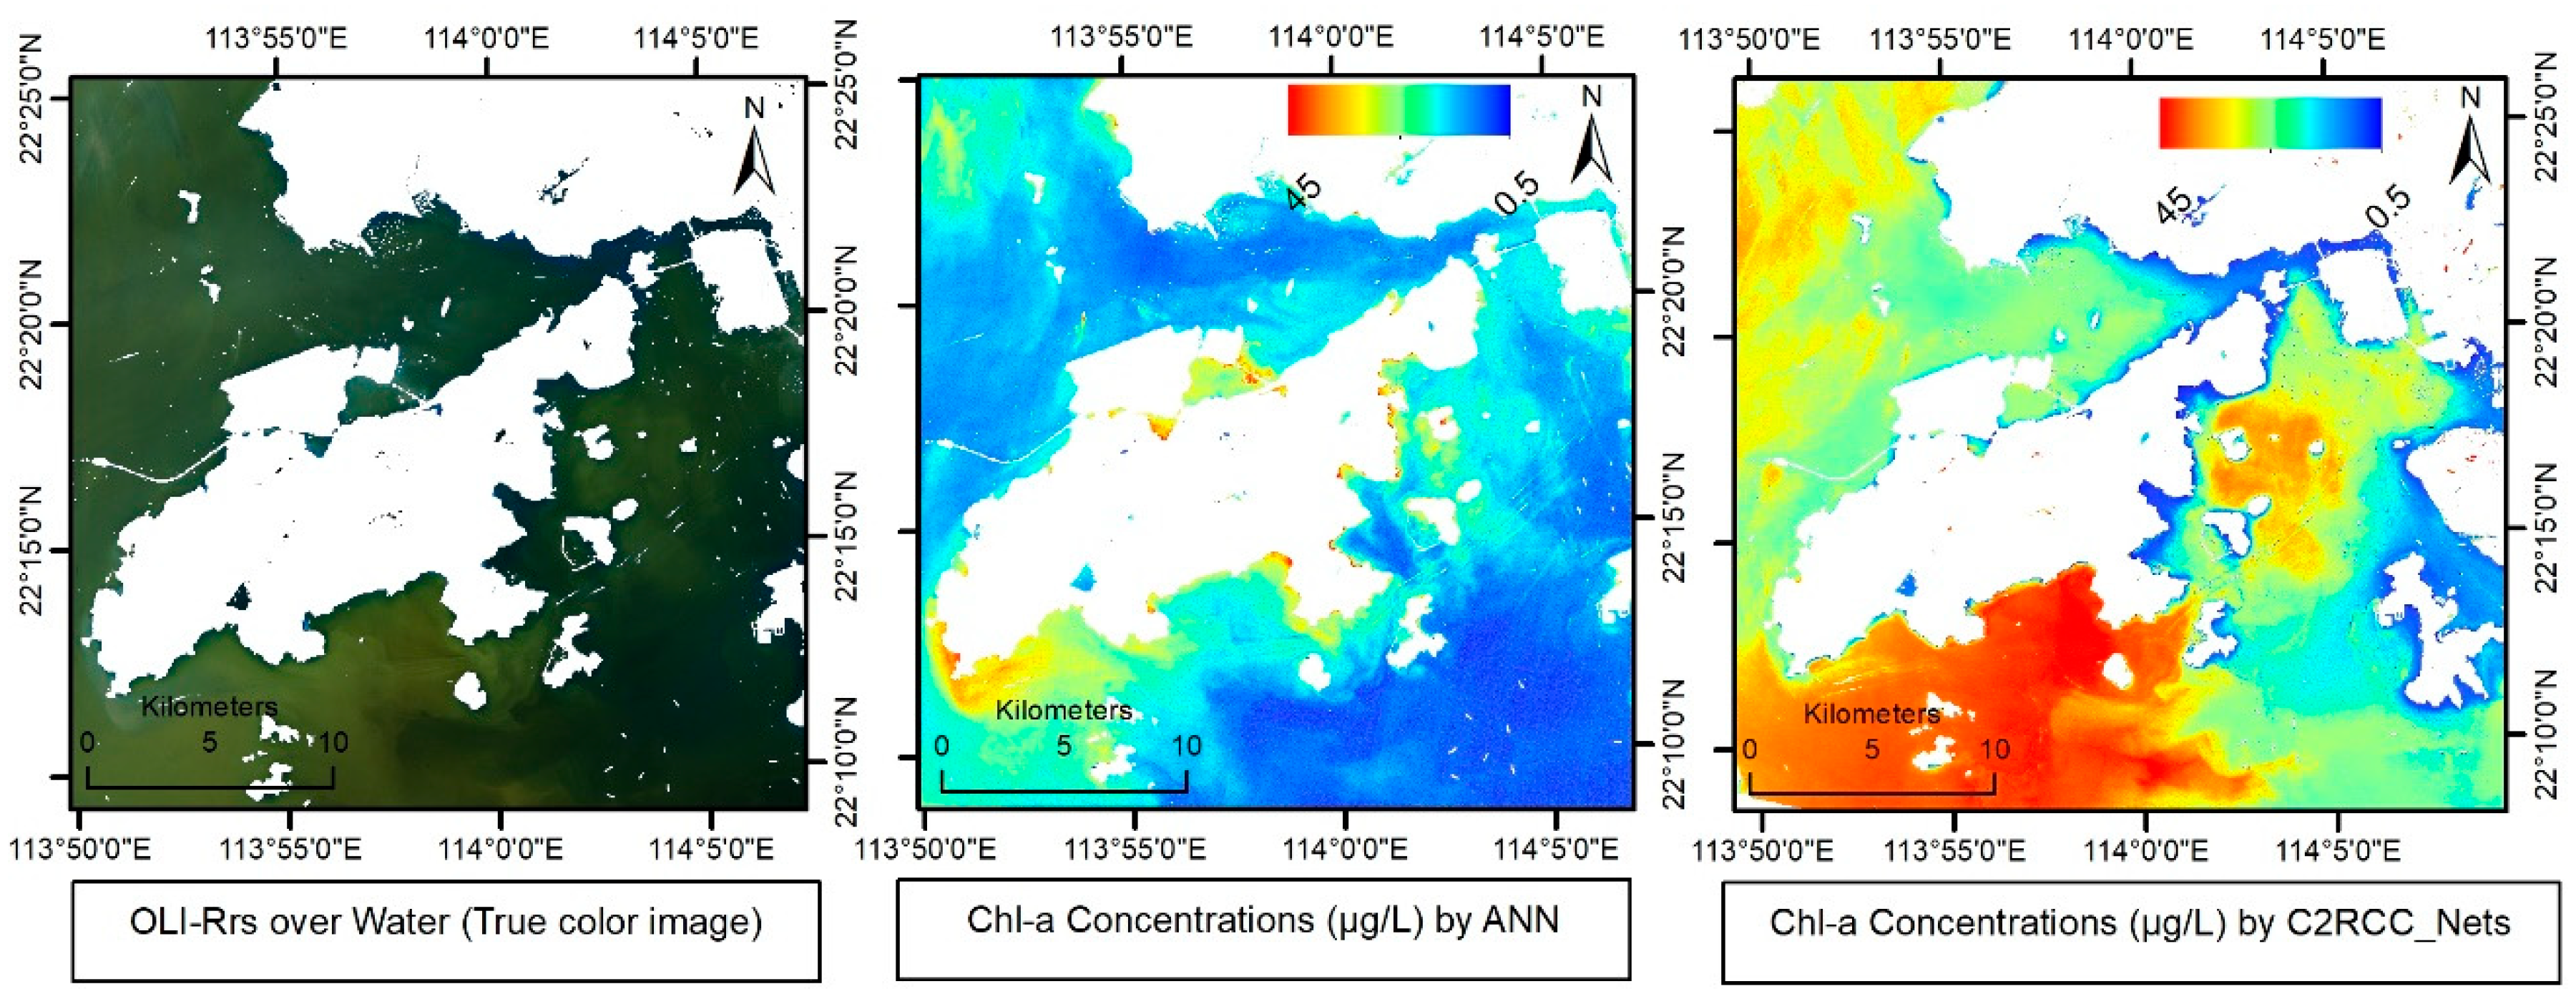
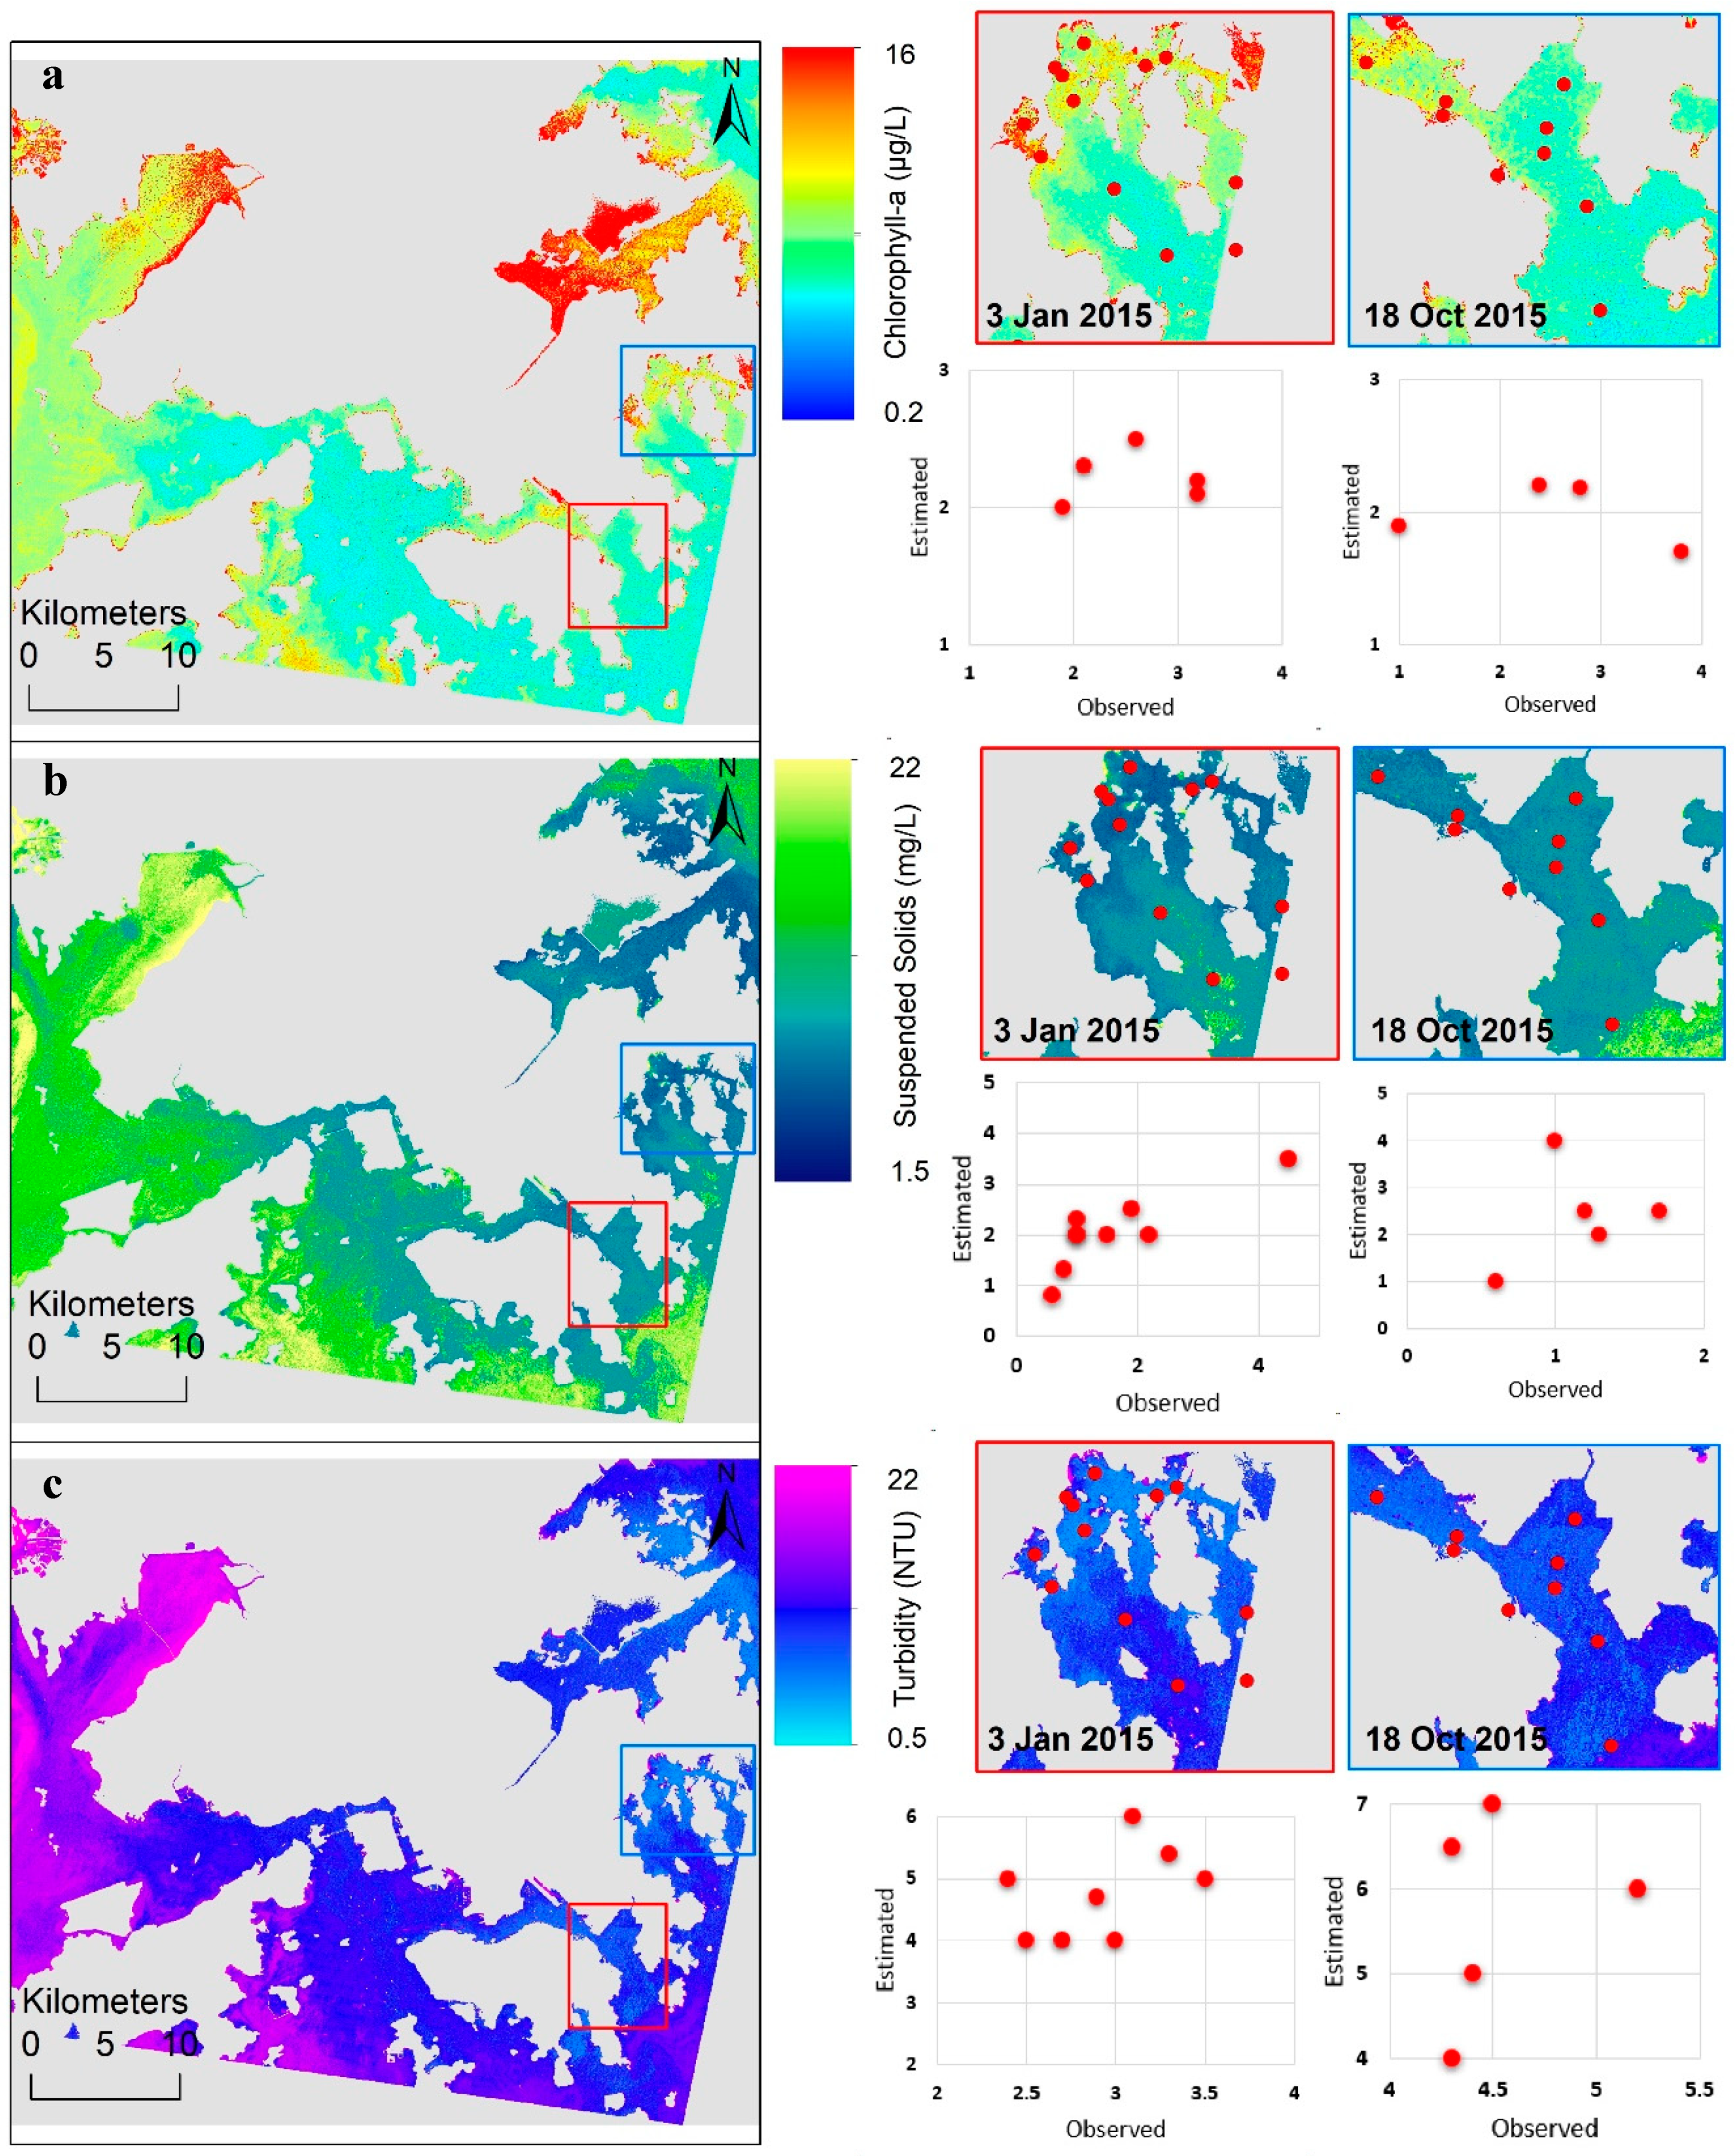
The study examined four machine learning approaches for retrieval of water quality indicators (Chl-a, SS, and turbidity) over the coastal waters of Hong Kong using water reflectance from both a hand-held spectroradiometer and satellite data and mapped the spatial extent of these parameters. Such maps can be used to identify hotspots for algal blooms and point pollution sources relating to high nutrient concentrations. Based on the results of cross-validation, ANN was outperformed for water quality estimation as ANN exhibits the best performance than other three machine learning approaches, irrespective of the input data used (i.e., in situ reflectance or Landsat reflectance data), resulting in R ≈ 0.9 and RMSE ≈ 0.2–1.4 for Chl-a, R ≈ 0.9 and RMSE 0.7–2.6 for SS, and R ≈ 0.85 and RMSE ≈ 0.9–3.1 for turbidity. Spatially synoptic map** of three WQIs—Chl-a, SS, and turbidity concentrations—were derived using the ANN approach. Outputs of ANN model and standard Case-2 Regional/Coast Colour (C2RCC) processing chain model C2RCC-Nets, using a separate set of satellite data, was further compared with station-based water quality data. The coefficient of determinations are 0.70 and 0.71 for estimating SS and Chl-a, respectively, using locally calibrated ANN and R2 of 0.51 and 0.22, respectively, were found using C2RCC-Nets for estimating SS and Chl-a, respectively.
In addition, the relative importance of each predictor variable was also examined for both reflectance data sets, in order to evaluate the contribution of each variable (wave band) for water quality prediction. In summary, both in situ and satellite-derived reflectance datasets showed similar patterns in identifying sensitive variables to predict water quality parameters. The green band and red bands are more sensitive for predicting Chl-a, and the red band and its combination with blue and green bands are sensitive for predicting SS and turbidity. The effectiveness of sensitive bands also depends on to the absorption and scattering properties of phytoplankton classes (dinoflagellates and diatoms) present in Hong Kong waters. This approach can help to select a suitable spectral range for a detailed study in other regions where the phytoplankton species may be different.
The derived spatial distributions indicated that the observed high concentrations of SS and turbidity result from residential and industrial effluents and nutrient-rich discharge from agricultural land in shallow waters. This study suggests that machine learning approaches with satellite data have promising potential for regular water quality monitoring over large complex coastal areas. The focus of future research is to investigate the seasonal and annual patterns of Chl-a and SS using hyperspectral data.

 ,
, 


