3.1. The Characteristics of SO2 and NO2 Variation during 2005–2017
As the main water-soluble components, sulfate, and nitrate together accounted for a significant fraction (~20–50%) in mass concentration of PM
2.5 particles in China [
4,
11]. Other major particle components such as organic aerosol was generated via complicated chemistry reactions and mineral dust that originated from long-range transport and diverse local sources [
4]. By contrast, emission sources of sulfate and nitrate’s gaseous precursors, SO
2 and NO
x, are mostly from coal-burning power plants and industry activities, which are the main control targets of the government due to the practicability for unified management. Since the short lifetime of SO
2 and NO
2, satellite VCD products of SO
2 and NO
2 are usually used to map anthropogenic emission sources as well as their emission levels [
13,
17].
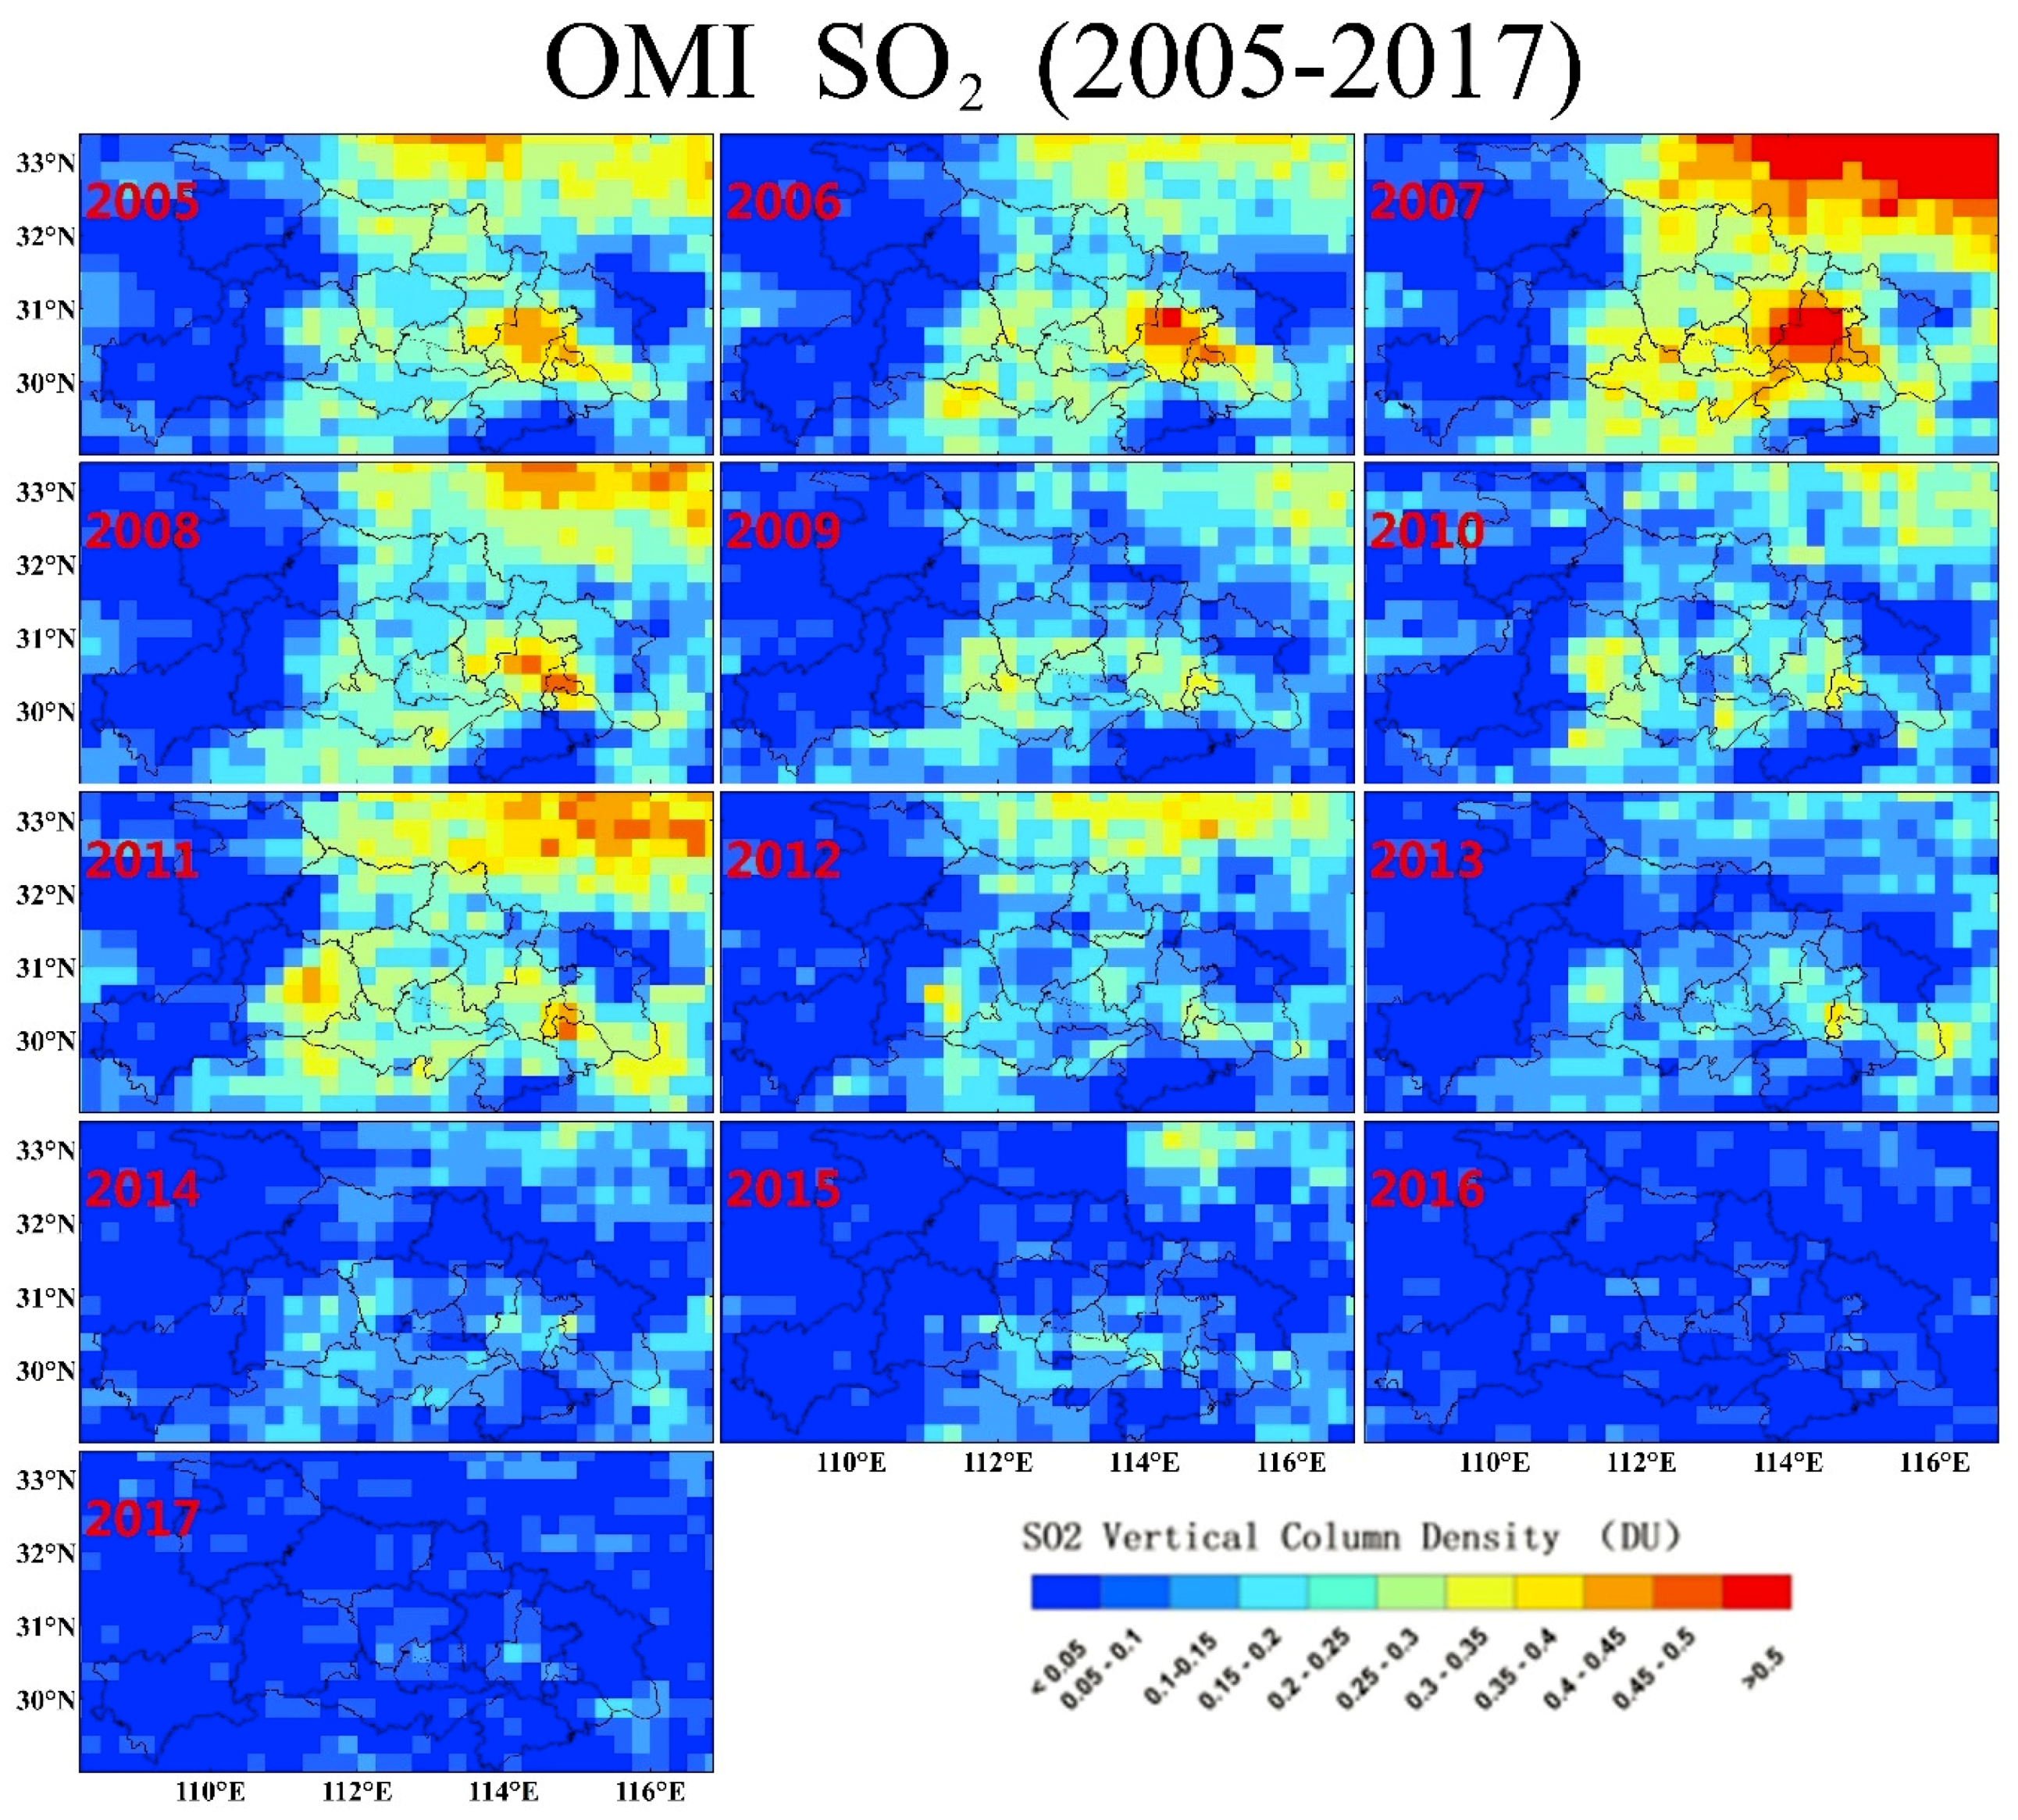
Figure 3 displays variations of OMI SO
2 in Hubei during 2005–2017. There was a notable overall increase in the amount of SO
2 in 2005–2007, with the largest SO
2 hotspot in the megacity of Wuhan. SO
2 in Wuhan increased from ~0.4 to >0.5 DU and from ~0.25 to ~0.35–0.4 DU in other several hotspots. Then, SO
2 concentration in Wuhan exhibited a large decrease by ~0.1–0.2 DU in 2008 and reached a lower level since 2009, which can be connected with implementation of the 2006 desulfurization policy in China [
31]. By contrast, new SO
2 hotspots emerged in 2009 in the southeastern part of Wuhan and in the southwestern part of Hubei, and reached peak values (~0.4) in 2011. In 2012, SO
2 amount displayed a continuous decline and arrives at a very low level (<0.1) in the entire Hubei region by 2016 without large emission sources. Despite low concentration, it should be noted that SO
2 in urban region of Wuhan got higher (~0.2) as a hotspot in 2017.
To have a long-term view of the changes in the overall SO
2 level in central China, spatial means of OMI SO
2 compared with statistical SO
2 emission amount during 2005–2017 (
Figure 4). There is a generally consistent trend between OMI SO
2 concentration and emission amount. Different from the peak value of SO
2 concentration in 2007, statistical SO
2 emissions in
Figure 3 show the largest SO
2 amount of ~760,000 tons in 2006. In 2007, the much higher OMI SO
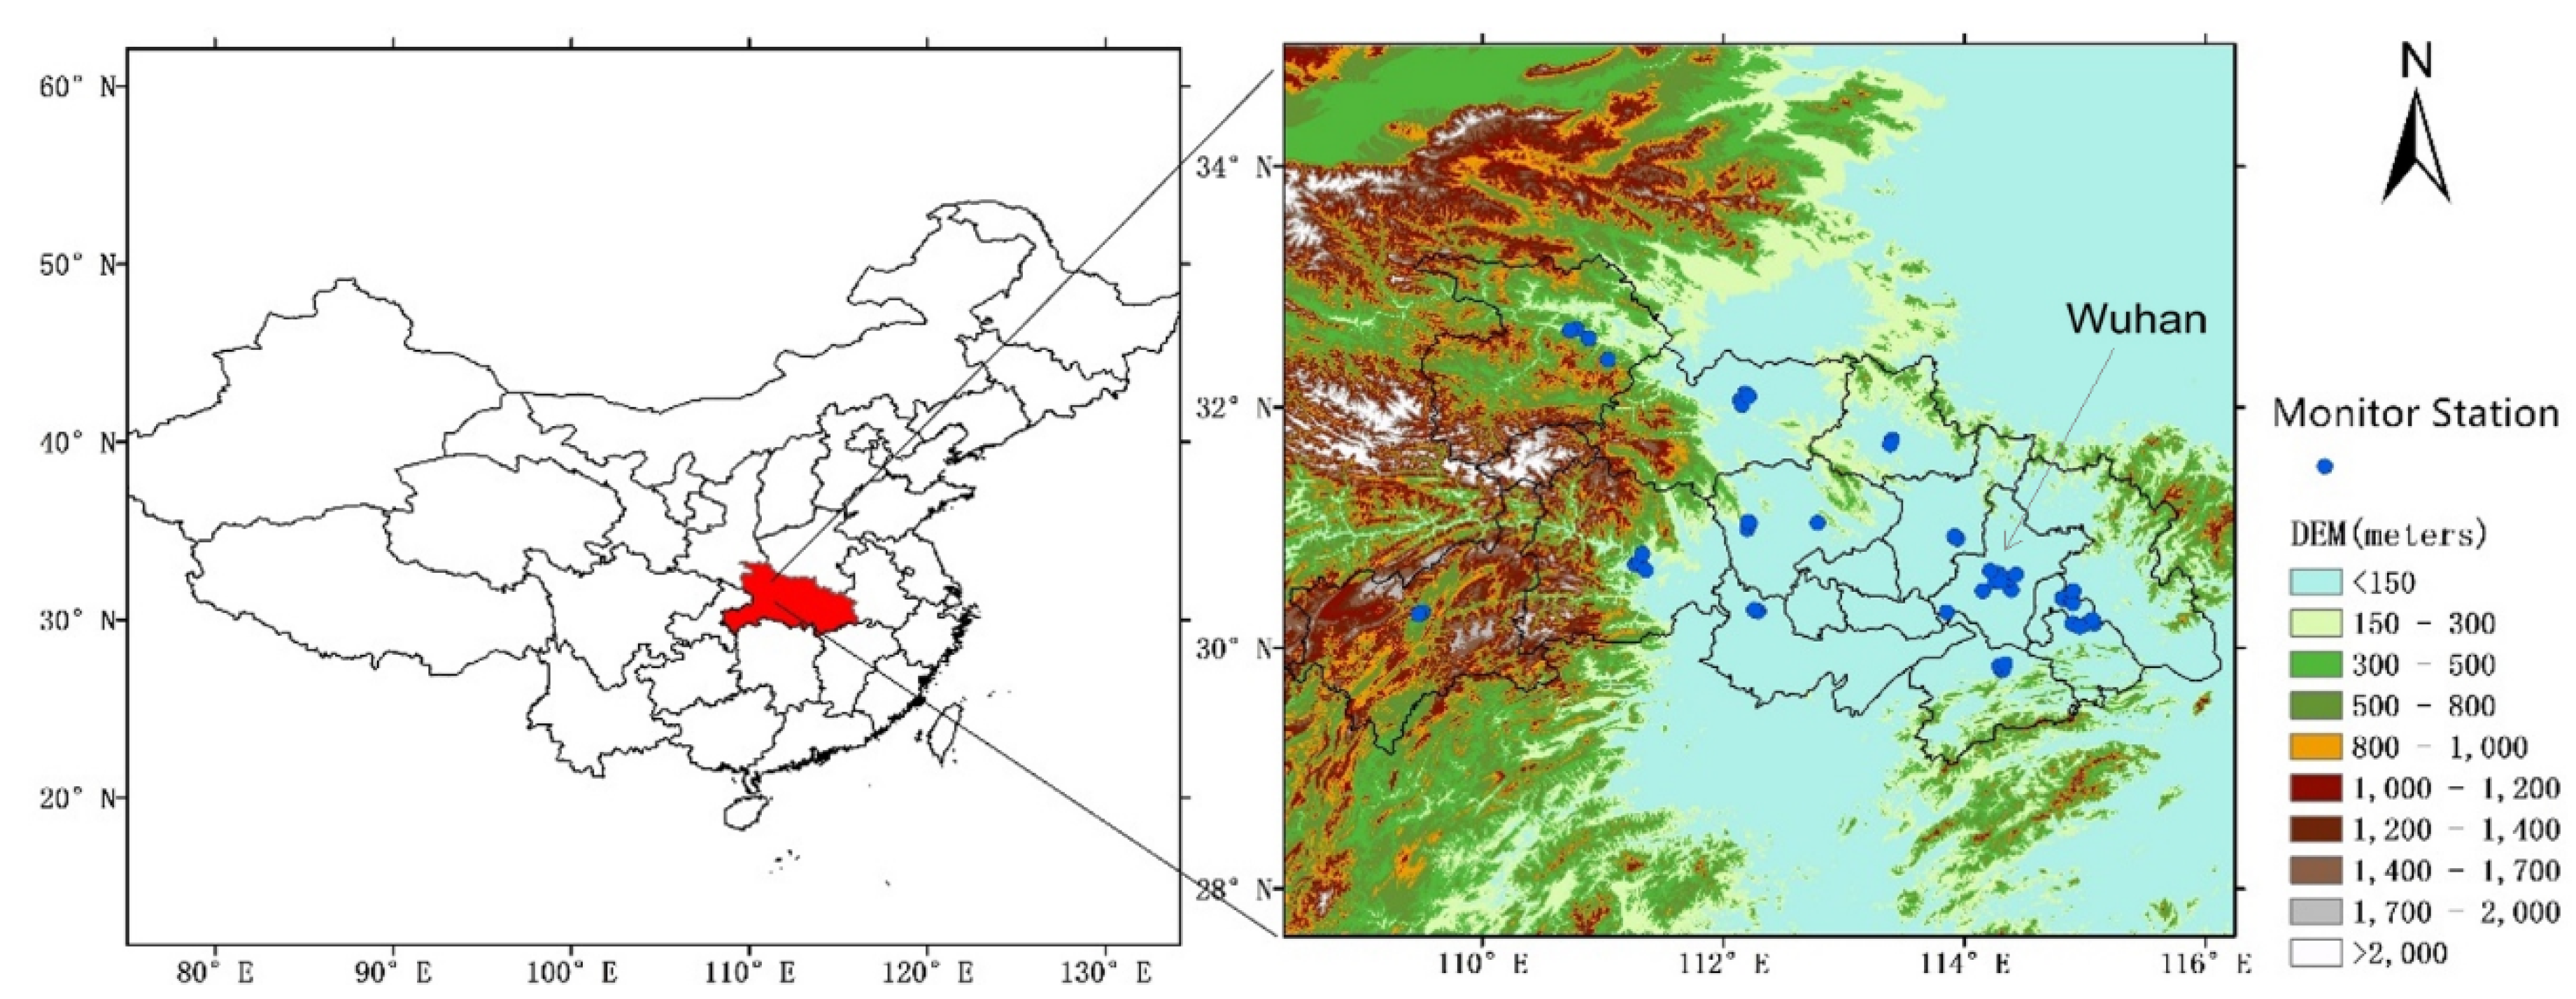
2 VCD in both Hubei and its adjacent part to the north demonstrates that the bottom-up statistical emission can miss some substantial emission sources (
Figure 2), especially in the early stage of SO
2 control. Considering the desulfurization policy in China from 2006 [
31], the emission peak in 2006 can be partly caused by statistics of mainly large SO
2 sources. On the other hand, OMI retrievals show a more rapid decline of SO
2 amount (~50%) than statistical amount (~10%) since 2008. The increase of SO
2 (~50%) in 2010–2011 can be connected with the recovery from the economic downturn in 2009 [
32]. Considering that SO
2 mainly originates from coal-burning combustion of fossil fuels, the low-level SO
2 (~210,000 tons) after 2014 indicates effective effects of SO
2 control policy. The striking deviation of the annual OMI SO
2 shows large temporal variations of the SO
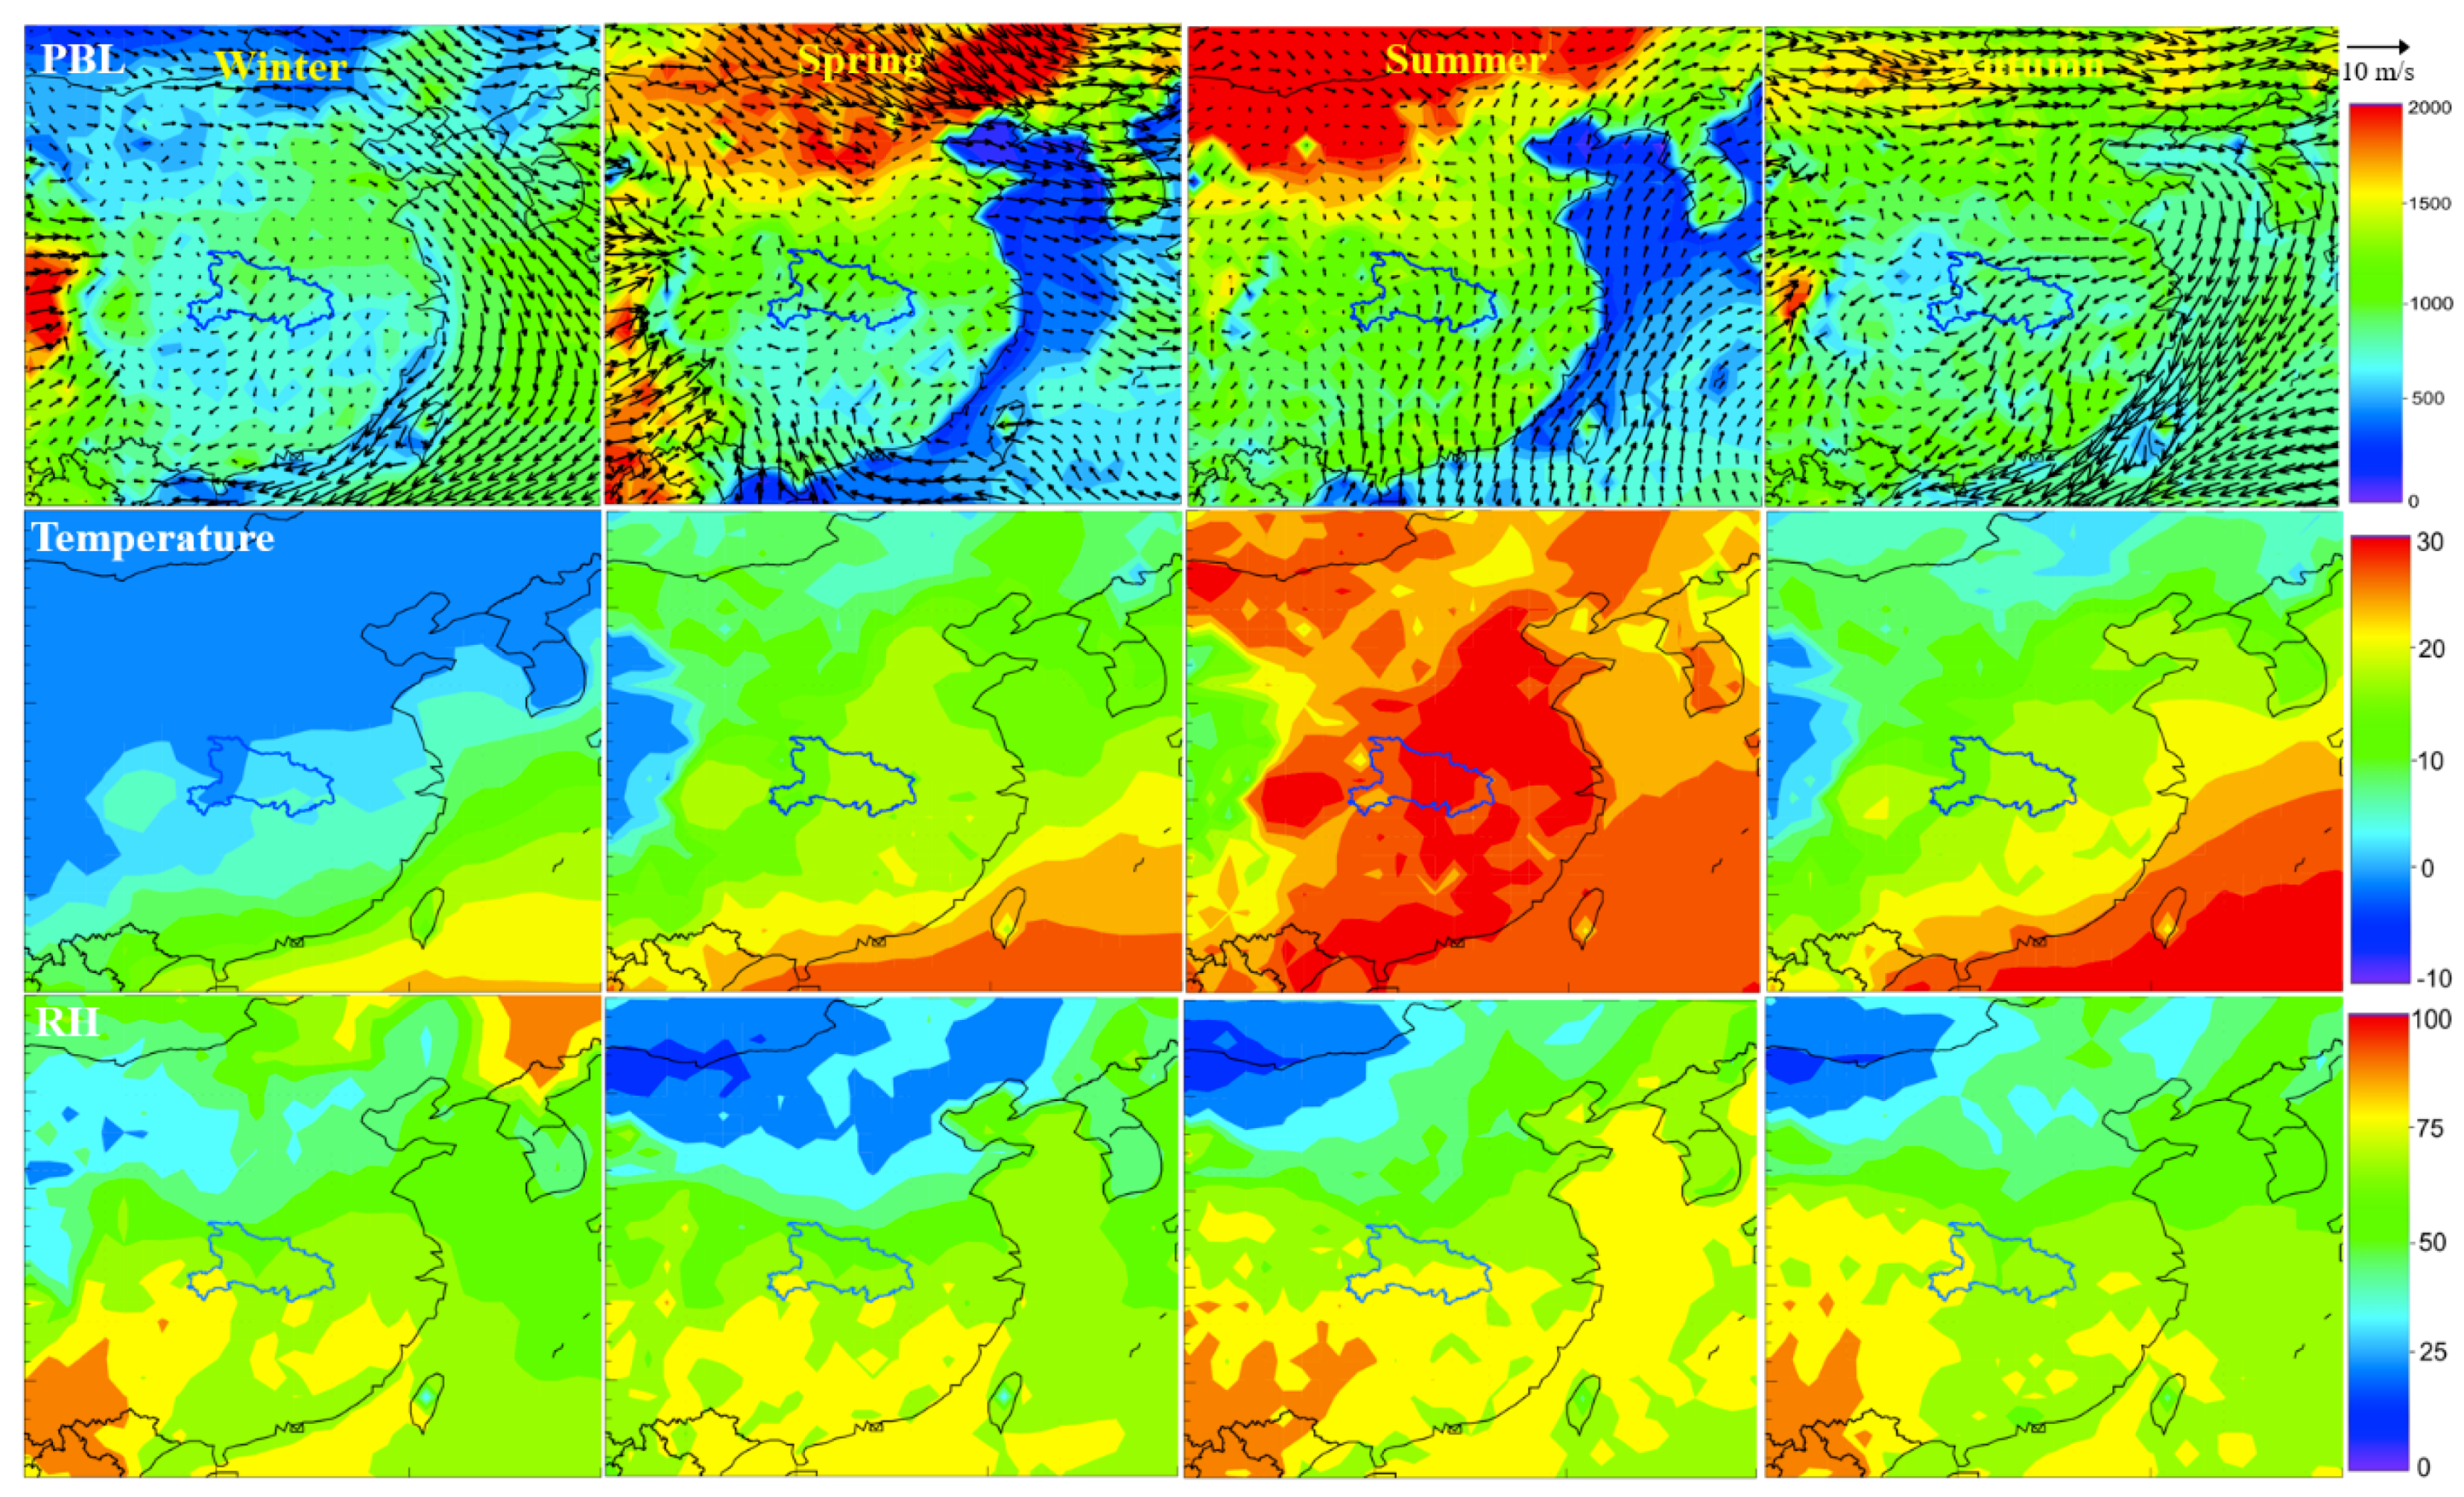
2 level and the variances increase obviously with the mean concentration. Although there is no coal-burning heating during winter in central China as there is in northern China, the formation of sulfate from SO
2 and their lifetime can have considerable seasonal differences due to variations of meteorological conditions such as illumination, temperature, and relative humidity (
Figure 2).
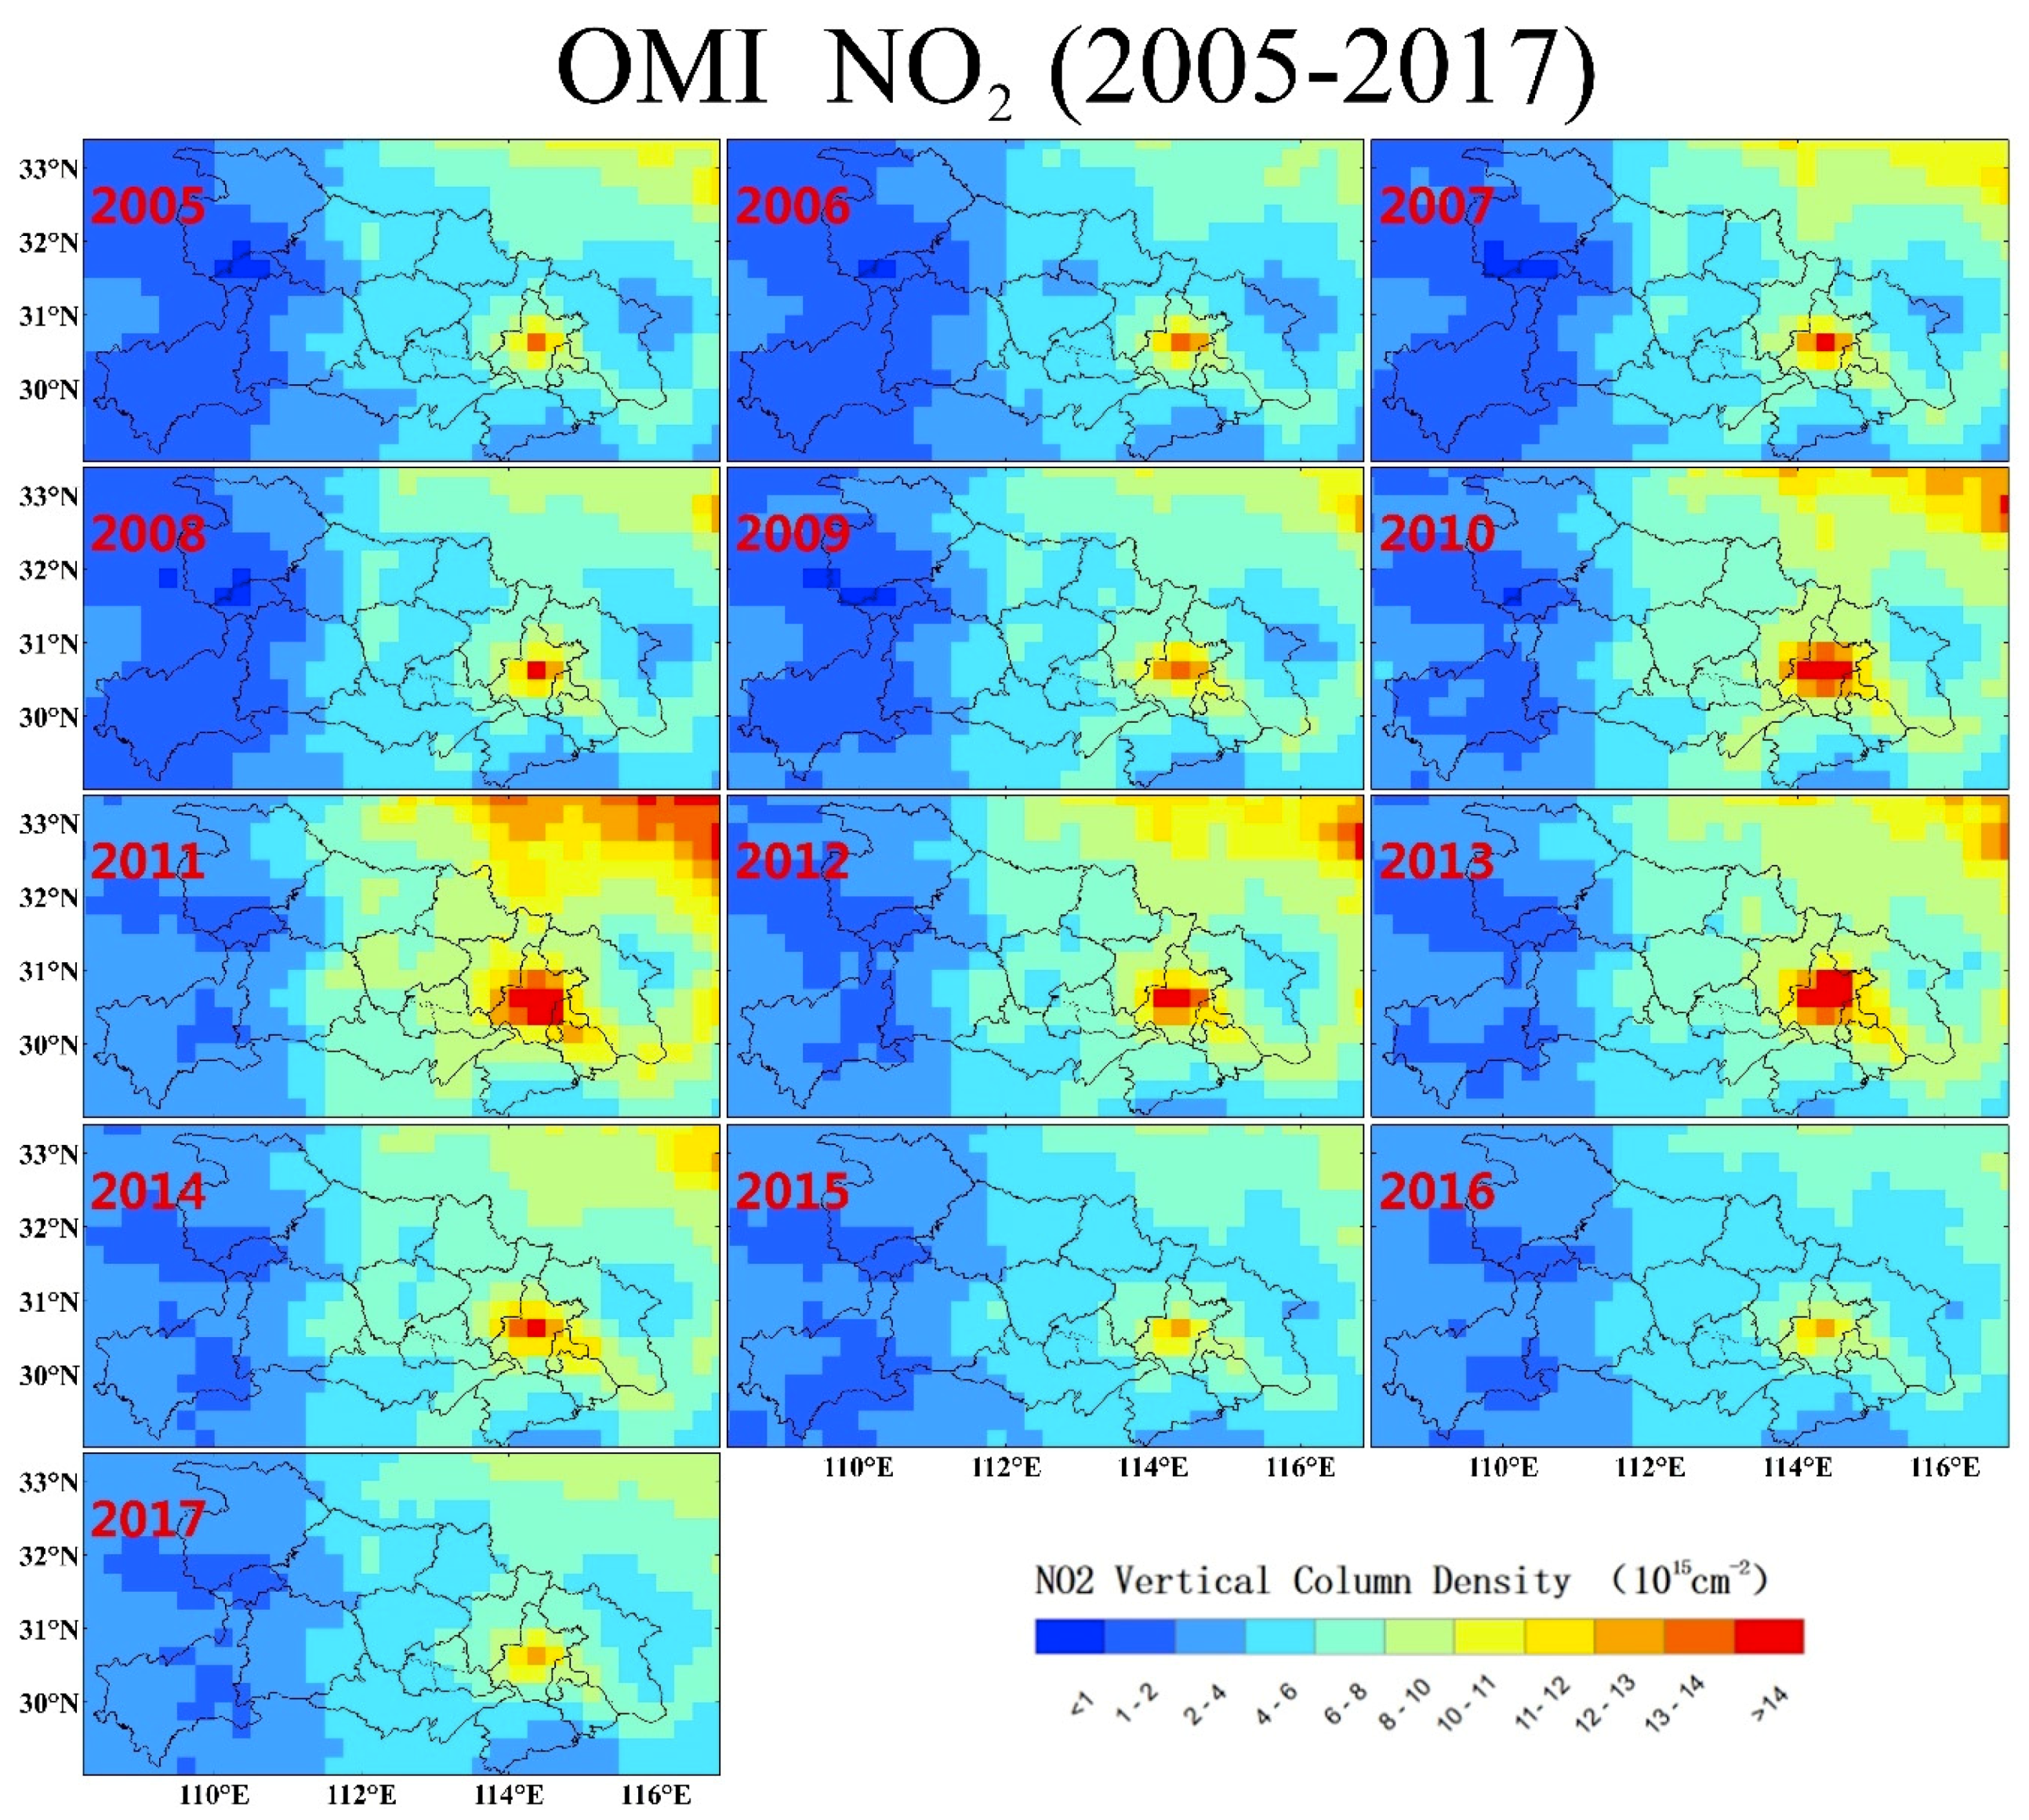
Compared with SO
2, OMI NO
2 VCD during 2005–2017 exhibited distinct spatial and temporal variations (
Figure 5). There is only one prominent NO
2 hotspot in Hubei located in the urban region of the megacity, Wuhan. Despite no obvious emission sources shown in the OMI results except Wuhan, NO
2 in the central and eastern parts of Hubei was higher than background mountain areas. There was a steady overall increase in NO
2 concentration in central China during 2005–2011. OMI NO
2 in Wuhan increased from ~10 during 2005 to >14 × 10
15 molecules cm
−2 in 2011. The NO
2 in the whole region also reached a maximum in 2011 with an increase of ~4 × 10
15 molecules cm
−2, almost >100% compared with that in 2005. It is worth noting that NO
2 in Wuhan also declined slightly (by ~2 × 10
15 molecules cm
−2) as SO
2 in the economic downturn period in 2009. Then, NO
2 in the whole east-central Hubei began to decrease, except for a recovery of ~2 × 10
15 molecules cm
−2 in Wuhan during 2013. By 2016, OMI NO
2 was at a close level with that in 2005. However, there was a slight increase for NO
2 in Wuhan during 2017.
Different from the spatial shift of SO
2 hotspot, NO
2 in the megacity of Wuhan was highest in Hubei during that time, where the number of vehicles exceeded three million by 2017 with rapid increases.
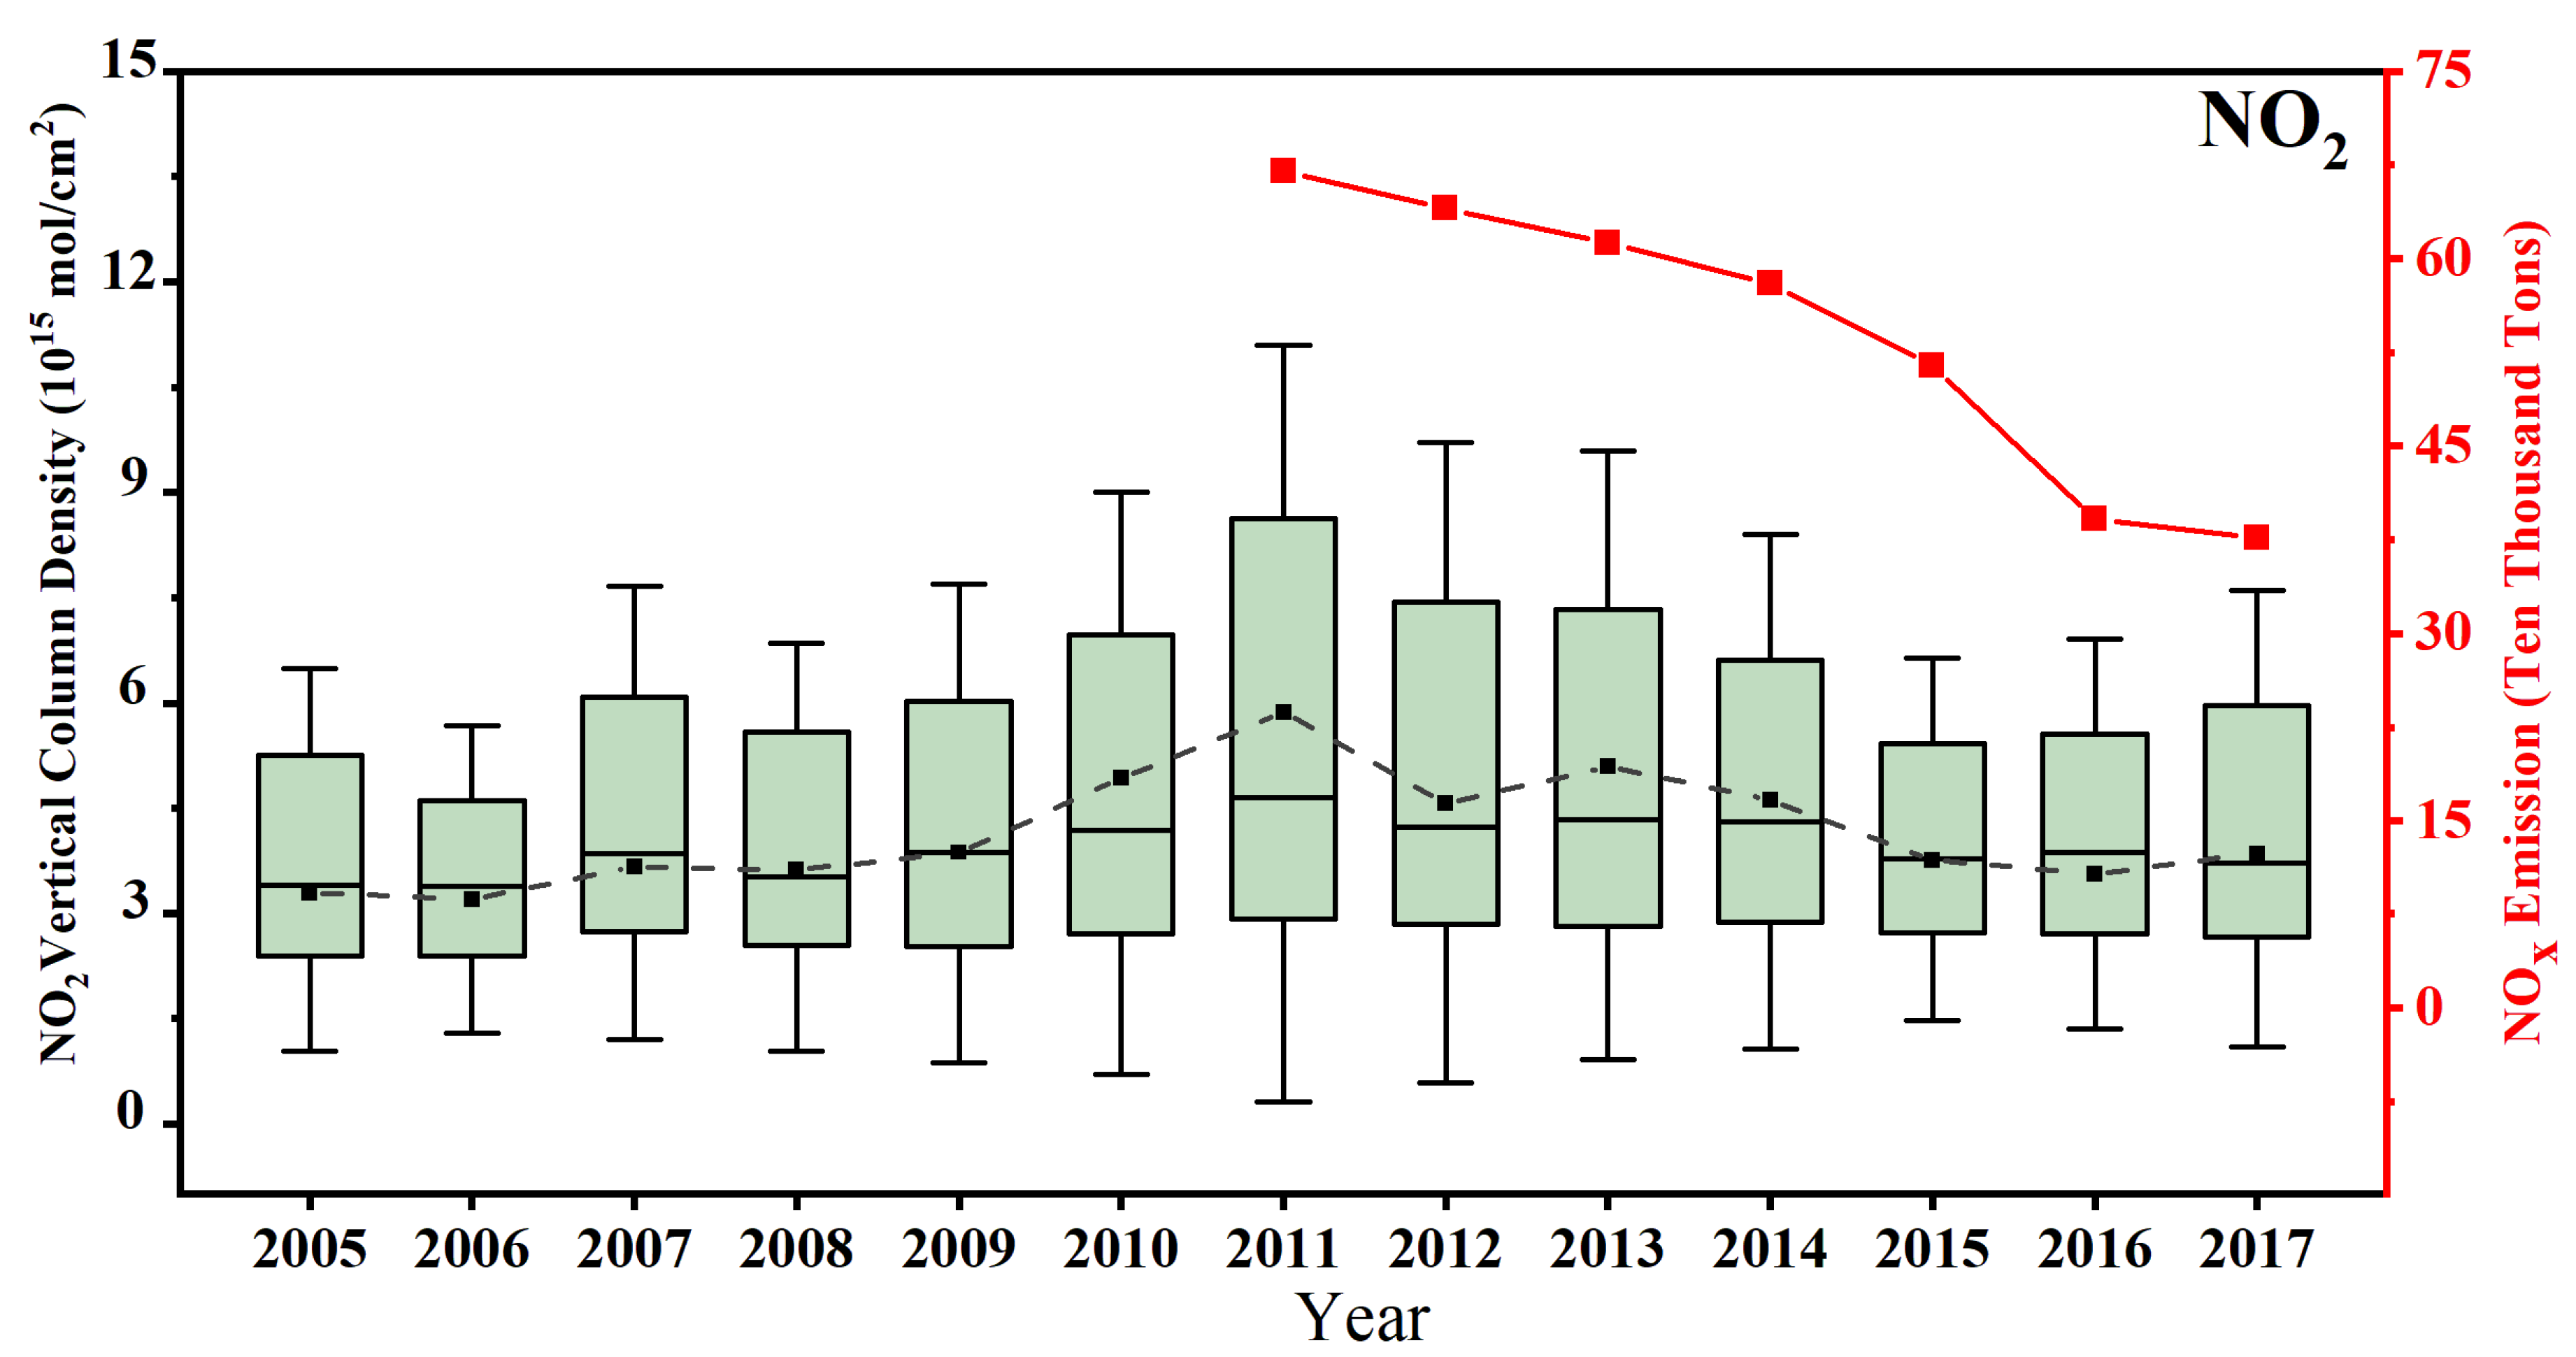
Figure 6 gives comparison of variations of OMI NO
2 VCD and statistical NO
x emissions. It can be seen that the overall NO
2 in central China increased by almost ~90% to 100% from ~3.2 to 5.9 × 10
15 molecules cm
−2 in 2005–2011. Although the overall level of NO
2 amount since 2011 had a general downward trend as SO
2, there were two notable increases in NO
2 during 2013 and 2017, respectively, which were not reflected in statistical NO
x emissions. The large anthropogenic sources such as power and steel plants not only emitted SO
2, but also lots of NO
x. By 2011, NO
x emissions of ~690,000 tons were a little higher than SO
2. Different from SO
2 emissions mainly concentrated in coal-burning sources, NO
x also originated from dispersed vehicle emissions. Since 2011, the Chinese EPA began to control NO
x emissions from large sources such as coal-burning plants, but the number of vehicles kept rapidly increasing. OMI NO
2 in 2017 (~3.9 × 10
15 molecules cm
−2) indicated that NO
x emissions tended to increase under the current background. It should be noted that NO
x emission of ~380,000 tons in 2017 was nearly twice of SO
2 (~210,000 tons), demonstrating the more important role of NO
x emission in the future control. Similar as SO
2, the yearly OMI NO
2 exhibited a large deviation from the mean.
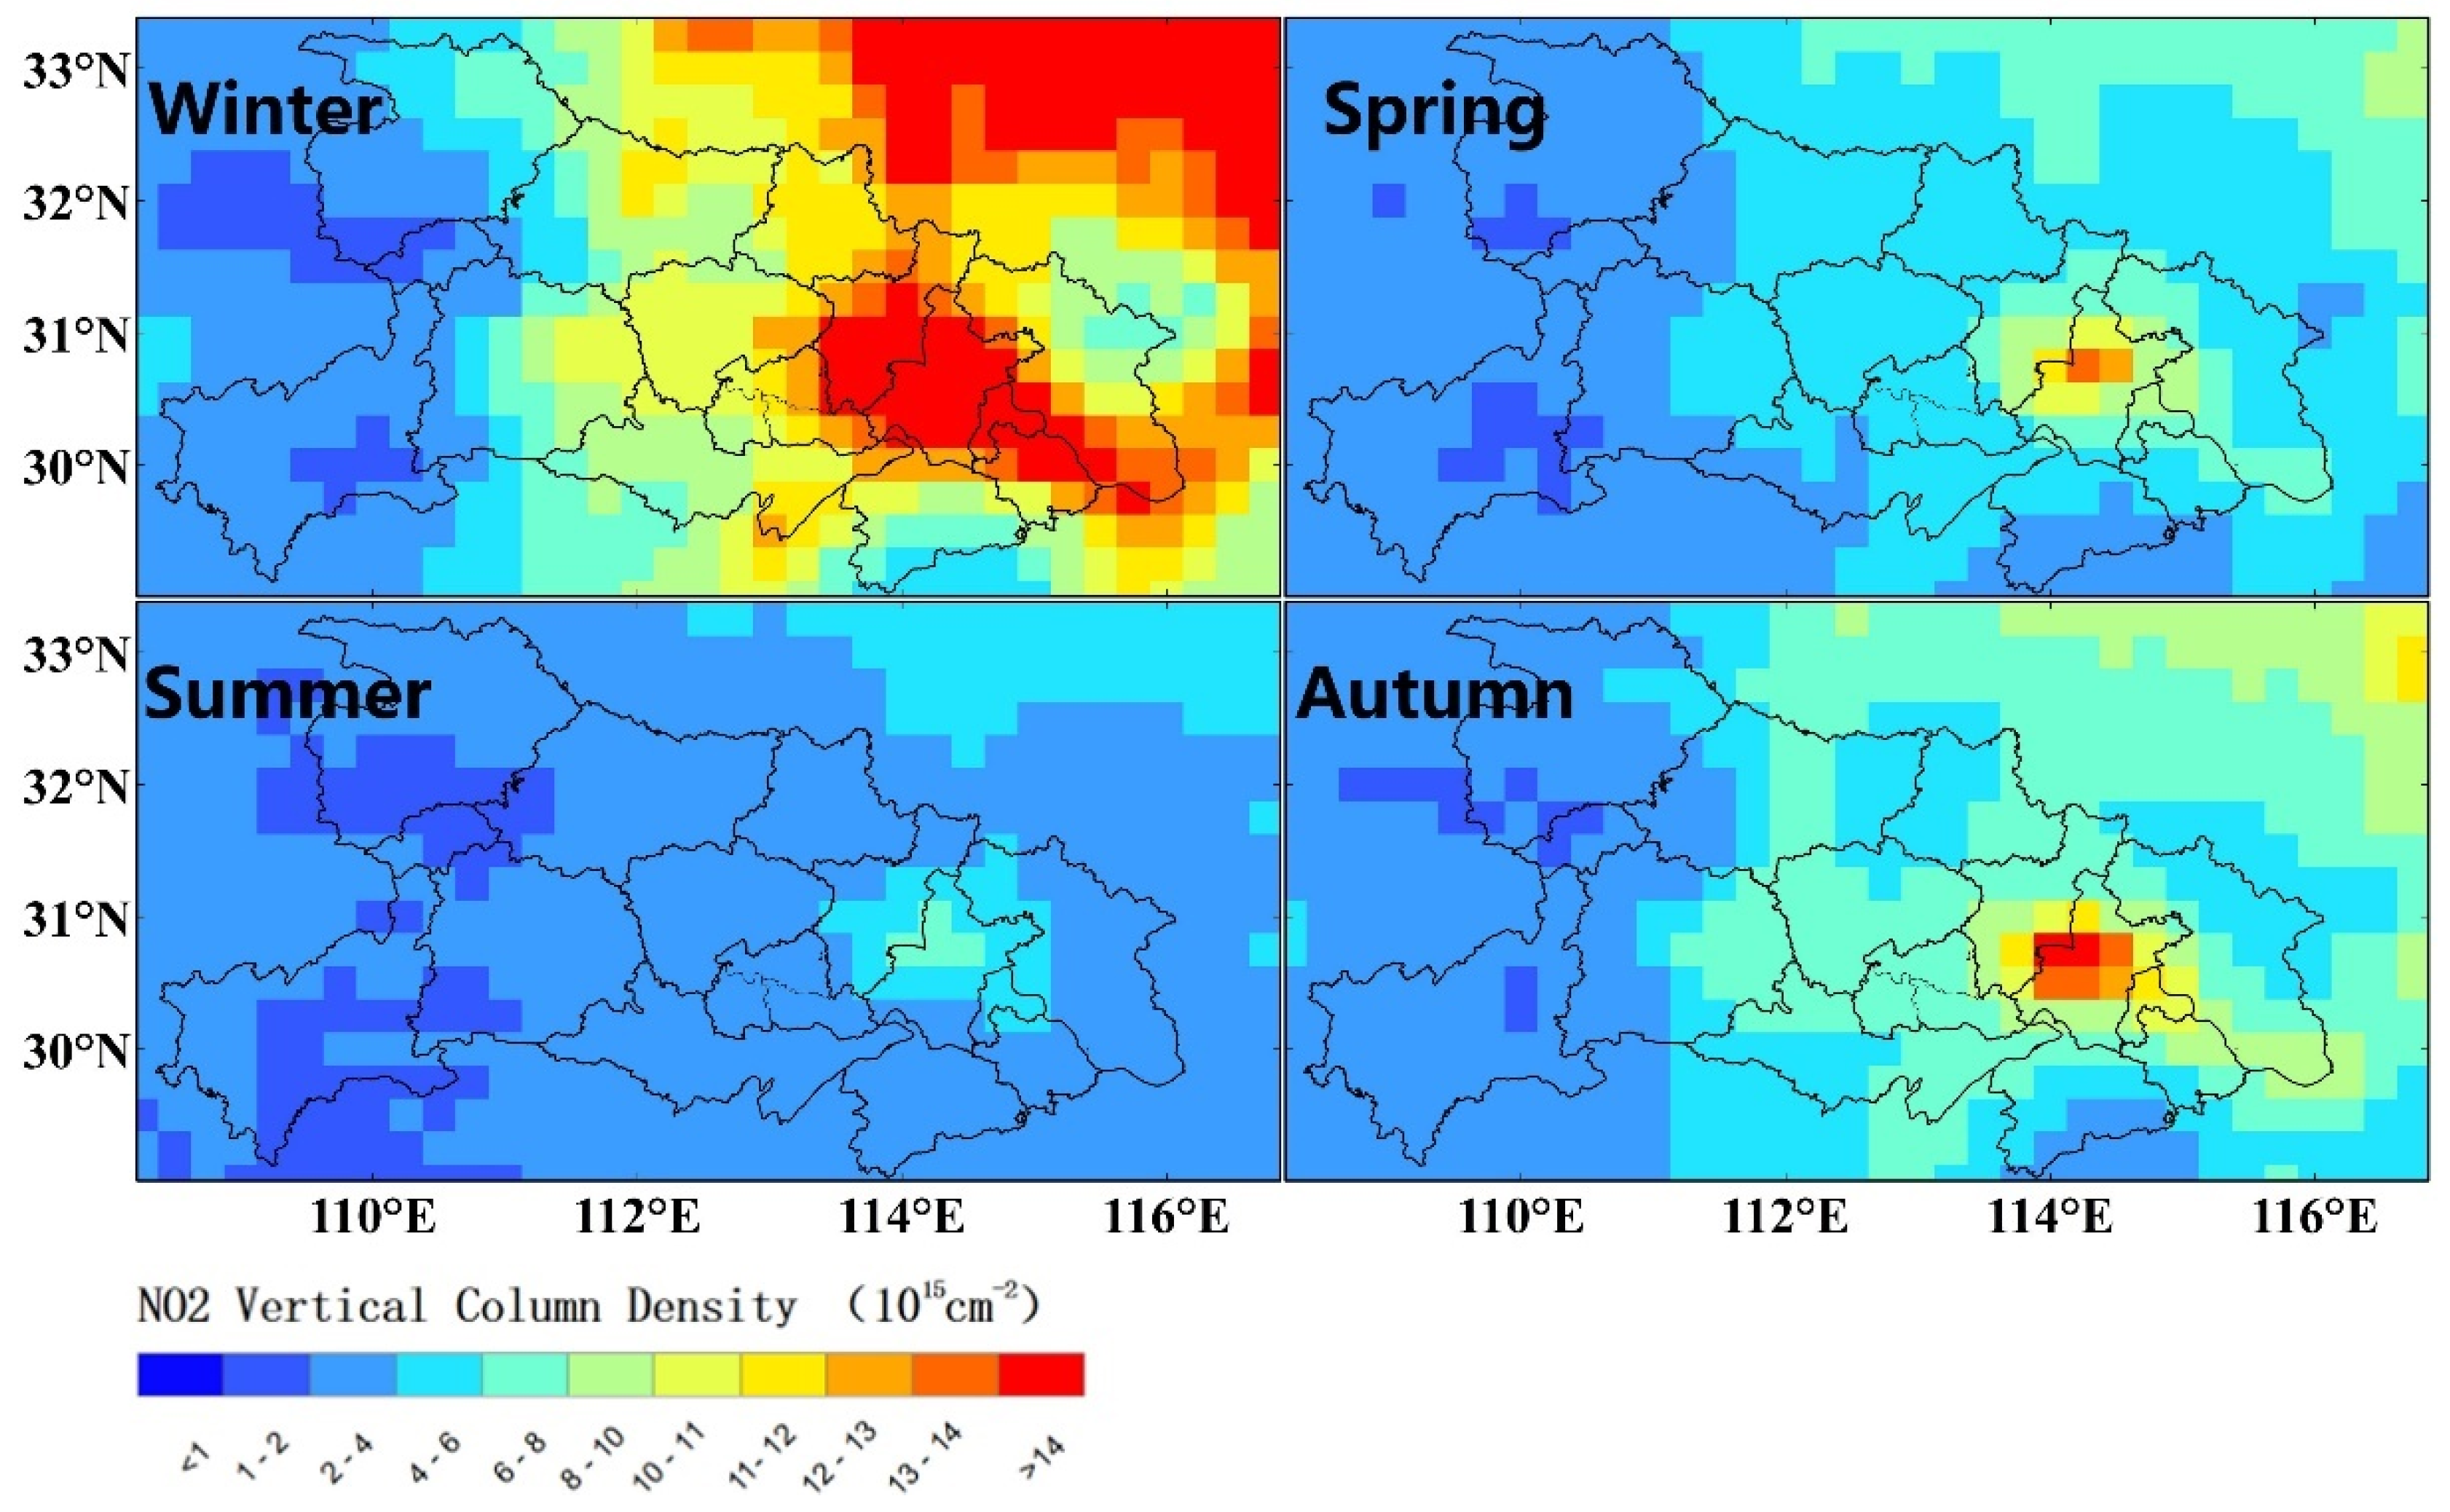
To further examine spatial patterns of NO
2 pollution, seasonal distribution of OMI tropospheric NO
2 VCD is shown in
Figure 7. The NO
2 concentration was highest in winter and then in Autumn, with the lowest NO
2 in summer. Since chemical reactions of NO
x highly depend on ambient temperature [
10], the hot and cold weather in summer and winter were the main drivers of this great seasonal contrast in NO
2 levels. Moreover, the more stagnant weather in winter favored accumulation of NO
x emissions (
Figure 2). It can be seen that NO
2 hotspots (~12–13 × 10
15 molecules cm
−2) existed over several smaller cities of Hubei during winter and exceeded ~14 × 10
15 molecules cm
−2 in the entire Wuhan region. There is a notable connection for high NO
2 between Hubei and adjacent areas, indicating potential transport from northern China [
14,
21]. By contrast, the NO
2 hotspots in central China were independent in other seasons. Compared with very low SO
2 concentration that was close to the background level in region scale by 2017, the considerable NO
x emission with a slight increase can have a much larger contribution to PM
2.5.
3.2. Spatial and Temporal Distribution of Particle Pollution in 2005–2017
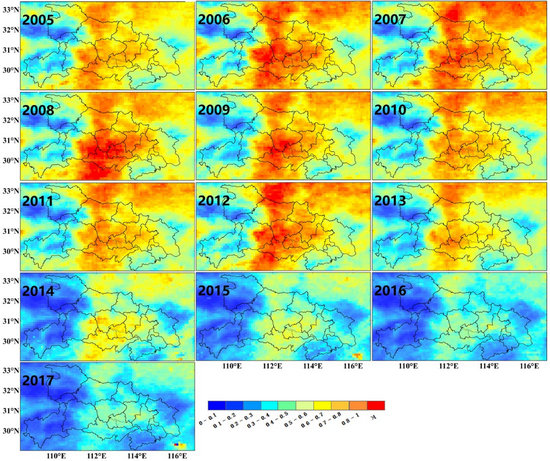
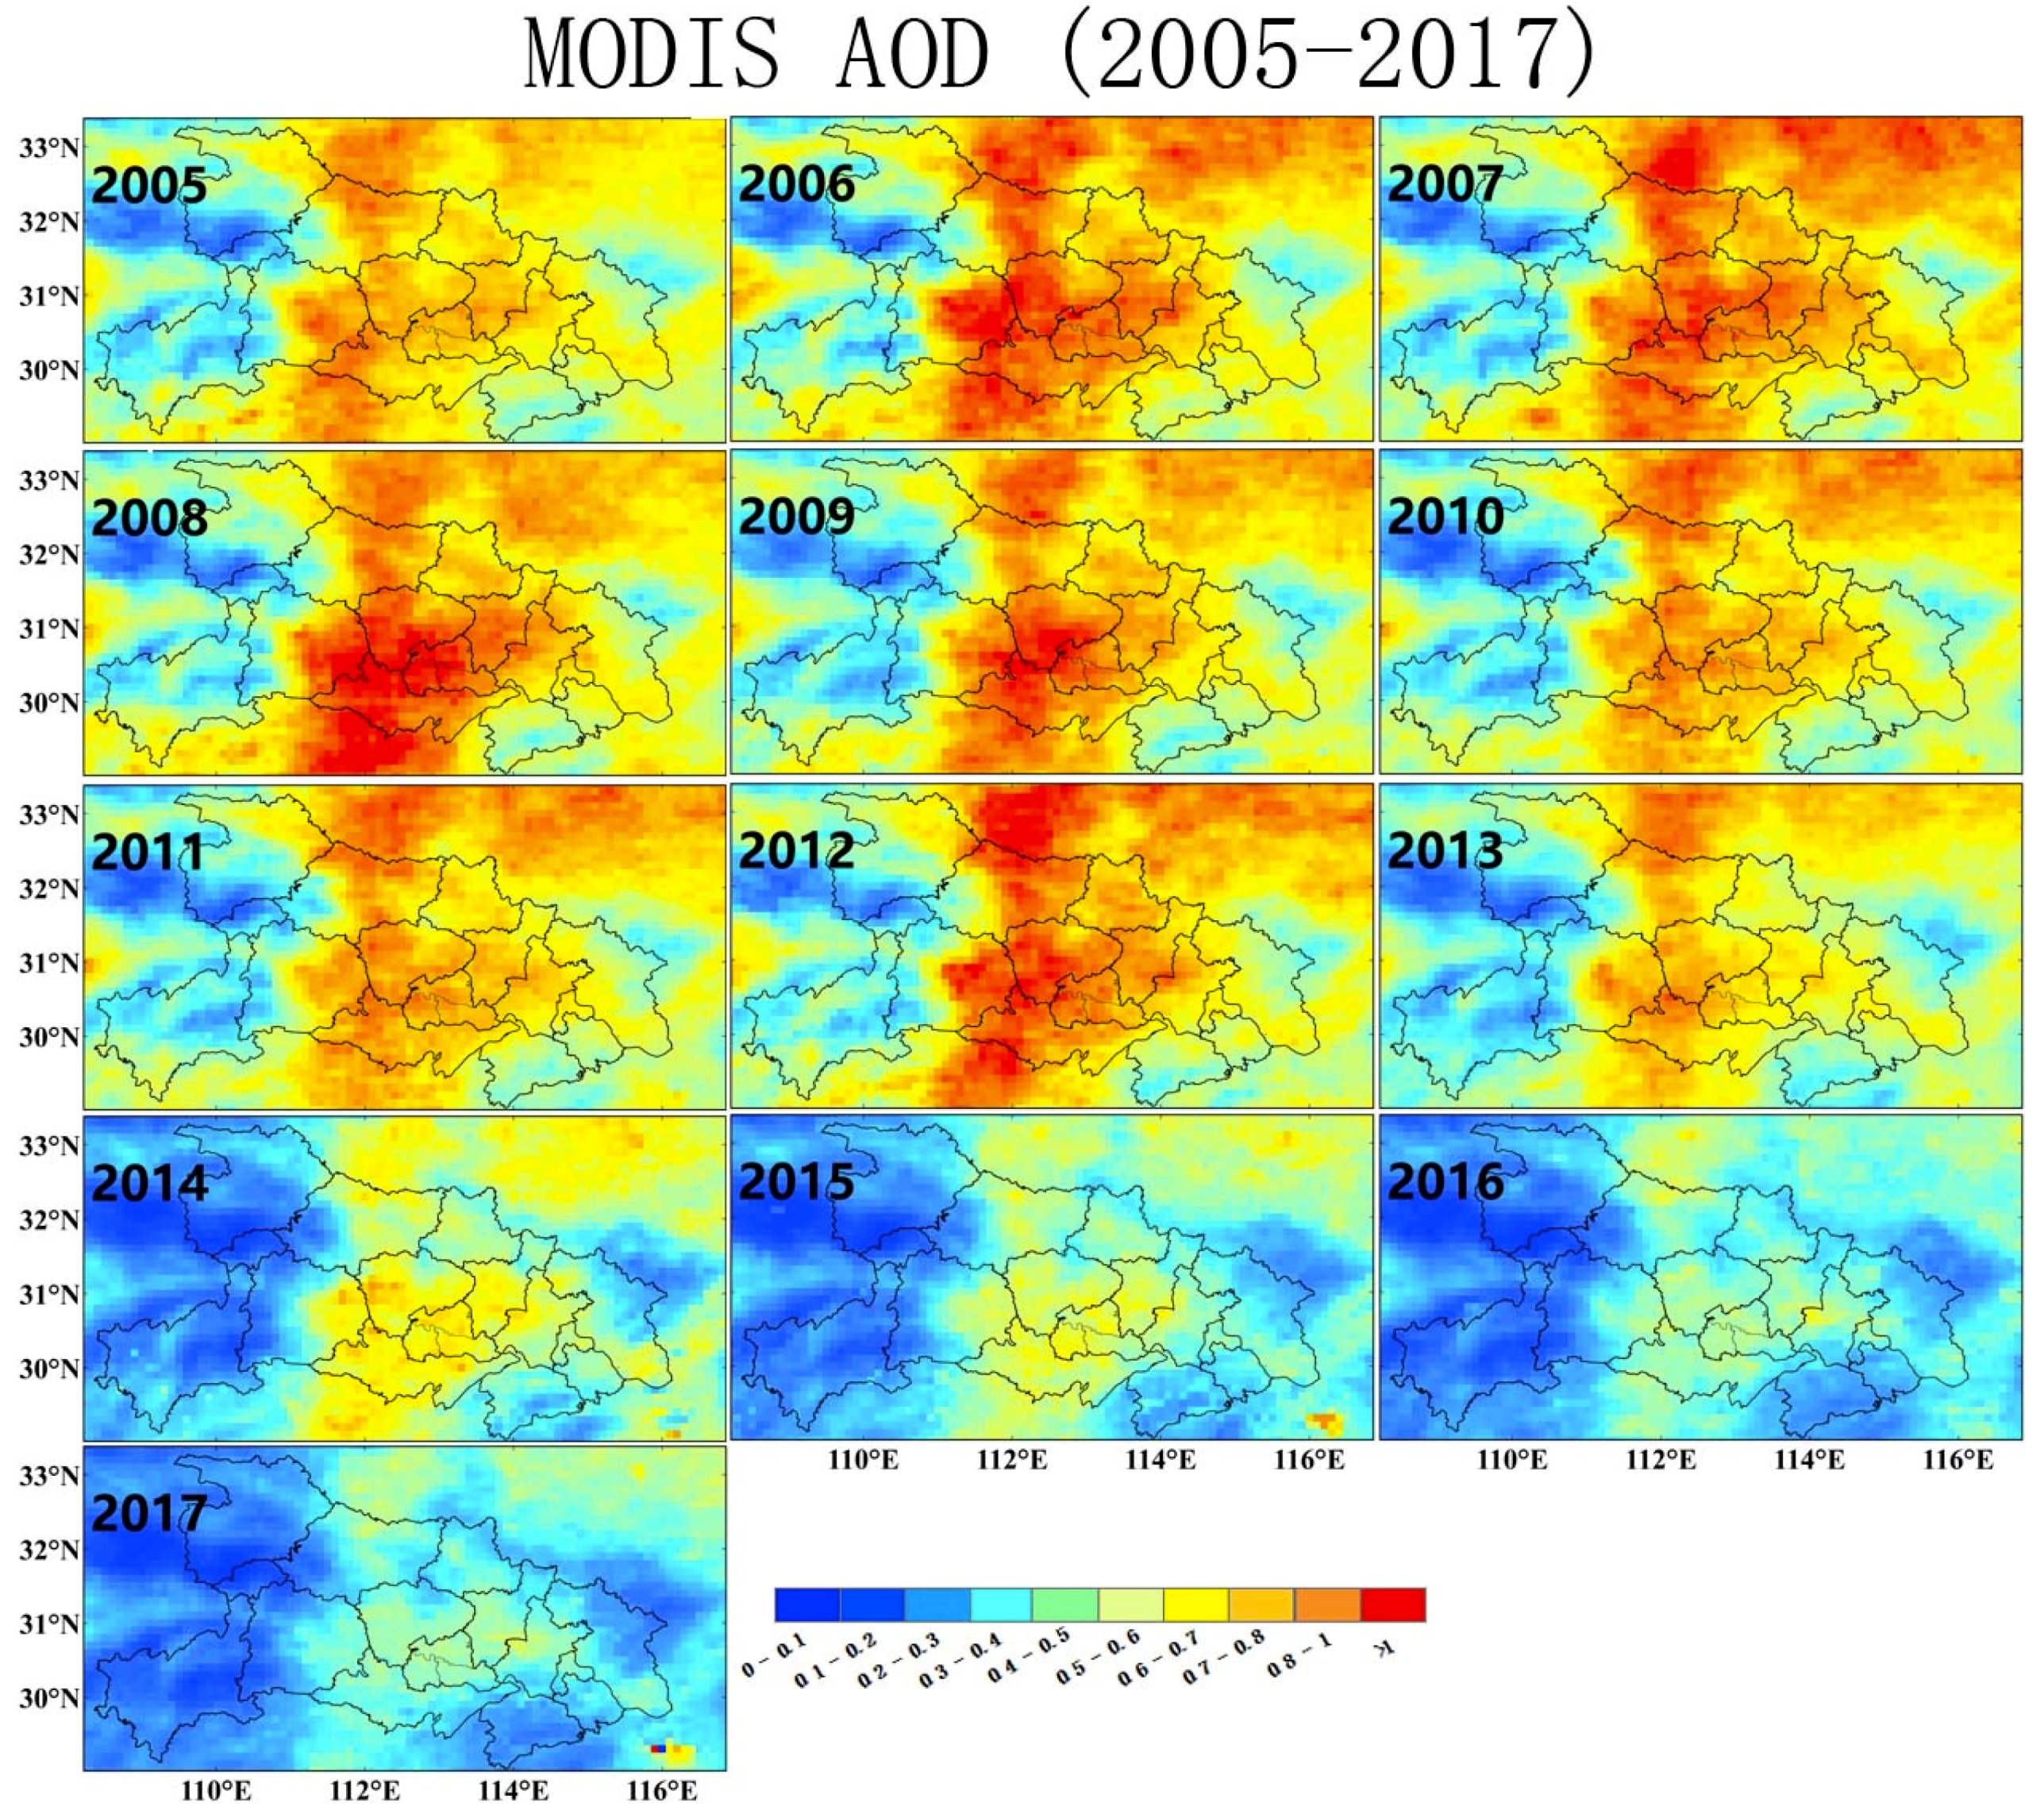
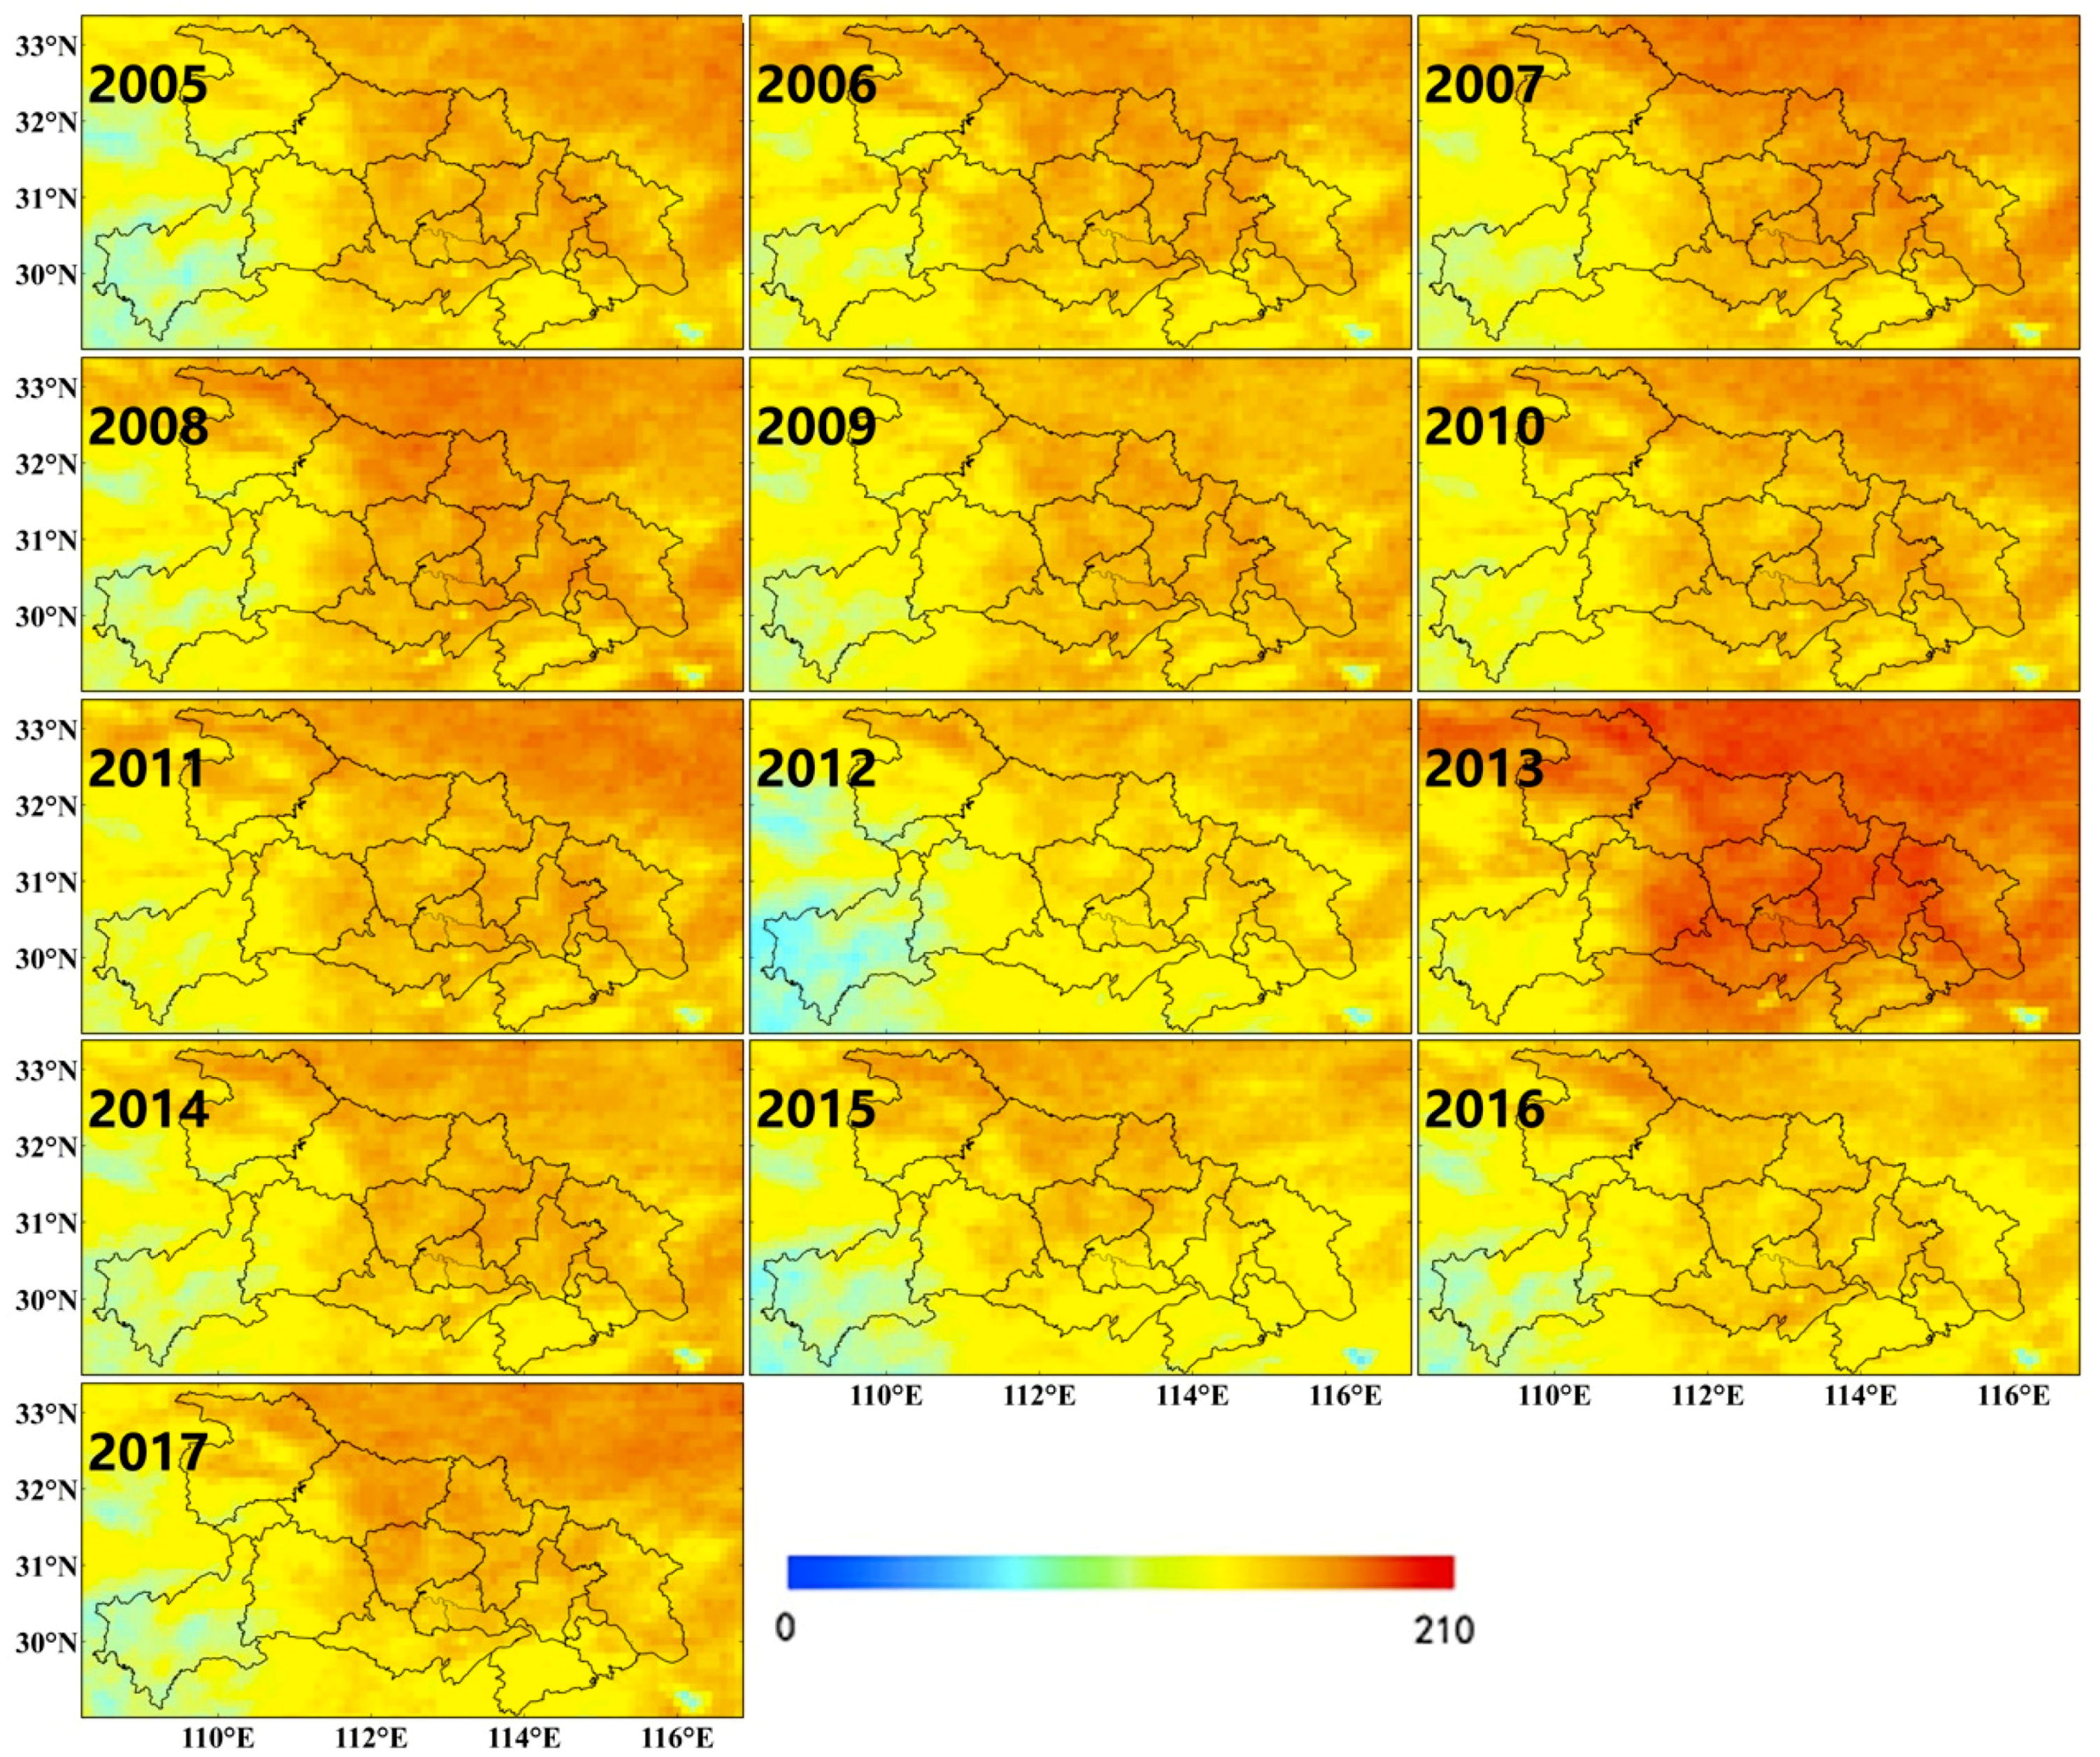
The spatial variations of annual MODIS AOD at 550 nm over Hubei during 2005–2017 are displayed in
Figure 8. There were dramatic changes in aerosol loading over Hubei at both temporal and spatial scales. The aerosol particles were concentrated over the non-mountain areas with large spatial differences. Unlike gaseous precursors of SO
2 and NO
2 concentrated around Wuhan, particle pollution was mainly in the central part of Hubei and communicated with polluted regions in other provinces to the north and south. The high-AOD area (>0.8) grew and extended to the eastern part of Hubei in 2005, and in 2011 nearly covered the entire non-mountain area, including Wuhan. Then, the high-AOD area retreated to the central part of Hubei, which implies large changes in emission sources as well as control policies. It is worth noting that the high AOD in central part of Hubei have rapidly decreased since 2014. By 2017, the aerosol loading in non-mountain areas became homogeneous with an AOD around ~0.6.
Moreover, there were drastic temporal changes in aerosol loading over all the non-mountain areas of Hubei (
Figure 8). Compared with the persistent heavy aerosol loading (>0.8) in central Hubei during 2005–2011, there was an annual AOD increase from ~0.6–0.7 to ~1.0. In contrast, AOD in the eastern part (i.e., Wuhan) exhibited large yearly variations (>0.3), which indicates the obvious influence of regional transport. In addition, consistent or even larger increases in the magnitude of aerosol loading in adjacent areas of other provinces contributed to part of the heavy particle pollution in central Hubei. The overall decrease of AOD in Hubei began in 2011 wherein AOD declined from >1.0 to ~0.5–0.7. In 2017, there was more than a ~30–50% decrease in AOD over most non-mountain areas.
Considering that there was no aerosol retrieval when land surface was covered by clouds, sampling frequency of available satellite AOD within one year is significant for whether its annual mean value can well represent the true variations. As shown in the available frequency of MODIS AOD (
Figure 9), the annual sampling frequency of MODIS DB AOD of all quality is ~120–150 days/per year, which is statistically adequate to capture the AOD gradient [
33], even with some yearly difference. Moreover, long-term observations show that there are no significant changes for clouds during the last decade, except in 2013 [
20]. Thus, the long-term trend of aerosol loading derived from MODIS AOD is generally representative of central China.
As shown in numerous studies, annual or seasonal mean maps of satellite AOD is usually used to denote particle pollution [
19,
33]. Different from the consistent distribution between gaseous precursors (NO
2 and SO
2) and AOD in northern China [
15], the hotspots of gaseous pollutants and particles in central China are concentrated in completely different spatial locations of central China. Although sulfate and nitrate only account for at most about half of PM
2.5 in major cities of China [
11], anthropogenic emissions of SO
2 and NO
x have a much larger amount than organic Carbon (OC) and black Carbon (BC) [
31]. In particular, as the major control targets of the government, the overall reduction of SO
2 and NO
x emission throughout China is approximately ~5–10 times of that for OC and BC [
4]. Thus, despite the spatial inconsistency, the substantial variability of SO
2 and NO
x in central China can cause a considerable contribution to overall variations of overall aerosol loading.
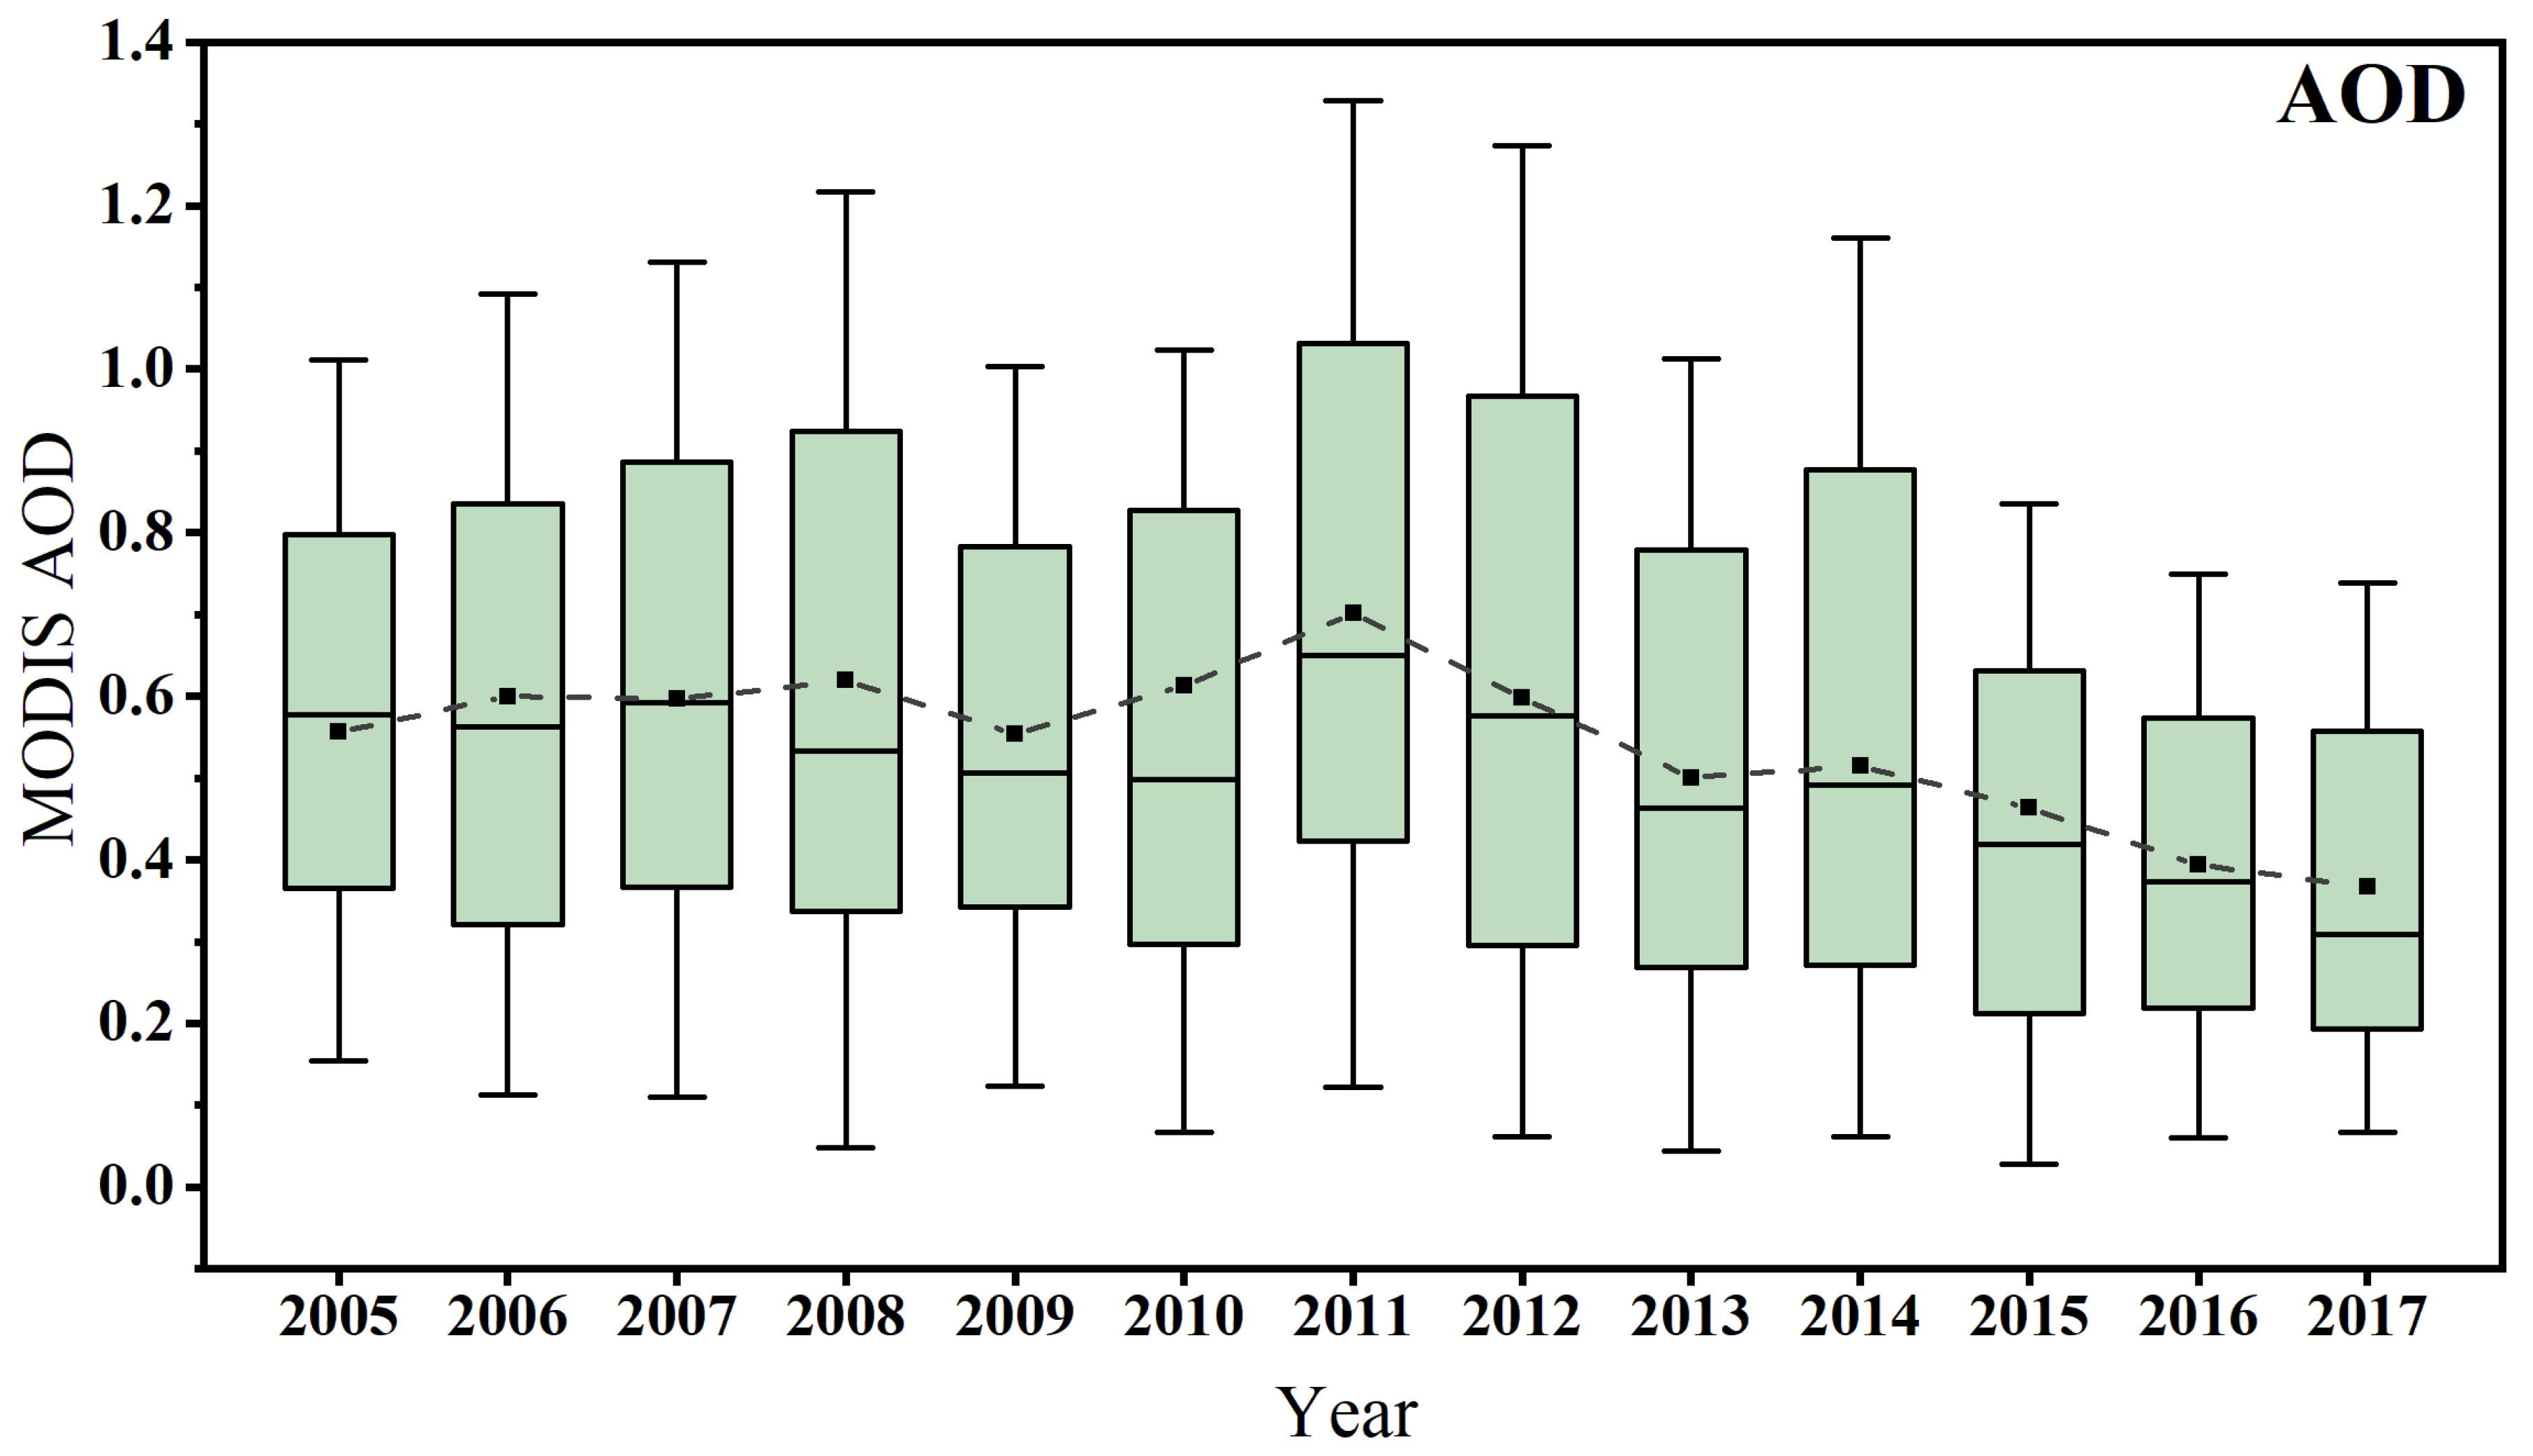
Spatial mean of aerosol loading is usually used to evaluate variations of regional emission levels [
34]. The annual average of MODIS AOD values within Hubei province during 2005–2017 are shown in
Figure 10. Consistent with spatial variations, there was a slow increasing trend (0.55–0.61) in AOD during 2005–2008 with an obvious decrease (0.56) in 2009. This indicates significant changes in anthropogenic emissions or regional meteorological conditions. The increase of AOD from 2010 (0.61) was much larger and annual AOD of the entire Hubei region reached a peak value of ~0.7 in 2011. Unlike northern China’s growing AOD in 2013 [
30], aerosol loading in Hubei continuously decreased from ~0.7 in 2011 to the lowest value of ~0.38 in 201. This was largely due to spatial difference in emission trends. Although the annual mean of MODIS AODs was at similar levels around 0.5 in most years, their daily values had very large fluctuations from ~0.1 to ~1.3, which was consistent with the frequent heavy pollution events and their cleanups in eastern China [
20,
21]. The particle pollution in central China is obviously lower than in northern China [
19]. However, it should be noted that regional AOD exceeds 0.8 for about more than one quarter of the days during 2005–2014. After the clean air actions taken by the Chinese government in 2013, there has been a rapid decline in particle pollution in eastern China [
35]. While there has been a continuous decrease in SO
2 and particle pollutants in central China, the notable increase in NO
x indicates a transition from air pollution, i.e., a larger fraction of OC and enhanced O
3 pollution.
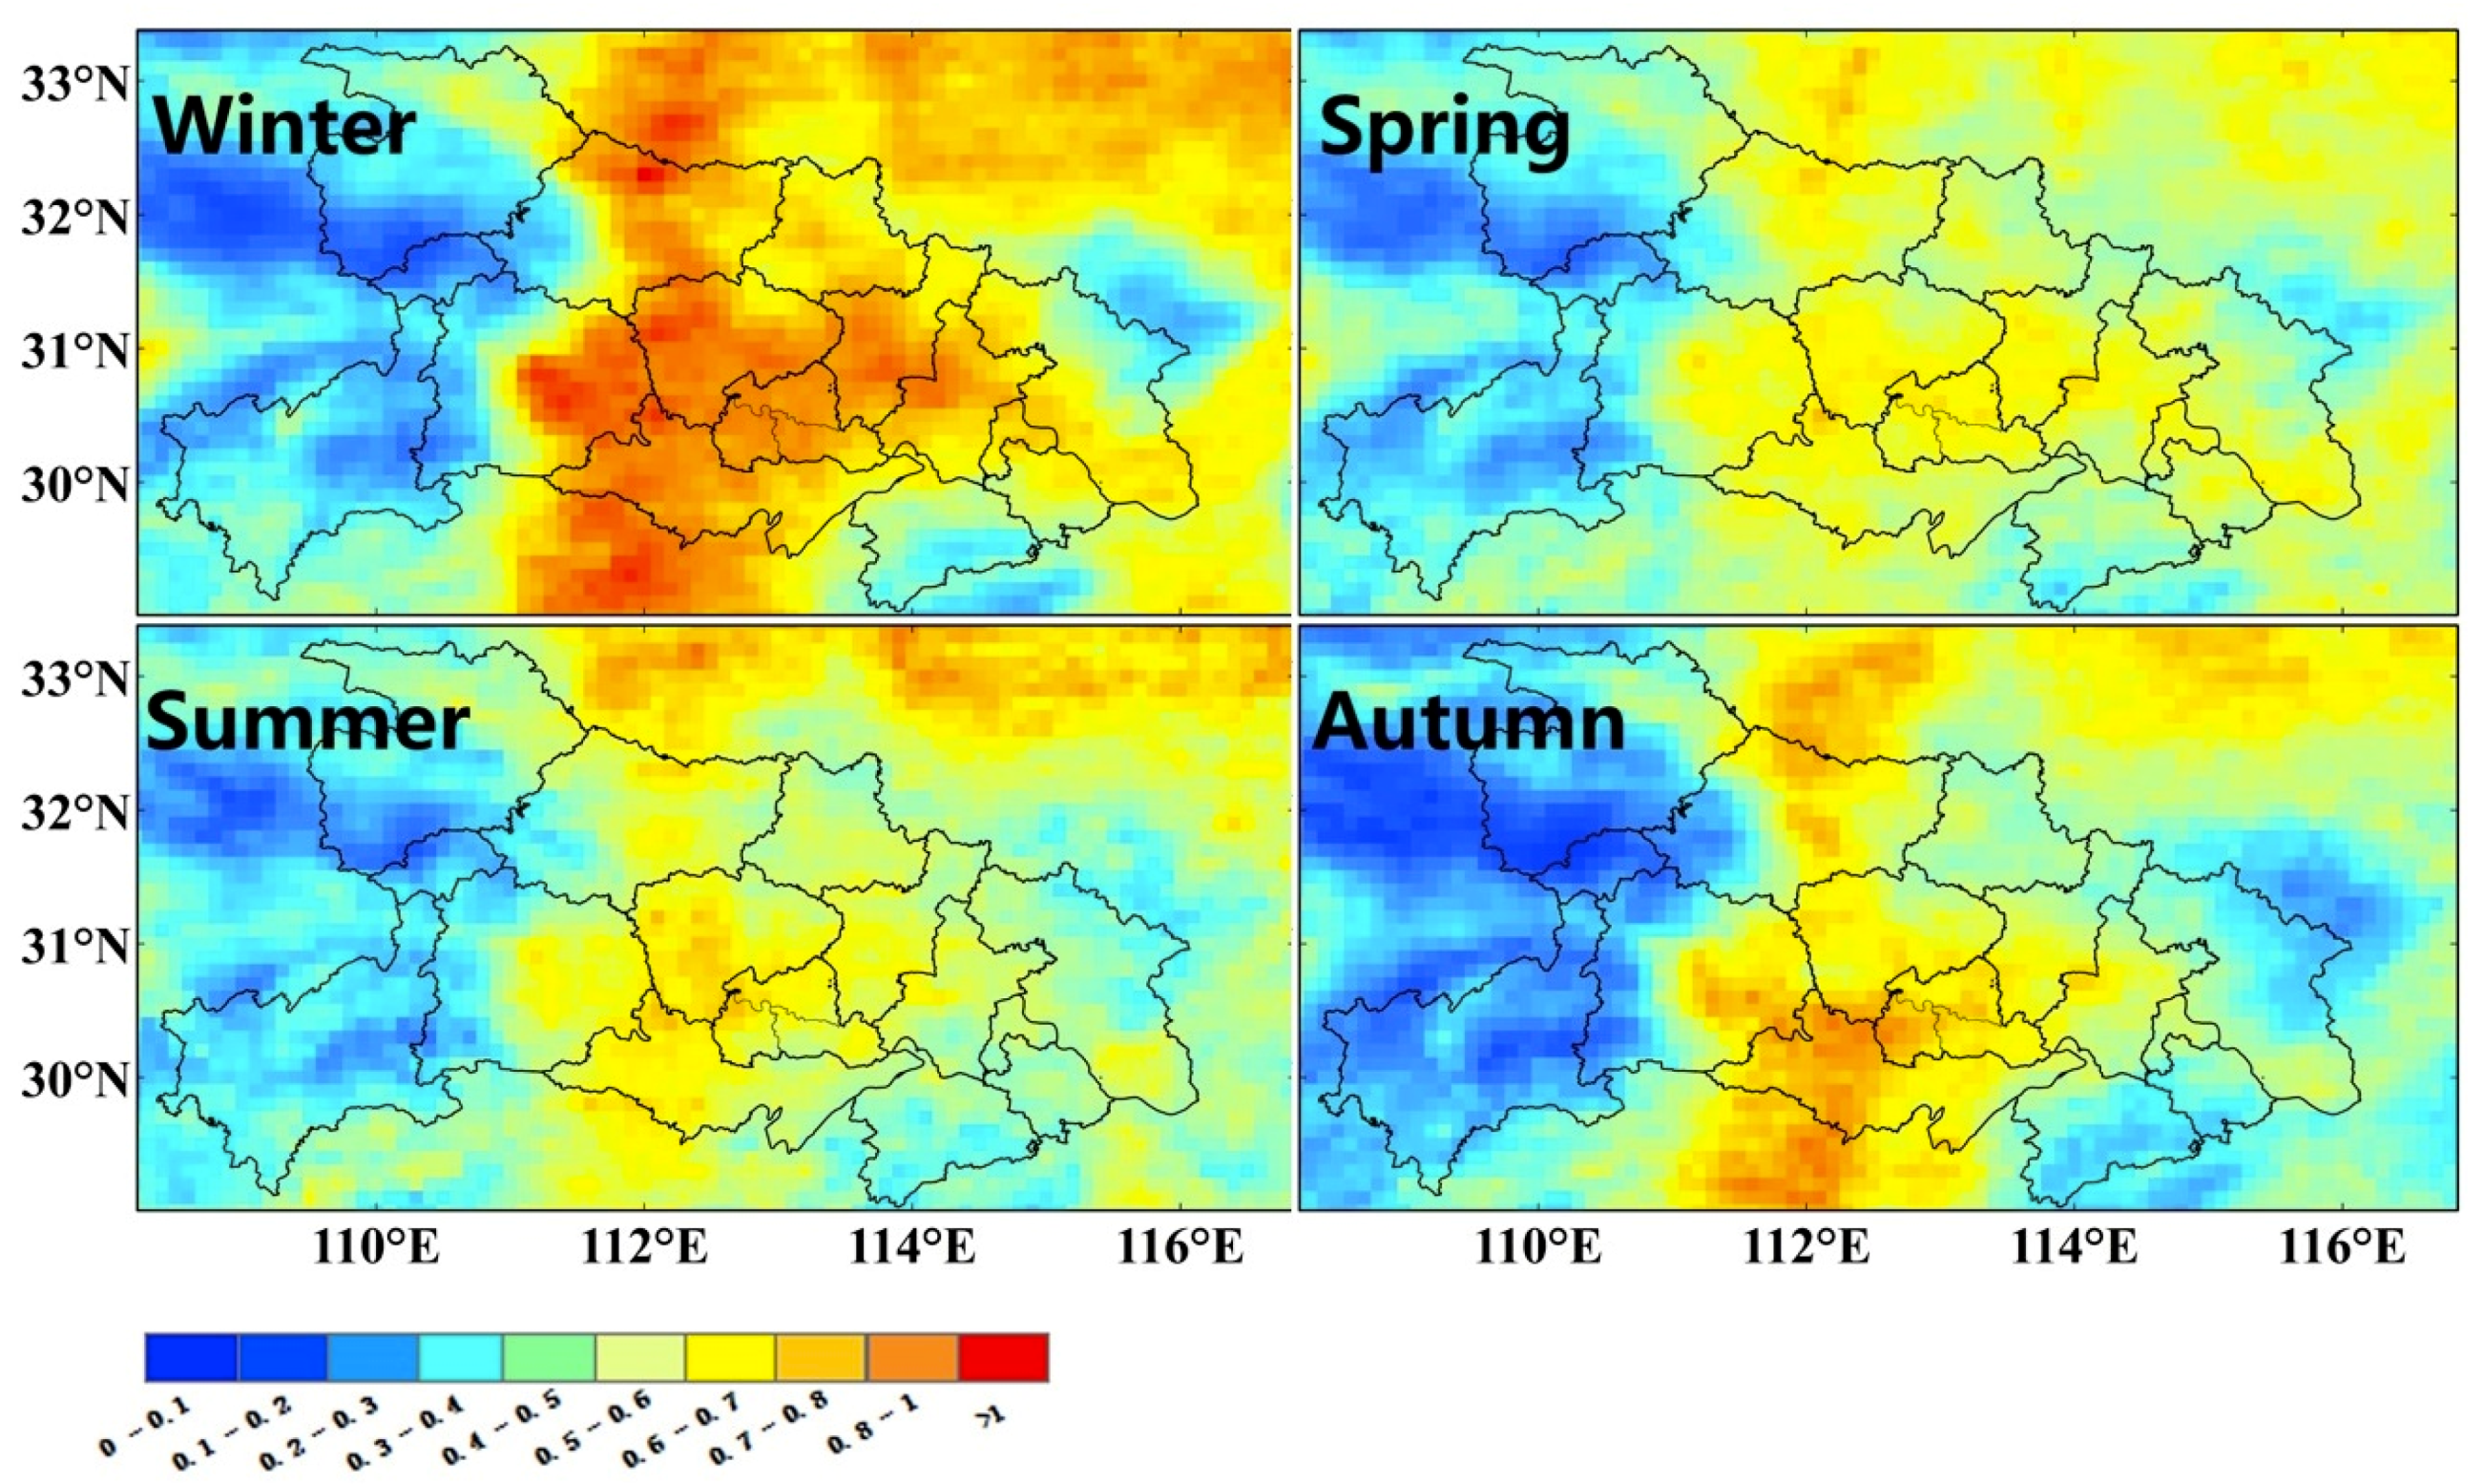
Seasonal mean of MODIS AOD at 550 nm showed variations of particle pollution in different meteorological conditions (
Figure 11). Similar to gaseous pollution, MODIS AOD had the highest AOD in winter and autumn. MODIS AOD in central Hubei exceeded ~0.8–1.0 and influenced the northern part by adjacent transport under the prevailing northerly winds in winter [
2,
21]. By contrast, MODIS AOD reached moderate levels (~0.6) in the spring and summer. Different from the regional particle hotspot in winter, high AOD values were only concentrated in certain parts of central Hubei during the other seasons. Moreover, these AOD hotspots exhibited notable spatial variations in different seasons, which implies a significant intra-transport due to higher wind speeds in central China (
Figure 2). The mountains around Hubei have an obvious blocking effect on outside transport of particle pollutants, even in the polluted winter. On the other hand, the limited spatial coverage of aerosol hotspots (except in winter) can partly explain the lack of gaseous pollution hotspots in central Hubei from OMI products with a coarse resolution.
3.3. The Implication of Changing Air Pollution in Central China
Spatial variations of gaseous precursors, SO
2 and NO
x, can provide a visible view on their major emission sources and the effects of control measures [
13]. Moreover, comparison of MODIS AOD and OMI trace gases that exhibit a significant correlation in main global pollution hotspots [
36]. Although other components such as OC and mineral dust account for a considerable fraction (~30–60%) in PM
2.5 of China [
11], sulfate and nitrate had a much larger variability in the last decade due to specific and strict control of their emissions [
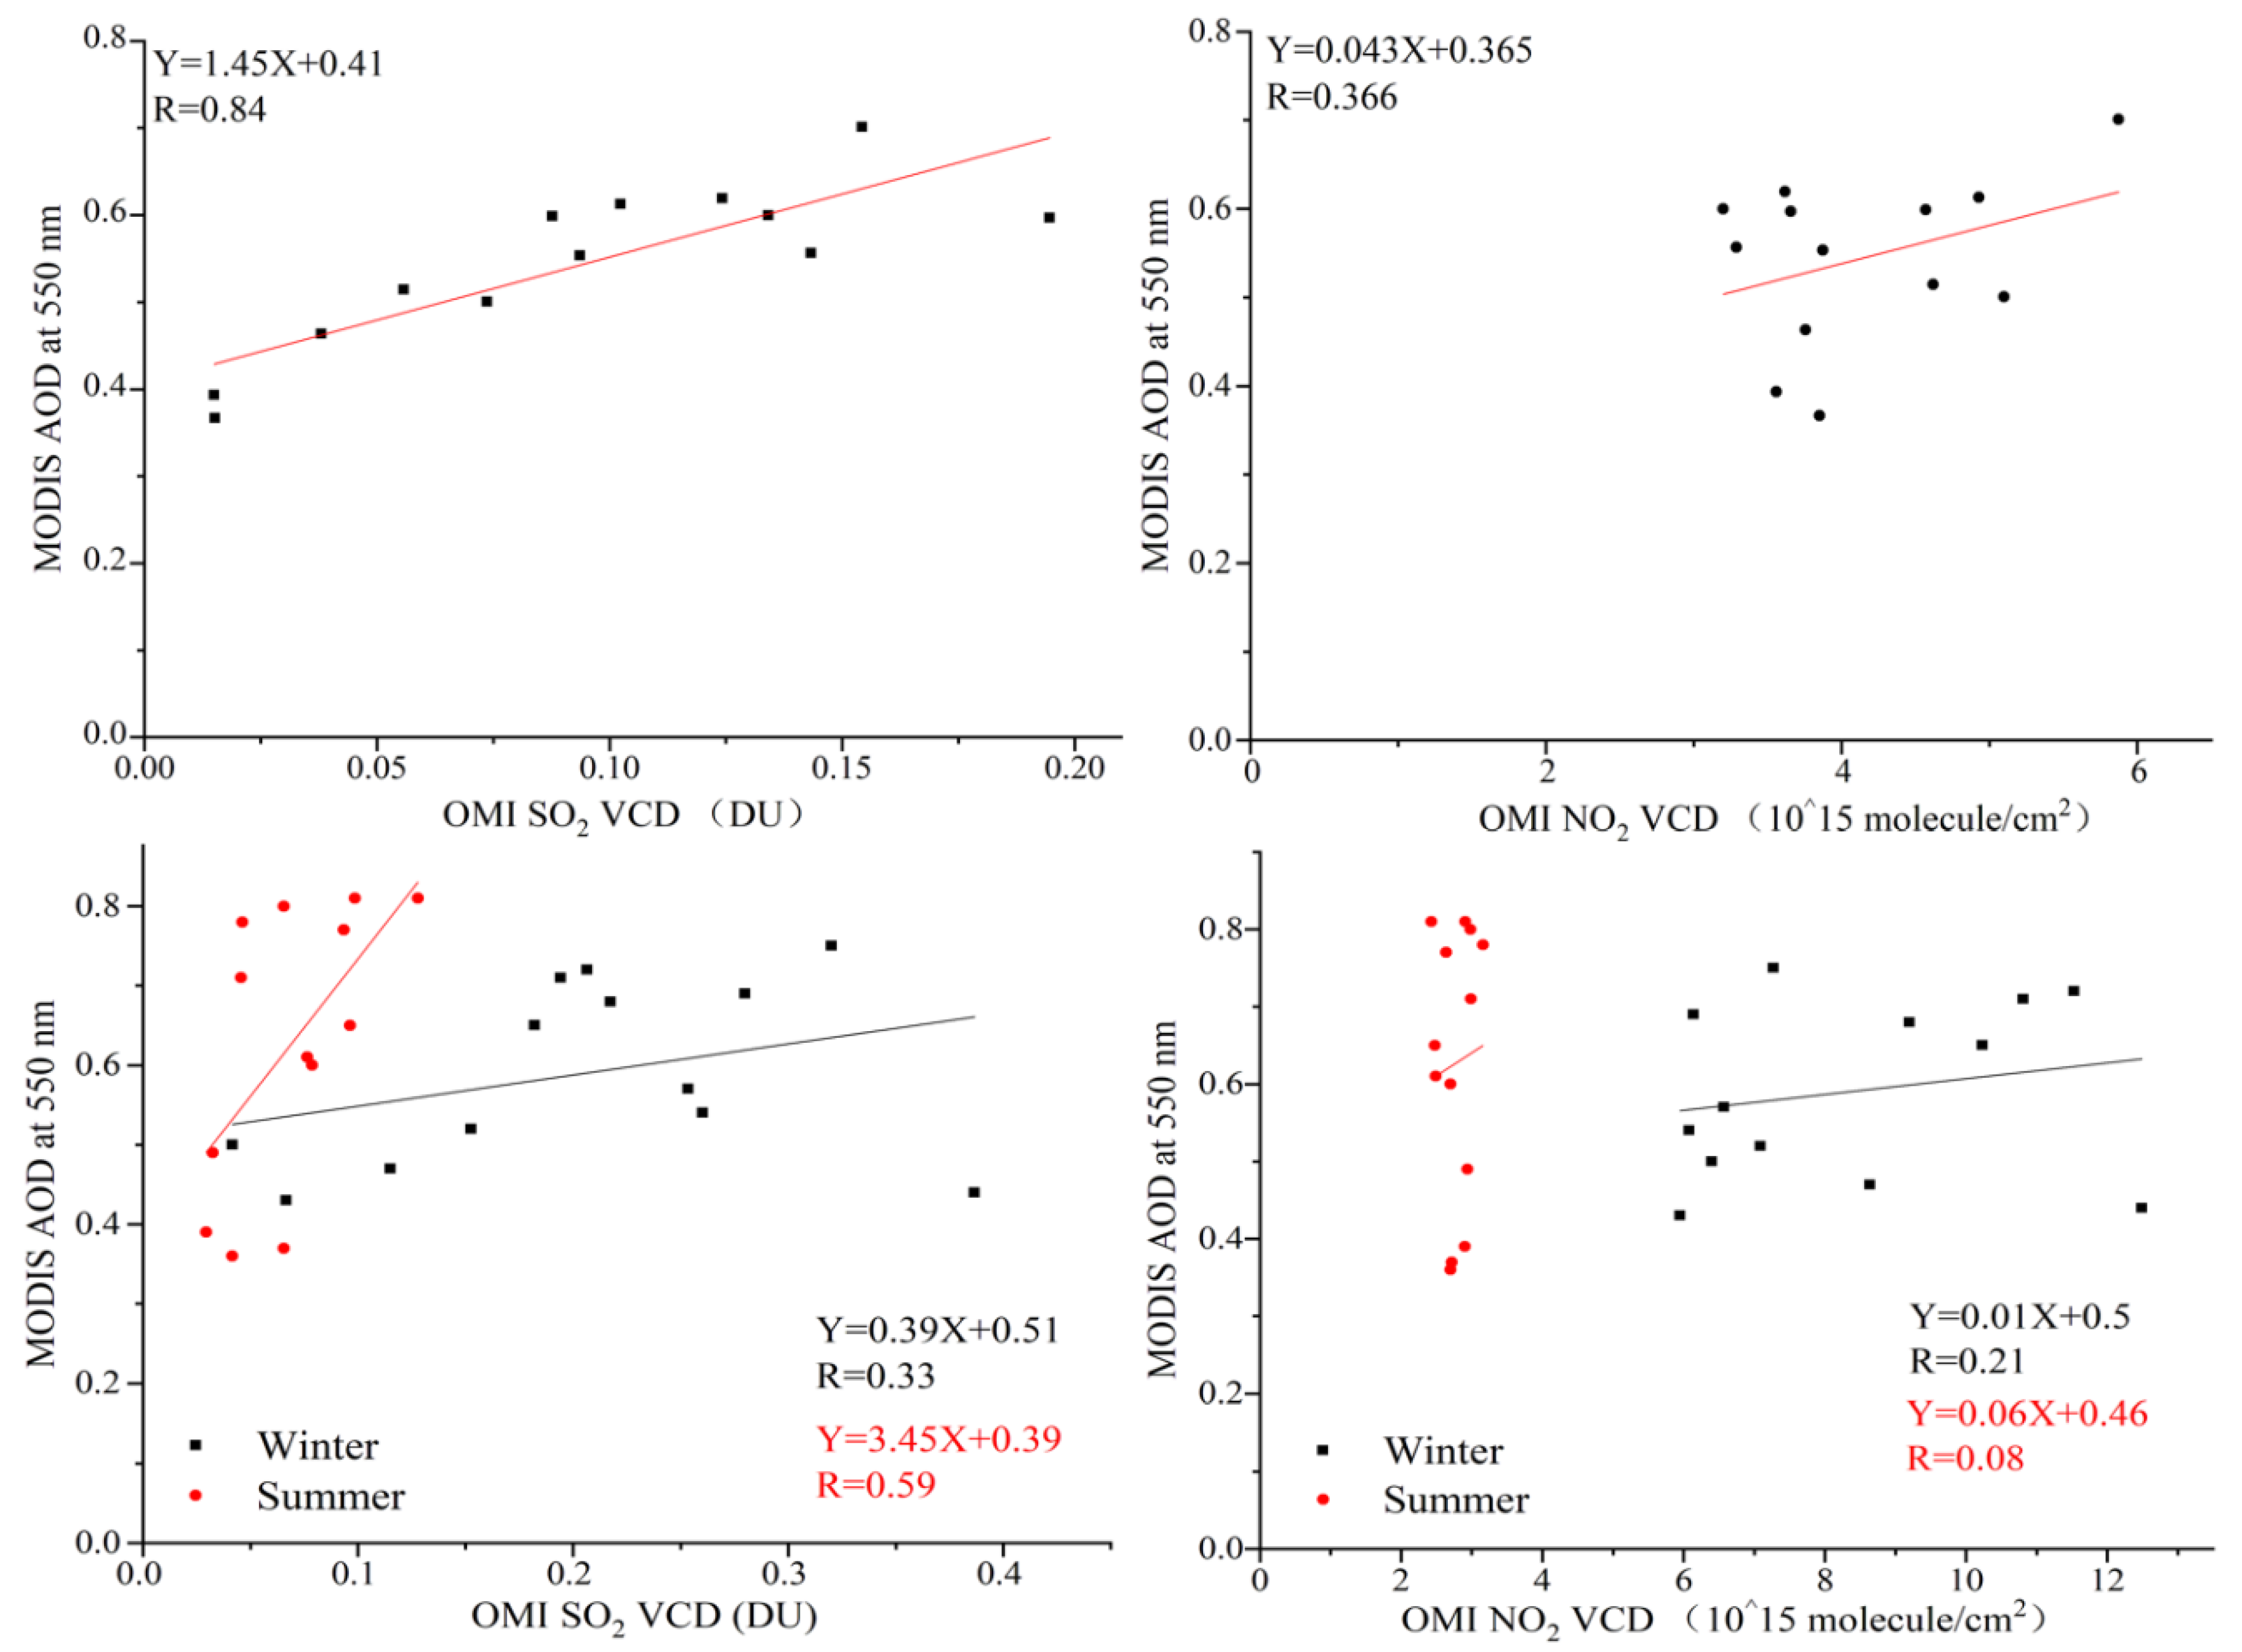
4]. Variations of regional AOD in Hubei showed consistent trends with SO
2 and NO
2 (
Figure 12). In particular, there was almost a linear relationship between regional mean value of MODIS AOD and OMI SO
2 with a high correlation coefficient (R), 0.84. Despite a much lower R (0.366) between AOD and NO
2, it can be seen that variations of AOD and NO
2 had a close relation. Conversely, the connection between MODIS AOD and OMI SO
2 and NO
2 was weaker in seasonal scales. The yearly variations of seasonal meteorological conditions as well as their influence on the amount of atmospheric pollutants and satellite sampling frequency had considerable magnitude compared with the actual trends of air pollution [
20,
21]. The MODIS AOD in Hubei had slow changes from 2005 to 2008, with a decrease in SO
2 and increase in NO
2. While the reduction of SO
2 emission in Hubei was ~60,000 tons and growth of NO
x emission approximately 150,000 tons—inferred from comparison with OMI NO
2—it is clear that the effect of desulfurization was exceeded by the increase of NO
x and other emissions.
The high correlation coefficient (R > 0.8) between AOD and SO
2 shows that variation of SO
2 can explain most changes of particle pollution in central China. Despite the slight increase of NO
2 in 2009 (
Figure 5), MODIS AOD in Hubei exhibited consistent decline in 2009 and then rose in 2010–2011 as SO
2 (
Figure 4 and
Figure 6). There was a persistent and rapid decline in MODIS AOD with the decrease of both SO
2 and NO
x from 2012. Although OMI NO
2 became slightly higher (~0.5 × 10
15 molecules cm
−2) and SO
2 did not change, MODIS AOD fell by ~0.03 during 2017 as SO
2 and NO
x emissions. It has to be stated that other anthropogenic emission sources as well as natural dust also make important contributions to aerosol loading [
3]. Different from the notable gaseous hotspot in Wuhan, high-AOD (>0.8) that converge in central Hubei mainly originated from emissions of primary aerosols and small local sources.
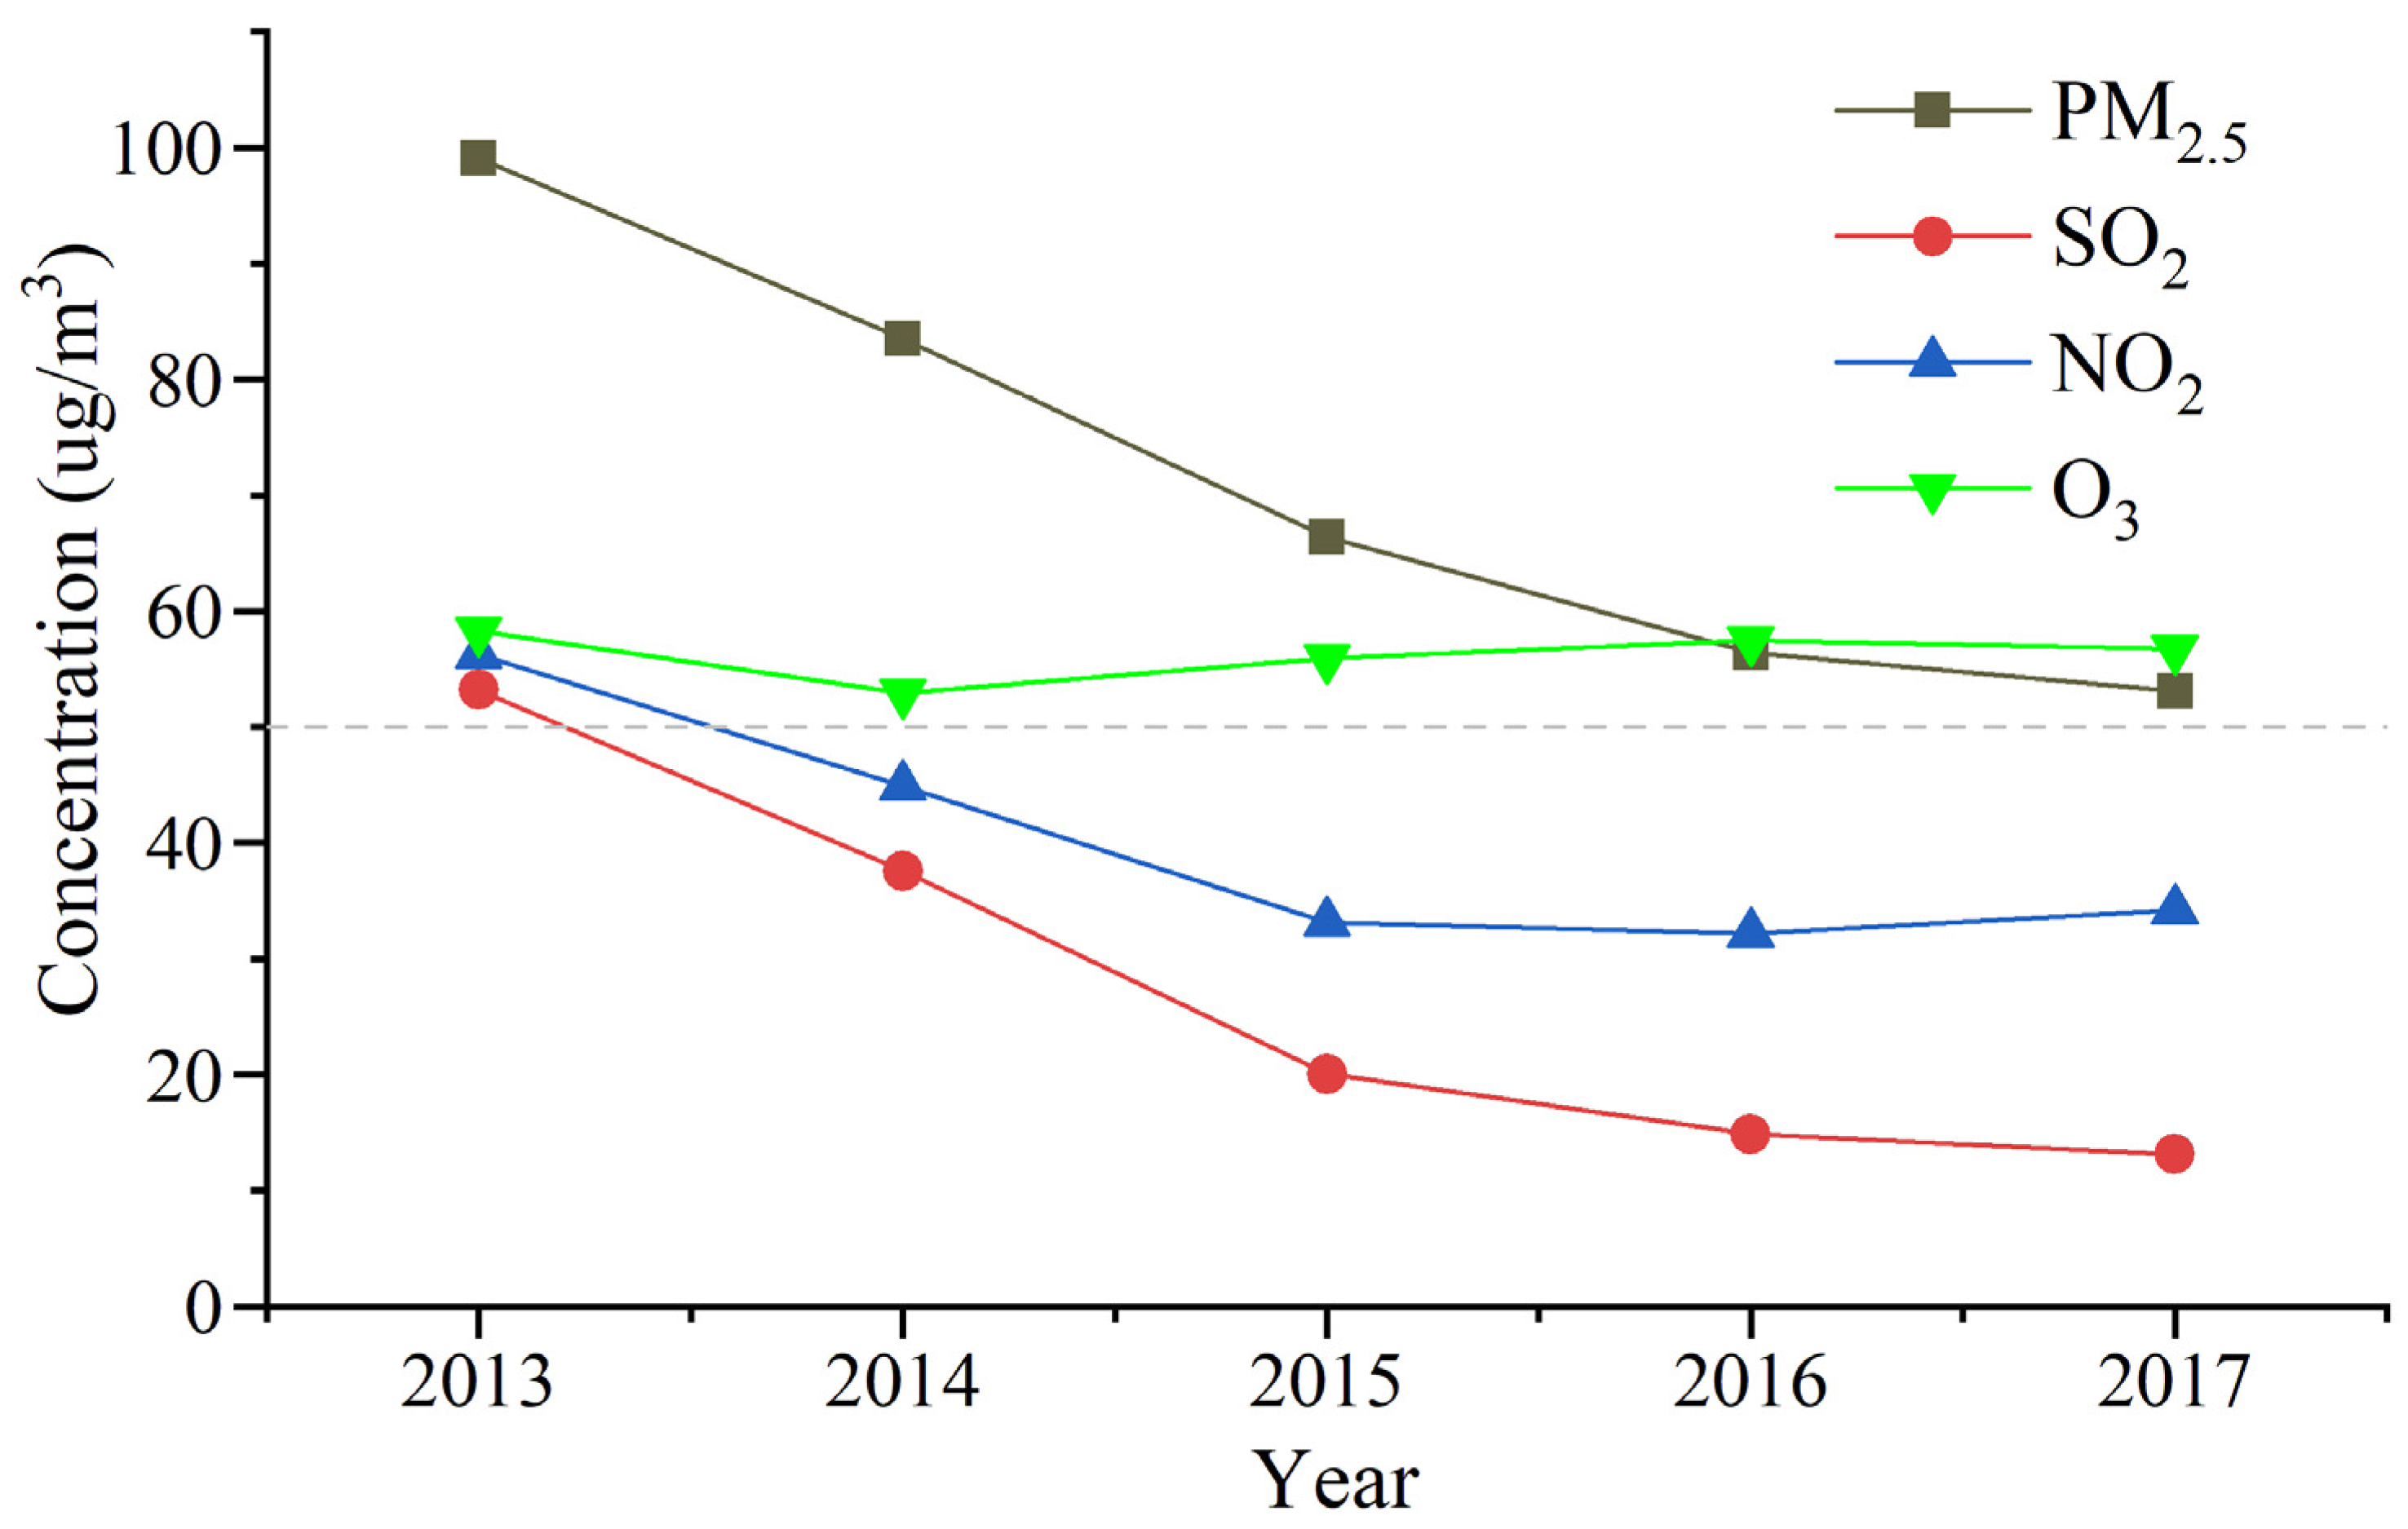
To have an examination on reliability and representativity of satellite observations, annual variation of the main atmospheric pollutants during 2013–2017 was analyzed based on ground measurements in Hubei (
Figure 13). It can be seen that there was a rapid decline of PM
2.5 concentration from ~100 µg/m
3 in 2013 to ~52 µg/m
3 during 2017, which was consistent with variations of MODIS AOD. An annual average of SO
2 concentration from the ground network exhibited nearly the same trends with PM
2.5 and declined from ~53 µg/m
3 to ~13 µg/m
3. Moreover, NO
2 concentration decreased rapidly in 2013−2015 by ~22 µg/m
3, but flattened out during 2016, exhibiting an obvious rise in NO
2 concentration by ~5 µg/m
3 in 2017 with similar trends as OMI NO
2. The high consistency with ground measurements demonstrated that satellite observations well captured temporal variations of the overall anthropogenic emission in central China.
Despite the large overall decrease of PM
2.5, SO
2, and NO
x during 2013–2015, O
3 pollution became more serious in early 2014. The precursors of O
3 included NO
x and VOCs, but there was also a notable rise in O
3, as NO
2 decreased in 2014–2016. Considering the nonlinear relationship between O
3 and its precursors, the decrease of NO
2 in high NO
x/VOC ratio conditions promoted O
3 formation [
37]. In addition, it was found that the large reduction of aerosol loading enhanced O
3 production rate to stronger photolysis [
38]. By now, NO
x emission has become the main gaseous pollutant in central China and increases with continuous growth in the number of motor vehicles. Therefore, it is significant to strengthen the control measures for NO
x emissions as well as VOCs in the eastern and central regions of Hubei in the future.


