Studies on plant species-level classification and map** using multi-sensor data have always been a challenge, and researchers have attempted to use them for simple mono-formation plantations and tropical mixed forests using various discriminative algorithms. Species-level map** helps in the better estimation of various biochemical and biophysical parameters, such as pigment concentration, leaf area index, primary productivity, and carbon sequestration, etc., which are useful for forest resource assessment, and for formulating appropriate conservation and management activities. Unlike diverse tropical forests, mangrove species occur in relatively dominant formations, thereby offering some structure to attempt species-level and mixed-groups classification using satellite data. Map** the spatio-temporal distribution of mangrove forests would help in understanding ongoing changes and project the influence of climate change [
1]. The species’ distribution in mangrove forests is primarily regulated by salinity level, distance from the sea or estuary bank, duration and frequency of the tidal inundation, soil composition, etc. [
2]. It has been observed that due to the lowering of pH, the concentration of
Excoecaria agallocha species is increasing at the expense of
Heritiera fomes in the Sunderban mangrove forest, eastern India [
3].
The spectral bands and derived indices from the multispectral and hyperspectral remote sensing data are commonly used to distinguish mangrove forest cover from other vegetation. Researchers have classified and mapped mangrove and other species based on their spectral, phenological and physical characteristics, such as height, size, and shape, while several studies have employed chemical characteristics [
4,
5]. Recently, Grabska et al. [
6] mapped nine tree species within mixed forests based on their phenological phase and reported that time-series data use significantly improved forest tree species map** by approximately 5–10%. Martin et al. [
7] classified 11 forest cover types, including pure and mixed stands of deciduous and conifer species. This approach combined species-specific chemical characteristics and previously derived relationships between hyperspectral data and foliar chemistry. However, a few studies have implemented the entire range of spectral values to classify and map mangrove forests. Studies map** mangrove forest extent using different indices-based approaches were attempted [
8,
9], with a few on species-level map** [
10,
11]. Vegetation spectral indices use two or more spectral bands, and enhance particular properties of different species based on their relative reflectance [
12]. The Combined Mangrove Recognition Index (CMRI) is a widely used index for map** mangrove forest cover [
13,
14,
15]. Ramdani et al. [
16] reported a better accuracy in discriminating mangrove species using principal polar spectral (PPS) indices over vegetation indices, such as the Normalized Difference Vegetation Index (NDVI). Moreover, the narrow spectral bands of hyperspectral data are more sensitive to the specific absorption features corresponding to different species [
17]. Various studies have demonstrated the utility of various narrow spectral bands in the green, red, red edge, and NIR regions of hyperspectral data in identifying the different mangrove species [
18,
19,
20,
21]. In particular, Jusoff et al. [
22] explored the potential use of airborne imaging spectrometer for applications (AISA) airborne hyperspectral data to assess nine groups of mangrove species, and observed that they could be easily distinguished in the near-infrared region. Researchers have attempted mangrove species composition map** using pixel-based classification approaches, such as maximum likelihood classification (MLC), spectral unmixing (SU), and spectral angle mapper (SAM) [
23,
24,
25]. Cho et al. [
26] used the SAM classifier to minimise intraspecific spectral variability for discriminating among South African savanna tree species.
Several studies have implemented various microwave datasets for mangrove species classification, as backscatter energy is primarily affected by plant moisture content [
2]. Pham et al. [
27] classified two mangrove species using a logistics tree model classifier employing the ALOS-2 microwave data. Multi-sensor remotely sensed datasets (e.g., multispectral, hyperspectral, SAR) provide complementary information to improve species-level classification and map** [
28,
29]. Cao et al. [
30] used object-based classification to identify mangrove species by deriving data synergy from unmanned aerial vehicles (UAVs), hyperspectral images, and digital surface models (DSMs). Zhang et al. [
31] integrated optical and microwave data for mangrove species classification using various machine learning models, and obtained good classification accuracy by combining dual polarimetric synthetic aperture radar (SAR) data. Arasumani et al. [
32] surveyed classification exercises using a multi-sensor dataset with different machine learning approaches. However, this study implemented random forest (RF), a machine learning model, to discriminate and classify three dominant mangrove plant species. The RF model has the advantage of handling high-dimensional intercorrelated data, and efficiently avoids any overfitting [
33]. The RF model also quantifies the level of importance of variables based on the out-of-bag (OOB) data. It indicates the percentage of contribution of each predictor variable used for generating the model [
34]. Naidoo et al. [
35] integrated hyperspectral and LiDAR measurements using the RF model to improve savanna species identification. Zhang et al. [
29] used the Worldview-3 and Radarsat-2 satellite data to classify four mangrove species, and they found that using SAR data, the classification accuracy was not improved remarkably. Wong et al. [
28] explored the potential of combining hyperspectral and SAR datasets to map mangrove at the species level, and they suggested using an artificial neural network classifier for achieving more accurate classification. **: Spectral Angle Mapper (SAM)
Different species-level classification approaches were adopted employing the bands, VIs, or a combination of hyperspectral (AVIRIS-NG), microwave (Sentinel-1), and/or multispectral (Sentinel-2) sensors. The spectral behaviours of various mangrove species were analysed with respect to their varying wavelengths. Signatures or spectral reflectance curves were generated for the three dominant species,
Heritiera fomes,
E agallocha and
Avicennia officinalis, whereby the mean of nine adjacent pixels was considered. The SAM classification technique was used to distinguish between the mangrove forests and other classes, such as water body, river, grassland, agriculture, and fallow land. The SAM algorithm compares the spectral similarities between the input (reference) spectra and the target spectra, which overcome the solar illumination factor that affects the image’s DN values [
57]. The SAM classifier was applied on the AVIRIS-NG and Sentinel-2 imagery, where the ENVI and ArcGIS platforms were used, respectively. The SAM classifier was employed to extract the mangrove forest area. The end members or the pure spectra were collected following the minimum noise fraction (MNF) and pixel purity index (PPI). These end members were used as training sample spectra in the SAM classifier, as it is a supervised classification technique. Several spectra were generated using a field reference corresponding to GPS-based locations. This whole collection of spectral library data for different features, such as wetland, grassland, water bodies, mangroves, and agricultural land, was fed to the classifier as a training set with a 10-degree radian for classification. Here, this classification step was considered an elimination method, as the main goal was to identify different mangroves species and their mixed combinations.
2.6. Species-Level Map**: Random Forest
The random forest (RF) model is a nonparametric ensemble classification model that uses large numbers of classifiers or trees [
58]. Hundreds of trees are used for classification, whereby each tree casts a vote for the output class, and the final output class is determined based on the majority of votes received by all the trees [
59]. The RF classifier uses bagging to form an ensemble of classification and induction tree-like classifiers [
60]. Two-thirds of the total samples are used as training datasets, and the remaining one-third of the data are used to estimate the out-of-bag (OOB) error [
4]. The performance of the RF model depends on two parameters, which are the number of variables, used as the input for the RF model, and the number of decision trees [
61]. It can handle high-dimensional and intercorrelated data and efficiently avoid overfitting [
8,
33]. It quantifies the level of importance of variables based on their OOB data, and indicates the contribution of each predictor variable used for generating the model. VIs and band combinations were used as predictable input variables in the RF model for generating 10 sets of different species-level classifications (
Table 2). Out of the total 266 ESUs, 166 ESUs were randomly chosen to develop the classification model, while the remaining 100 ESUs were used to assess the post-classification accuracy. The input data points were split into 70% and 30% for model training and testing, respectively. A 10-fold cross-validation approach was adopted to improve the performance of the model by tuning the “mtry” parameter, whereby the value was optimised based on the least RMSE. With an appropriate model (good overall and Kappa accuracy), the RF model was applied to derive a species-level map of BWS using bands, VIs, and a combination of bands and VIs from different sensors. The “raster”, “rgdal”, “randomForest”, and “caret” packages were used.
2.7. Accuracy Assessment
Accuracy assessment is an important step in the classification process. The goal is to quantitatively determine how effectively pixels were clustered into the correct feature classes according to the ground/reference observations. It is a site-specific method usually assessed by forming a confusion matrix or error matrix, wherein several matrices are used to provide a summary of the classification accuracy including the errors, e.g., omission and commission errors [
62,
63]. In confusion matrix analysis it is assumed that the pixels are pure, and that the ground samples/reference points are perfectly co-located on the classified image where the proportion of mixed pixels depends upon the spatial resolution of the imagery [
64]. Finally, a coefficient of agreement between classified image and reference points data was calculated using the Kappa coefficient, which indicates the actual agreement between the classification and the observation. The value of the Kappa coefficient lies between 0 and 1, where the higher values represent a better agreement between the two datasets. The Kappa coefficient is calculated using the following equation [
65]:
where P
o is the proportion of cases correctly classified and P
e is the expected proportion of cases correctly classified by chance.
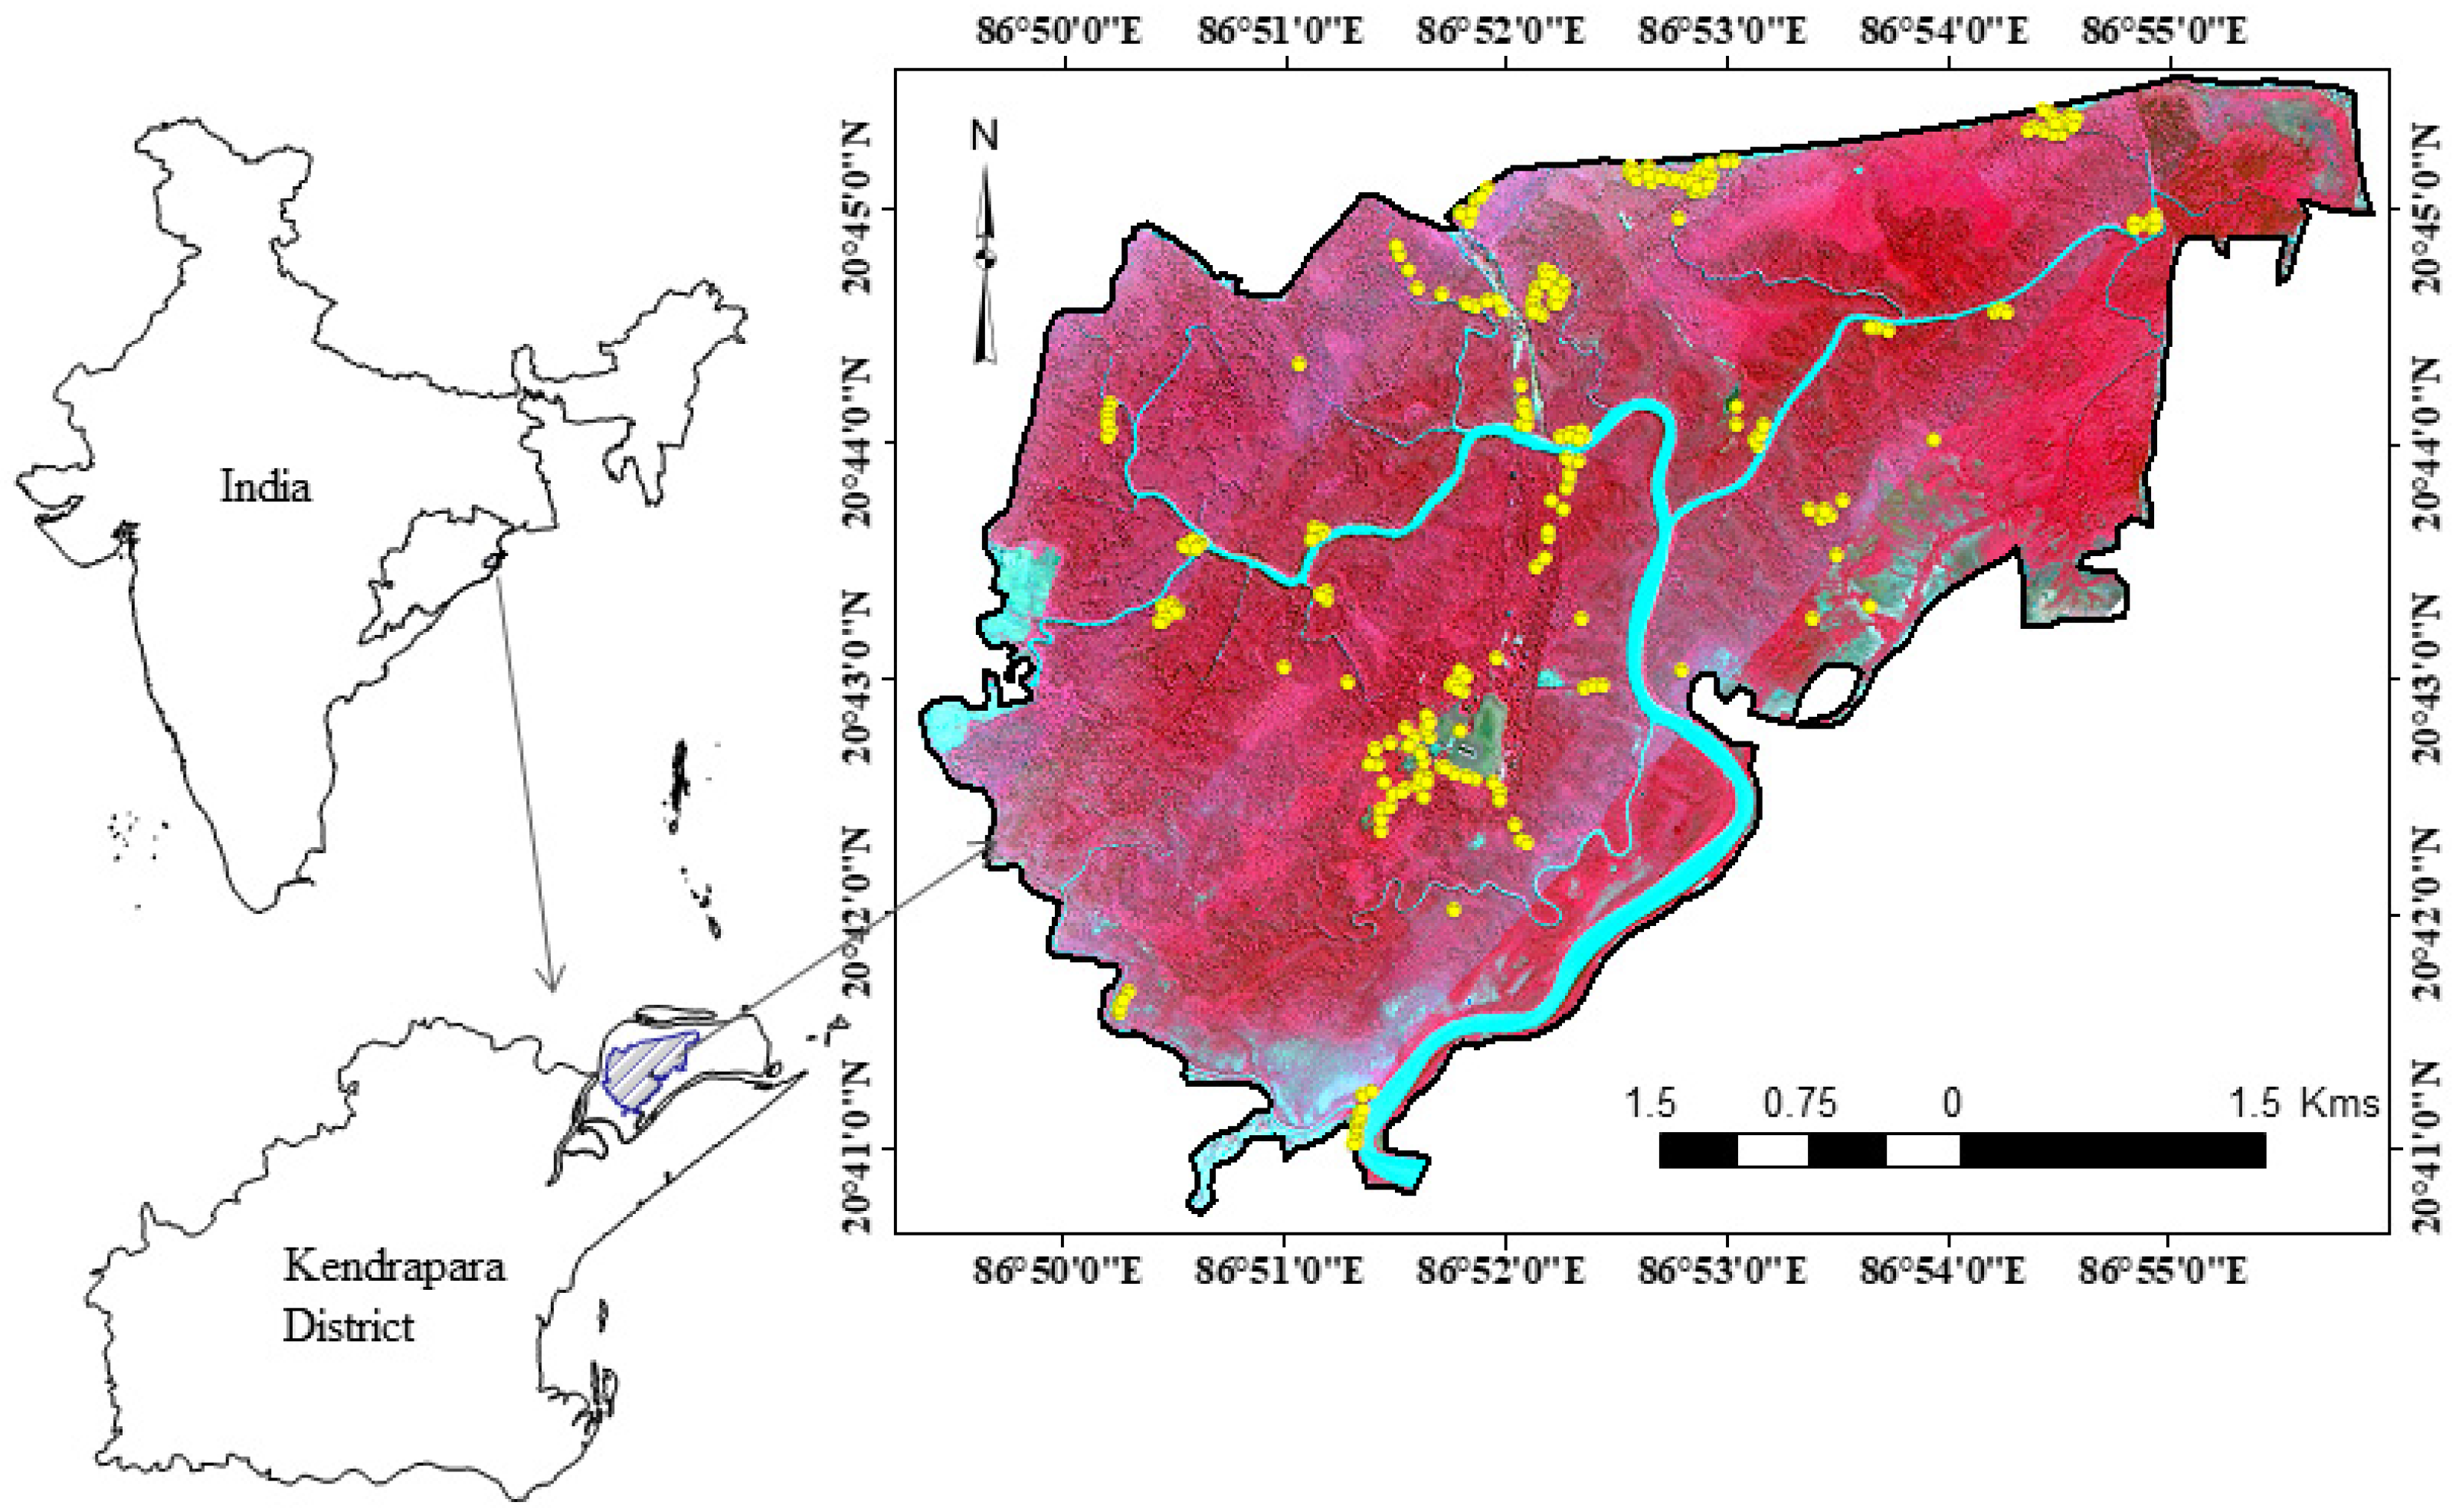
All of the data processing steps are depicted in the methodology flowchart (
Figure 2).
3. Results
3.1. Field Assessment of Species Distribution
The dominance of
Heritiera fomes, Excoecaria agallocha, and
Avicennia officinalis species at various proportions were observed at the Bhitakanika Wildlife Sanctuary. The next most dominant mangrove species were
Cynometra ramiflora and Bruguiera gymnorhiza. Plots were laid to record the data for pure and mixed formations in various spatial distribution locations. In total, 30, 19 and 10 ESUs were dominated by
Heritiera fomes at >90%, 80 to 89% and >70 to 79%, respectively (
Table 3). A total of 57 and 36 ESUs were laid in patches dominated at >90% and 80 to 89% by the three candidate species. Further, a total of 27, 22, and 24 ESUs showed duplet combinations of
Heritiera fomes–
Excoecaria agallocha and
Excoecaria agallocha–
Avicennia officinalis at >70 to 79%, >60 to 69%, and >50 to 59%, respectively (
Table 3). It was also observed that
Avicennia officinalis has the highest canopy cover among the three dominant species, which is why the number of trees per ESU is lower, even though they are sparser.
3.2. Species-Level Classification and Map** Using RF Model
The spectral analysis indicates minor differences in chlorophyll absorption and red edge wavelength ranges for the three dominant species. However, the reflectance intensity indicates significant differences in the NIR and SWIR regions, where
Avicennia officinalis has a higher reflectance than the other two species, indicating similar spectral reflectance (
Figure S2). The SAM classifier helped in discriminating vegetation and non-vegetation areas in BWS. However, species-level classification using the SAM supervised classifier did not perform well in this study. The SAM classification output provided a broad classified map, where the mangrove region was segregated from other features in order to mark out other areas from the entire image before classification with the RF model.
Using six narrow AVIRIS-NG hyperspectral bands (in the red edge spectral range), the RF model demonstrated 55% overall accuracy, which further improved to over 70% using six VIs and three narrow bands; however, the kappa accuracy was low (
Table 2). The RF model improved the overall and Kappa accuracy of various Sentinel-2 data-derived VIs (five vegetation indices, MCARI, IRECI, NDVI, PSSRa, MTCI), with the maxima of 74% overall and 0.61 Kappa accuracy (
Table 2). Sentinel-1 dual-pol SAR data with VH, VV, VH ×VV, and ((VV + VV)/2) combinations demonstrated only 48% overall and 0.33 Kappa accuracy. However, the combination of Sentinel-1 and 2 bands and VIs demonstrated good overall (67.5%) and Kappa (0.54) accuracy (
Table 2).
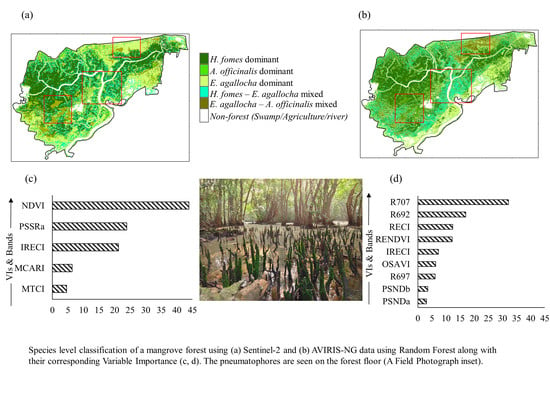
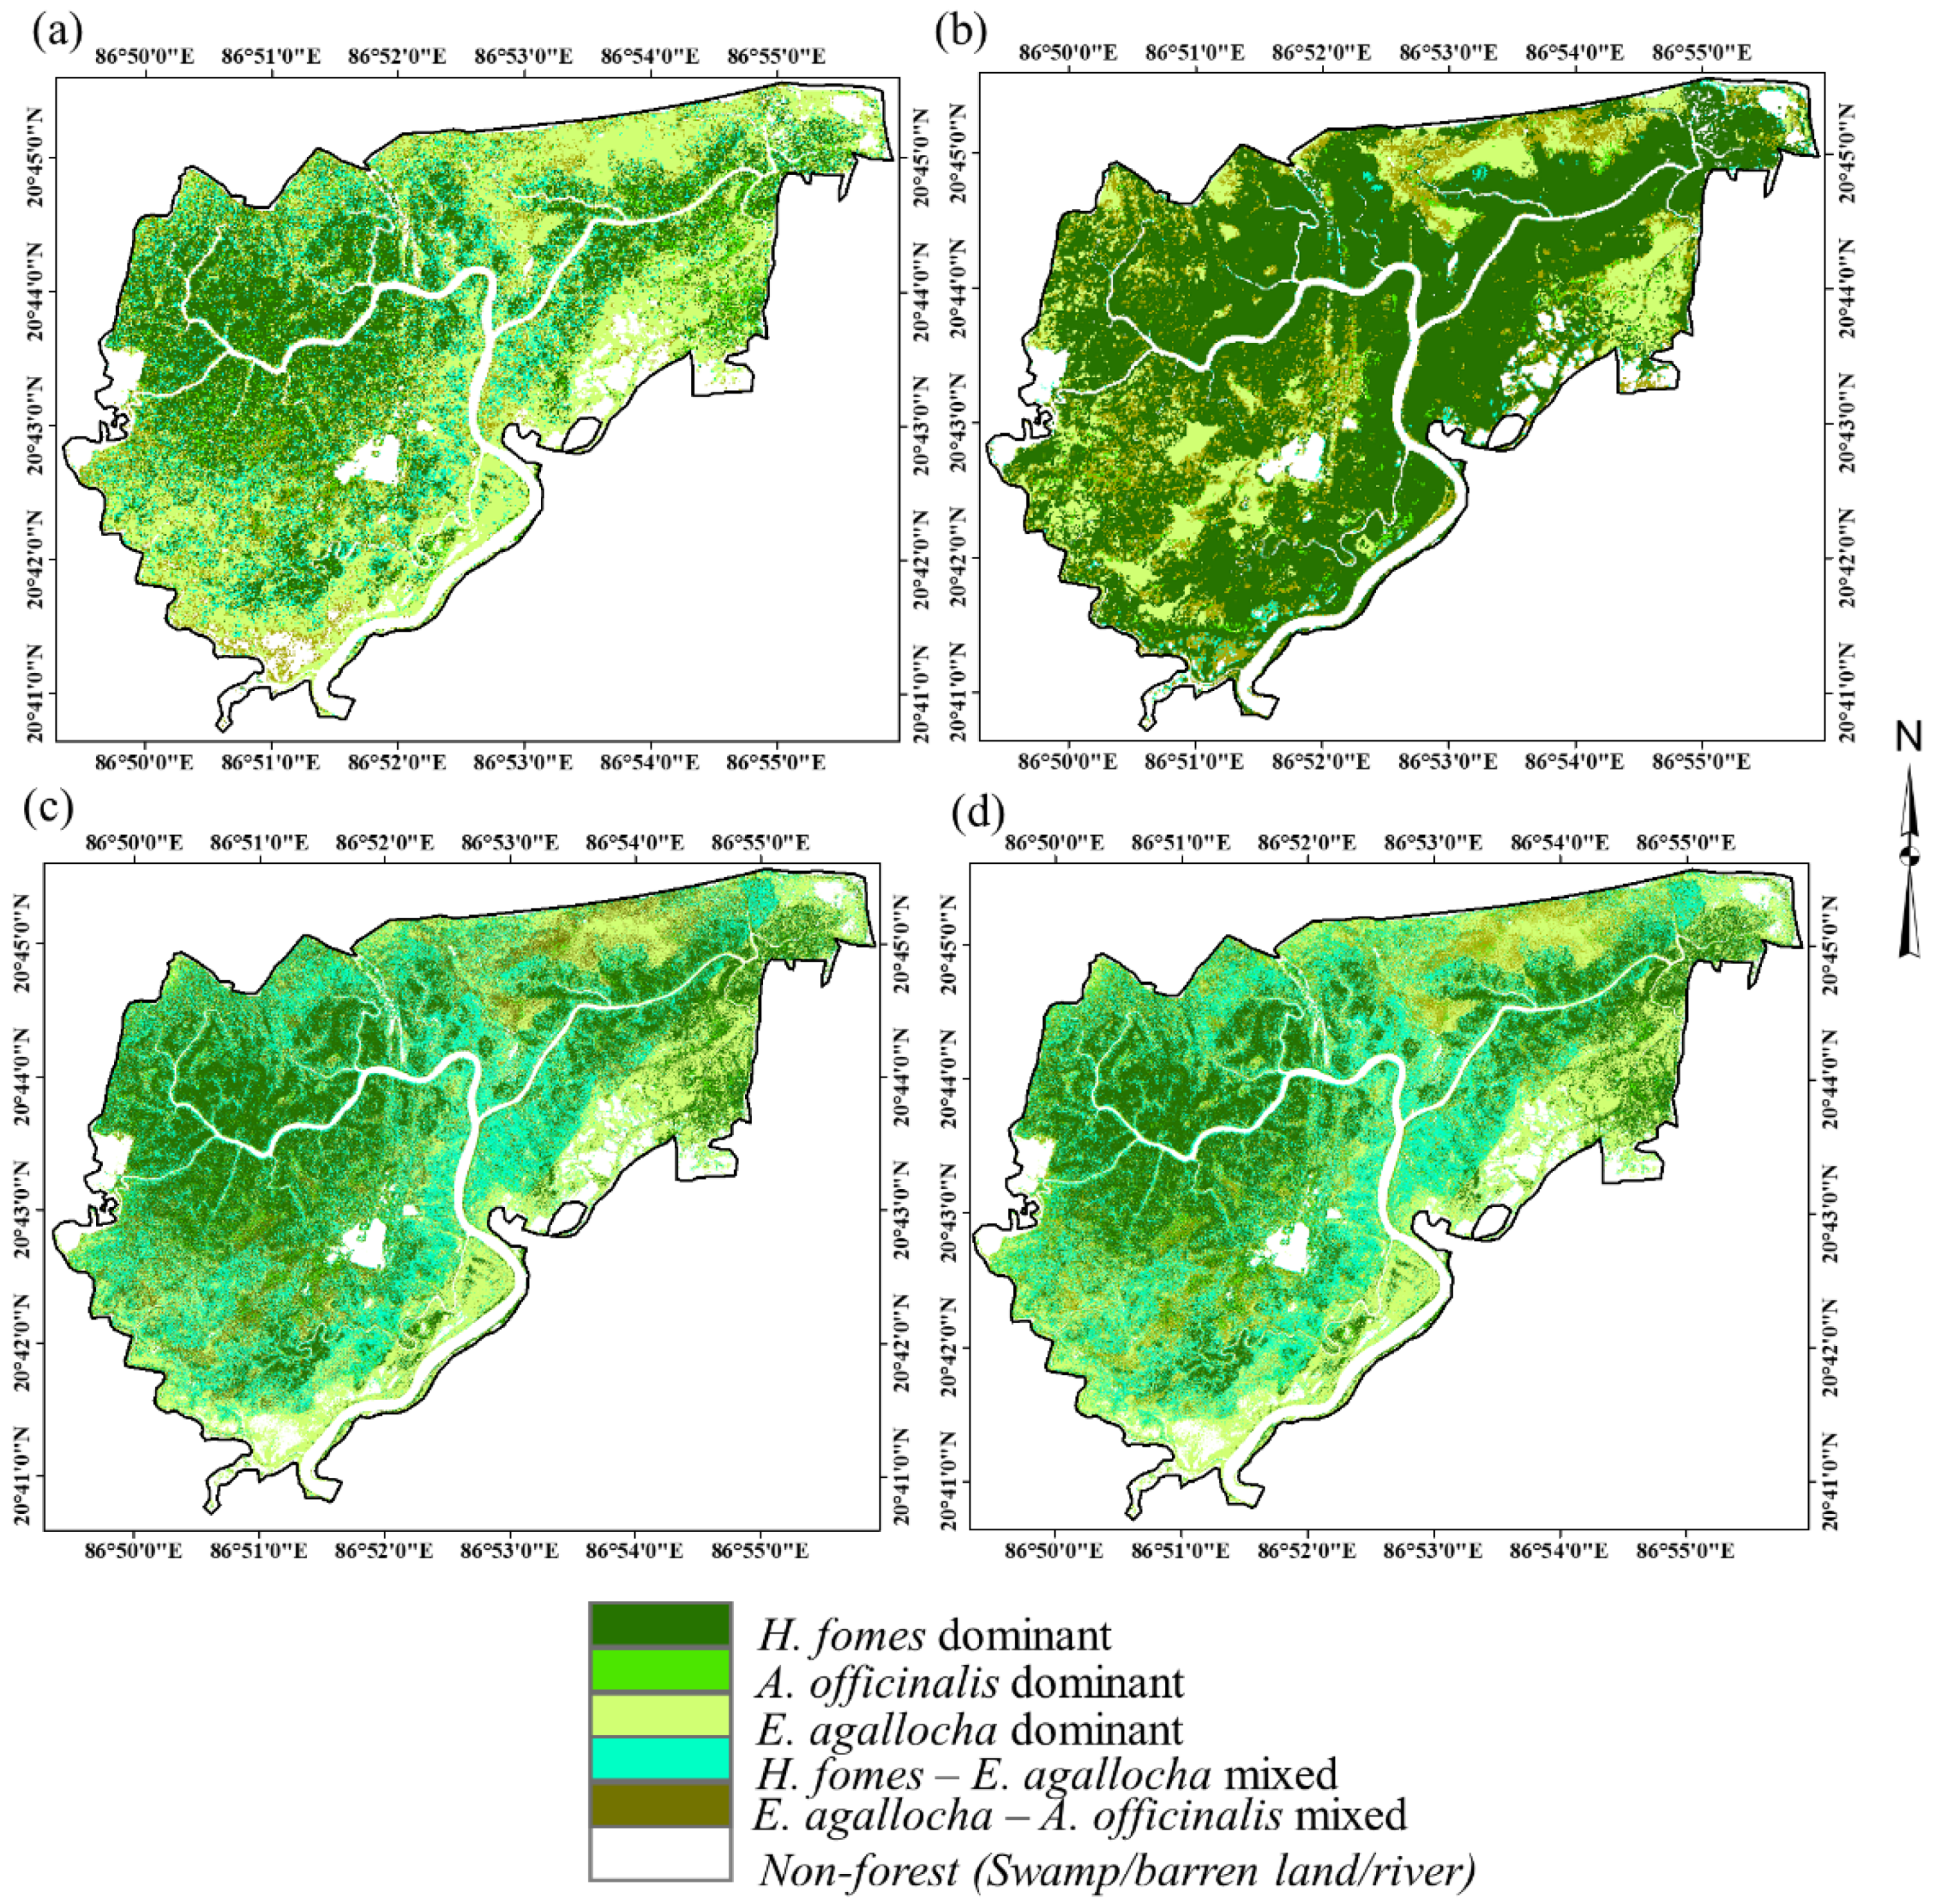
It was found that the
Heritiera fomes are dominantly distributed in the highlands of BWS, mostly in homogenous and contiguous patches (
Figure 3a–d). The patches of
Heritiera fomes are dominant in the eastern and western parts of BWS along the creeks. Compared to other species, the distribution of
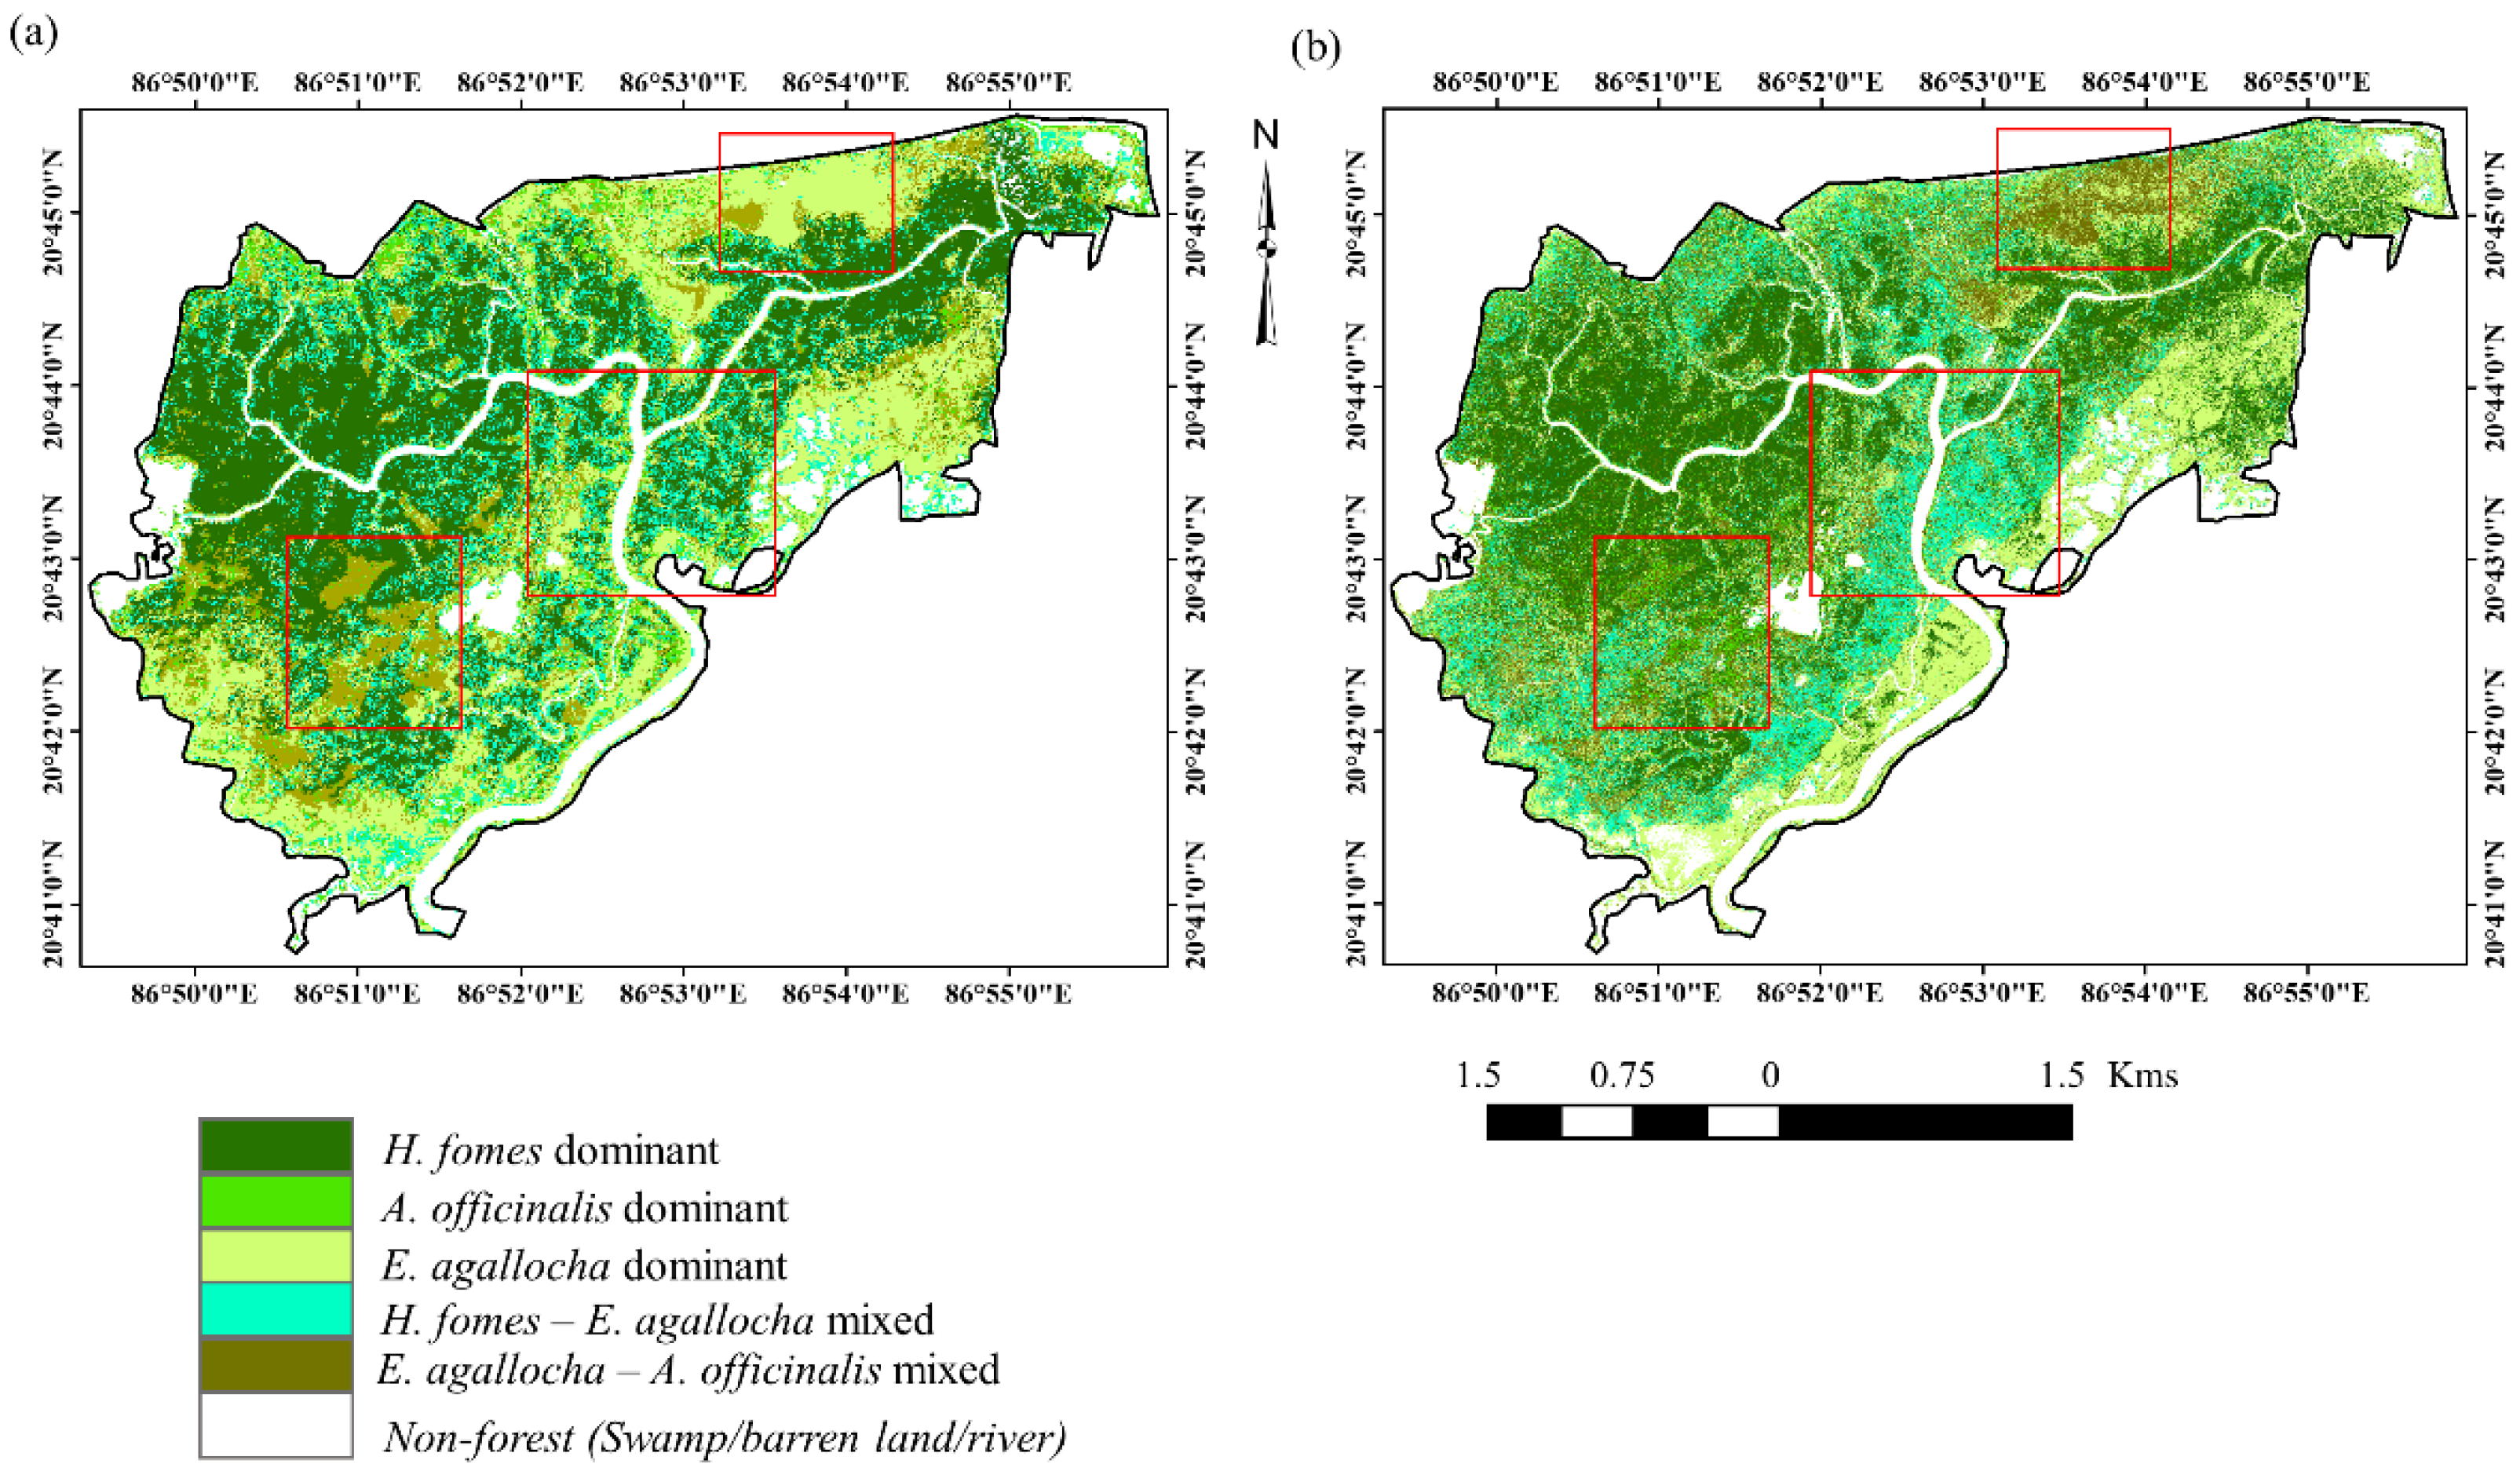
Heritiera fomes is more similar, as derived using the AVIRIS-NG and Sentinel-2 data (
Figure 4a,b). The southern and peripheral regions of the sanctuary are dominated with
Avicennia officinalis and
Excoecaria agallocha species in different proportions. The dominant compositions of
Heritiera fomes,
Excoecaria agallocha and
Avicennia officinalis cover 17.29 km
2, 12.37 km
2, and 3.13 km
2, respectively. Mixed species such as
Heritiera fomes–
Excoecaria agallocha and
Excoecaria agallocha–
Avicennia officinalis are found distributed over 7.6 km
2 and 5.5 km
2, respectively. The swamp, agricultural land, river, waterbody, and fallow land cover 5.9 km
2. These area statistics were calculated using the map derived from the Sentinel-2 dataset.
The post-classification accuracy was assessed using 100 data points, revealing a maximum overall accuracy of 69% and Kappa accuracy of 0.59 using AVIRIS-NG narrow bands and vegetation indices, followed by 50% (0.34) and 38% (0.2) for Sentinel-2 VIs and Sentinel 1 and 2 combinations, respectively. The user’s and producer’s accuracy for the pure classes is estimated to be higher for Heritiera fomes than Avicennia officinalis and Excoecaria agallocha, whereas for mixed classes, the accuracy was observed to be higher for Heritiera fomes and Avicennia officinalis compared to Avicennia officinalis and Excoecaria agallocha.
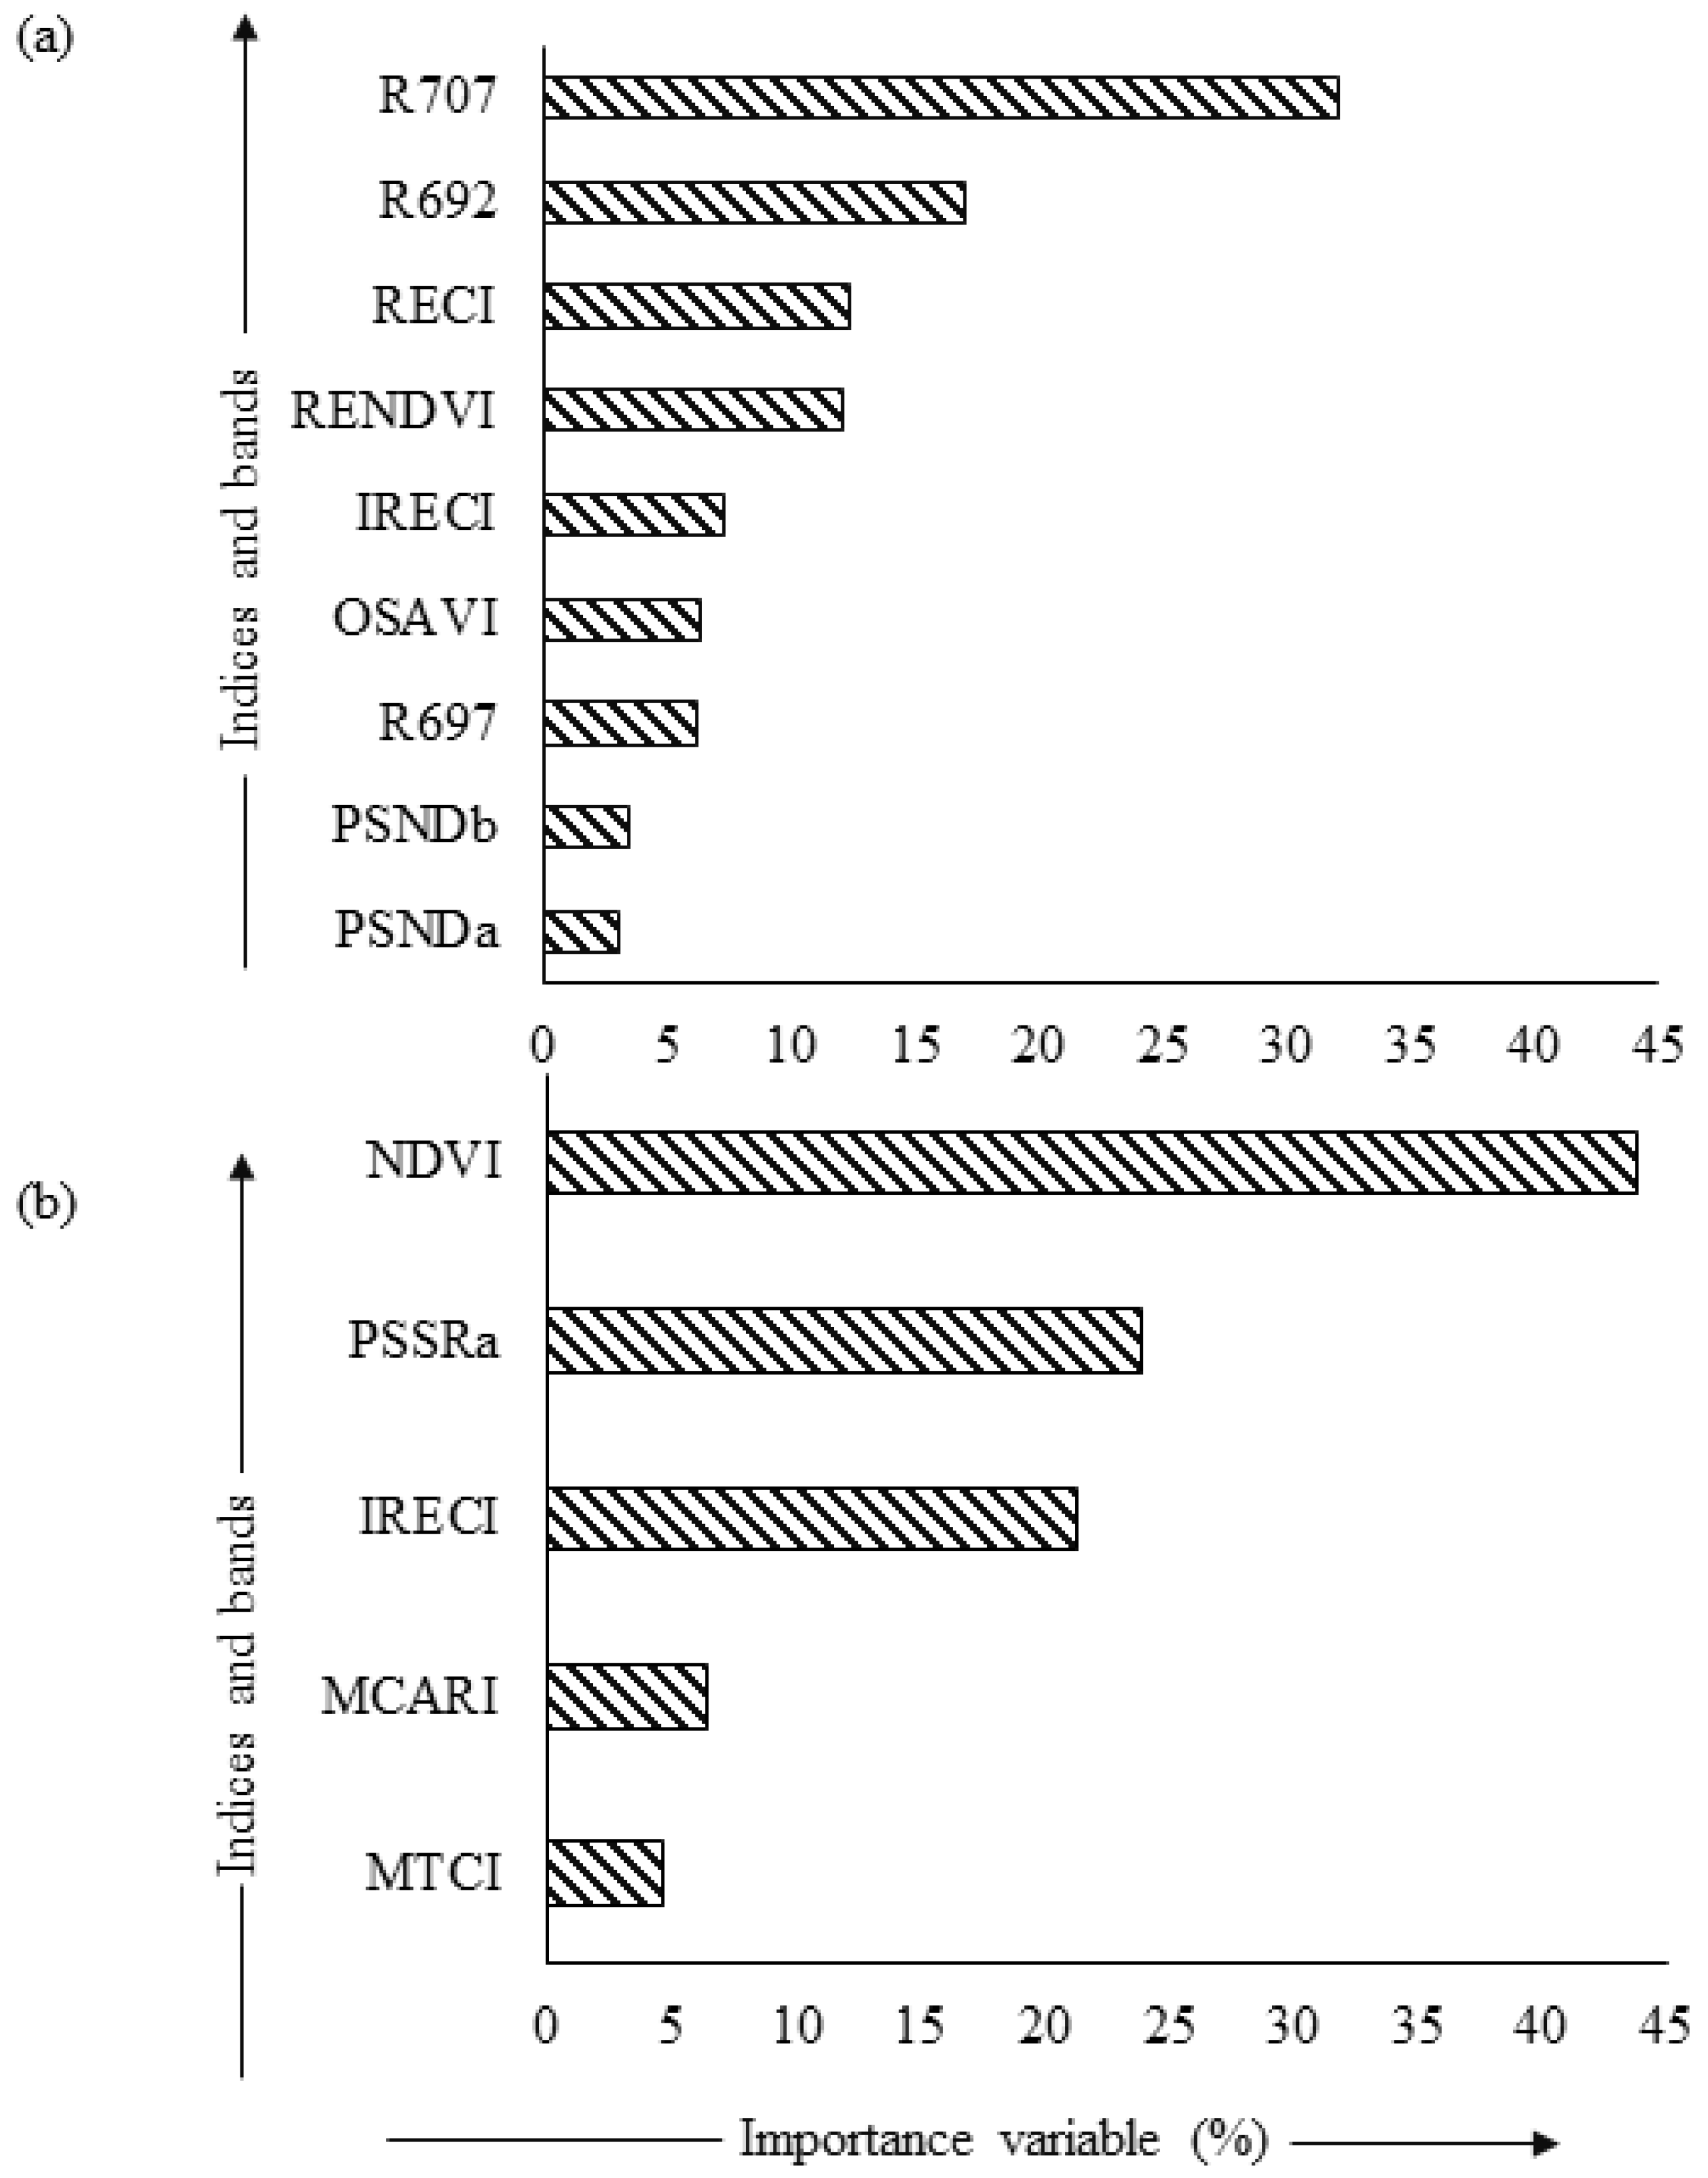
3.3. Importance Variables
The importance ranking retrieved using AVIRIS-NG data revealed that the red edge band (B
077) exhibited the maximum contribution (32%), followed by B
692 (17%), RECI, and RENDVI, which contributed equally (12%) to species-level classification (
Figure 5a). The importance plots derived using Sentinel-2-based VIs revealed that red edge-based indices such as NDVI (44%), PSSRa (24%), and IRECI (21%) make the maximum contributions in the RF model-based species-level classification (
Figure 5b). This plot highlights the most important variables and their contributions to the classification results derived with the RF model.
4. Discussion
Species occurrences were recorded on the ground according to the stand density in the ESU scale with geolocation information. It may be noted that the Sentinel 1 and 2 pixels nearly matched with the dimension (20 × 20 m
2) of the ESU, while the 25 (5 × 5 m
2) AVIRIS-NG pixels corresponded to one ESU. It should be mentioned that extensive fieldwork in this ecosystem is challenging due to the presence of pneumatophores, networks of creeks, and mud owing to the tidal effects. According to field observations, the impact of the tidal effect on this study is minimal, as the maximum tidal height was almost 1.2 m on the image acquisition date. It was found that the
Heritiera fomes are dominantly distributed in the highlands of BWS, and their distribution is mostly homogenous.
Avicennia officinalis and
Excoecaria agallocha species are dominant in the peripheral regions of the sanctuary at different proportions. The spatial distributions of different species could indicate the effects of tidal inundation and the species-specific salt tolerance capacity. As species-wise ground spectra were unavailable, the spectral signature collected from the image highlighted the differential spectral responses of the three dominant species
Heritiera fomes,
Excoecaria agallocha, and
Avicennia officinalis [
66]. The spectral analysis of
Avicennia officinalis showed higher reflectance in the NIR region; this may have been caused by the structure of the leaves and the leaf phenology phase. Comparatively, the leaves of
Avicennia officinalis are spongier or softer than those of the other two selected species because of the spongy mesophyll cells, which induce higher reflectance in the NIR region.
The broad band Sentinel-2 data revealed the maximum classification accuracy (74%) followed by narrow hyperspectral AVIRIS-NG data (70.2%) in discriminating three dominant species and two mixed compositions (
Table 2;
Figure 4a,b). Green et al. [
67] reported that high-resolution data may not always yield better results in mangrove species map** due to the presence of mixed pixels, a background soil–water effect, and spectral saturation in the higher biomass range. However, the ground-based spectral observation provides better results for map** mangrove species [
68], which are often poorly interpreted from satellite imagery [
11]. This study used 166 ground-based ESU observations for develo** the RF model, wherein both the pure and mixed-species compositions were used for model training to minimise model bias [
69]. Our training samples were selected from both homogeneous and heterogeneous ESUs to maintain unbiasedness and a higher classification accuracy, as stated by Millard and Richardson [
69]. Kumar et al. [
18] focussed on the classification of duplet combinations of mangrove species in BWS, while this study classified and mapped three dominant species (
Heritiera fomes, Excoecaria agallocha and
Avicennia officinalis) and two duplets (
Heritiera fomes, Excoecaria agallocha and
Excoecaria agallocha and
Avicennia officinalis). Pandey et al. [
20] mapped
Cerbera oddolam as a dominant mangrove species out of the ten species identified in their study in BWS. Heenkenda et al. [
10] employed the much higher resolution Worldview-2 imagery and identified five mangrove species using the support vector machine (SVM) model. Zhu et al. [
70] used the Worldview-2 dataset and observed 87% classification accuracy, thereby affording them better results given the higher resolution of the data used. Though spatial information is vital in accurate classification, here, the 4 m AVIRIS-NG provided marginally inferior accuracy compared to the 20 m Sentinel-2 data. The higher performance of Sentinel-2 broad bands indicates the ideal placement of the central wavelengths of important absorption bands [
71].
** of mangrove forests.
Species-level discrimination was possible using the RF model as it uses a subset of features to build individual clusters, based on a decision made via effective features that reduces the error for the entire feature vector. The RF model evaluated each attribute internally [
76], and handled the predictor variables well, thus giving multimodal distribution, and the parameter tuning was easy (
Table 2). Arasumani et al. [
32] recommended the use of an RF model for species-level map** via Sentinel-2 data in the absence of any hyperspectral imagery.
Our study has proven that the Sentinel-2 dataset has comparatively better potential to perform species-level classification. This could be attributed to the ideal placement of the central wavelength and the appropriate bandwidth. Hyperspectral data have a finer resolution, giving a salt and pepper effect on the classified map, which is not observed in the Sentinel-2 data-derived map. The majority of the species’ occurrences are well-mapped for both the AVIRIS-NG and Sentinel-2 data-derived maps. Few regions indicated dissimilarities; such regions suggest higher uncertainty in species map** (red boxes,
Figure 4a,b), mainly concerning the
Excoecaria agallocha and
Excoecaria agallocha–Avicennia officinalis mixed classes, whereas
Heritiera fomes followed almost the same distribution in both the maps. The higher uncertainty in certain regions may be due to the background soil reflectance caused by lower canopy cover, which could be the reason for the greater uncertainty in the
Avicennia officinalis-dominated area.
5. Conclusions
Delineating the species distribution of mangrove forests using remotely sensed datasets is useful for understanding their ecological behaviour. Of all bands and VIs used, both AVIRIS-NG and Sentinel-2 provided comparable results, with the latter showing marginally better accuracy. This study focused on the potential of red edge bands and chlorophyll absorption bands for species-level map** of a mangrove forest. The results indicated that red edge bands and their corresponding indices are useful for species discrimination. Further attempt at species-level map** could be made by incorporating the reflectance bands within 900 nm to 1300 nm and 1533 nm to 1954 nm regions using AVIRIS-NG narrow bands. In previous studies, researchers achieved higher accuracy by merging multi-sensor datasets, but our study revealed that a single-sensor dataset (especially Sentinel-2 and AVIRIS-NG) also has the potential to improve accuracy in classification. This study also exemplifies that the combination of multisensor (Sentinel-1 and 2) data may not always perform well, especially in mangrove forests, as Sentinel-1 is not capable of generating species-wise clusters. However, the higher performance of Sentinel-2 broad bands reiterates the importance of the placement of the central wavelengths in absorption bands. This study exemplifies the potential of broad Sentinel-2 and narrow AVIRIS-NG bands to classify and map three dominant species, using the red edge spectral region as the discriminant, in a mangrove forest in eastern India. Further, advanced machine learning models, such as RF, handled the predictor variables well, enabling multimodal distribution for optimal classification.
Supplementary Materials
The following are available online at
https://mdpi.longhoe.net/article/10.3390/rs13112027/s1, Figure S1: Field photographs of (
a)
Heritiera fomes, (
b)
Excoecaria agallocha, and (
c)
Avicennia officinalis stands measured during field visit, Figure S2: Mean surface reflectance spectra (VNIR wavelength region) generated using nine adjacent pixels dominated with
Heritiera fomes,
E agallocha and
Avicennia officinalis.
Author Contributions
Conceptualisation, M.D.B., S.P., and S.B.; methodology, M.D.B., S.B., S.P., and B.J.; software, S.B., B.J. and S.P.; validation, S.M.G., S.P., S.B. and B.J.; formal analysis, M.D.B., S.B., S.P., P.D. and B.J.; investigation, M.D.B., S.P., P.S.R. and S.K.B.; resources, M.D.B., B.K.B., P.S.R. and S.K.B.; data curation, S.B. and B.J.; writing—original draft preparation, S.B., S.P. and M.D.B.; writing—review and editing, P.D., P.S.R., B.K.B. and S.K.B.; visualisation, M.D.B., S.B. and S.P.; supervision, M.D.B., B.K.B. and P.S.R.; project administration, B.K.B. and M.D.B.; funding acquisition, M.D.B. All authors have read and agreed to the published version of the manuscript.
Funding
This research was funded by Space Applications Centre, ISRO, Ahmedabad, India. P.S.R. is one of the authors who takes care of the APC.
Institutional Review Board Statement
Not Applicable.
Informed Consent Statement
Not Applicable.
Data Availability Statement
Not applicable.
Acknowledgments
M.D.B. is thankful to SAC-ISRO, Ahmedabad for financial support in form of a research funding for AVIRIS-NG AO project. S.P., and B.J. is thankful to IIT Kharagpur for MHRD fellowship to pursue Ph.D. research. All Authors are thankful to the authorities of CORAL and IIT Kharagpur for providing laboratory facilities. The authors are also thankful to Odisha state forest and wildlife department for permission for field visit. The support extended by Nirakar Behera during field work is thankfully acknowledged and greatly appreciated.
Conflicts of Interest
The authors declare no conflict of interest. The funders had no role in the design of the study; in the collection, analysis, or interpretation of data; in the writing of the manuscript, or in the decision to publish the results.
References
- Behera, M.D.; Roy, P.S. Forest Remote Sensing, Biodiversity and Climate Change. Curr. Sci. 2012, 102, 1083–1084. [Google Scholar]
- Kuenzer, C.; Bluemel, A.; Gebhardt, S.; Quoc, T.V.; Dech, S. Remote Sensing of Mangrove Ecosystems: A Review. Remote Sens. 2011, 3, 878–928. [Google Scholar] [CrossRef] [Green Version]
- Behera, M.D. Sundari (H. Fomes)—An Indicator Species of Sundarbans. In Compendium of Biodiversity in Ganga River System; Tare, V., Mathur, R.P., Eds.; LAP Lambert Academic Publishing: Sunnyvale, CA, USA, 2019; pp. 261–278. ISBN 978-613-9-92340-3. [Google Scholar]
- Mickelson, J.G.; Civco, D.L.; Silander, J.A. Delineating Forest Canopy Species in the Northeastern United States Using Multi-Temporal TM Imagery. Photogramm. Eng. Remote Sens. 1998, 64, 891–904. [Google Scholar]
- Hill, R.A.; Wilson, A.K.; George, M.; Hinsley, S.A. Map** Tree Species in Temperate Deciduous Woodland Using Time-Series Multi-Spectral Data. Appl. Veg. Sci. 2010, 13, 86–99. [Google Scholar] [CrossRef]
- Grabska, E.; Hostert, P.; Pflugmacher, D.; Ostapowicz, K. Forest Stand Species Map** Using the Sentinel-2 Time Series. Remote Sens. 2019, 11, 1197. [Google Scholar] [CrossRef] [Green Version]
- Martin, M.E.; Newman, S.D.; Aber, J.D.; Congalton, R.G. Determining Forest Species Composition Using High Spectral Resolution Remote Sensing Data. Remote Sens. Environ. 1998, 65, 249–254. [Google Scholar] [CrossRef]
- Wang, T.; Zhang, H.; Lin, H.; Fang, C. Textural-Spectral Feature-Based Species Classification of Mangroves in Mai Po Nature Reserve from Worldview-3 Imagery. Remote Sens. 2016, 8, 24. [Google Scholar] [CrossRef] [Green Version]
- Baloloy, A.B.; Blanco, A.C.; Raymund Rhommel, R.R.C.; Nadaoka, K. Development and Application of a New Mangrove Vegetation Index (MVI) for Rapid and Accurate Mangrove Map**. ISPRS J. Photogramm. Remote Sens. 2020, 166, 95–117. [Google Scholar] [CrossRef]
- Heenkenda, M.K.; Joyce, K.E.; Maier, S.W.; Bartolo, R. Mangrove Species Identification: Comparing WorldView-2 with Aerial Photographs. Remote Sens. 2014, 6, 6064–6088. [Google Scholar] [CrossRef] [Green Version]
- Heumann, B.W. An Object-Based Classification of Mangroves Using a Hybrid Decision Tree-Support Vector Machine Approach. Remote Sens. 2011, 3, 2440–2460. [Google Scholar] [CrossRef] [Green Version]
- Behera, M.D.; Kushwaha, S.P.S.; Roy, P.S. Forest Vegetation Characterization and Map** Using IRS-1C Satellite Images in Eastern Himalayan Region. Geocarto Int. 2001, 16, 53–62. [Google Scholar] [CrossRef]
- Sudhakar Reddy, C.; Pattanaik, C.; Murthy, M.S.R. Current Science Association Assessment and Monitoring of Mangroves of Bhitarkanika Wildlife Sanctuary, Orissa, India Using Remote Sensing and GIS Author(s): C. Sudhakar Reddy, Chiranjibi Pattanaik and M.S.R. Murthy Published by: Current Scien. Current Sci. Assoc. 2018, 92, 1409–1415. [Google Scholar]
- Kumar, A.; Stupp, P.; Dahal, S.; Remillard, C.; Bledsoe, R.; Stone, A.; Cameron, C.; Rastogi, G.; Samal, R.; Mishra, D.R. A Multi-Sensor Approach for Assessing Mangrove Biophysical Characteristics in Coastal Odisha, India. Proc. Natl. Acad. Sci. India Sect. A Phys. Sci. 2017, 87, 679–700. [Google Scholar] [CrossRef]
- Gupta, K.; Mukhopadhyay, A.; Giri, S.; Chanda, A.; Datta Majumdar, S.; Samanta, S.; Mitra, D.; Samal, R.N.; Pattnaik, A.K.; Hazra, S. An Index for Discrimination of Mangroves from Non-Mangroves Using LANDSAT 8 OLI Imagery. MethodsX 2018, 5, 1129–1139. [Google Scholar] [CrossRef]
- Ramdani, F.; Rahman, S.; Giri, C. Principal Polar Spectral Indices for Map** Mangroves Forest in South East Asia: Study Case Indonesia. Int. J. Digit. Earth 2019, 12, 1103–1117. [Google Scholar] [CrossRef]
- Kishore, M.; Kulkarni, S.B. Hyperspectral Imaging Technique for Plant Leaf Identification. In Proceedings of the 2015 International Conference on Emerging Research in Electronics, Computer Science and Technology, ICERECT 2015, Mandya, India, 17–19 December 2015; pp. 209–213. [Google Scholar] [CrossRef]
- Kumar, T.; Panigrahy, S.; Kumar, P.; Parihar, J.S. Classification of Floristic Composition of Mangrove Forests Using Hyperspectral Data: Case Study of Bhitarkanika National Park, India. J. Coast. Conserv. 2013, 17, 121–132. [Google Scholar] [CrossRef]
- Padma, S.; Sanjeevi, S. Jeffries Matusita-Spectral Angle Mapper (JM-SAM) Spectral Matching for Species Level Map** at Bhitarkanika, Muthupet and Pichavaram Mangroves. Int. Arch. Photogramm. Remote Sens. Spat. Inf. Sci. ISPRS Arch. 2014, 40, 1403–1411. [Google Scholar] [CrossRef] [Green Version]
- Pandey, P.C.; Anand, A.; Srivastava, P.K. Spatial Distribution of Mangrove Forest Species and Biomass Assessment Using Field Inventory and Earth Observation Hyperspectral Data. Biodivers. Conserv. 2019, 28, 2143–2162. [Google Scholar] [CrossRef]
- Chaube, N.R.; Lele, N.; Misra, A.; Murthy, T.V.R.; Manna, S.; Hazra, S.; Panda, M.; Samal, R.N. Mangrove Species Discrimination and Health Assessment Using AVIRIS-NG Hyperspectral Data. Curr. Sci. 2019, 116, 1136–1142. [Google Scholar] [CrossRef]
- Jusoff, K. Individual Mangrove Species Identification and Map** in Port Klang Using Airborne Hyperspectral Imaging. J. Sustain. Sci. Manag. 2006, 1, 27–36. [Google Scholar]
- Demuro, M.; Chisholm, L. Assessment of Hyperion for Characterizing Mangrove Communities. In Proceedings of the 12th JPL AVIRIS airborne earth science workshop, Pasadena, CA, USA, 12 February 2003; Volume 31, pp. 18–23. [Google Scholar]
- Yang, C.; Everitt, J.H.; Fletcher, R.S.; Jensen, R.R.; Mausel, P.W. Map** Black Mangrove along the South Texas Gulf Coast Using AISA+ Hyperspectral Imagery. In Proceedings of the Indiana State University—21st Biennial Workshop on Aerial Photography, Videography and High Resolution Digital Imagery for Resource Assessment 2007, Terre Haute, Indiana, 15–17 May 2007; Volume 75, pp. 143–153. [Google Scholar]
- Thomas, N.; Lucas, R.; Bunting, P.; Hardy, A.; Rosenqvist, A.; Simard, M. Distribution and Drivers of Global Mangrove Forest Change, 1996–2010. PLoS ONE 2017, 12, e0179302. [Google Scholar] [CrossRef] [Green Version]
- Cho, M.A.; Debba, P.; Mathieu, R.; Naidoo, L.; Van Aardt, J.; Asner, G.P. Improving Discrimination of Savanna Tree Species through a Multiple-Endmember Spectral Angle Mapper Approach: Canopy-Level Analysis. IEEE Trans. Geosci. Remote Sens. 2010, 48, 4133–4142. [Google Scholar] [CrossRef]
- Pham, T.D.; Bui, D.T.; Yoshino, K.; Le, N.N. Optimized Rule-Based Logistic Model Tree Algorithm for Map** Mangrove Species Using ALOS PALSAR Imagery and GIS in the Tropical Region. Environ. Earth Sci. 2018, 77, 1–13. [Google Scholar] [CrossRef]
- Wong, F.K.K.; Fung, T. Combining EO-1 Hyperion and Envisat ASAR Data for Mangrove Species Classification in Mai Po Ramsar Site, Hong Kong. Int. J. Remote Sens. 2014, 35, 7828–7856. [Google Scholar] [CrossRef]
- Zhang, H.; Wang, T.; Liu, M.; Jia, M.; Lin, H.; Chu, L.M.; Devlin, A.T. Potential of Combining Optical and Dual Polarimetric SAR Data for Improving Mangrove Species Discrimination Using Rotation Forest. Remote Sens. 2018, 10, 467. [Google Scholar] [CrossRef] [Green Version]
- Cao, J.; Leng, W.; Liu, K.; Liu, L.; He, Z.; Zhu, Y. Object-Based Mangrove Species Classification Using Unmanned Aerial Vehicle Hyperspectral Images and Digital Surface Models. Remote Sens. 2018, 10, 89. [Google Scholar] [CrossRef] [Green Version]
- Zhang, H.; Xu, R. Exploring the Optimal Integration Levels between SAR and Optical Data for Better Urban Land Cover Map** in the Pearl River Delta. Int. J. Appl. Earth Obs. Geoinf. 2018, 64, 87–95. [Google Scholar] [CrossRef]
- Arasumani, M.; Singh, A.; Bunyan, M.; Robin, V. Testing the Efficacy of Hyperspectral (AVIRIS-NG), Multispectral (Sentinel-2) and Radar (Sentinel-1) Remote Sensing Images to Detect Native and Invasive Non-Native Trees. Biol. Invasions 2021, 1–17. [Google Scholar] [CrossRef]
- Belgiu, M.; Drăgu, L. Random Forest in Remote Sensing: A Review of Applications and Future Directions. ISPRS J. Photogramm. Remote Sens. 2016, 114, 24–31. [Google Scholar] [CrossRef]
- Wang, D.; Wan, B.; Qiu, P.; Su, Y.; Guo, Q.; Wang, R.; Sun, F.; Wu, X. Evaluating the Performance of Sentinel-2, Landsat 8 and Pléiades-1 in Map** Mangrove Extent and Species. Remote Sens. 2018, 10, 1468. [Google Scholar] [CrossRef] [Green Version]
- Naidoo, L.; Cho, M.A.; Mathieu, R.; Asner, G. Classification of Savanna Tree Species, in the Greater Kruger National Park Region, by Integrating Hyperspectral and LiDAR Data in a Random Forest Data Mining Environment. ISPRS J. Photogramm. Remote Sens. 2012, 69, 167–179. [Google Scholar] [CrossRef]
- ** with Multiple-Source Remote-Sensing Datasets Using Label Distribution Learning in Xuan Thuy National Park, Vietnam. Remote Sens. 2020, 12, 3834. [Google Scholar] [CrossRef]
- Kulkarni, A.D.; Lowe, B. Random Forest Algorithm for Land Cover Classification. Int. J. Recent Innov. Trends Comput. Commun. 2016, 4, 58–63. [Google Scholar]
- Flores-de-Santiago, F.; Kovacs, J.M.; Wang, J.; Flores-Verdugo, F.; Zhang, C.; González-Farías, F. Examining the Influence of Seasonality, Condition, and Species Composition on Mangrove Leaf Pigment Contents and Laboratory Based Spectroscopy Data. Remote Sens. 2016, 8, 226. [Google Scholar] [CrossRef] [Green Version]
- Ghosh, S.M.; Behera, M.D.; Paramanik, S. Canopy Height Estimation Using Sentinel Series Images through Machine Learning Models in a Mangrove Forest. Remote Sens. 2020, 12, 1519. [Google Scholar] [CrossRef]
- Foody, G.M. Status of Land Cover Classification Accuracy Assessment. Remote Sens. Environ. 2002, 80, 185–201. [Google Scholar] [CrossRef]
- Fang, S.; Gertner, G.; Wang, G.; Anderson, A. The Impact of Misclassification in Land Use Maps in the Prediction of Landscape Dynamics. Landsc. Ecol. 2006, 21, 233–242. [Google Scholar] [CrossRef]
- Foody, G.M. Harshness in Image Classification Accuracy Assessment. Int. J. Remote Sens. 2008, 29, 3137–3158. [Google Scholar] [CrossRef] [Green Version]
- Cohen, J. A Coefficient of Agreement for Nominal Scales. Educ. Psychol. Meas. 1960, 20, 37–46. [Google Scholar] [CrossRef]
- Paramanik, S.; Behera, M.D.; Bhattacharya, B.; Tripathi, S. Evaluation and validation of the modis lai algorithm with digital hemispherical photography at bhitar kanika mangrove forest, india. In Proceedings of the IGARSS 2019 IEEE International Geoscience and Remote Sensing, Yokohama, Japan, 28 July–2 August 2019; pp. 6558–6561. [Google Scholar]
- Green, E.P.; Clark, C.D.; Mumby, P.J.; Edwards, A.J.; Ellis, A.C. Remote Sensing Techniques for Mangrove Map**. Int. J. Remote Sens. 1998, 19, 935–956. [Google Scholar] [CrossRef]
- Adam, E.; Mutanga, O.; Rugege, D. Multispectral and Hyperspectral Remote Sensing for Identification and Map** of Wetland Vegetation: A Review. Wetl. Ecol. Manag. 2010, 18, 281–296. [Google Scholar] [CrossRef]
- Millard, K.; Richardson, M. On the Importance of Training Data Sample Selection in Random Forest Image Classification: A Case Study in Peatland Ecosystem Map**. Remote Sens. 2015, 7, 8489–8515. [Google Scholar] [CrossRef] [Green Version]
- Zhu, Y.; Liu, K.; Liu, L.; Wang, S.; Liu, H. Retrieval of Mangrove Aboveground Biomass at the Individual Species Level with Worldview-2 Images. Remote Sens. 2015, 7, 12192–12214. [Google Scholar] [CrossRef] [Green Version]
- Manna, S.; Raychaudhuri, B. Map** Distribution of Sundarban Mangroves Using Sentinel-2 Data and New Spectral Metric for Detecting Their Health Condition. Geocarto Int. 2020, 35, 434–452. [Google Scholar] [CrossRef]
- Behera, M.D.; Srivastava, V.K. ERS-1 SAR and Landsat-4 TM Synergism for Forest Cover Studies. Int. J. Geoinformatics 2008, 4, 13–20. [Google Scholar]
- Zhang, C.; Kovacs, J.M.; Liu, Y.; Flores-Verdugo, F.; Flores-de-Santiago, F. Separating Mangrove Species and Conditions Using Laboratory Hyperspectral Data: A Case Study of a Degraded Mangrove Forest of the Mexican Pacific. Remote Sens. 2014, 6, 11673–11688. [Google Scholar] [CrossRef] [Green Version]
- Asner, G.P. Biophysical and Biochemical Sources of Variability in Canopy Reflectance. Remote Sens. Environ. 1998, 64, 234–253. [Google Scholar] [CrossRef]
- Thenkabail, P.S.; Enclona, E.A.; Ashton, M.S.; Van Der Meer, B. Accuracy Assessments of Hyperspectral Waveband Performance for Vegetation Analysis Applications. Remote Sens. Environ. 2004, 91, 354–376. [Google Scholar] [CrossRef]
- Novack, T.; Esch, T.; Kux, H.; Stilla, U. Machine Learning Comparison between WorldView-2 and QuickBird-2-Simulated Imagery Regarding Object-Based Urban Land Cover Classification. Remote Sens. 2011, 3, 2263–2282. [Google Scholar] [CrossRef] [Green Version]
| Publisher’s Note: MDPI stays neutral with regard to jurisdictional claims in published maps and institutional affiliations. |
© 2021 by the authors. Licensee MDPI, Basel, Switzerland. This article is an open access article distributed under the terms and conditions of the Creative Commons Attribution (CC BY) license (https://creativecommons.org/licenses/by/4.0/).


 ,
, 


