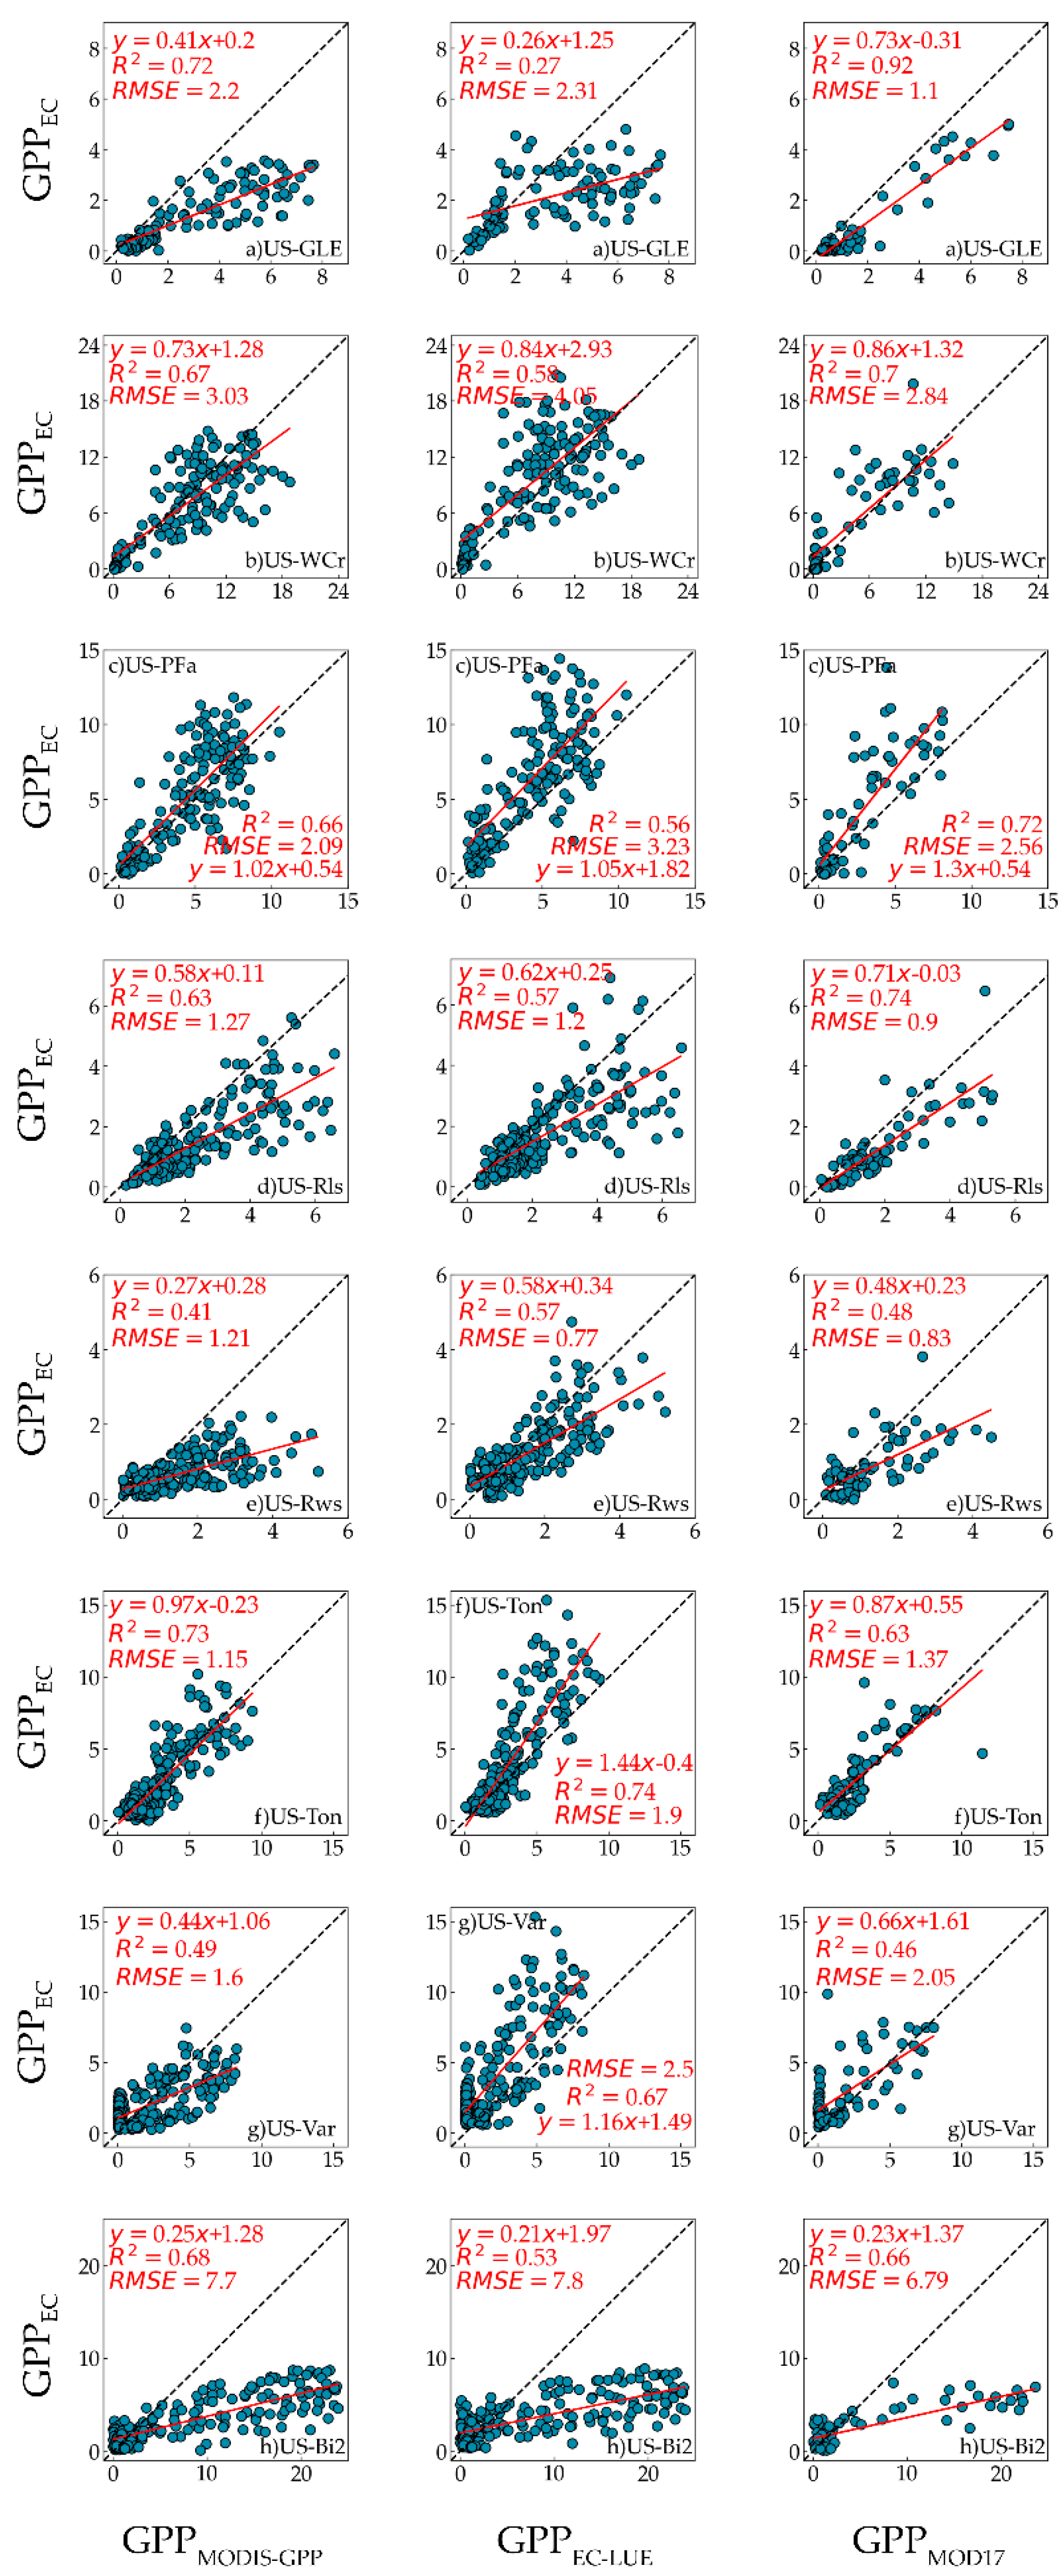
The R
2 between GPP
MODIS-GPP, GPP
EC-LUE, and GPP
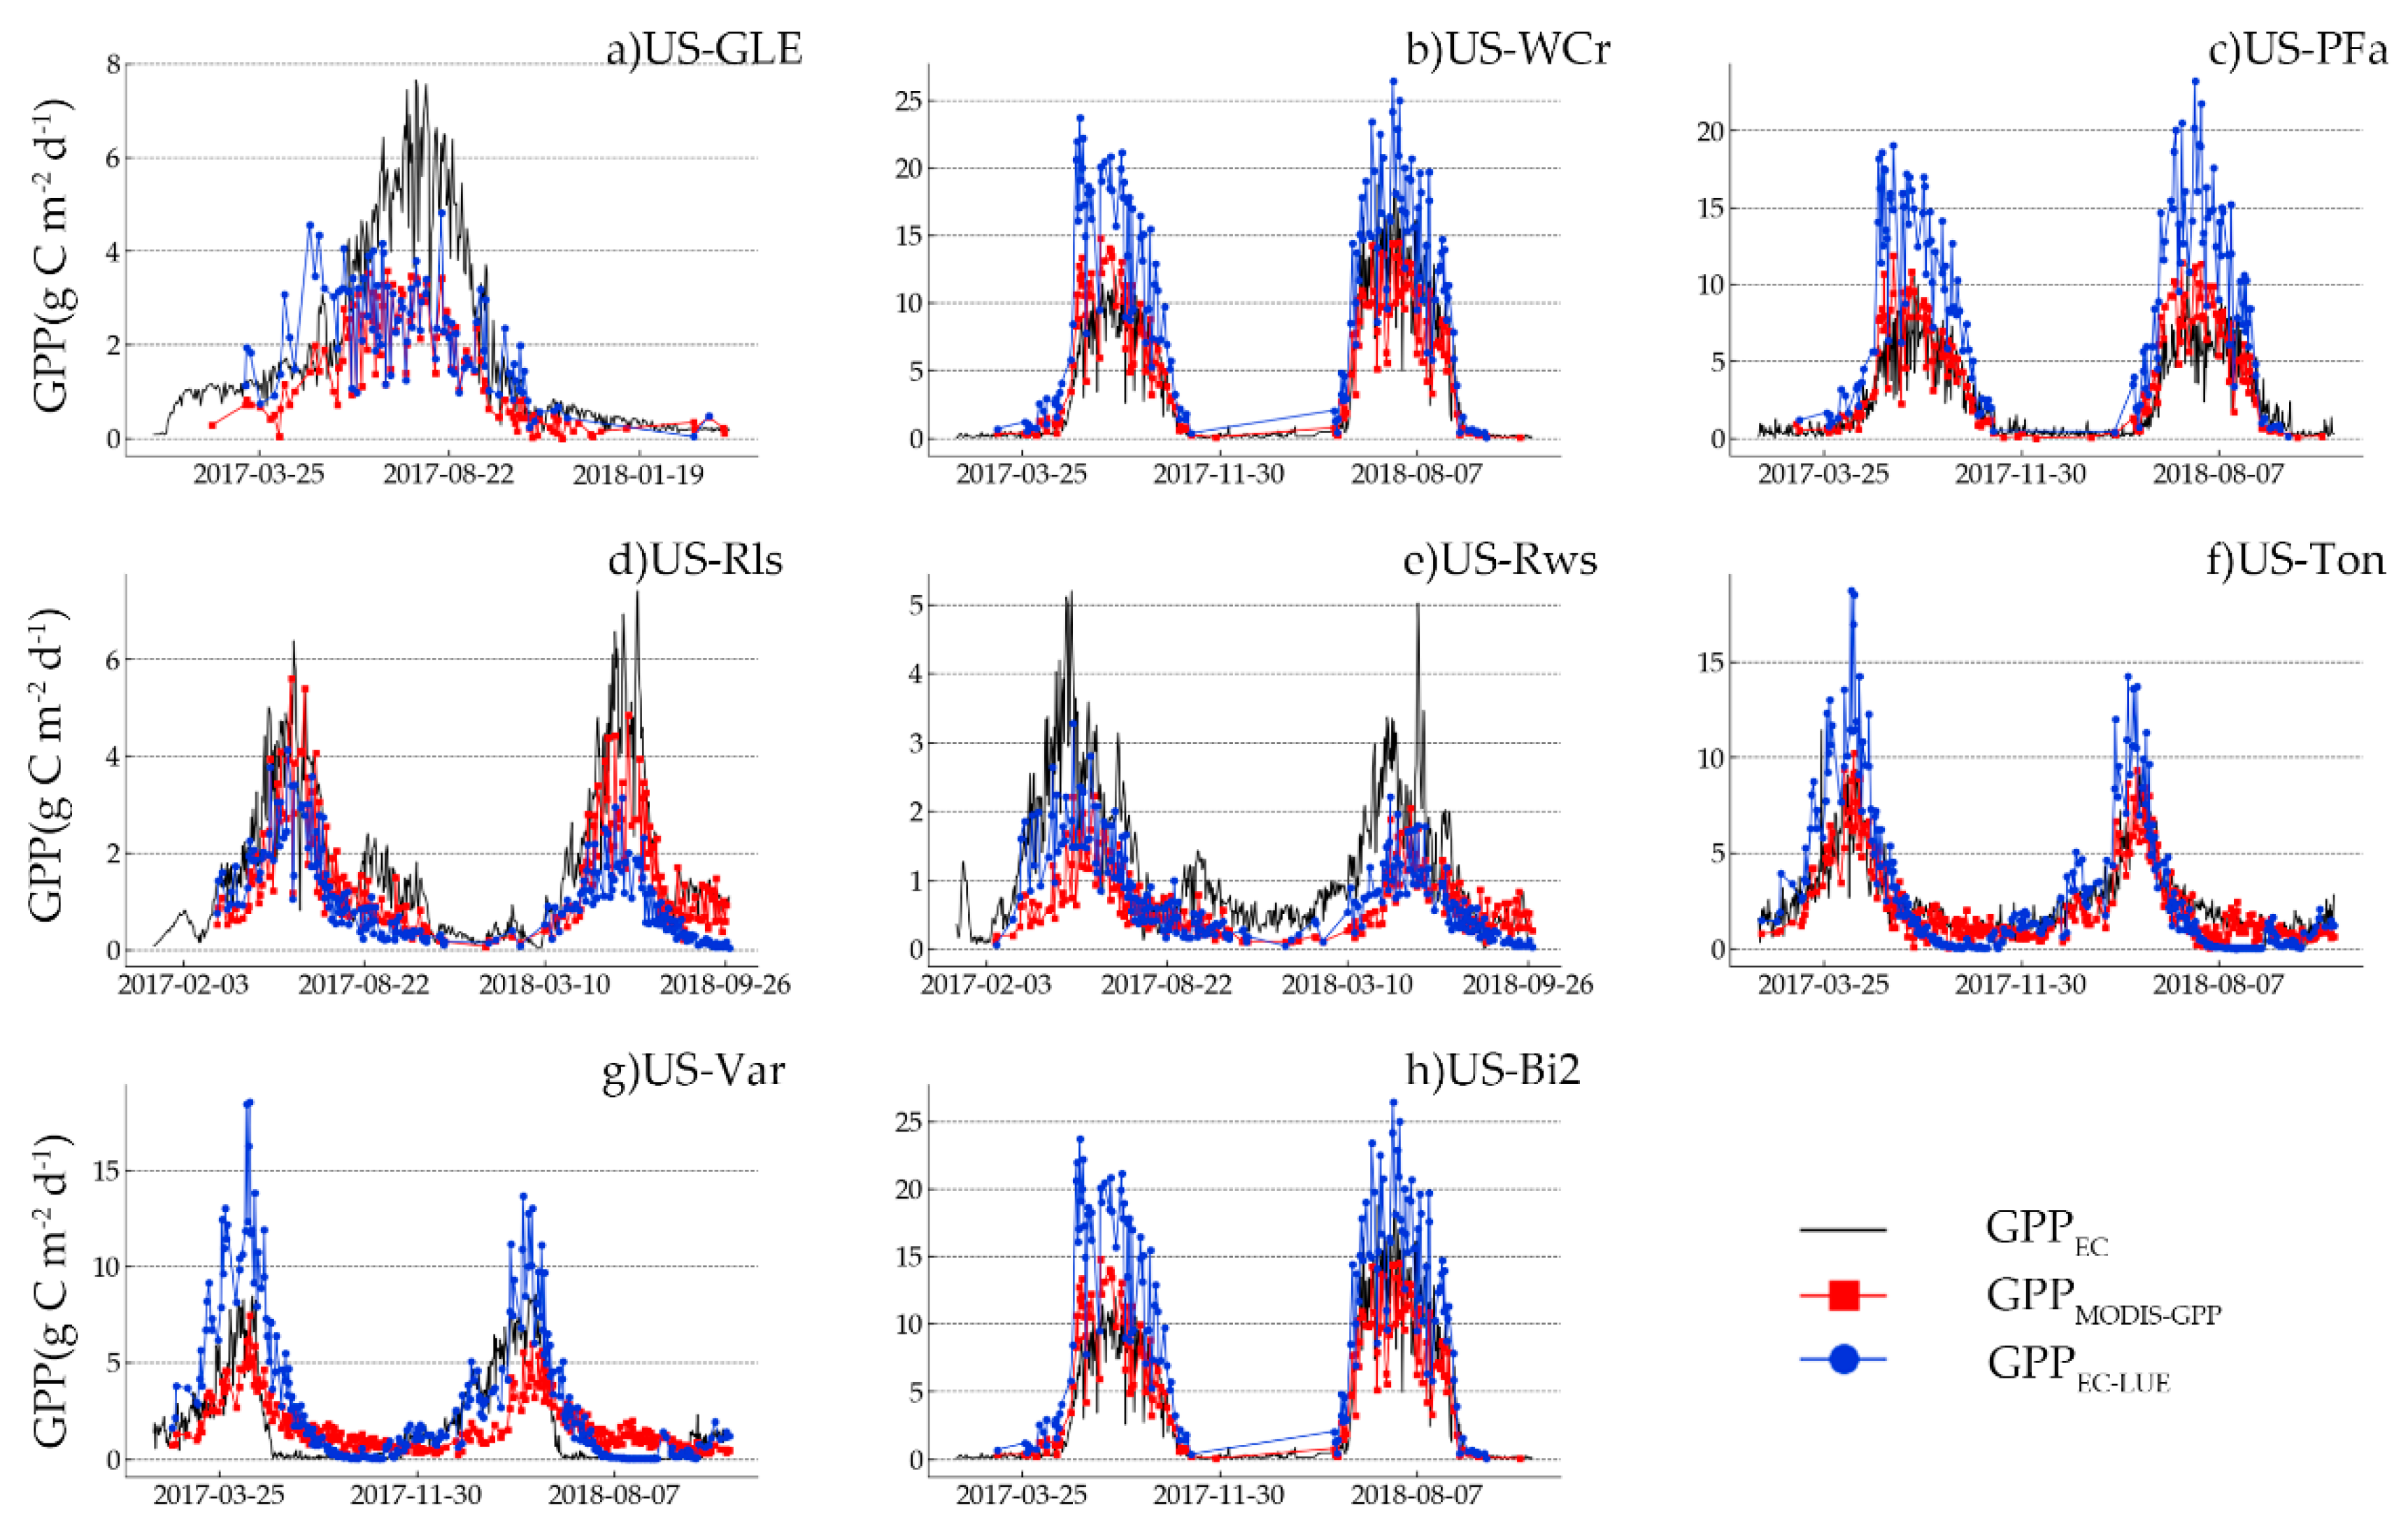
EC showed the strong correlation between modelled GPP and measured GPP. The performance of RMSE varied at different sites. Compared with GPP
MOD17, GPP
MODIS-GPP offered better GPP prediction at the US-Ton site and US-Bi2 site, and GPP
EC-LUE offered better GPP prediction at the US-Ton site, US-Var site, and US-Rws site. At the US-Ton site, GPP
MODIS-GPP and GPP
EC-LUE obtained the best performance. Previous research showed that the savanna GPP estimation accuracy was smaller than other biome types because of the misclassification and sparse vegetation cover [
50,
74,
80]. However, the woody savanna has a denser vegetation cover than the savanna [
74,
80,
81]. This structure can reduce the influence of understory vegetation and improve GPP estimation accuracy [
82]. Additionally, GPP
MODIS-GPP and GPP
EC-LUE also obtained a good performance at the US-WCr site and US-PFa site. This finding was consistent with previous studies [
5,
83]. For the US-WCr site, both GPP
MODIS-GPP and GPP
EC-LUE performed best in estimating GPP. The reasons for this can be summarized as follows. Firstly, DBF has obvious seasonal and phenological characteristics which can be monitored by satellites in real time [
32]. Secondly, the vegetation structure of DBF is simple and the vegetation coverage varies greatly in different seasons, so the estimation of FAPAR is relatively simple and accurate [
32]. Thirdly, DBF usually grows at mid and high latitudes with less cloudiness so that high-quality time-series images can be obtained [
44]. For the US-PFa site, GPP
MODIS-GPP and GPP
EC-LUE represented the growth status of MF. However, compared with GPP
MODIS-GPP, GPP
EC-LUE was overestimated (RMSE = 3.23 gC/m
2/d, bias = 2.07 gC/m
2/d). The factor that caused this overestimation was the complex vegetation structure of the mixed forest, which had various Ɛ
max due to abundant plant species. Moreover, the leaf shape, tree height, and light energy absorption conditions are different among tree species. Therefore, a single Ɛ
max used in the input model causes certain errors [
84,
85]. The performance of GPP
MODIS-GPP and GPP
EC-LUE at two shrubland sites varied. For the US-Rls site, GPP
MODIS-GPP and GPP
EC-LUE both had a moderate correlation against GPP
EC, with R
2 = 0.63 and 0.57, respectively. However, for the US-Rws site, the accuracy of GPP
MODIS-GPP was the lowest, and the performance of GPP
EC-LUE was better than that of GPP
MODIS-GPP. The factor that caused this phenomenon was the estimation accuracy of GPP at shrubland sites, which varied in different areas [
22,
86]. The growth of shrubland is mainly affected by water, so more consideration should be given to water influence factors when estimating shrubland GPP [
81,
84]. Therefore, for shrubland in temperate and frigid zones, GPP estimation accuracy is higher, but in the tropics, affected by VPD and FAPAR, the accuracy of shrubland GPP estimation is lower. At the US-Var site, the performance of GPP
EC-LUE was also better than GPP
MODIS-GPP, and the accuracy of the GPP
EC-LUE was the second highest (R
2 = 0.67). The accuracy of GPP
MODIS-GPP (R
2 = 0.49) was consistent with that of GPP
MOD17 (R
2 = 0.46). However, the performance of GPP
MODIS-GPP at the US-GLE site was far better than that of GPP
EC-LUE. For the US-GLE site, the accuracy of GPP
MODIS-GPP was worse than the US-Ton site (R
2 = 0.72). For the US-Bi2 site, the relationship between GPP
MODIS-GPP, GPP
EC-LUE and GPP
EC was moderate, and GPP
MODIS-GPP and GPP
EC-LUE obviously underestimated the cropland GPP (RMSE = 7.70 gC/m
2/d, bias = −4.53 gC/m
2/d and RMSE = 7.80 gC/m
2/d, Bias = −4.15 gC/m
2/d, respectively). This finding is aligned with previous research [
50,
87]. In crop ecosystems, different crops have different Ɛ
max and growth cycles, so a single Ɛ
max cannot represent well all types of crops [
88,
89]. Additionally, the rotation period varies for different crop types. Therefore, if the same input variables are used to estimate GPP for different crops, this can lead to a large deviation in GPP estimation [
90].
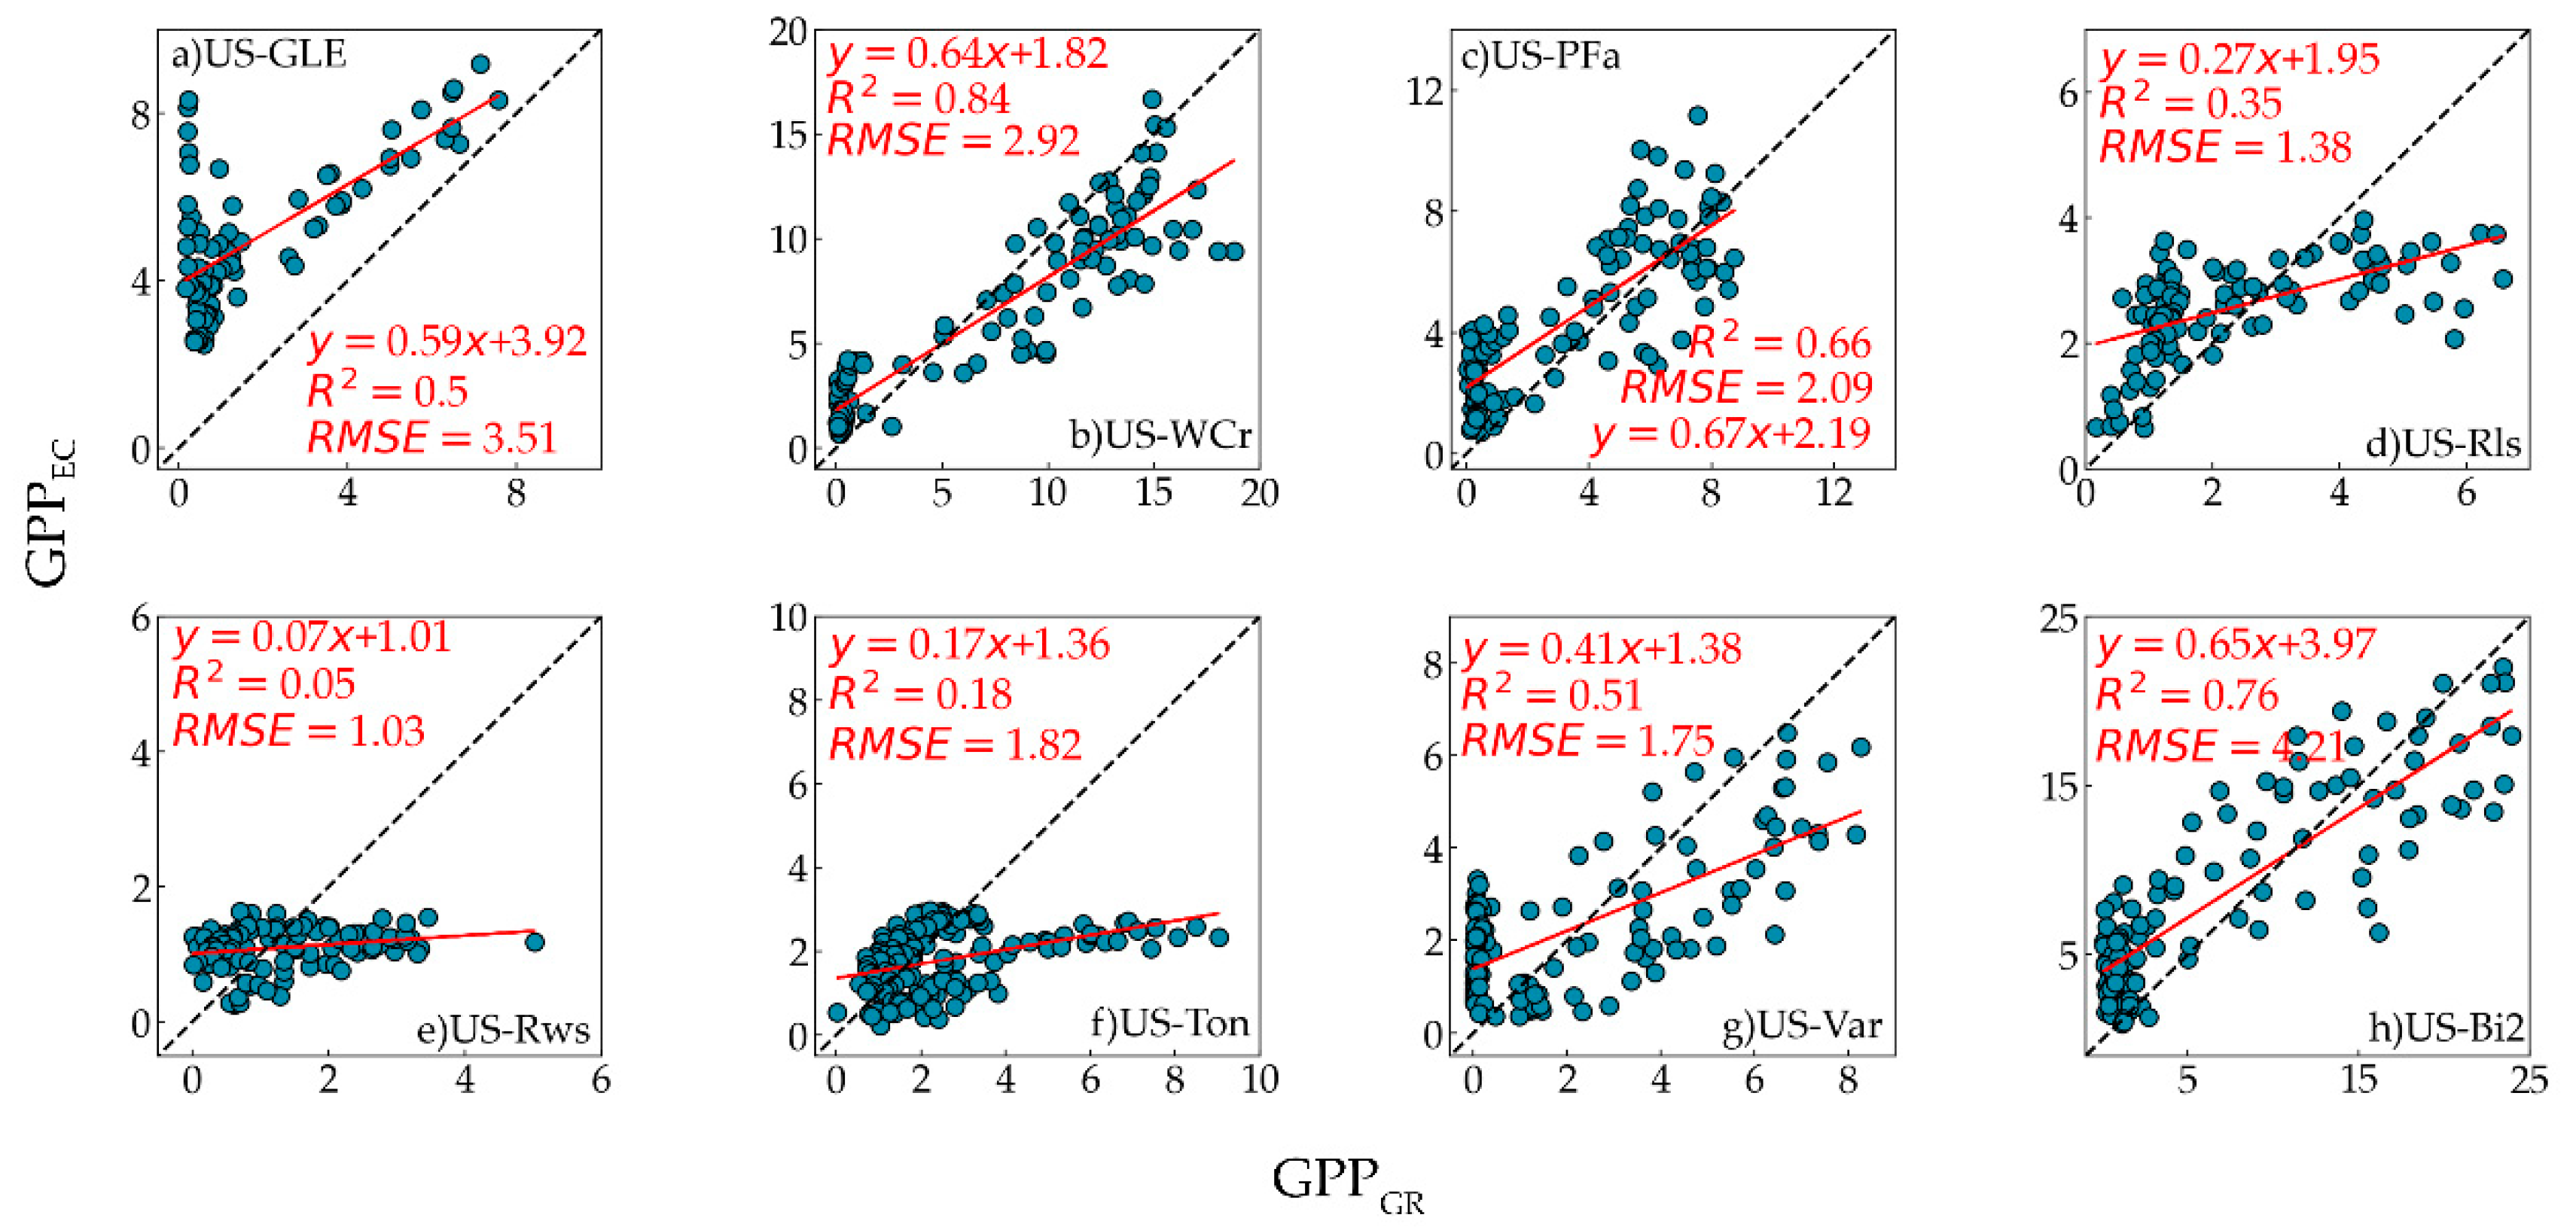
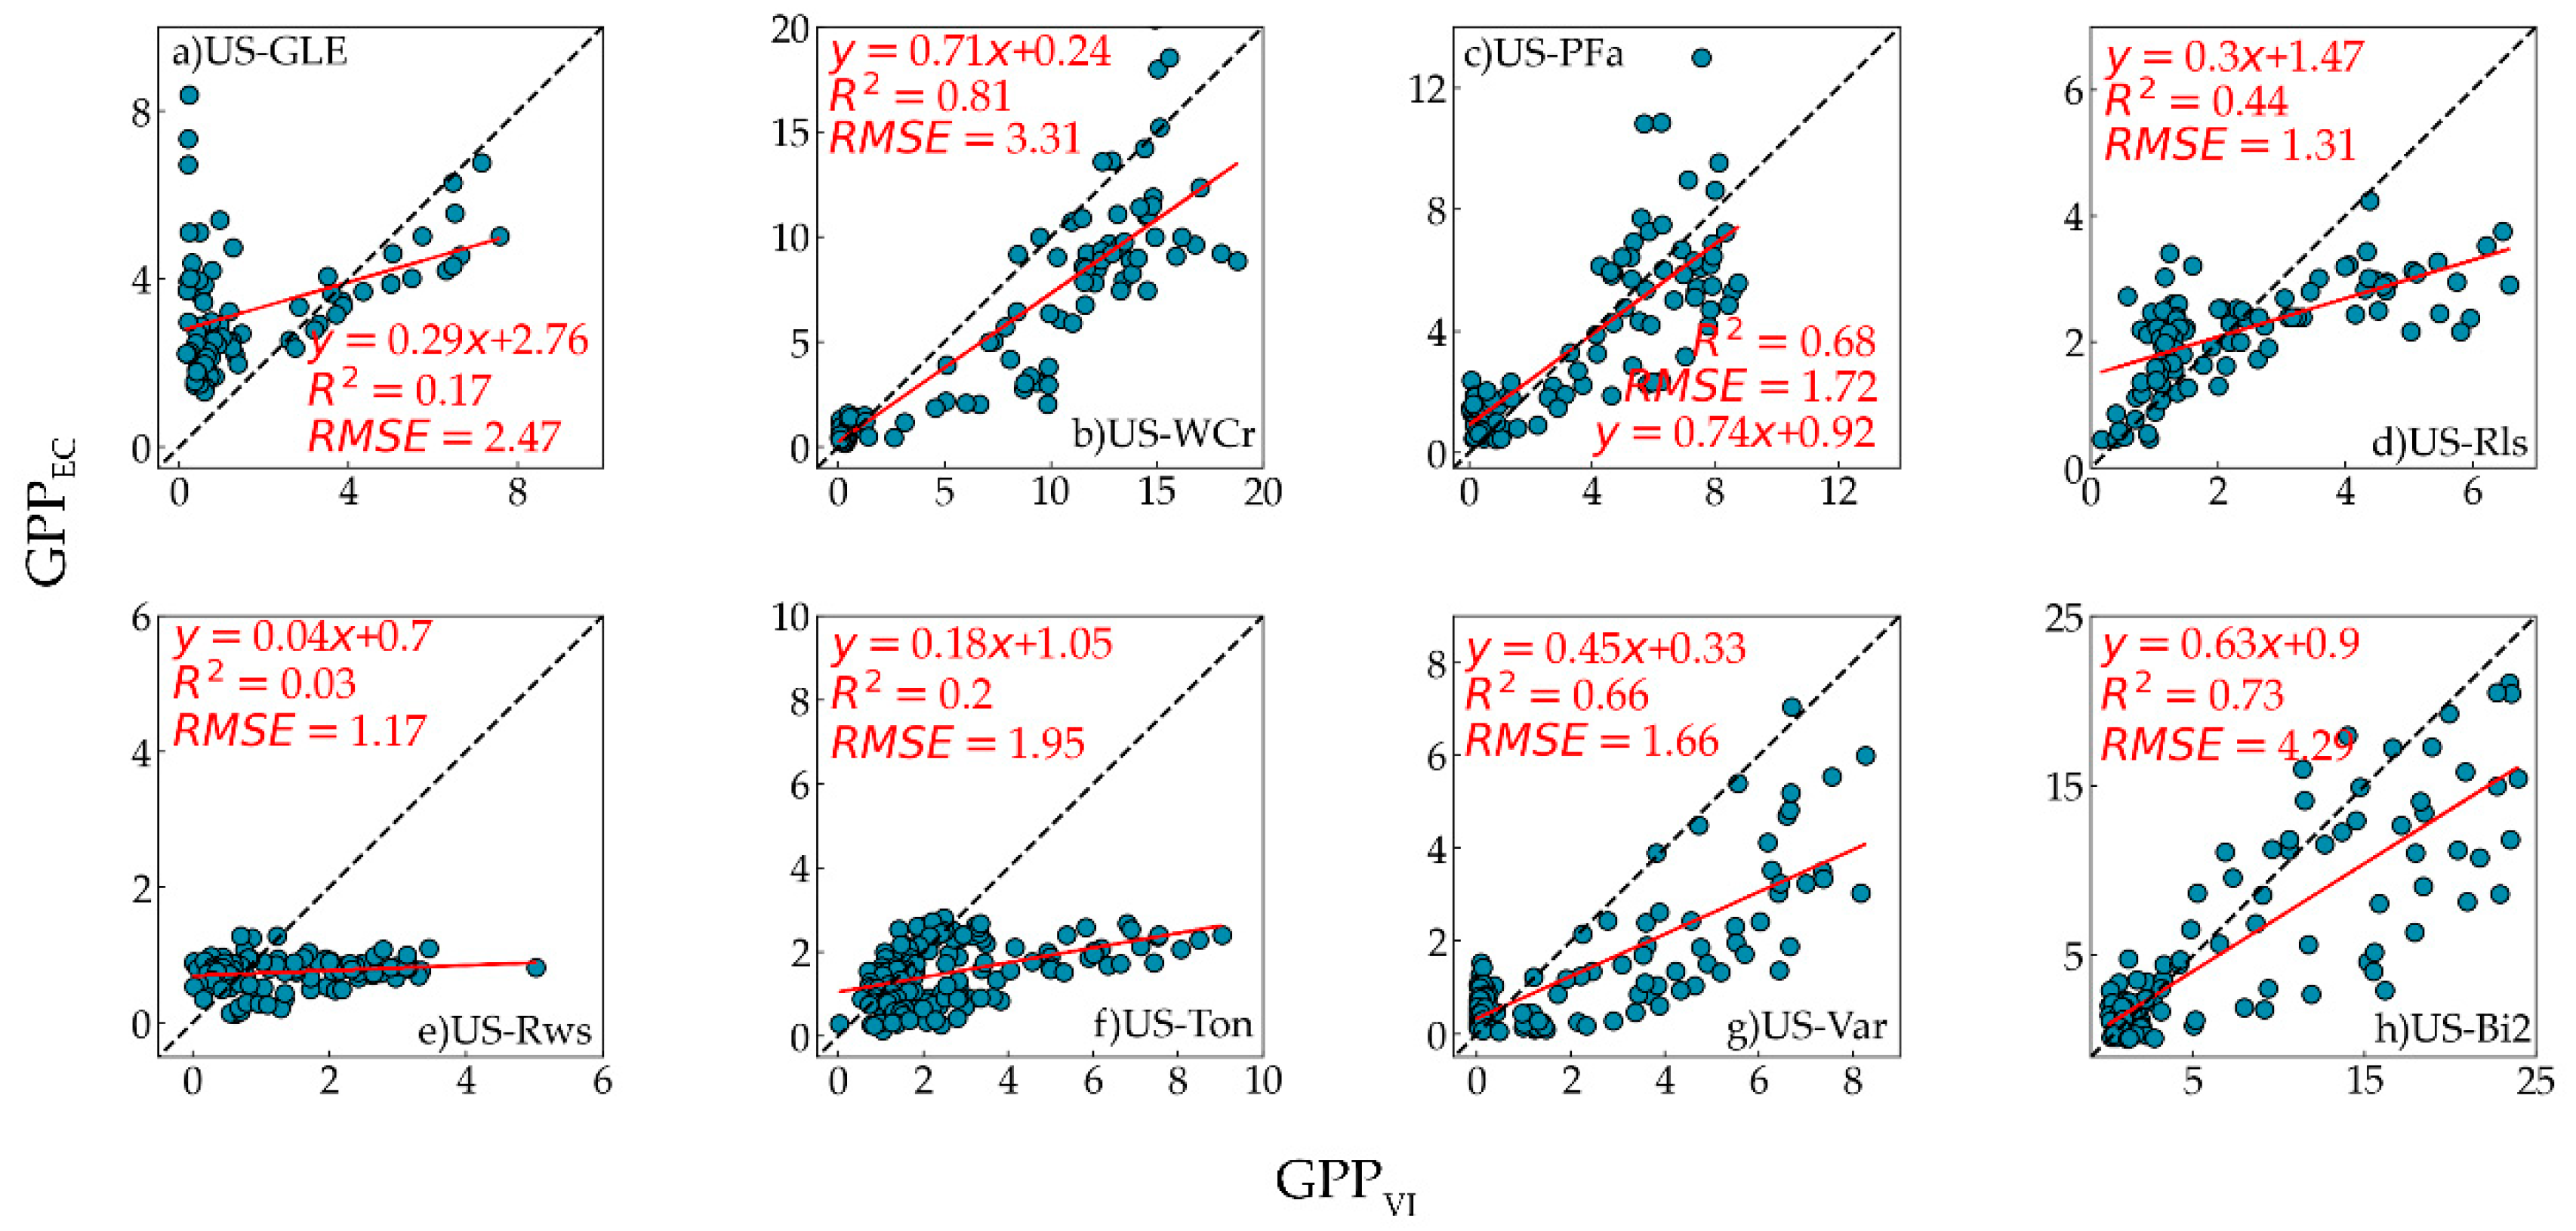
The performance of GPP
GR and GPP
VI was diverse for different biome types. The correlation between GPP
GR, GPP
VI, and GPP
EC was strongest at the US-WCr site, with R
2 = 0.84 and 0.81, respectively. Compared to the US-WCr site, the correlation between GPP
GR, GPP
VI and GPP
EC was relatively weak at the US-GLE site. This result was consistent with previous research, where OTCI was highly correlated with tower GPP across deciduous forests and weakly correlated with tower GPP across evergreen forests [
49,
50]. The reason for this phenomenon could be that stress causes a decrease of the photosynthetic efficiency [
91], the conical canopy structure, and the density of evergreen needleleaf trees. The consequent shadowing effect leads to the failure of OTCI for detecting subtle changes within the seasonal chlorophyll content of evergreen needleleaf forests [
92,
93]. Additionally, GPP
GR and GPP
VI showed moderate correlations with GPP
EC at the US-PFa site. The factors that caused this can be considered from two aspects. Firstly, the vegetation structure of mixed forests is complex, and different vegetation types will affect the estimation of GPP. Secondly, mixed forest productivity will drop sharply when the temperature drops in a short period. However, the vegetation index cannot change significantly in this case, leading to its failure in capturing the impact of temperature change on GPP [
47,
94,
95]. A strong correlation could also be observed between GPP
GR, GPP
VI, and GPP
EC at the US-Bi2 site. Previous studies have found a similar relationship between OTCI or other chlorophyll indices and GPP [
49,
78,
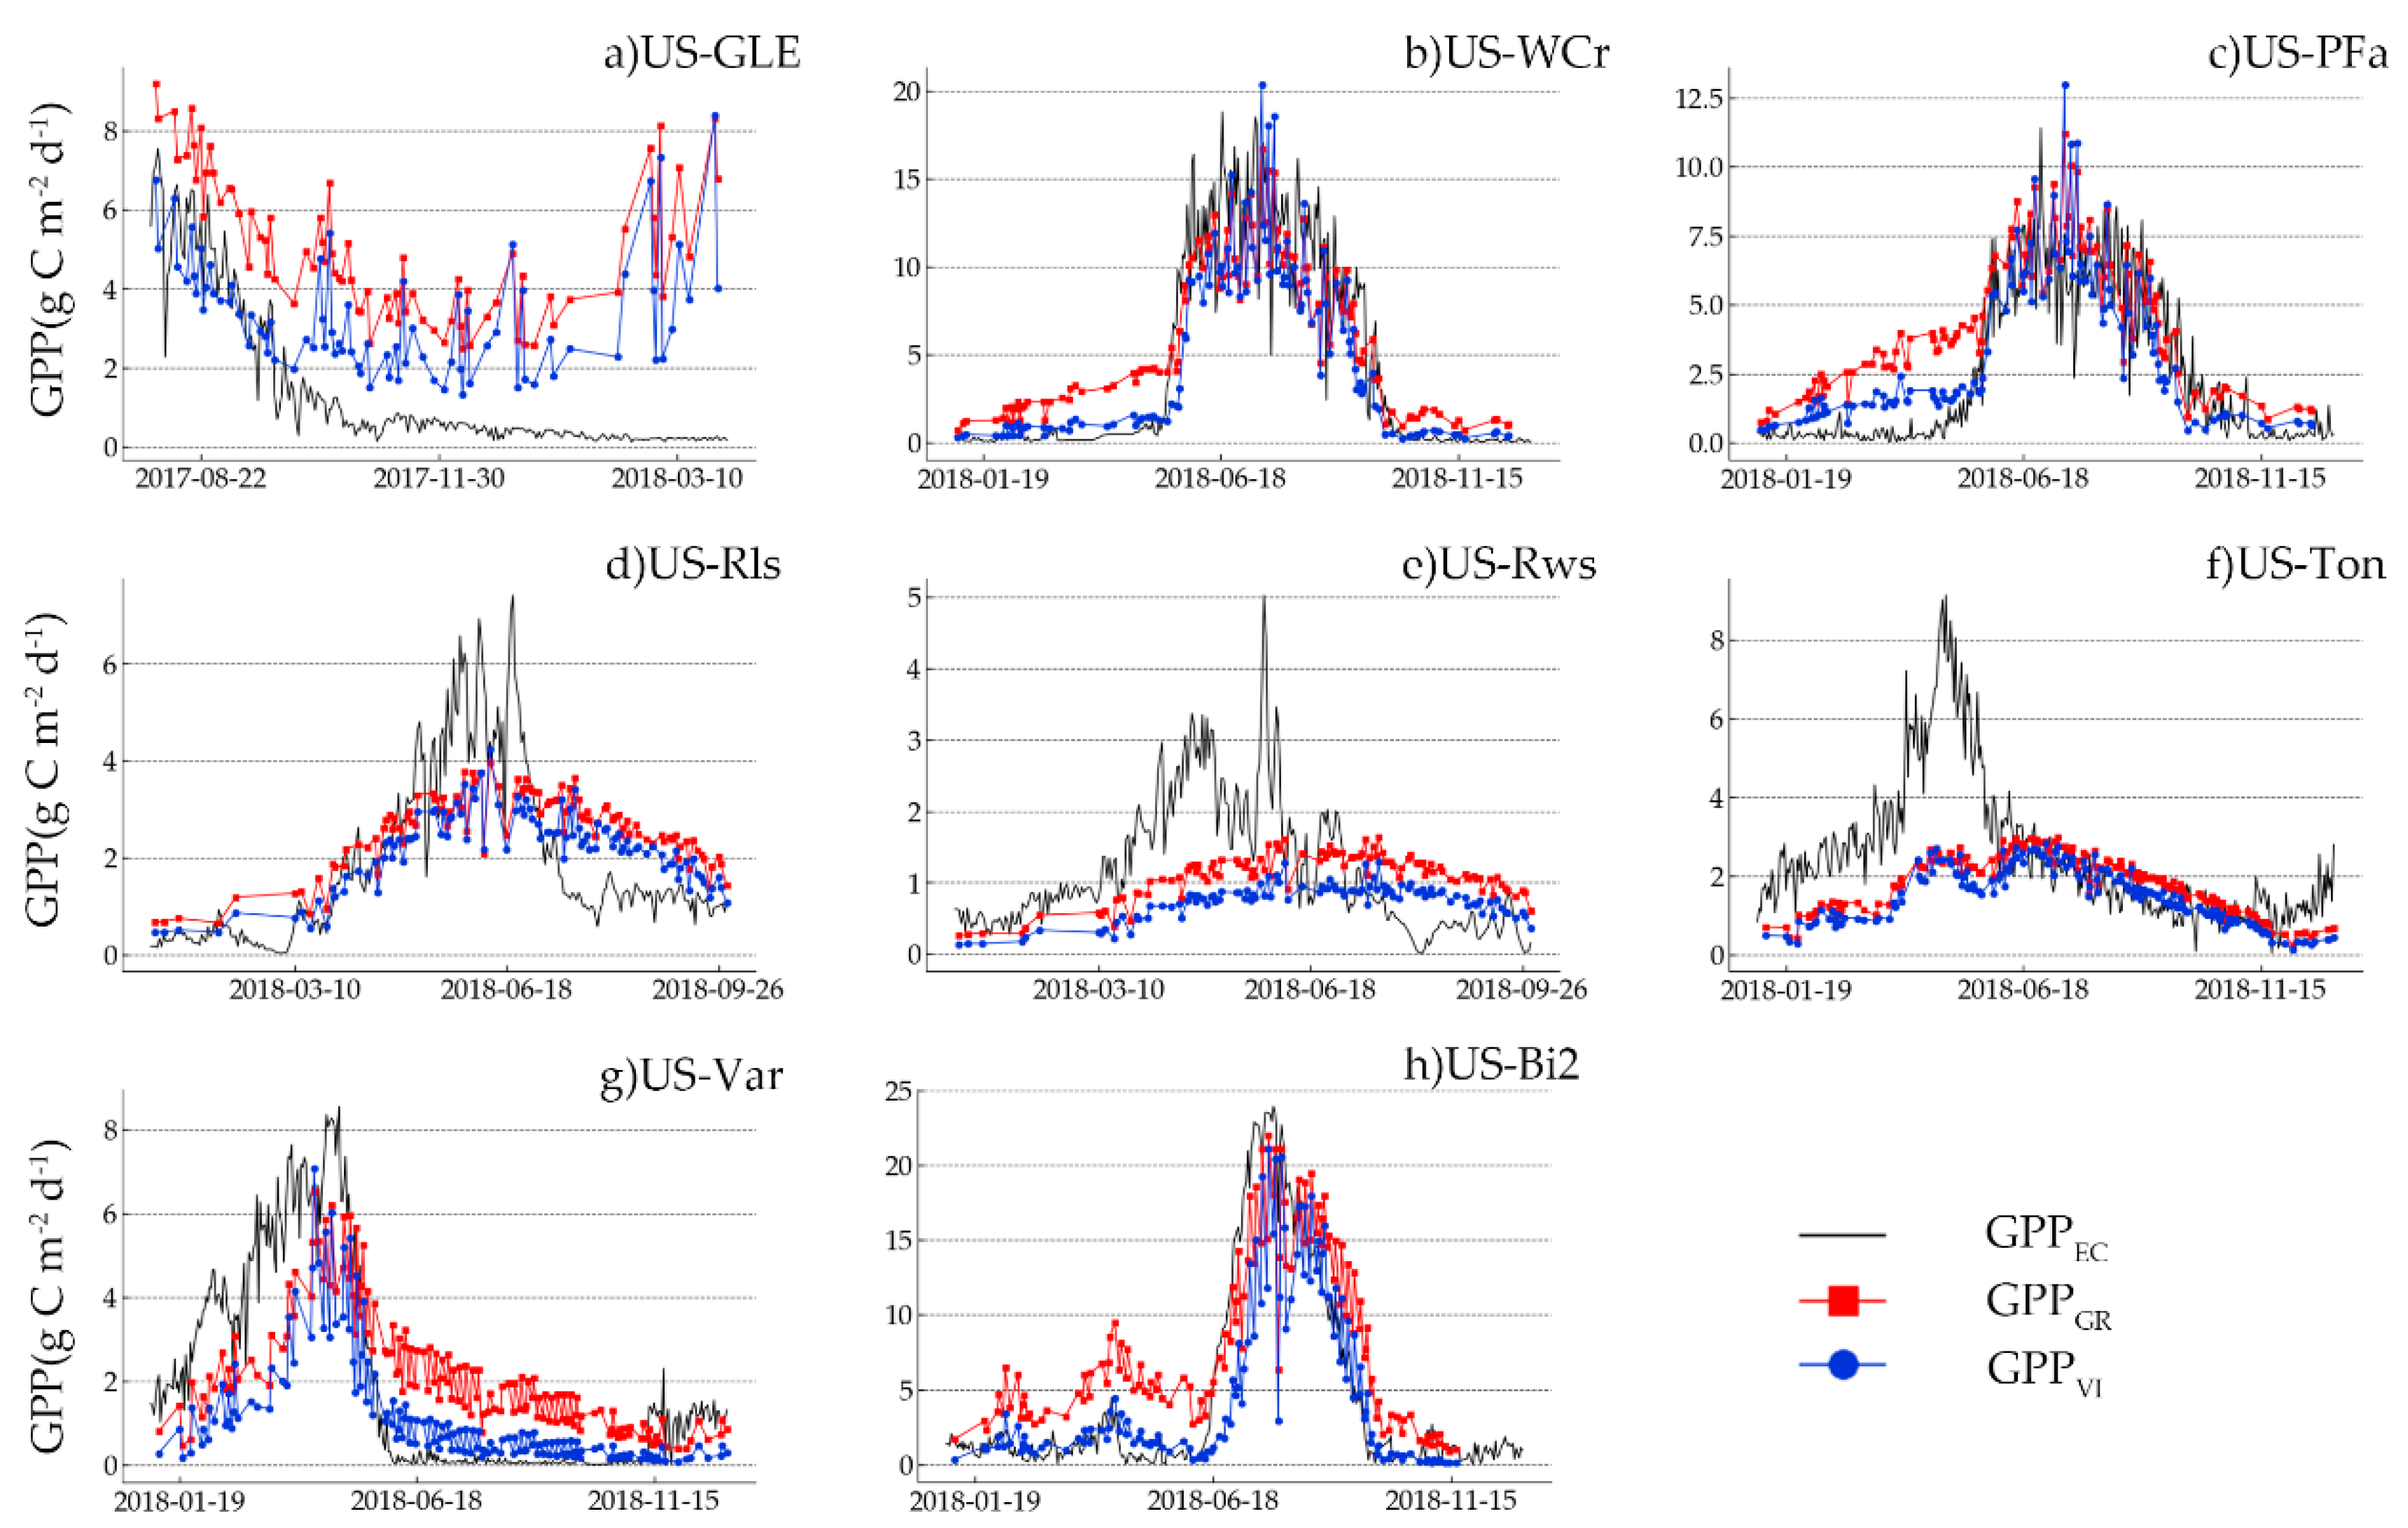
96]. Notably, GPP
GR and GPP
VI had the highest RMSE (4.21 gC/m
2/d and 4.29 gC/m
2/d, respectively) at the US-Bi2 site. The reason for this is that compared with GPP
EC, GPP
GR and GPP
VI overestimated GPP in the nongrowing season and underestimated it in the growing season (
Figure 7h). A previous study demonstrated that OTCI started to increase earlier than the time of corn sowing [
49]. The high GPP
GR and GPP
VI obtained in the nongrowing season may represent fallow land, which is gradually colonized by weed species or affected by humidity changes, and not represent actual crop growth [
49]. At the US-Var site, the correlation between GPP
VI and GPP
EC (R
2 = 0.66) was better than that between GPP
GR and GPP
EC (R
2 = 0.50). This difference may be related to the vertical and horizontal heterogeneity of grasslands [
49]. C3 annual grasses dominated the US-Var site. Previous studies [
49,
97] showed that, compared with grasslands dominated by C4 species, C3 grasslands exhibited lower OTCI values during the peak growth period, explaining why GPP
VI had a higher accuracy than GPP
GR. However, GPP
GR and GPP
VI performed poorly in woody savannas and two shrubland sites. The probable reason for this was that the influence of the soil background on the low vegetation coverage at these sites led to the failure of OTCI in tracking GPP [
50].
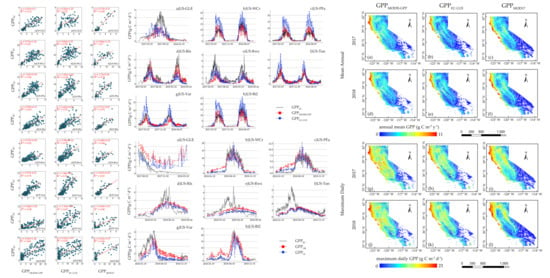
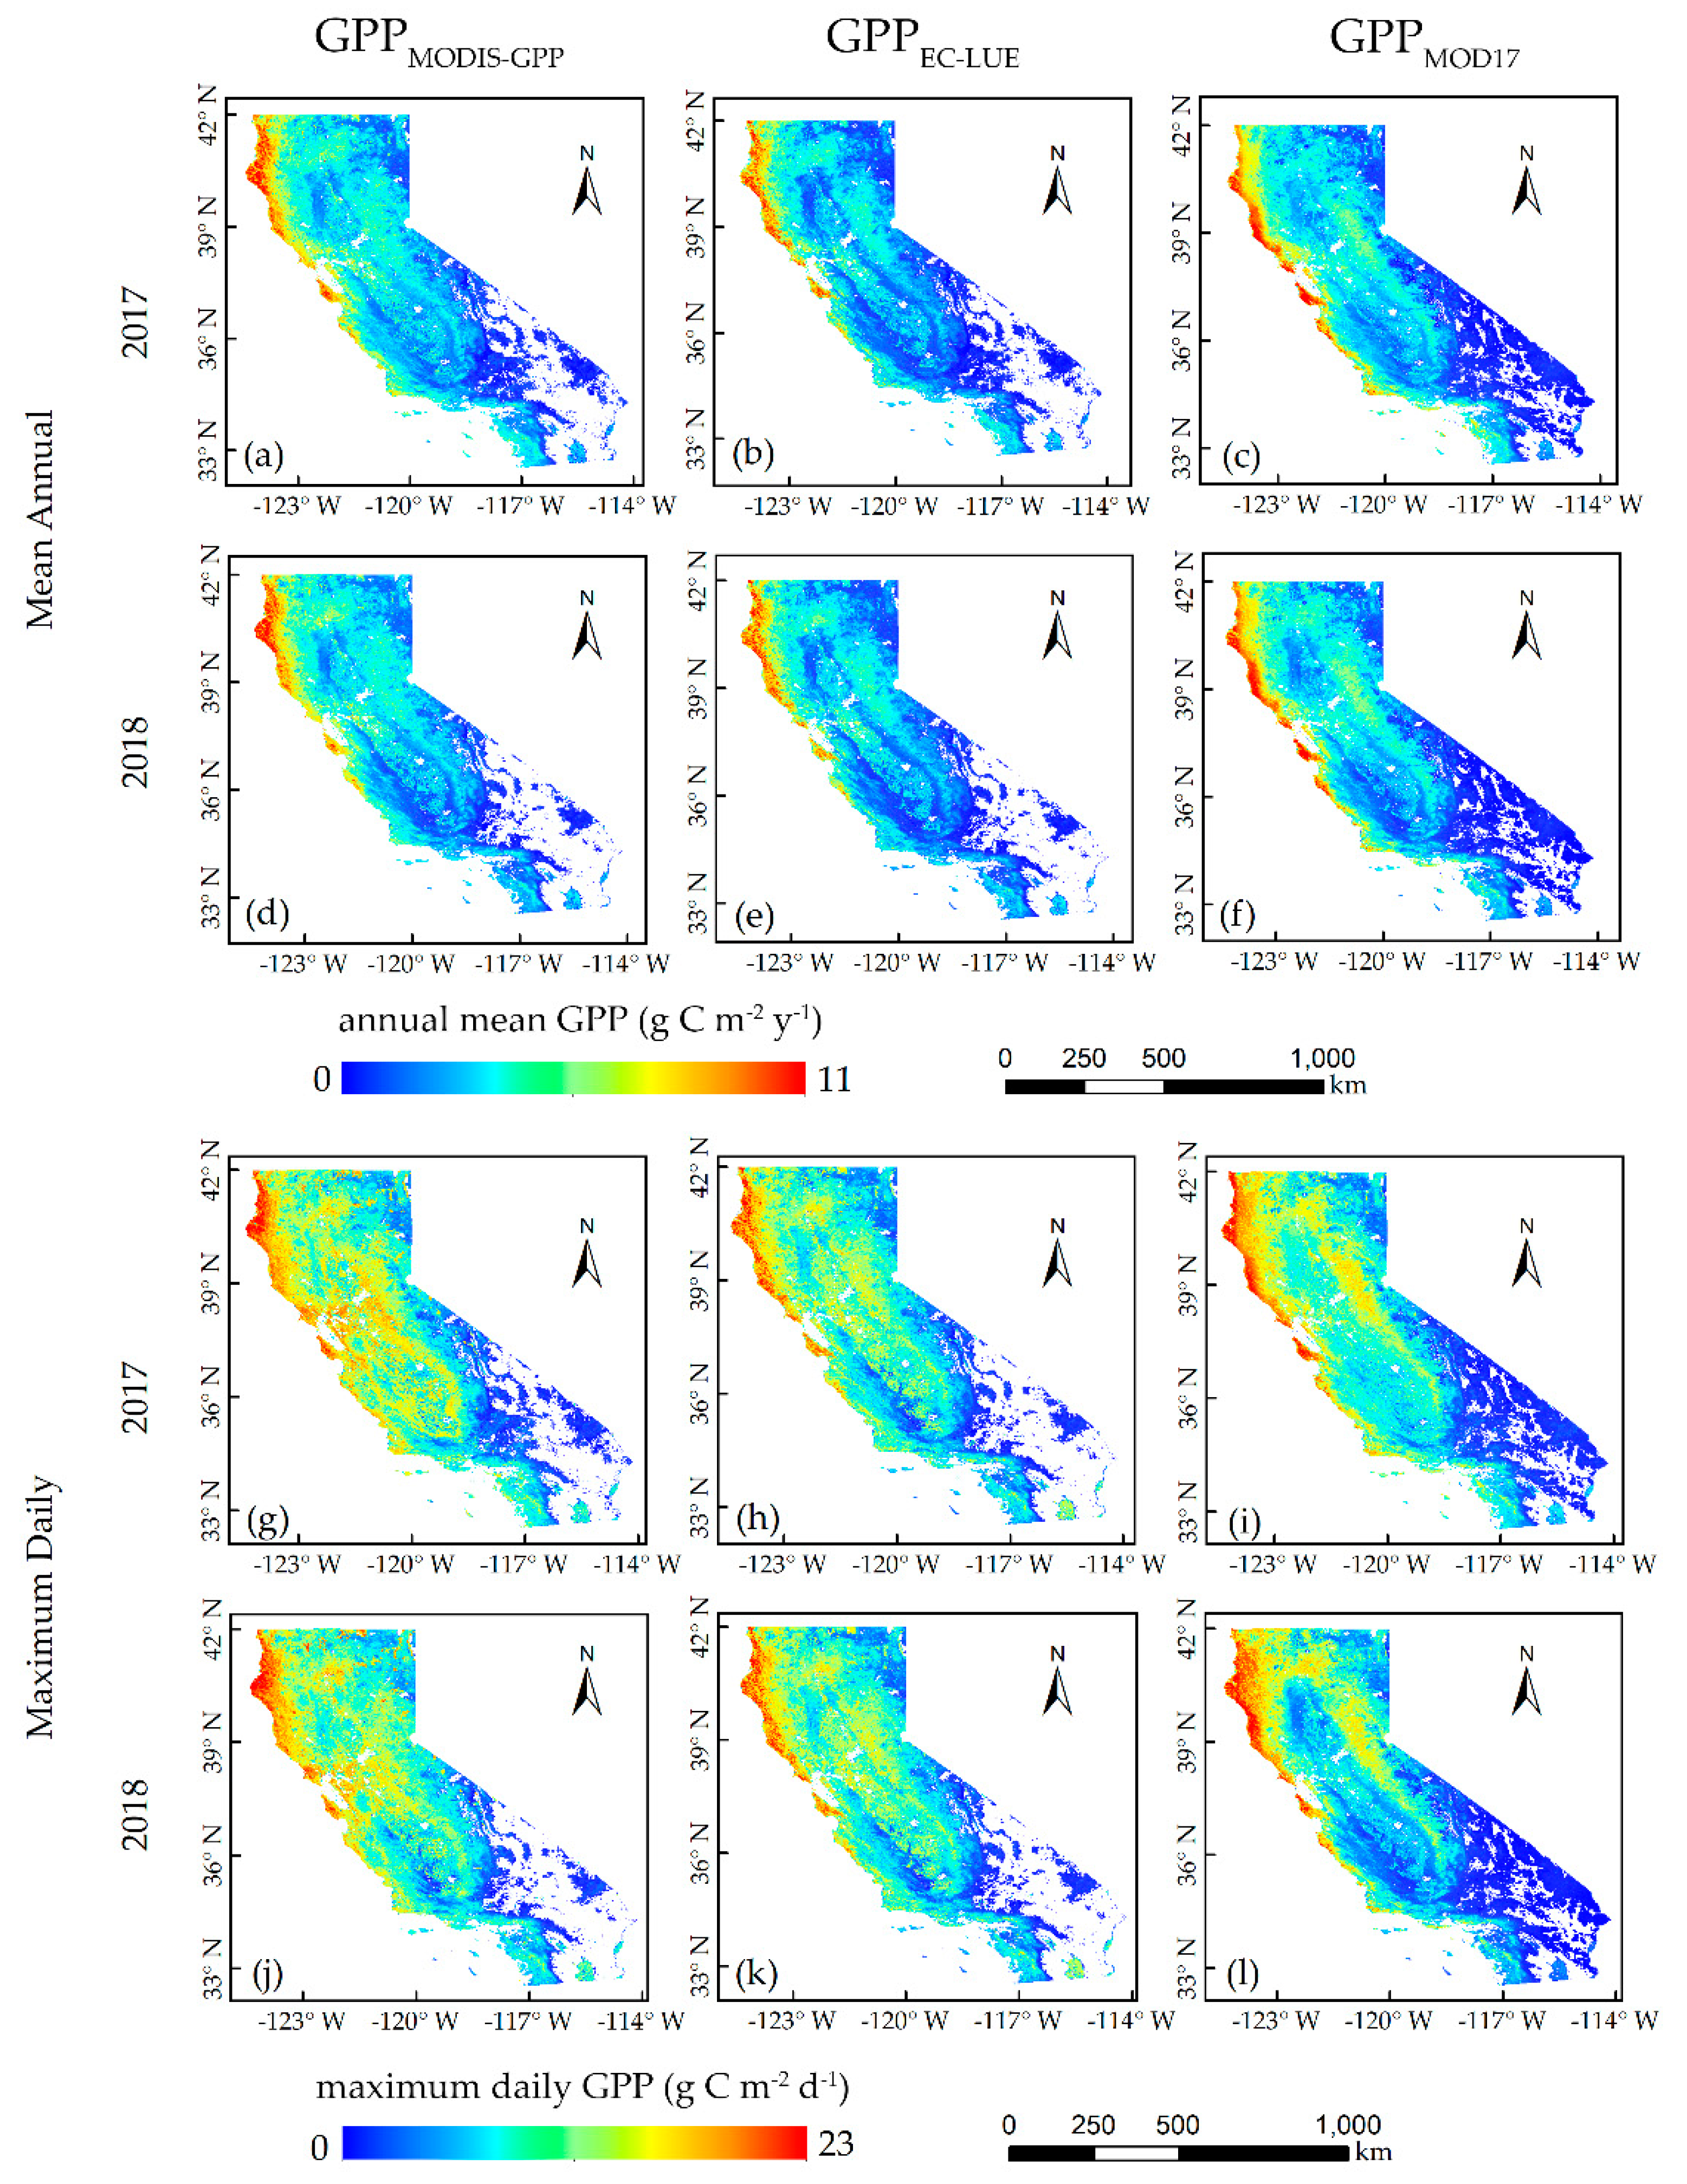
At the regional scale, GPP
MODIS-GPP and GPP
EC-LUE agreed quite well with GPP
MOD17. For the annual mean GPP, GPP
MODIS-GPP and GPP
EC-LUE were relatively high in the western coastal areas, where the biome types were mainly evergreen forests. The low GPP
MODIS-GPP and GPP
EC-LUE were obtained in grasslands. The finding aligned with a previous study [
61], where evergreen forests exhibited strong photosynthesis and open shrublands were the least productive. Forest ecosystems have a relatively higher maximum daily GPP, and open shrublands have the lowest maximum daily GPP compared with other vegetation types. Notably, the maximum daily GPP across grasslands in the northeast was larger than in central areas, and the high sensitivity to soil moisture may be the cause of this phenomenon [
61]. The inconsistency between the annual mean GPP and maximum daily GPP may be mostly due to the influence of temperature and rainfall on the length of the different growing seasons [
61].


