
Accuracy, Bias, and Improvements in Map** Crops and Cropland across the United States Using the USDA Cropland Data Layer


Abstract
:1. Introduction
2. Materials and Methods
2.1. Overview of Assessed and Reference Datasets
2.2. Investigating Effects of Aggregation: Superclass and Consolidated Class Accuracies
2.3. Calculating Nationwide Accuracies
2.4. Map** Spatial Patterns of CDL Accuracy and Confidence
2.5. Estimating Map Biases and Bias-Adjusted Crop Acreages
3. Results
3.1. Nationwide Accuracy of Specific CDL Classes
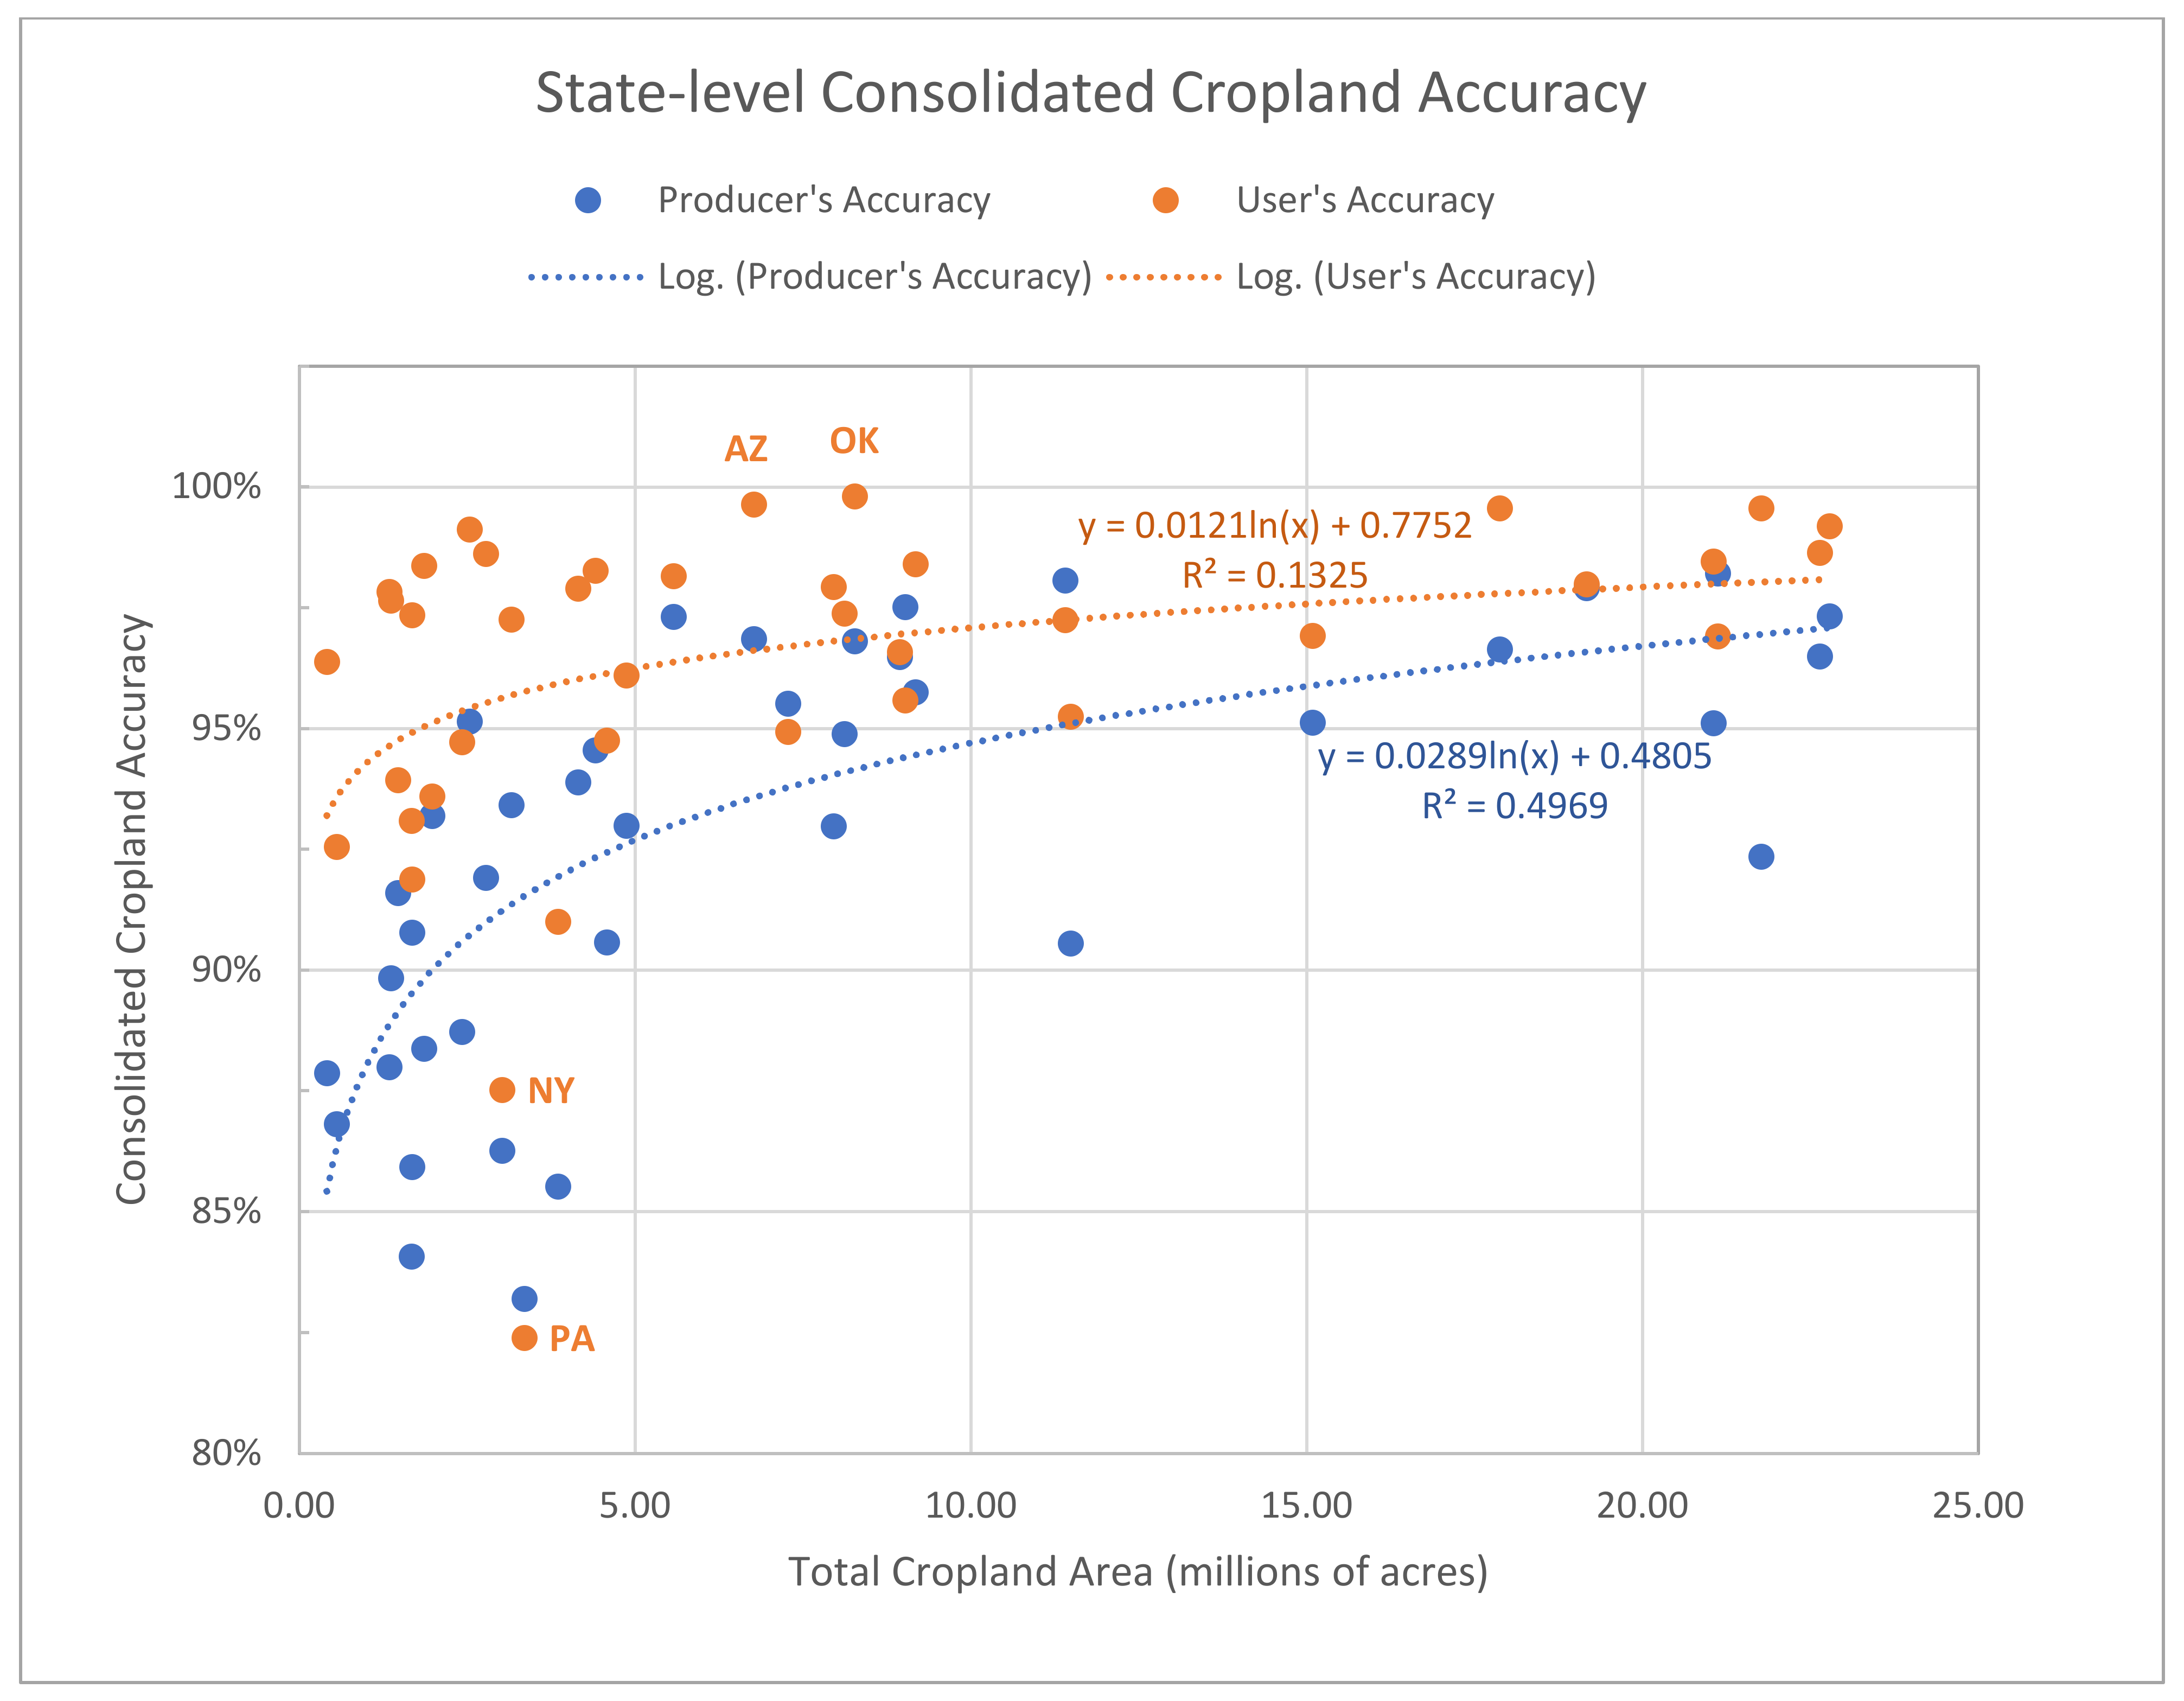
3.2. Consolidated Cropland and Non-Cropland Accuracies
3.3. Superclass Accuracies of Specific Crops and Land Covers
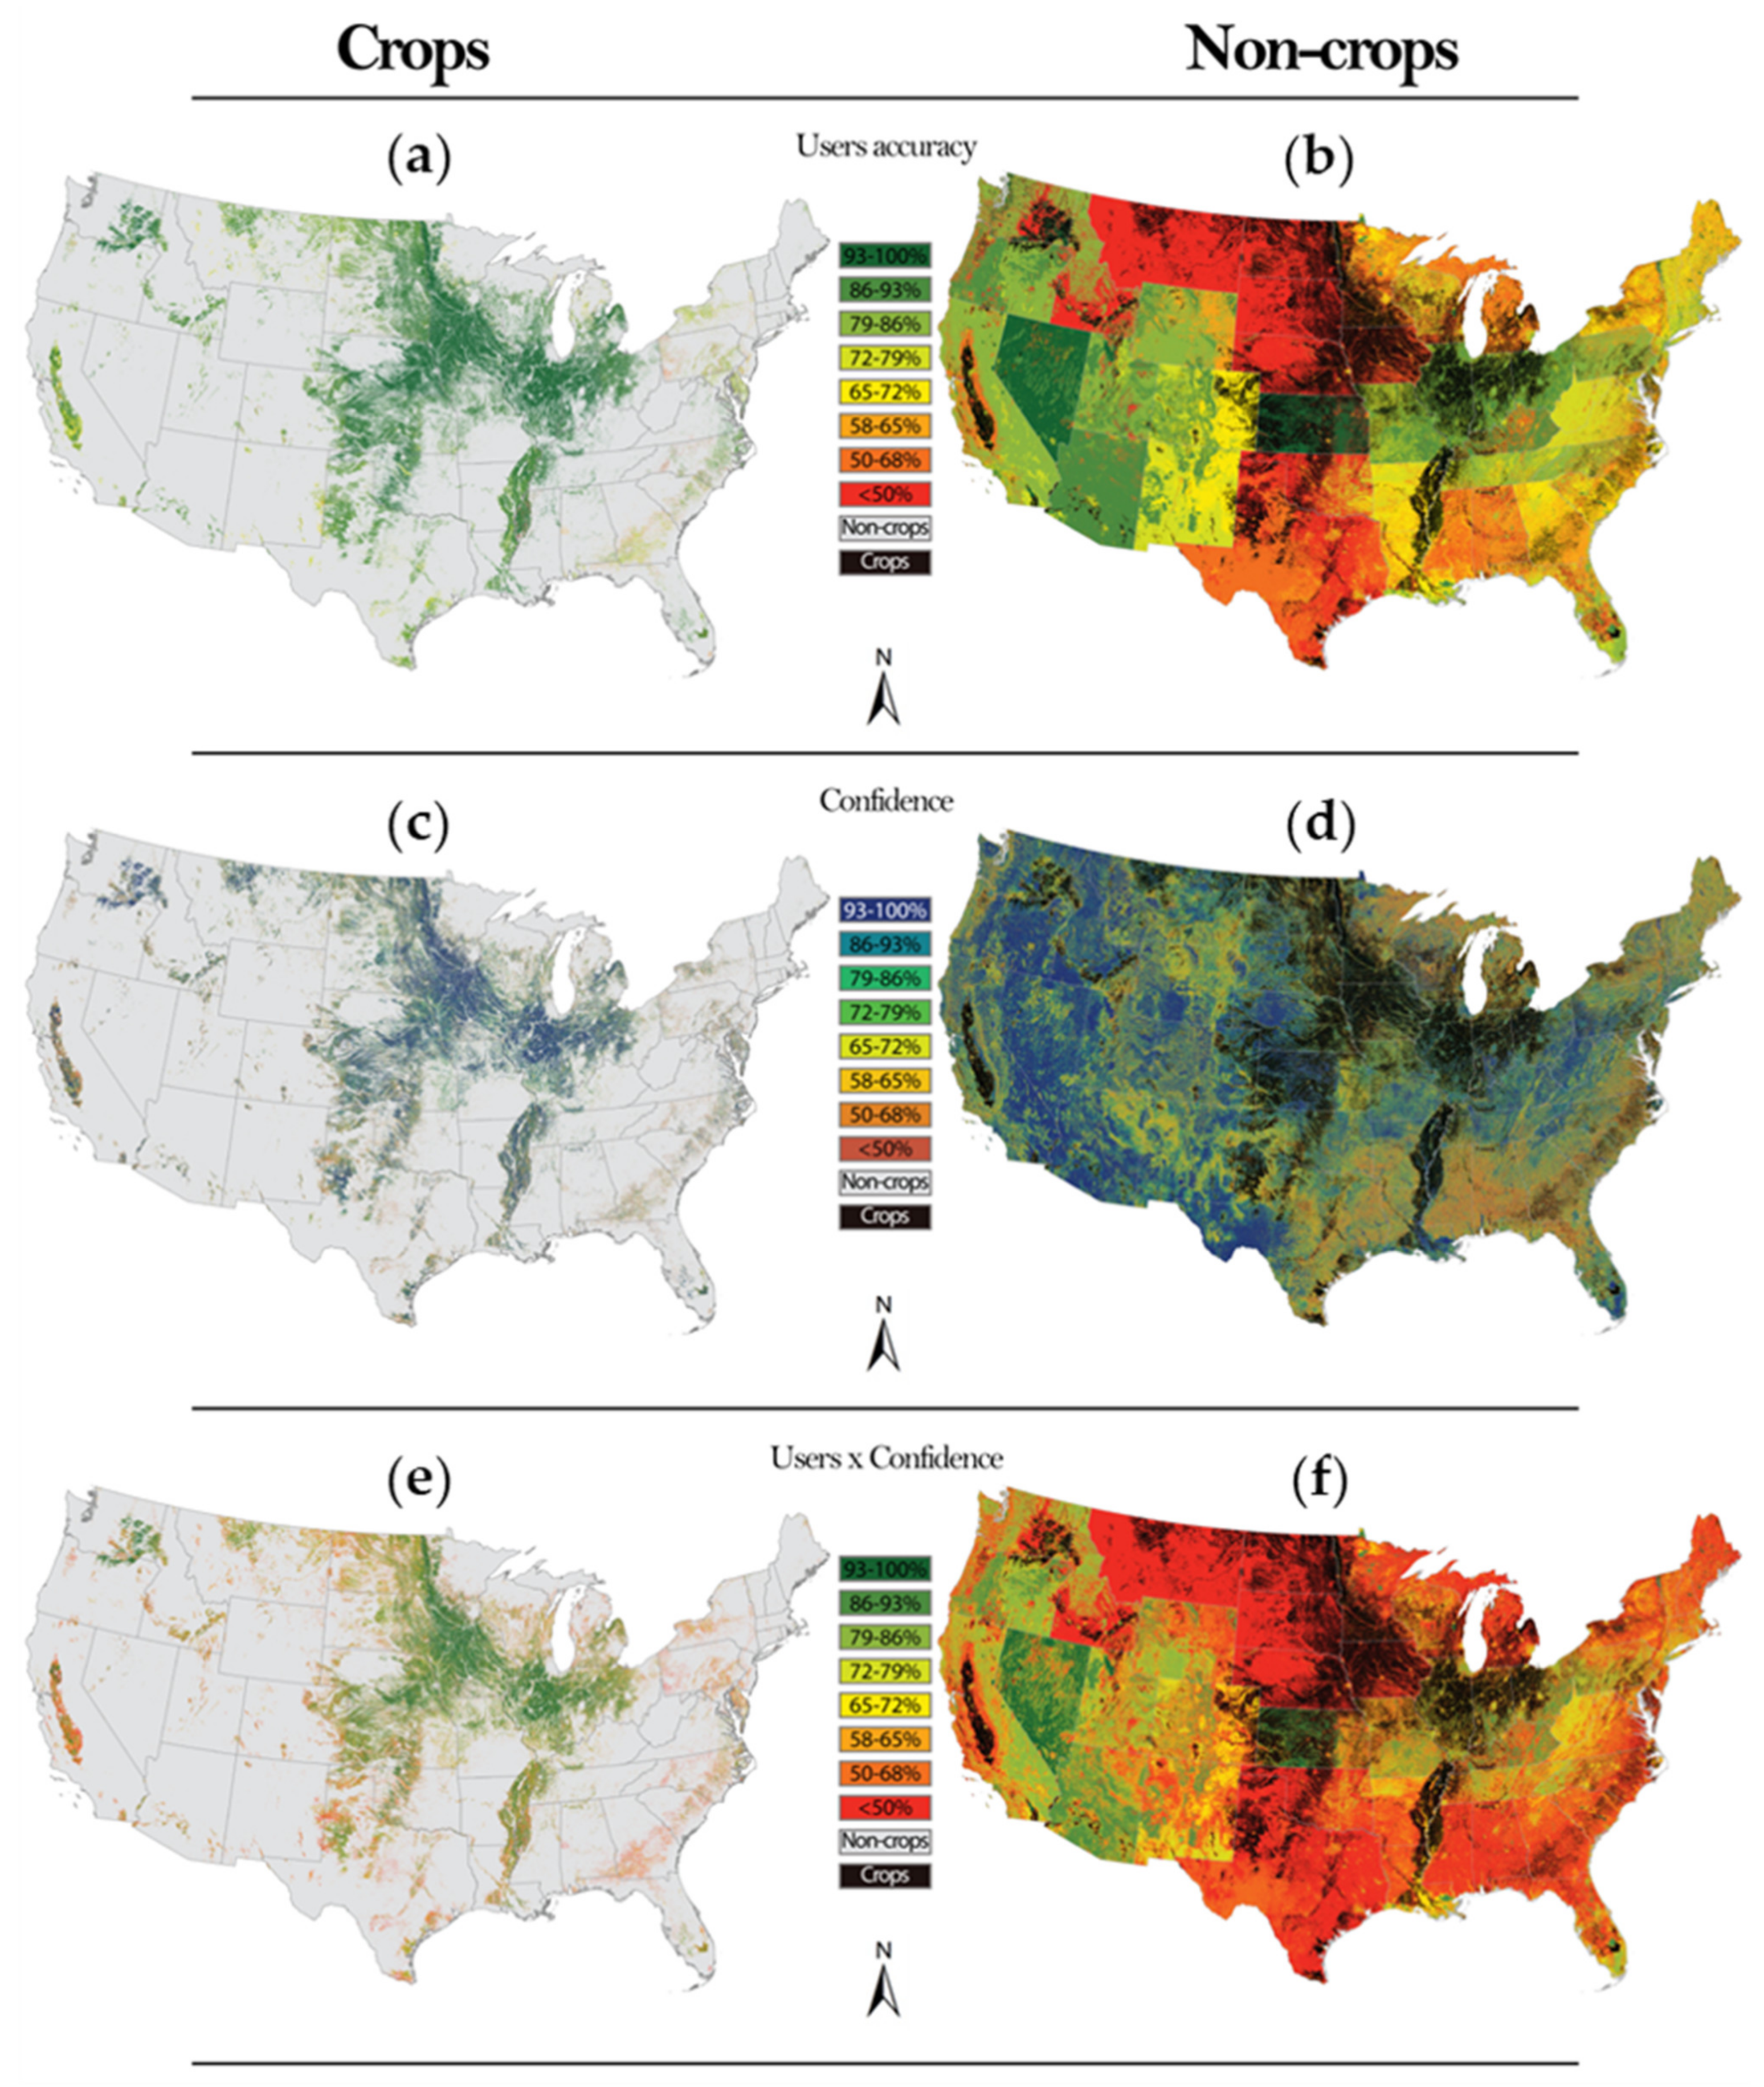
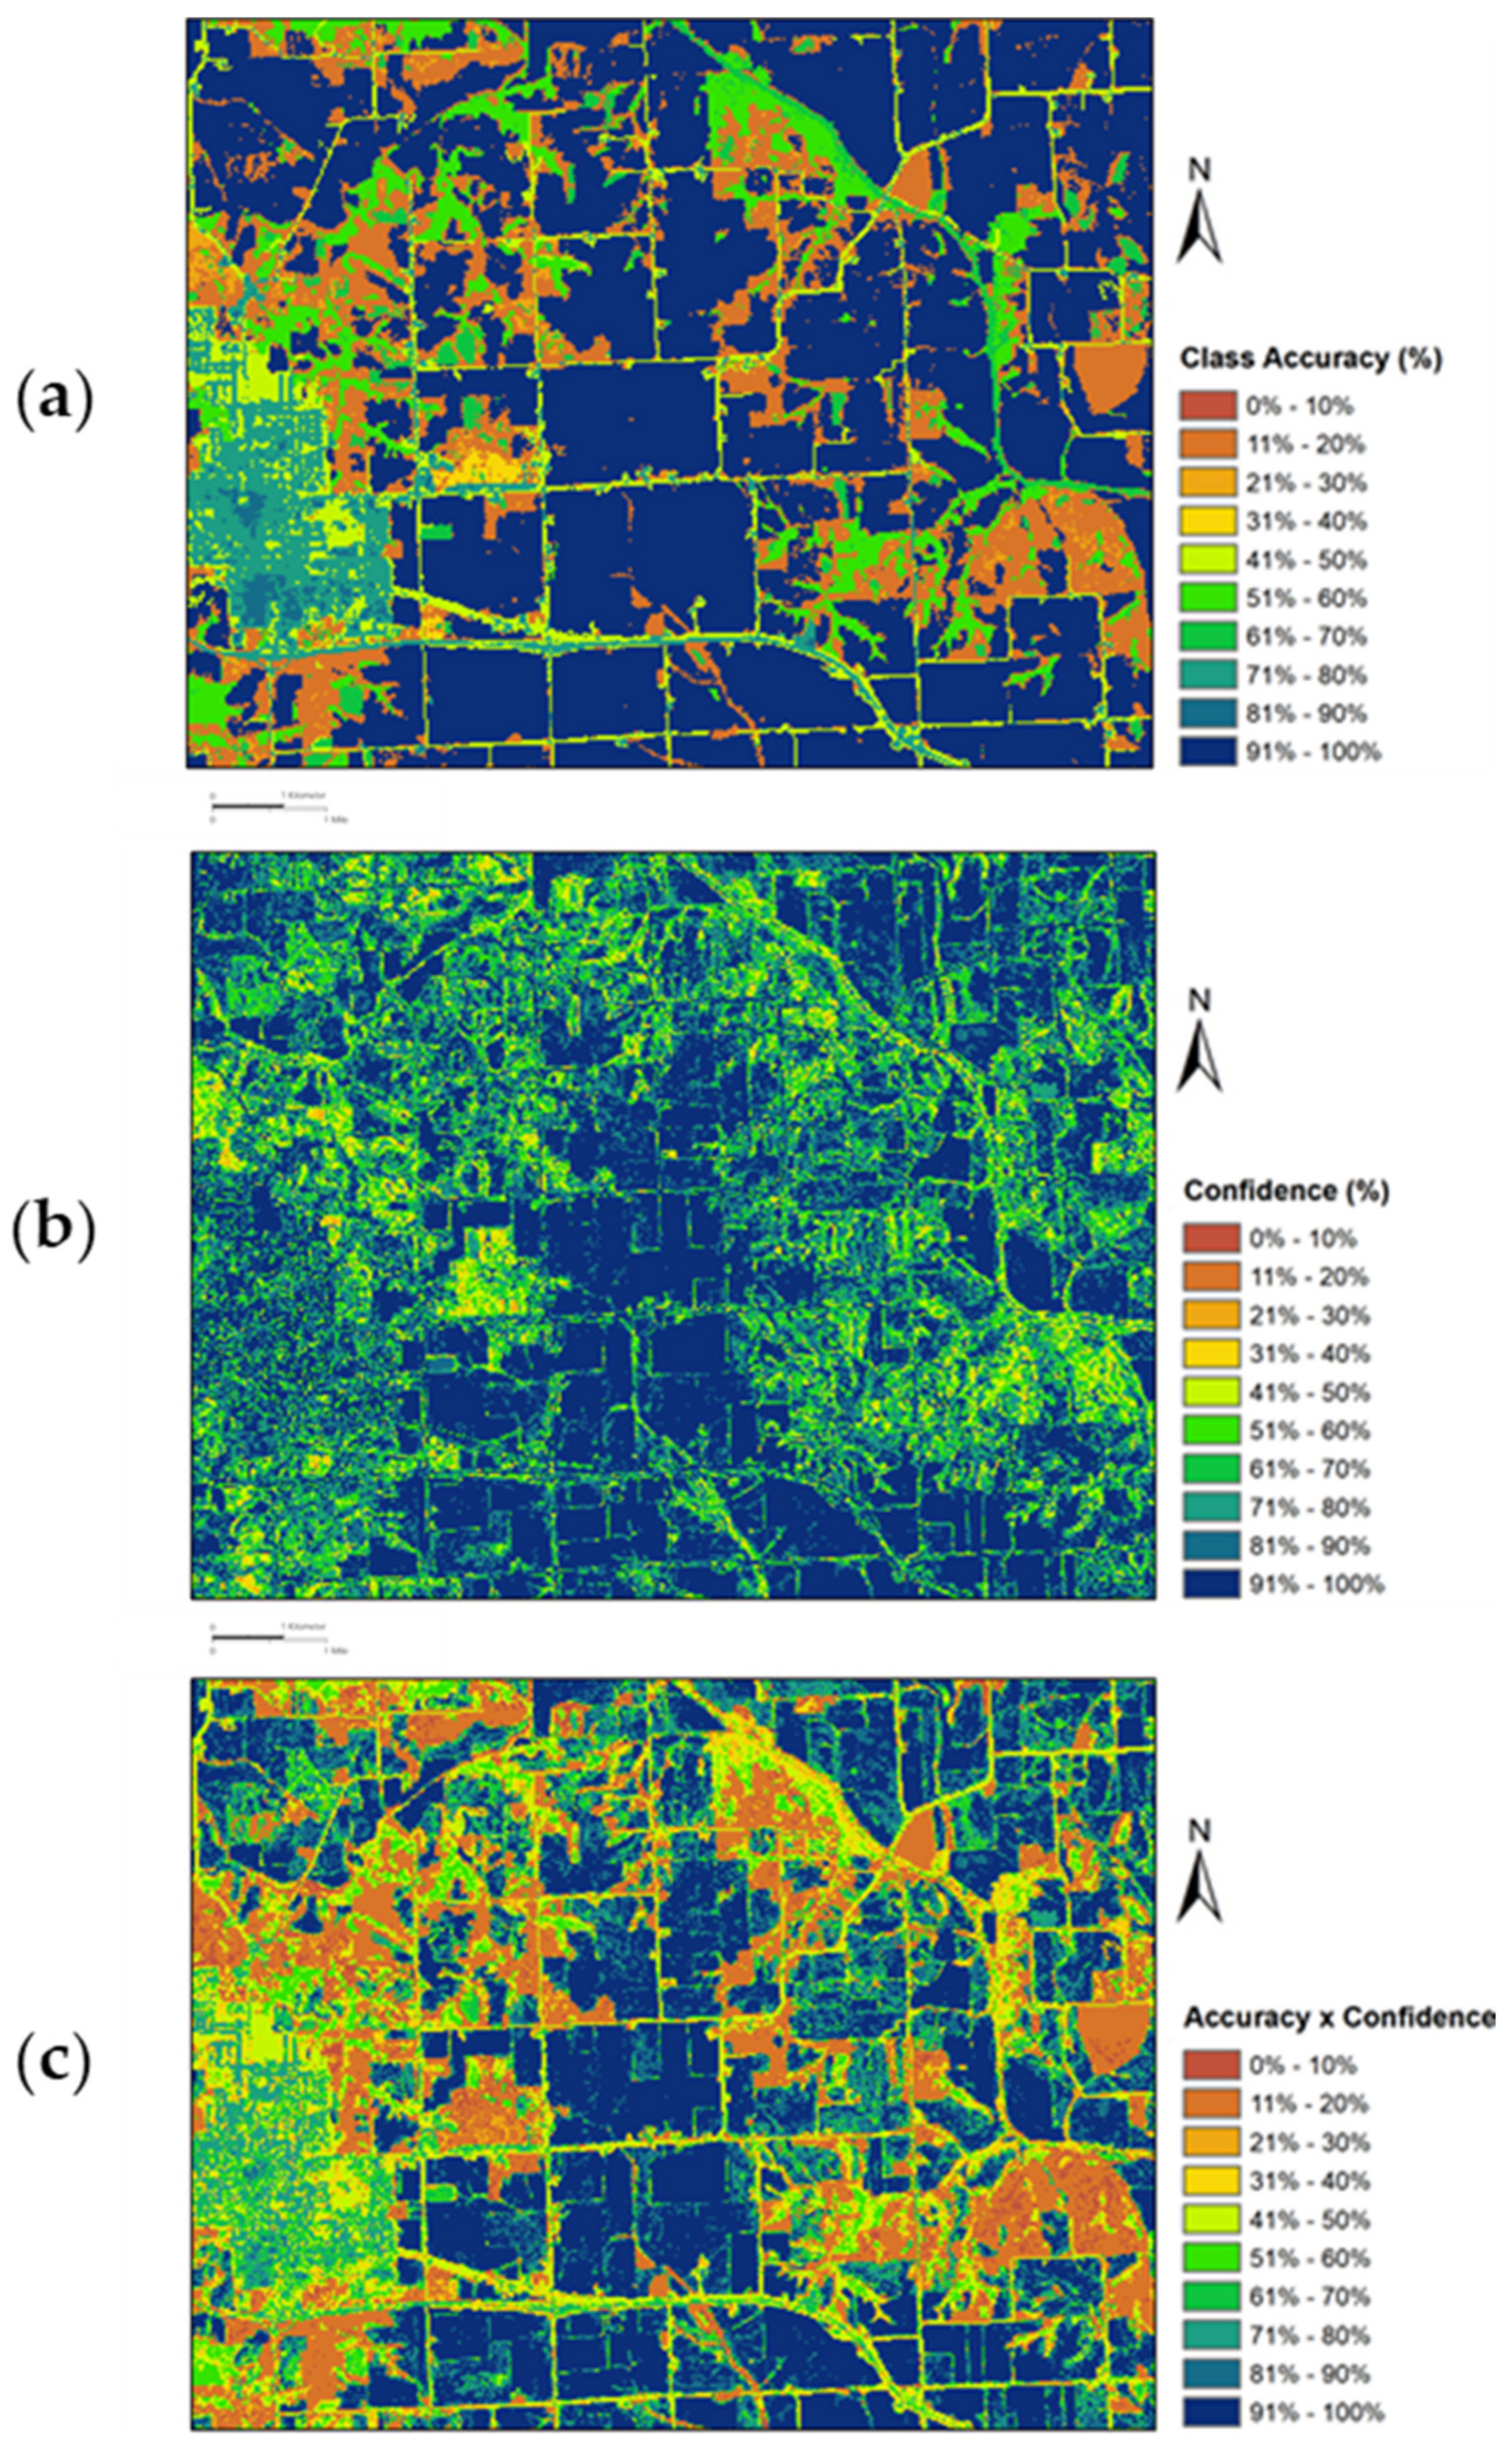
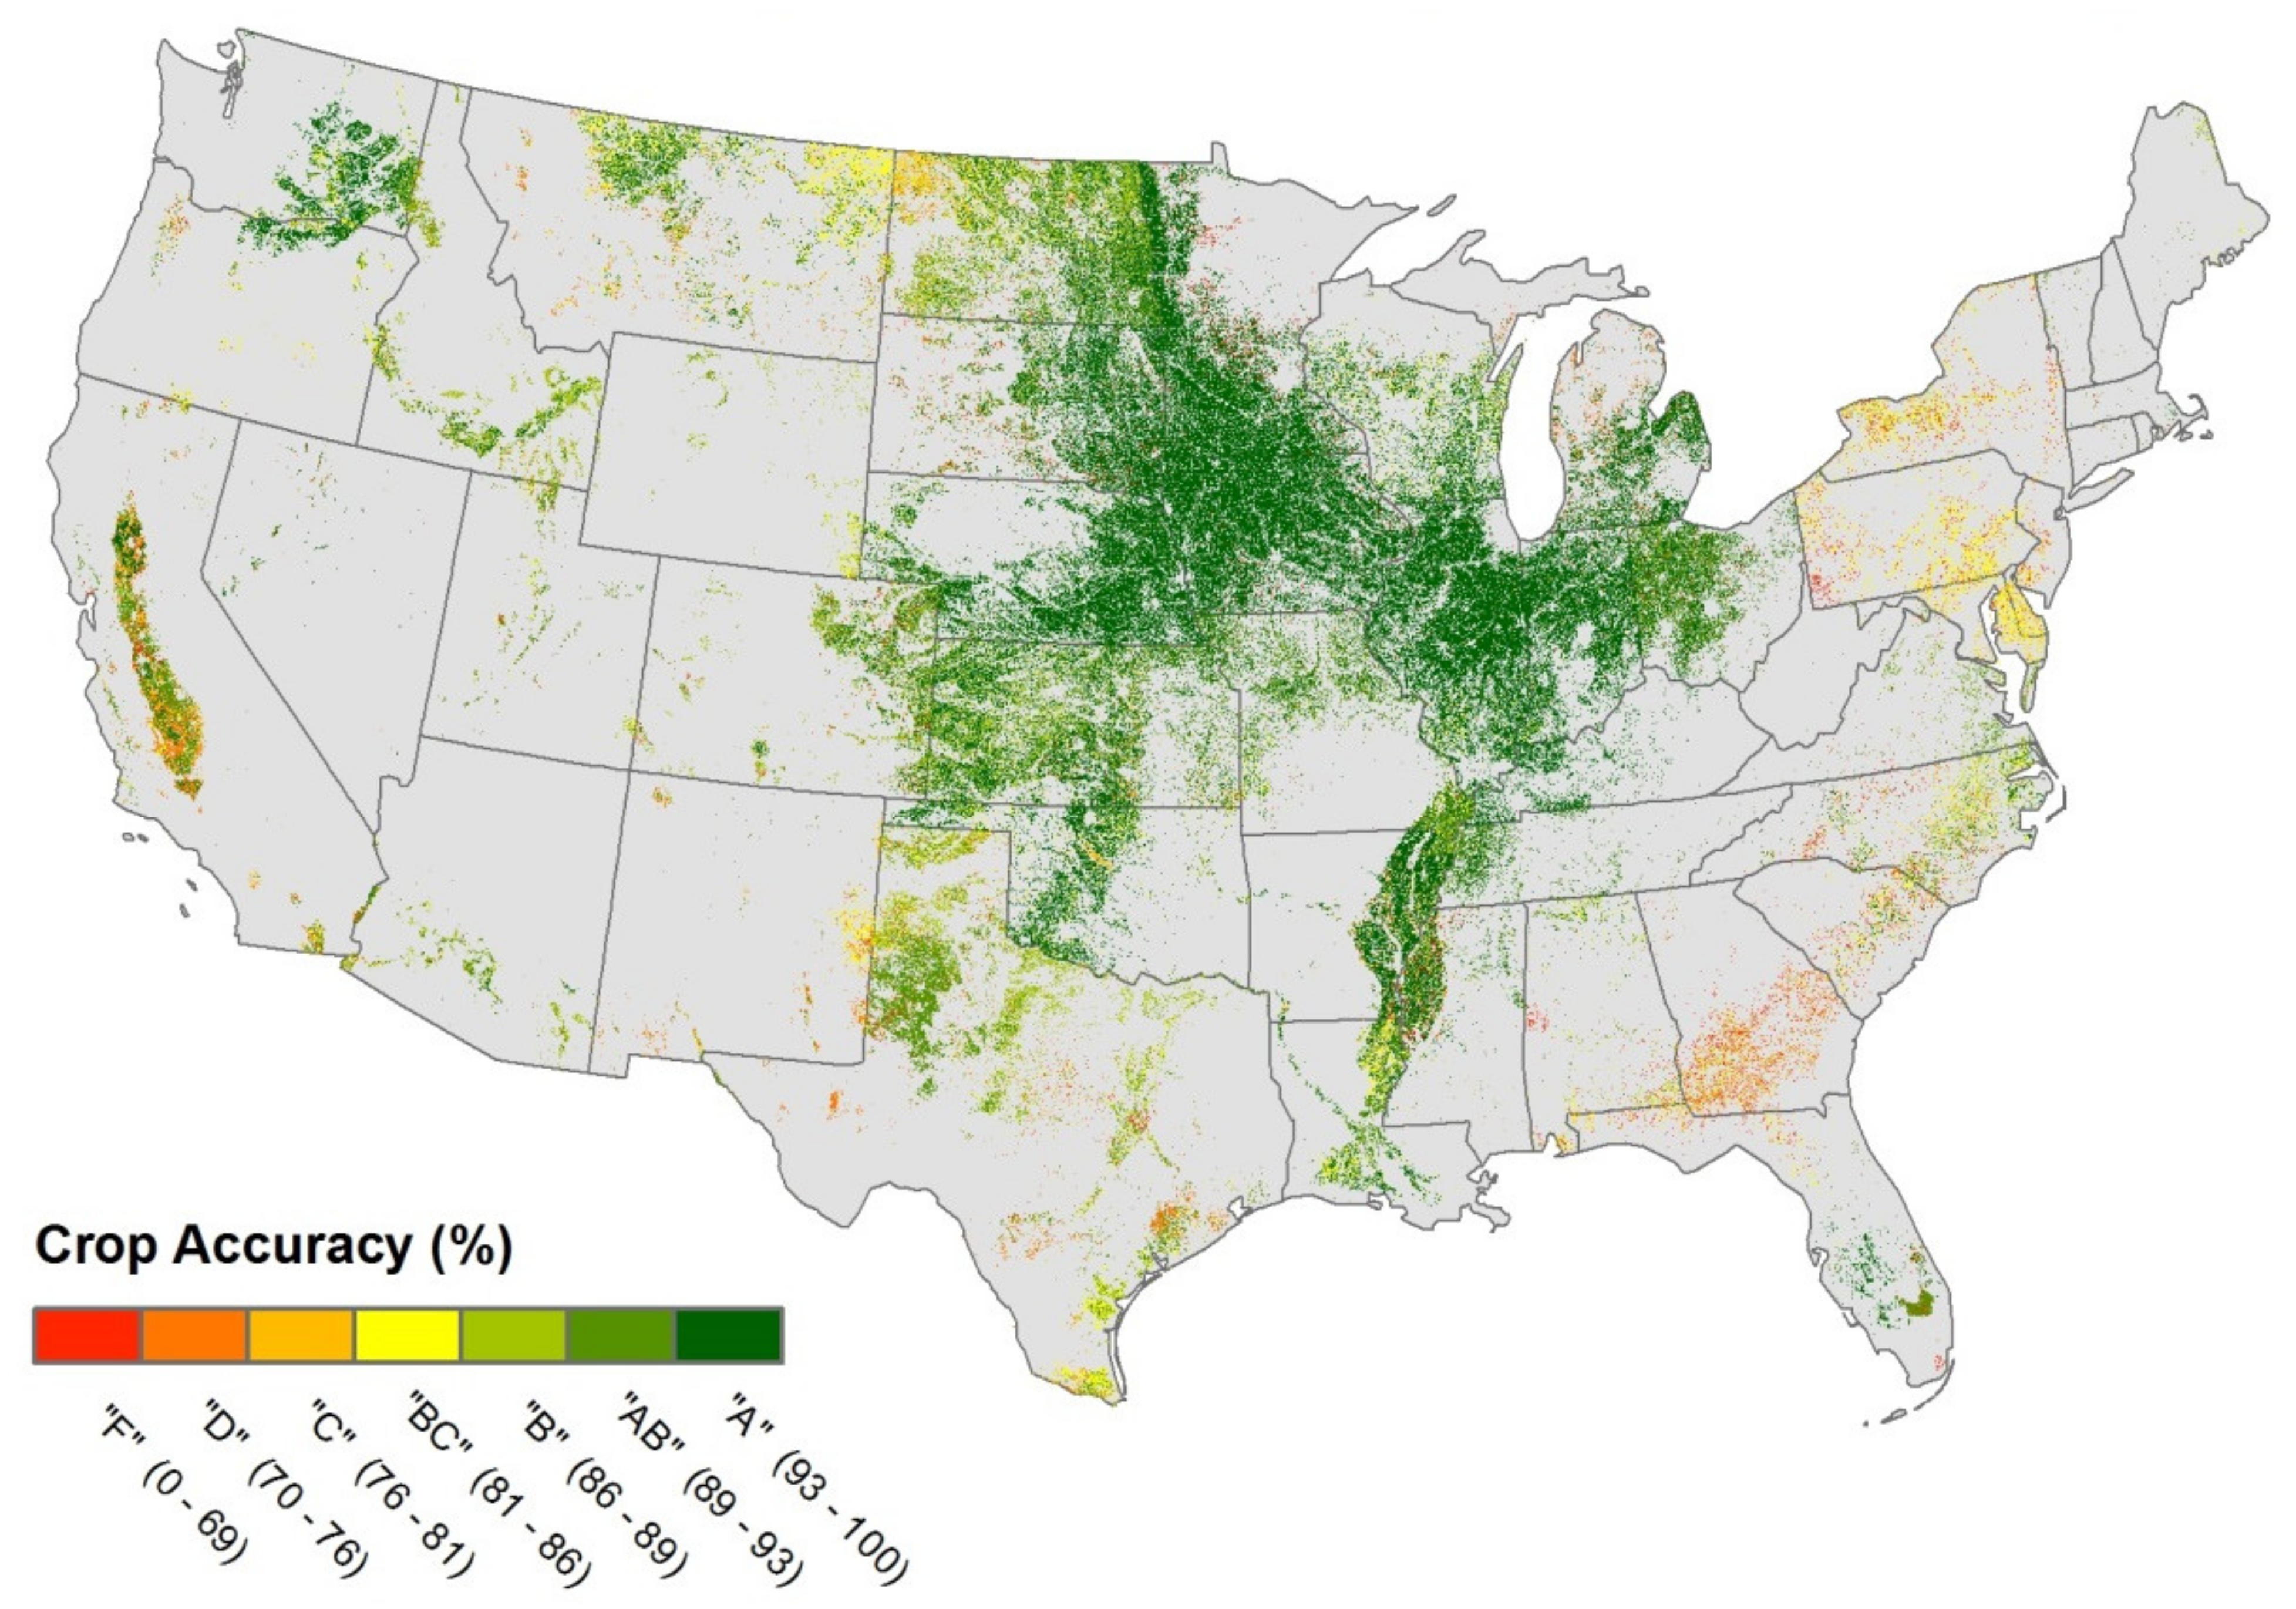
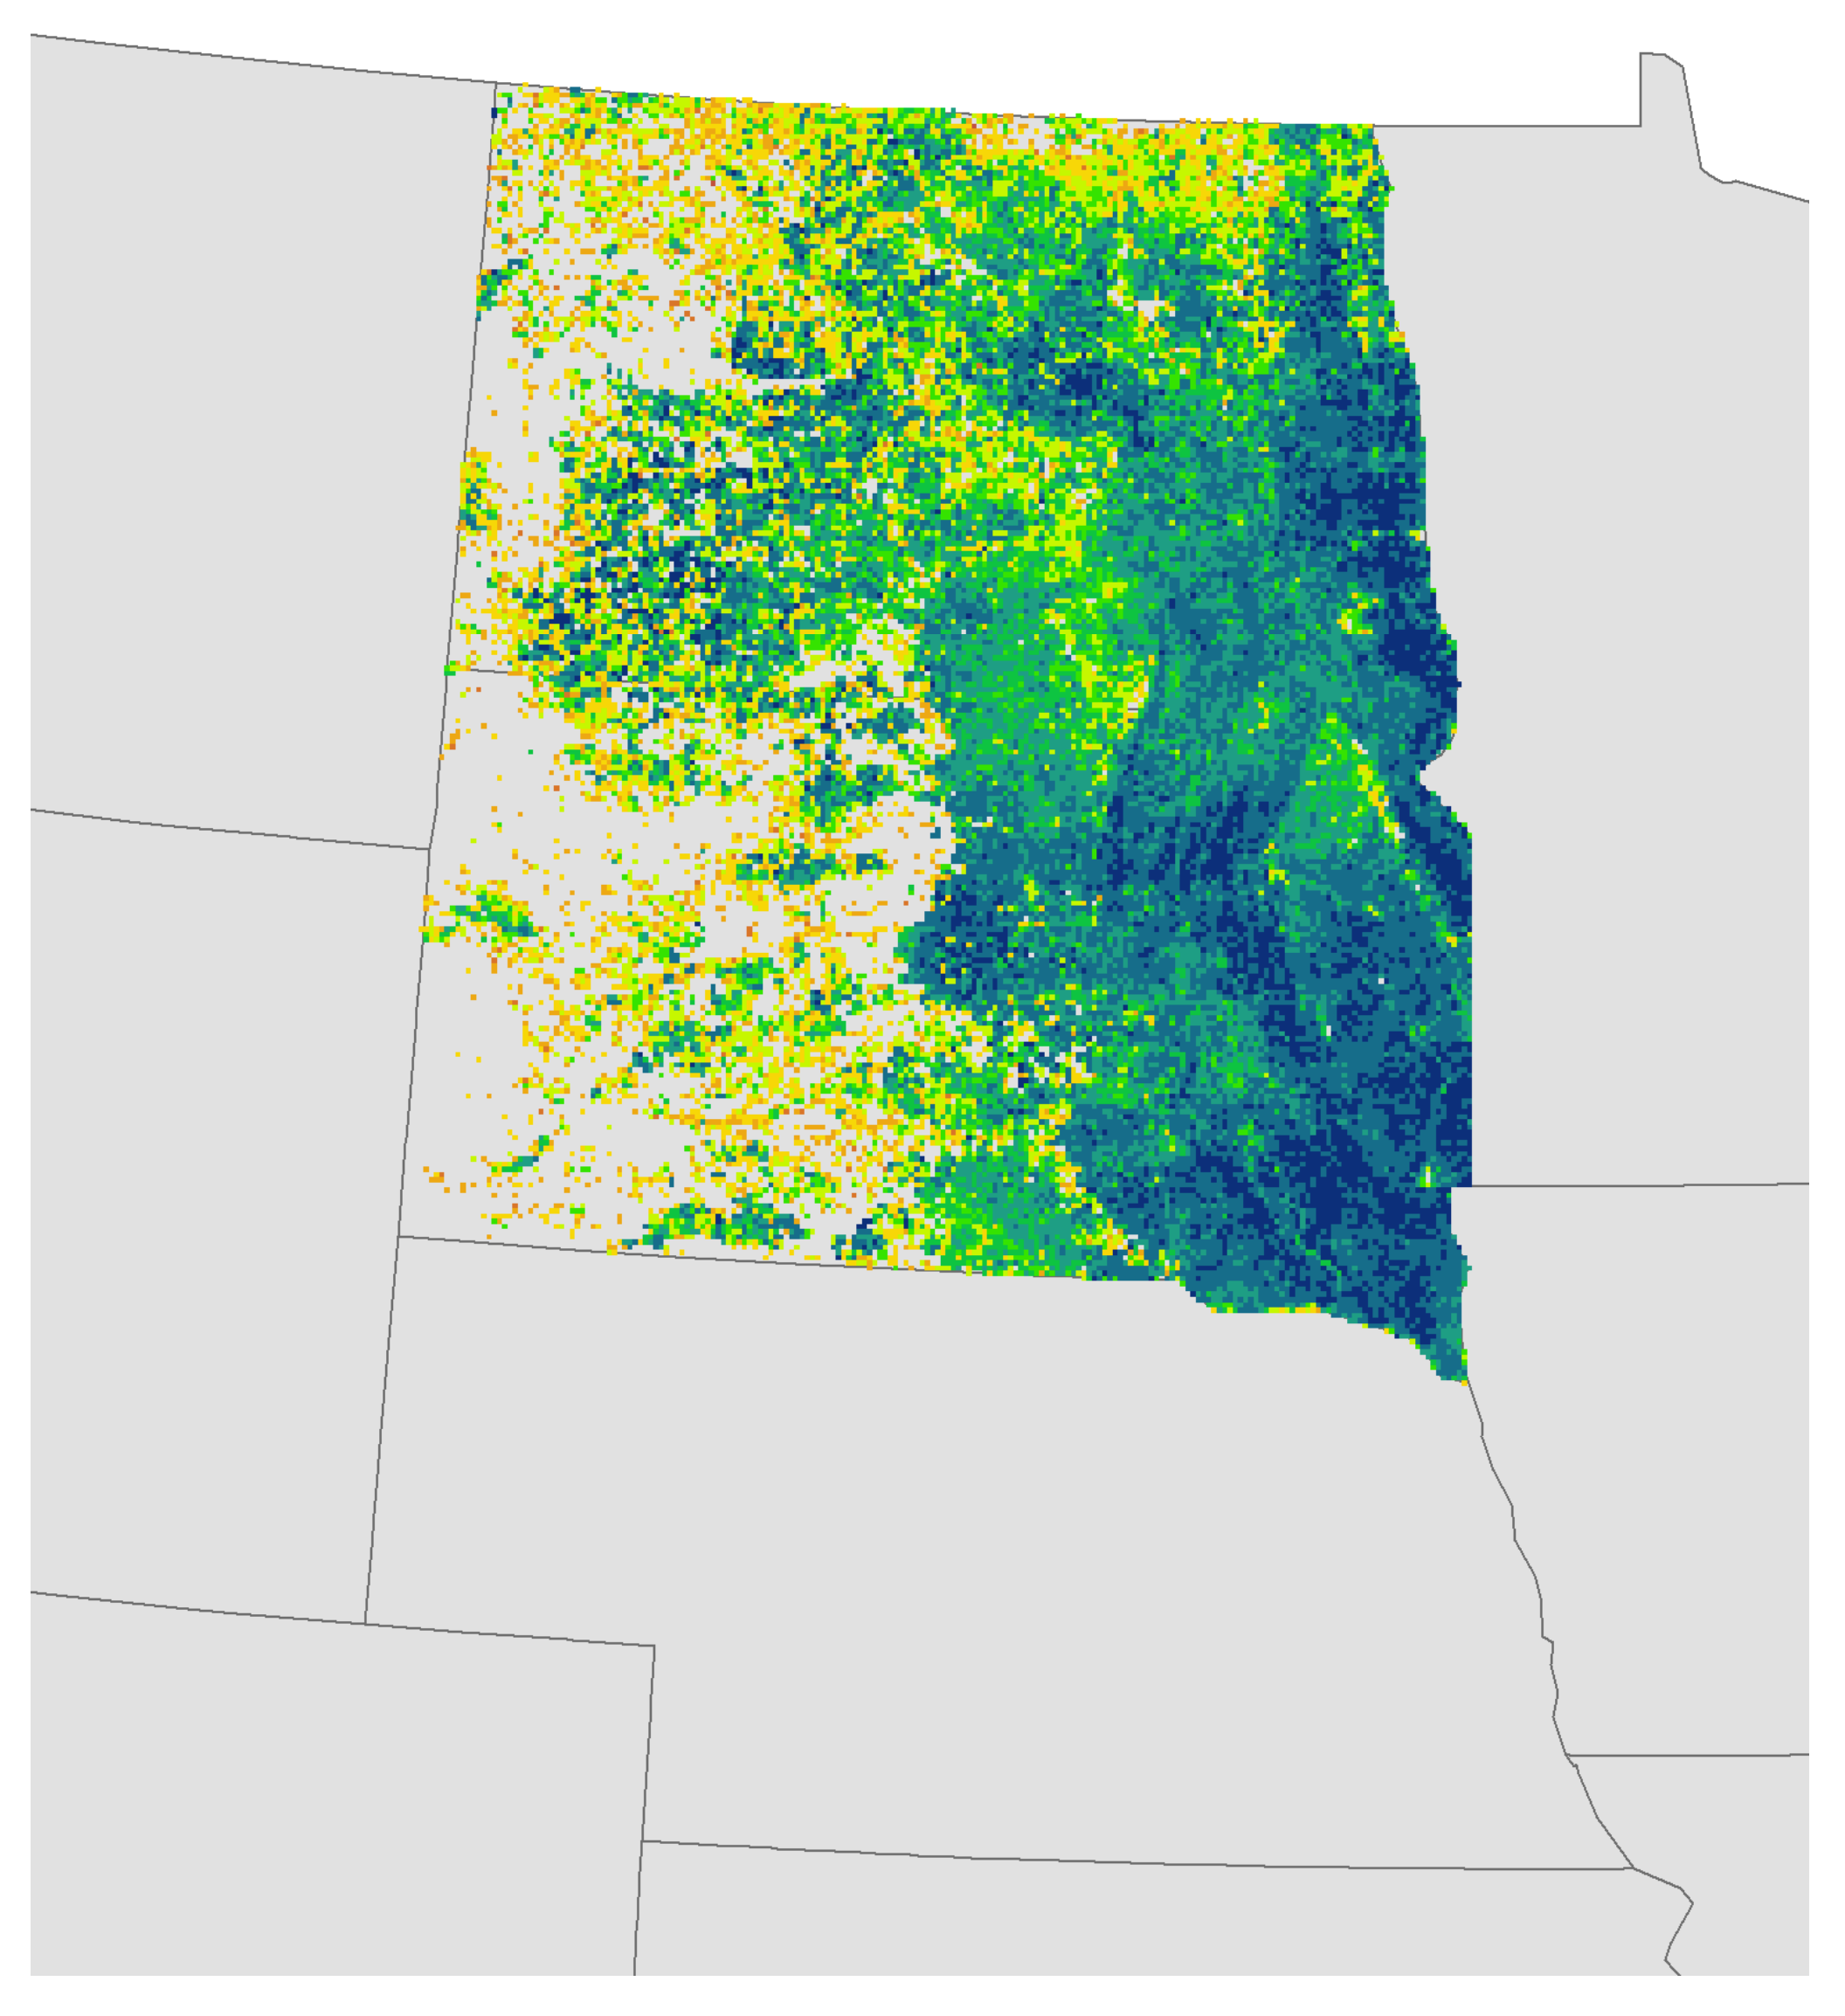
3.4. Spatial Patterns of CDL Accuracy, Confidence, and Certainty
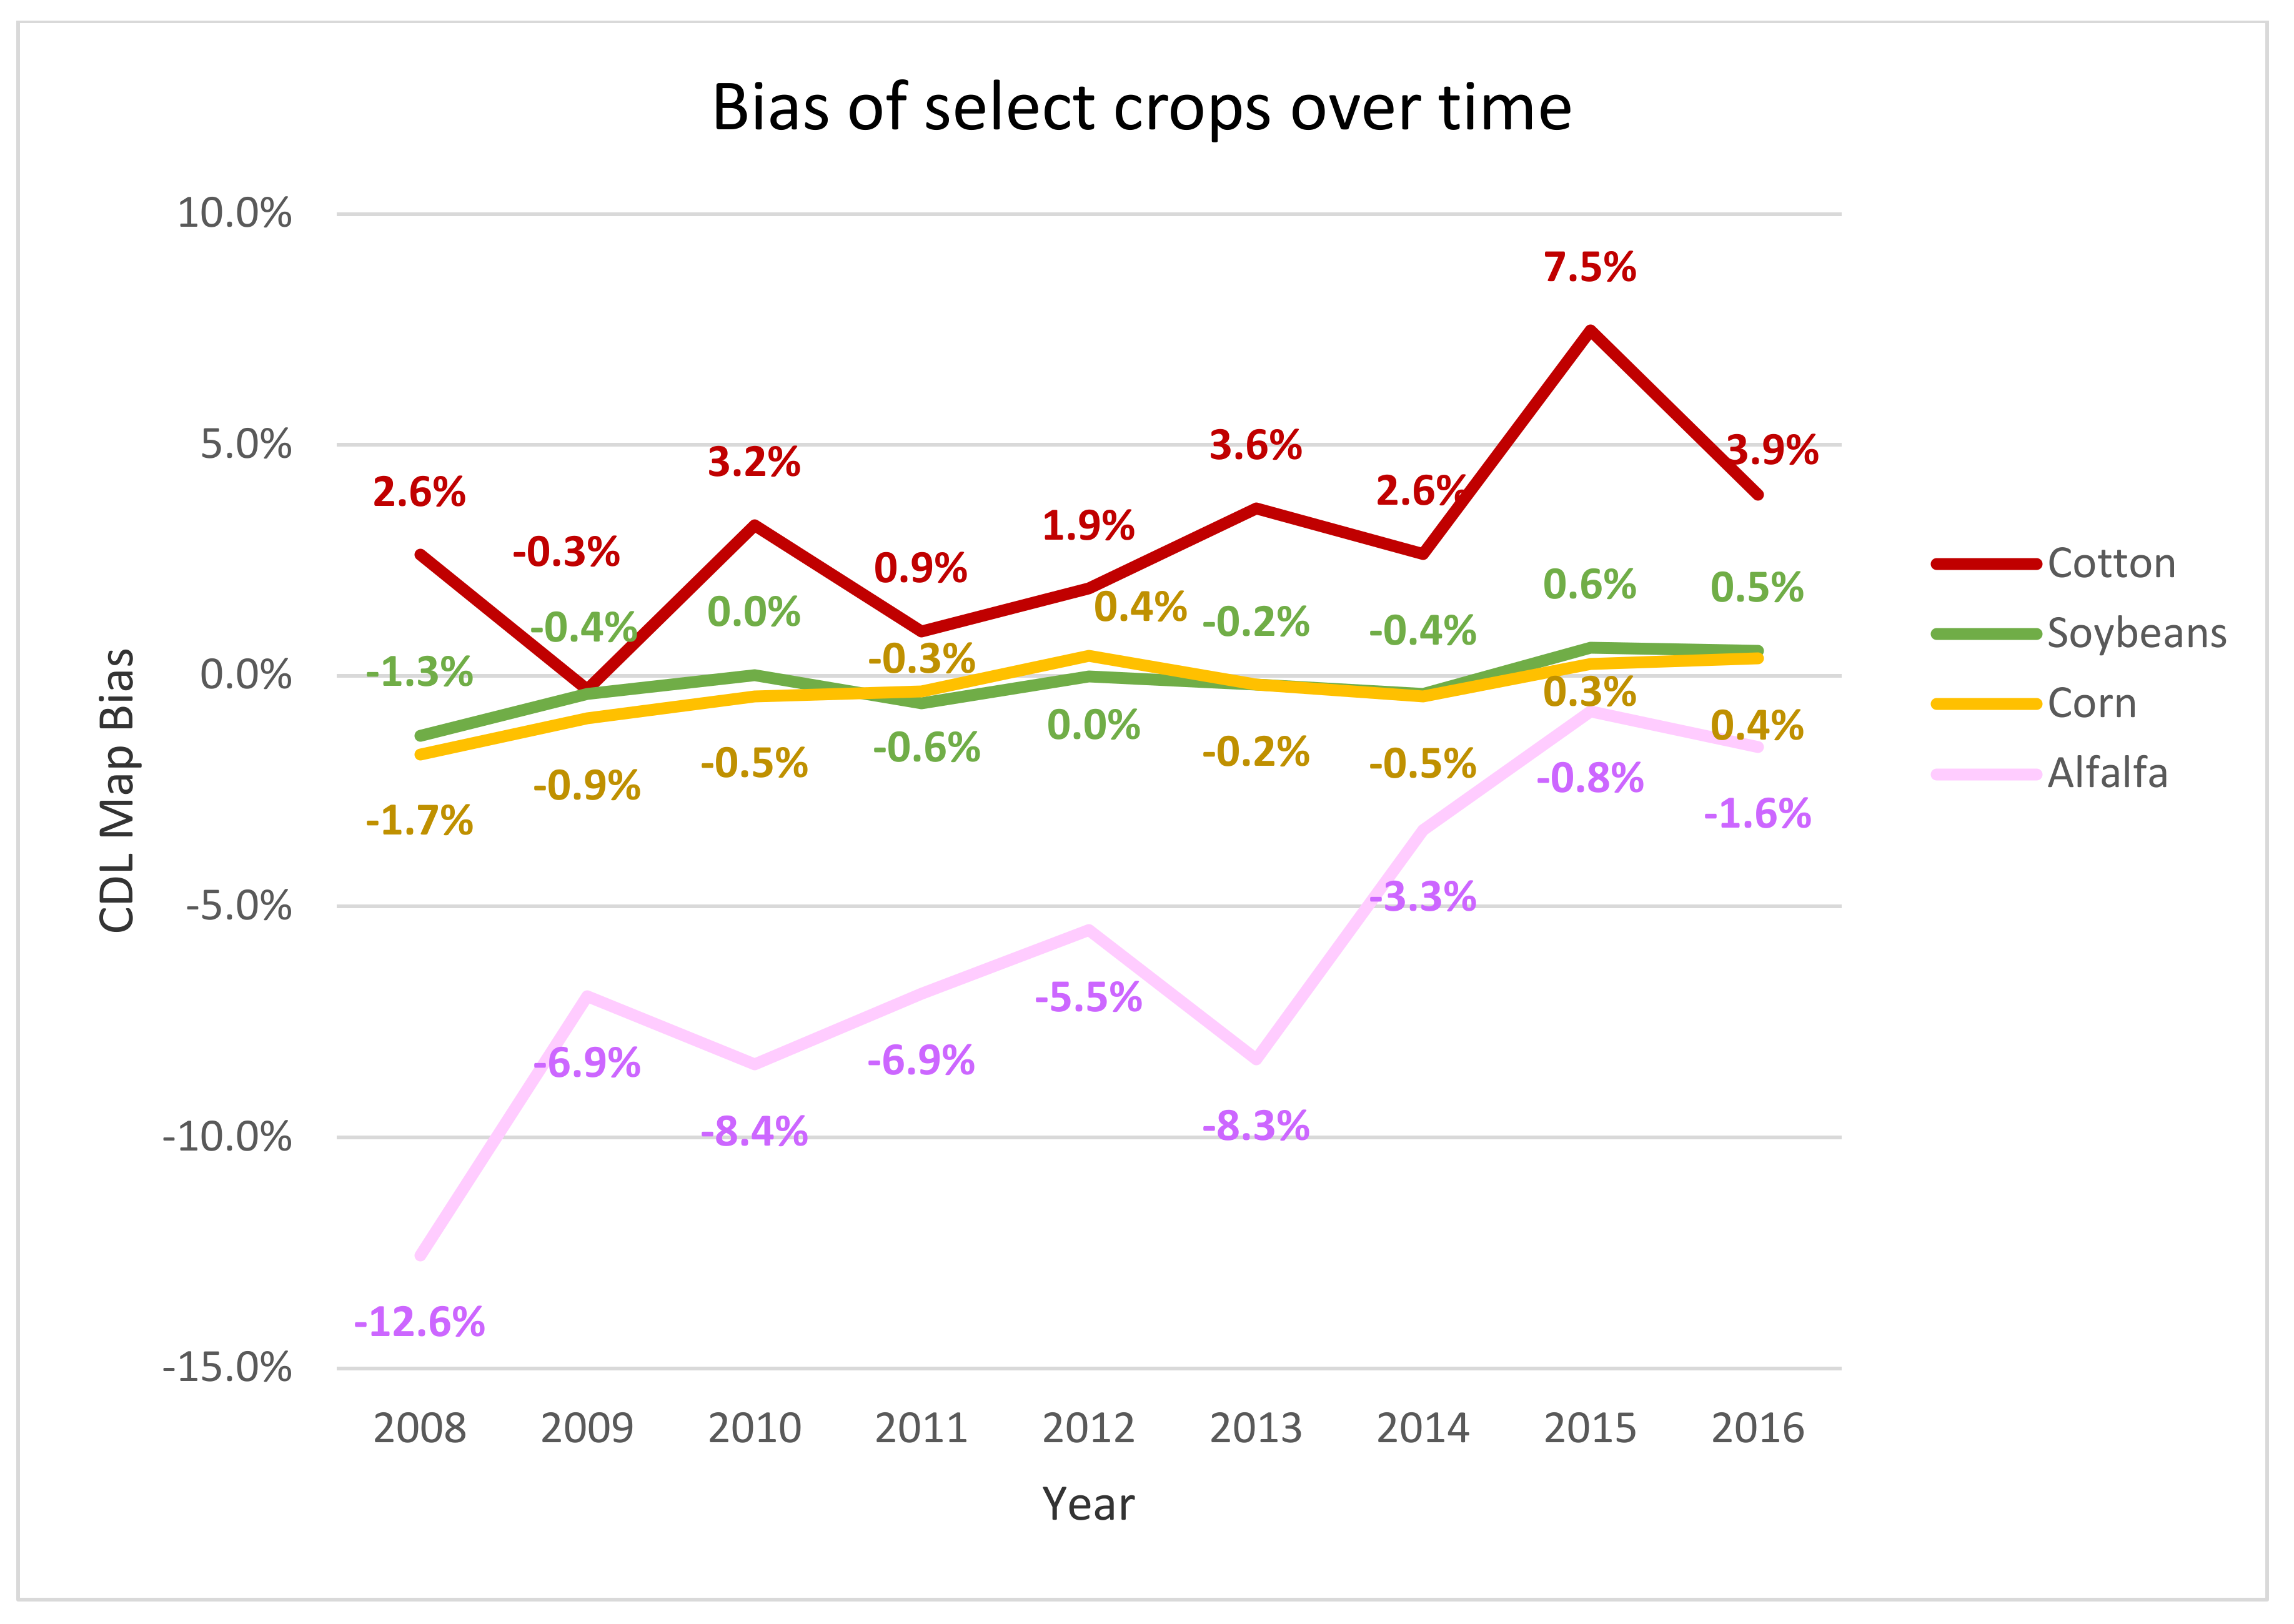
3.5. Measured Biases and Adjusted Crop Area Estimates
4. Discussion
4.1. CDL Performance
4.2. Improvements over Time
4.3. Implications for Measuring LULC Change
4.4. Limitations, Representativeness, and Uncertainty of Results
5. Conclusions
Author Contributions
Funding
Data Availability Statement
Acknowledgments
Conflicts of Interest
Appendix A

| Cropland | Non-Cropland | ||||||
|---|---|---|---|---|---|---|---|
| ID | Class Name | ID | Class Name | ID | Class Name | ID | Class Name |
| 1 | Corn | 48 | Watermelons | 216 | Peppers | 37 | Other Hay/Non Alfalfa |
| 2 | Cotton | 49 | Onions | 217 | Pomegranates | ||
| 3 | Rice | 50 | Cucumbers | 218 | Nectarines | 63 | Forest |
| 4 | Sorghum | 51 | Chickpeas | 219 | Greens | 64 | Shrubland |
| 5 | Soybeans | 52 | Lentils | 220 | Plums | 65 | Barren |
| 6 | Sunflower | 53 | Peas | 221 | Strawberries | 81 | Clouds/No Data |
| 10 | Peanuts | 54 | Tomatoes | 222 | Squash | 82 | Developed |
| 11 | Tobacco | 55 | Caneberries | 223 | Apricots | 83 | Water |
| 12 | Sweet Corn | 56 | Hops | 224 | Vetch | 87 | Wetlands |
| 13 | Pop or Orn Corn | 57 | Herbs | 225 | Dbl Crop WinWht/Corn | 88 | Nonag/Undefined |
| 14 | Mint | 58 | Clover/Wildflowers | 226 | Dbl Crop Oats/Corn | 92 | Aquaculture |
| 21 | Barley | 59 | Sod/Grass Seed | 227 | Lettuce | 111 | Open Water |
| 22 | Durum Wheat | 60 | Switchgrass | 229 | Pumpkins | 112 | Perennial Ice/Snow |
| 23 | Spring Wheat | 61 | Fallow/Idle | 230 | Dbl Crop Lettuce/Durum Wht | 121 | Developed/Open Space |
| 24 | Winter Wheat | 66 | Cherries | 231 | Dbl Crop Lettuce/Cantaloupe | 122 | Developed/Low Intensity |
| 25 | Other Small Grains | 67 | Peaches | 232 | Dbl Crop Lettuce/Cotton | 123 | Developed/Med Intensity |
| 26 | Dbl WinWht/Soy | 68 | Apples | 233 | Dbl Crop Lettuce/Barley | 124 | Developed/High Intensity |
| 27 | Rye | 69 | Grapes | 234 | Dbl Crop Durum Wht/Sorghum | 131 | Barren |
| 28 | Oats | 70 | Christmas Trees | 235 | Dbl Crop Barley/Sorghum | 141 | Deciduous Forest |
| 29 | Millet | 71 | Other Tree Crops | 236 | Dbl Crop WinWht/Sorghum | 142 | Evergreen Forest |
| 30 | Speltz | 72 | Citrus | 237 | Dbl Crop Barley/Corn | 143 | Mixed Forest |
| 31 | Canola | 74 | Pecans | 238 | Dbl Crop WinWht/Cotton | 152 | Shrubland |
| 32 | Flaxseed | 75 | Almonds | 239 | Dbl Crop Soybeans/Cotton | ||
| 33 | Safflower | 76 | Walnuts | 240 | Dbl Crop Soybeans/Oats | 176 | Grassland/Pasture |
| 34 | Rape Seed | 77 | Pears | 241 | Dbl Crop Corn/Soybeans | ||
| 35 | Mustard | 204 | Pistachios | 242 | Blueberries | 190 | Woody Wetlands |
| 36 | Alfalfa | 205 | Triticale | 243 | Cabbage | 195 | Herbaceous Wetlands |
| 38 | Camelina | 206 | Carrots | 244 | Cauliflower | ||
| 39 | Buckwheat | 207 | Asparagus | 245 | Celery | ||
| 41 | Sugarbeets | 208 | Garlic | 246 | Radishes | ||
| 42 | Dry Beans | 209 | Cantaloupes | 247 | Turnips | ||
| 43 | Potatoes | 210 | Prunes | 248 | Eggplants | ||
| 44 | Other Crops | 211 | Olives | 249 | Gourds | ||
| 45 | Sugarcane | 212 | Oranges | 250 | Cranberries | ||
| 46 | Sweet Potatoes | 213 | Honeydew Melons | 254 | Dbl Crop Barley/Soybeans | ||
| 47 | Misc Vegs and Fruits | 214 | Broccoli | ||||
| CDL ID | Crop Name | CDL Acreage | Producer’s Accuracy | User’s Accuracy |
|---|---|---|---|---|
| 45 | Sugarcane | 1,026,752 | 96.52% | 94.44% |
| 3 | Rice | 2,671,894 | 95.54% | 97.01% |
| 1 | Corn | 94,983,301 | 95.23% | 94.82% |
| 5 | Soybeans | 69,810,086 | 93.82% | 93.85% |
| 41 | Sugarbeets | 1,238,159 | 93.67% | 94.18% |
| 31 | Canola | 1,700,926 | 93.51% | 95.64% |
| 24 | Winter Wheat | 34,784,199 | 92.18% | 92.38% |
| 2 | Cotton | 13,114,321 | 91.06% | 89.39% |
| 75 | Almonds | 1,155,344 | 91.04% | 91.56% |
| 250 | Cranberries | 36,040 | 91.02% | 95.23% |
| 23 | Spring Wheat | 12,303,171 | 89.47% | 86.89% |
| 212 | Oranges | 1,019,334 | 89.24% | 91.45% |
| 54 | Tomatoes | 353,534 | 89.24% | 89.60% |
| 51 | Chickpeas | 1838 | 89.19% | 84.44% |
| 43 | Potatoes | 1,083,450 | 88.98% | 92.66% |
| 69 | Grapes | 1,136,718 | 87.39% | 89.89% |
| 26 | Dbl Crop WinWht/Soybeans | 5,311,121 | 86.70% | 84.30% |
| 230 | Dbl Crop Lettuce/Durum Wht | 39,776 | 86.08% | 80.01% |
| 68 | Apples | 444,242 | 85.67% | 88.41% |
| 56 | Hops | 24,903 | 84.53% | 96.44% |
| 6 | Sunflower | 1,595,069 | 84.09% | 92.20% |
| 10 | Peanuts | 1,657,438 | 81.17% | 82.33% |
| 42 | Dry Beans | 1,743,309 | 79.97% | 85.66% |
| 204 | Pistachios | 201,944 | 78.50% | 85.69% |
| 46 | Sweet Potatoes | 84,332 | 77.54% | 87.22% |
| 4 | Sorghum | 6,262,444 | 77.43% | 82.91% |
| 77 | Pears | 28,048 | 77.36% | 80.67% |
| 36 | Alfalfa | 16,167,152 | 75.40% | 79.81% |
| 245 | Celery | 2460 | 74.95% | 93.43% |
| 76 | Walnuts | 341,480 | 74.80% | 79.49% |
| 52 | Lentils | 388,352 | 74.57% | 82.45% |
| 22 | Durum Wheat | 1,860,552 | 73.30% | 81.26% |
| 49 | Onions | 139,769 | 72.90% | 78.67% |
| 66 | Cherries | 199,450 | 72.70% | 78.60% |
| 211 | Olives | 45,218 | 72.58% | 90.34% |
| 21 | Barley | 2,852,300 | 72.41% | 83.14% |
| 247 | Turnips | 1990 | 72.37% | 79.65% |
| 53 | Peas | 774,135 | 72.14% | 83.45% |
| 208 | Garlic | 17,233 | 71.20% | 84.66% |
| 61 | Fallow/Idle Cropland | 24,395,076 | 69.29% | 78.96% |
| 32 | Flaxseed | 284,228 | 68.10% | 81.77% |
| 59 | Sod/Grass Seed | 797,216 | 68.00% | 82.93% |
| 57 | Herbs | 104,376 | 67.07% | 86.46% |
| 14 | Mint | 8429 | 67.00% | 77.65% |
| 50 | Cucumbers | 32,698 | 65.44% | 78.26% |
| 12 | Sweet Corn | 301,474 | 65.35% | 80.95% |
| 244 | Cauliflower | 1956 | 64.25% | 79.31% |
| 226 | Dbl Crop Oats/Corn | 109,775 | 63.82% | 62.71% |
| 234 | Dbl Crop Durum Wht/Sorghum | 4095 | 63.24% | 66.43% |
| 47 | Misc Vegs and Fruits | 47,159 | 62.89% | 78.30% |
| 225 | Dbl Crop WinWht/Corn | 402,067 | 61.81% | 69.33% |
| 71 | Other Tree Crops | 68,927 | 61.69% | 75.22% |
| 27 | Rye | 453,504 | 61.47% | 72.91% |
| 254 | Dbl Crop Barley/Soybeans | 113,764 | 61.24% | 78.16% |
| 72 | Citrus | 139,758 | 60.68% | 81.33% |
| 33 | Safflower | 148,336 | 59.74% | 80.07% |
| 11 | Tobacco | 112,733 | 59.62% | 79.97% |
| 232 | Dbl Crop Lettuce/Cotton | 7770 | 58.53% | 69.78% |
| 213 | Honeydew Melons | 6430 | 58.09% | 75.87% |
| 231 | Dbl Crop Lettuce/Cantaloupe | 3833 | 57.97% | 85.54% |
| 242 | Blueberries | 90,911 | 57.70% | 74.20% |
| 248 | Eggplants | 357 | 57.69% | 68.18% |
| 227 | Lettuce | 28,621 | 57.45% | 66.98% |
| 58 | Clover/Wildflowers | 146,851 | 57.21% | 70.80% |
| 209 | Cantaloupes | 18,325 | 57.00% | 72.44% |
| 217 | Pomegranates | 20,652 | 56.79% | 76.84% |
| 216 | Peppers | 19,796 | 55.46% | 67.81% |
| 207 | Asparagus | 19,258 | 54.93% | 78.11% |
| 74 | Pecans | 398,572 | 53.68% | 83.55% |
| 29 | Millet | 457,674 | 53.43% | 64.84% |
| 221 | Strawberries | 43,438 | 52.63% | 80.70% |
| 39 | Buckwheat | 22,586 | 52.11% | 78.32% |
| 246 | Radishes | 10,175 | 50.75% | 70.24% |
| 235 | Dbl Crop Barley/Sorghum | 12,071 | 49.65% | 50.19% |
| 67 | Peaches | 53,255 | 49.19% | 68.69% |
| 35 | Mustard | 32,734 | 48.15% | 78.68% |
| 241 | Dbl Crop Corn/Soybeans | 16,998 | 48.07% | 75.59% |
| 60 | Switchgrass | 10,684 | 47.62% | 56.33% |
| 220 | Plums | 53,436 | 46.92% | 65.53% |
| 55 | Caneberries | 11,633 | 46.19% | 85.35% |
| 206 | Carrots | 42,670 | 45.93% | 70.76% |
| 229 | Pumpkins | 23,094 | 43.87% | 72.29% |
| 70 | Christmas Trees | 65,800 | 43.65% | 75.04% |
| 243 | Cabbage | 18,368 | 43.03% | 59.38% |
| 38 | Camelina | 4977 | 42.94% | 69.91% |
| 214 | Broccoli | 11,202 | 41.89% | 63.04% |
| 28 | Oats | 1,285,192 | 41.18% | 62.21% |
| 238 | Dbl Crop WinWht/Cotton | 324,242 | 41.14% | 70.23% |
| 48 | Watermelons | 37,670 | 40.78% | 62.93% |
| 219 | Greens | 15,028 | 40.62% | 54.26% |
| 13 | Pop or Orn Corn | 120,463 | 40.33% | 91.15% |
| 223 | Apricots | 3760 | 39.37% | 71.61% |
| 222 | Squash | 20,832 | 37.05% | 61.87% |
| 237 | Dbl Crop Barley/Corn | 37,530 | 36.55% | 70.59% |
| 236 | Dbl Crop WinWht/Sorghum | 386,258 | 34.26% | 60.55% |
| 224 | Vetch | 4595 | 33.12% | 69.06% |
| 44 | Other Crops | 171,449 | 32.93% | 63.82% |
| 205 | Triticale | 156,684 | 32.74% | 67.26% |
| 218 | Nectarines | 2589 | 32.16% | 70.51% |
| 25 | Other Small Grains | 5008 | 28.18% | 73.07% |
| 34 | Rape Seed | 3211 | 23.92% | 58.74% |
| 239 | Dbl Crop Soybeans/Cotton | 7388 | 20.90% | 66.57% |
| 240 | Dbl Crop Soybeans/Oats | 17,928 | 19.50% | 62.42% |
| 30 | Speltz | 2811 | 16.32% | 60.80% |
| 249 | Gourds | 150 | 10.00% | 100.00% |
| Cropland | Non-Cropland | |||
|---|---|---|---|---|
| State | Producer’s Accuracy | User’s Accuracy | Producer’s Accuracy | User’s Accuracy |
| AL | 84% | 93% | 98% | 94% |
| AR | 97% | 100% | 99% | 89% |
| AZ | 91% | 97% | 99% | 95% |
| CA | 96% | 98% | 99% | 93% |
| CO | 93% | 98% | 98% | 90% |
| CT_MA_ME_NH_RI_VT | 87% | 93% | 100% | 99% |
| DE_MD_NJ | 93% | 94% | 98% | 96% |
| FL | 89% | 95% | 98% | 92% |
| GA | 86% | 91% | 98% | 93% |
| IA | 97% | 99% | 95% | 77% |
| ID | 93% | 96% | 99% | 95% |
| IL | 98% | 97% | 92% | 95% |
| IN | 98% | 97% | 94% | 96% |
| KS | 97% | 99% | 99% | 95% |
| KY | 92% | 99% | 97% | 84% |
| LA | 95% | 98% | 98% | 90% |
| MI | 96% | 95% | 95% | 90% |
| MN | 98% | 98% | 97% | 93% |
| MO | 98% | 96% | 97% | 98% |
| MS | 94% | 98% | 98% | 92% |
| MT | 91% | 95% | 99% | 98% |
| NC | 91% | 95% | 97% | 93% |
| ND | 95% | 98% | 97% | 90% |
| NE | 97% | 100% | 95% | 67% |
| NM | 88% | 98% | 99% | 87% |
| NV | 88% | 96% | 100% | 99% |
| NY | 86% | 88% | 98% | 95% |
| OH | 96% | 97% | 96% | 95% |
| OK | 97% | 100% | 96% | 62% |
| OR | 93% | 97% | 98% | 93% |
| PA | 83% | 82% | 98% | 96% |
| SC | 86% | 92% | 98% | 94% |
| SD | 95% | 97% | 98% | 97% |
| TN | 95% | 99% | 98% | 90% |
| TX | 92% | 100% | 96% | 56% |
| UT | 90% | 98% | 99% | 94% |
| VA_WV | 92% | 94% | 99% | 98% |
| WA | 97% | 98% | 100% | 97% |
| WI | 95% | 97% | 93% | 84% |
| WY | 88% | 98% | 99% | 93% |


References
- Turner, B.L.; Lambin, E.F.; Reenberg, A. The Emergence of Land Change Science for Global Environmental Change and Sustainability. Proc. Natl. Acad. Sci. USA 2007, 104, 20666–20671. [Google Scholar] [CrossRef] [PubMed] [Green Version]
- Lillesand, T.; Kiefer, R.W.; Chipman, J. Remote Sensing and Image Interpretation; John Wiley & Sons: Hoboken, NJ, USA, 2014; ISBN 978-1-118-34328-9. [Google Scholar]
- Howard, D.M.; Wylie, B.K.; Tieszen, L.L. Crop Classification Modelling Using Remote Sensing and Environmental Data in the Greater Platte River Basin, USA. Int. J. Remote Sens. 2012, 33, 6094–6108. [Google Scholar] [CrossRef]
- Environmental Protection Agency. Renewable Fuel Standard (RFS) program are under 40 CFR Part 80: Regulation of Fuels and Fuel Additives; Environmental Protection Agency: Washington, DC, USA, 2010. [Google Scholar]
- Blackman, A. Evaluating Forest Conservation Policies in Develo** Countries Using Remote Sensing Data: An Introduction and Practical Guide. For. Policy Econ. 2013, 34, 1–16. [Google Scholar] [CrossRef]
- Lark, T.J. Protecting Our Prairies: Research and Policy Actions for Conserving America’s Grasslands. Land Use Policy 2020, 97, 104727. [Google Scholar] [CrossRef]
- Han, W.; Yang, Z.; Di, L.; Mueller, R. CropScape: A Web Service Based Application for Exploring and Disseminating US Conterminous Geospatial Cropland Data Products for Decision Support. Comput. Electron. Agric. 2012, 84, 111–123. [Google Scholar] [CrossRef]
- Holland, A.; Bennett, D.A.; Secchi, S. Complying with Conservation Compliance? An Assessment of Recent Evidence in the US Corn Belt. Environ. Res. Lett. 2020. [Google Scholar] [CrossRef]
- Foody, G.M. Valuing Map Validation: The Need for Rigorous Land Cover Map Accuracy Assessment in Economic Valuations of Ecosystem Services. Ecol. Econ. 2015, 111, 23–28. [Google Scholar] [CrossRef]
- Olofsson, P.; Foody, G.M.; Stehman, S.V.; Woodcock, C.E. Making Better Use of Accuracy Data in Land Change Studies: Estimating Accuracy and Area and Quantifying Uncertainty Using Stratified Estimation. Remote Sens. Environ. 2013, 129, 122–131. [Google Scholar] [CrossRef]
- Morales-Barquero, L.; Lyons, M.B.; Phinn, S.R.; Roelfsema, C.M. Trends in Remote Sensing Accuracy Assessment Approaches in the Context of Natural Resources. Remote Sens. 2019, 11, 2305. [Google Scholar] [CrossRef] [Green Version]
- Stehman, S.V.; Foody, G.M. Key Issues in Rigorous Accuracy Assessment of Land Cover Products. Remote Sens. Environ. 2019, 231, 111199. [Google Scholar] [CrossRef]
- Johnson, D.; Mueller, R. The 2009 Cropland Data Layer. Photogramm. Eng. Remote Sens. 2010, 76, 1201–1205. [Google Scholar]
- Mueller, R.; Harris, M. Reported Uses of CropScape and the National Cropland Data Layer Program. In Proceedings of the International Conference on Agricultural Statistics VI, Rio de Janerio, Brazil, 23–25 October 2013. [Google Scholar]
- Boryan, C.; Yang, Z.; Mueller, R.; Craig, M. Monitoring US Agriculture: The US Department of Agriculture, National Agricultural Statistics Service, Cropland Data Layer Program. Geocarto Int. 2011, 26, 341–358. [Google Scholar] [CrossRef]
- Johnson, D.M. A 2010 Map Estimate of Annually Tilled Cropland within the Conterminous United States. Agric. Syst. 2013, 114, 95–105. [Google Scholar] [CrossRef]
- Stern, A.J.; Doraiswamy, P.C.; Hunt, E.R., Jr. Changes of Crop Rotation in Iowa Determined from the United States Department of Agriculture, National Agricultural Statistics Service Cropland Data Layer Product. J. Appl. Remote Sens. 2012, 6, 063590. [Google Scholar] [CrossRef]
- Sahajpal, R.; Zhang, X.; Izaurralde, R.C.; Gelfand, I.; Hurtt, G.C. Identifying Representative Crop Rotation Patterns and Grassland Loss in the US Western Corn Belt. Comput. Electron. Agric. 2014, 108, 173–182. [Google Scholar] [CrossRef] [Green Version]
- Plourde, J.D.; Pijanowski, B.C.; Pekin, B.K. Evidence for Increased Monoculture Crop** in the Central United States. Agric. Ecosyst. Environ. 2013, 165, 50–59. [Google Scholar] [CrossRef]
- Hendricks, N.P.; Sinnathamby, S.; Douglas-Mankin, K.; Smith, A.; Sumner, D.A.; Earnhart, D.H. The Environmental Effects of Crop Price Increases: Nitrogen Losses in the US Corn Belt. J. Environ. Econ. Manag. 2014, 68, 507–526. [Google Scholar] [CrossRef] [Green Version]
- Cox, C.; Rundquist, S.; Weir, A. Boondoggle: Prevented Planting Insurance Plows up Wetlands, Wastes Billions; Environmental Working Group: Washington, DC, USA, 2015. [Google Scholar]
- Lark, T.J.; Salmon, J.M.; Gibbs, H.K. Cropland Expansion Outpaces Agricultural and Biofuel Policies in the United States. Environ. Res. Lett. 2015, 10, 044003. [Google Scholar] [CrossRef] [Green Version]
- Werling, B.P.; Dickson, T.L.; Isaacs, R.; Gaines, H.; Gratton, C.; Gross, K.L.; Liere, H.; Malmstrom, C.M.; Meehan, T.D.; Ruan, L.; et al. Perennial Grasslands Enhance Biodiversity and Multiple Ecosystem Services in Bioenergy Landscapes. Proc. Natl. Acad. Sci. USA 2014, 111, 1652–1657. [Google Scholar] [CrossRef] [PubMed] [Green Version]
- Meehan, T.D.; Gratton, C.; Diehl, E.; Hunt, N.D.; Mooney, D.F.; Ventura, S.J.; Barham, B.L.; Jackson, R.D. Ecosystem-Service Tradeoffs Associated with Switching from Annual to Perennial Energy Crops in Riparian Zones of the US Midwest. PLoS ONE 2013, 8, e80093. [Google Scholar] [CrossRef]
- USDA NASS QuickStats. Available online: http://quickstats.nass.usda.gov/ (accessed on 10 May 2012).
- USDA-NASS-RDD Spatial Analysis Research Section Cropland Data Layer Metadata. Available online: http://www.nass.usda.gov/research/Cropland/metadata/meta.htm (accessed on 20 July 2015).
- USDA; FSA. FSA Common Land Unit Infosheet 2012. Available online: http://www.fsa.usda.gov/Internet/FSA_File/clu__infosheet_2012.pdf (accessed on 10 May 2012).
- Wickham, J.D.; Stehman, S.V.; Fry, J.A.; Smith, J.H.; Homer, C.G. Thematic Accuracy of the NLCD 2001 Land Cover for the Conterminous United States. Remote Sens. Environ. 2010, 114, 1286–1296. [Google Scholar] [CrossRef]
- Homer, C.; Dewitz, J.; Yang, L.; **, S.; Danielson, P.; ** and Area Estimation in the United States Using Medium Resolution Satellite Imagery and Field Survey. Remote Sens. Environ. 2017, 190, 383–395. [Google Scholar] [CrossRef]


| Metric: | Reported For: | Measures Accuracy of Identifying: | Producer’s Example | User’s Example |
|---|---|---|---|---|
| Class Accuracy | Specific classes | Specific classes | The likelihood that actual corn is mapped as corn | The likelihood an area mapped as corn is actually corn |
| Superclass Accuracy | Specific classes | An aggregated domain | The likelihood that actual corn is mapped as cropland | The likelihood an area mapped as corn is actually cropland |
| Consolidated Class Accuracy | An aggregated domain | An aggregated domain | The likelihood that actual cropland is mapped as cropland | The likelihood an area mapped as cropland is actually cropland |
| Average Class Accuracy | An aggregated domain | Specific classes | The likelihood that any crop is mapped as that specific crop | The likelihood that any mapped crop is actually that crop |
| Class Name | ID | Producer Accuracy | Omission Error | User Accuracy | Commission Error |
|---|---|---|---|---|---|
| Corn | 1 | 95% | 5% | 95% | 5% |
| Cotton | 2 | 91% | 9% | 89% | 11% |
| Soybeans | 5 | 94% | 6% | 94% | 6% |
| Spring Wheat | 23 | 89% | 11% | 87% | 13% |
| Winter Wheat | 24 | 92% | 8% | 92% | 8% |
| Alfalfa | 36 | 75% | 25% | 80% | 20% |
| Other Hay/No Alfalfa | 37 | 57% | 43% | 57% | 43% |
| Fallow/Idle Cropland | 61 | 69% | 31% | 79% | 21% |
| Open Water | 111 | 90% | 10% | 81% | 19% |
| Developed/Open Space | 121 | 89% | 11% | 61% | 39% |
| Developed/Low Intensity | 122 | 83% | 17% | 74% | 26% |
| Developed/Med Intensity | 123 | 84% | 16% | 81% | 19% |
| Barren | 131 | 74% | 26% | 75% | 25% |
| Deciduous Forest | 141 | 88% | 12% | 75% | 25% |
| Evergreen Forest | 142 | 87% | 13% | 73% | 27% |
| Mixed Forest | 143 | 44% | 56% | 51% | 49% |
| Shrubland | 152 | 87% | 13% | 71% | 29% |
| Grassland/Pasture | 176 | 79% | 21% | 50% | 50% |
| Woody Wetlands | 190 | 70% | 30% | 63% | 37% |
| Herbaceous Wetlands | 195 | 61% | 39% | 47% | 53% |
| Average of All Crops | N/A | 88.7% | 11.3% | 90.3% | 9.7% |
| Average of All Non-Crops | N/A | 82.4 % | 17.6% | 69.4% | 30.6% |
| Metric | Type | 2008 | 2009 | 2010 | 2011 | 2012 | 2013 | 2014 | 2015 | 2016 |
|---|---|---|---|---|---|---|---|---|---|---|
| Average Crop Accuracy | Prod: | 88% | 89% | 89% | 89% | 89% | 89% | 90% | 90% | 92% |
| User: | 90% | 90% | 91% | 91% | 90% | 91% | 92% | 91% | 92% | |
| Average Non-Crop Accuracy | Prod: | 82% | 82% | 81% | 82% | 82% | 82% | 81% | 85% | 85% |
| User: | 63% | 64% | 65% | 61% | 69% | 67% | 69% | 82% | 82% | |
| Consolidated Cropland Accuracy | Prod: | 95% | 95% | 95% | 95% | 95% | 96% | 96% | 96% | 98% |
| User: | 98% | 98% | 97% | 98% | 97% | 99% | 99% | 98% | 99% | |
| Consolidated Non-Cropland Accuracy | Prod: | 97% | 97% | 98% | 98% | 98% | 98% | 97% | 99% | 99% |
| User: | 84% | 85% | 89% | 82% | 89% | 87% | 89% | 98% | 98% |
| CDL ID | Crop Class | CDL Acreage | Superclass Accuracy | % of Errors within Domain | ||
|---|---|---|---|---|---|---|
| Producer’s | User’s | Omission Errors | Commission Errors | |||
| 1 | Corn | 94,983,301 | 98% | 99% | 57% | 73% |
| 2 | Cotton | 13,114,321 | 98% | 100% | 77% | 96% |
| 3 | Rice | 2,671,894 | 99% | 100% | 84% | 95% |
| 4 | Sorghum | 6,262,444 | 96% | 99% | 81% | 95% |
| 5 | Soybeans | 69,810,086 | 98% | 99% | 65% | 76% |
| 6 | Sunflower | 1,595,069 | 94% | 99% | 52% | 79% |
| 10 | Peanuts | 1,657,438 | 98% | 99% | 88% | 93% |
| 21 | Barley | 2,852,300 | 94% | 99% | 78% | 92% |
| 22 | Durum Wheat | 1,860,552 | 98% | 99% | 92% | 97% |
| 23 | Spring Wheat | 12,303,171 | 96% | 99% | 64% | 92% |
| 24 | Winter Wheat | 34,784,199 | 97% | 99% | 55% | 88% |
| 26 | Dbl WinWht/Soybeans | 5,311,121 | 97% | 98% | 73% | 87% |
| 28 | Oats | 1,285,192 | 81% | 93% | 67% | 84% |
| 31 | Canola | 1,700,926 | 97% | 99% | 53% | 86% |
| 36 | Alfalfa | 16,167,152 | 80% | 86% | 27% | 40% |
| 41 | Sugarbeets | 1,238,159 | 99% | 100% | 77% | 94% |
| 42 | Dry Beans | 1,743,309 | 97% | 99% | 84% | 94% |
| 61 | Fallow/Idle Cropland | 24,395,076 | 80% | 92% | 35% | 67% |
| 69 | Grapes | 1,136,718 | 96% | 98% | 69% | 82% |
| 75 | Almonds | 1,155,344 | 98% | 99% | 78% | 94% |
| CDL ID | Land Cover Class | CDL Acreage | Superclass Accuracy | % of Errors within Domain | ||
|---|---|---|---|---|---|---|
| Producer’s | User’s | Omission Errors | Commission Errors | |||
| 37 | Other Hay/Non Alfalfa | 23,881,755 | 89% | 86% | 68% | 62% |
| 92 | Aquaculture | 203,750 | 87% | 84% | 58% | 17% |
| 111 | Open Water | 32,373,788 | 99% | 95% | 89% | 76% |
| 112 | Perennial Ice/Snow | 427,601 | 100% | 99% | 100% | 97% |
| 121 | Developed/Open Space | 64,041,431 | 97% | 75% | 72% | 41% |
| 122 | Developed/Low Intensity | 28,380,971 | 99% | 91% | 96% | 69% |
| 123 | Developed/Med Intensity | 11,279,299 | 100% | 96% | 98% | 81% |
| 124 | Developed/High Intensity | 3,900,690 | 100% | 98% | 99% | 87% |
| 131 | Barren | 20,800,191 | 99% | 96% | 96% | 87% |
| 141 | Deciduous Forest | 239,843,277 | 100% | 97% | 94% | 89% |
| 142 | Evergreen Forest | 249,399,532 | 100% | 99% | 99% | 96% |
| 143 | Mixed Forest | 29,952,005 | 100% | 99% | 100% | 98% |
| 152 | Shrubland | 429,532,225 | 99% | 89% | 89% | 64% |
| 176 | Grassland/Pasture | 383,816,367 | 93% | 68% | 66% | 37% |
| 190 | Woody Wetlands | 75,447,681 | 99% | 93% | 97% | 83% |
| 195 | Herbaceous Wetlands | 23,005,862 | 94% | 86% | 88% | 75% |
| Crop Name | CDL Area | CDL Bias | Bias-Adjusted Acreage | NASS Planted Area | NASS Harvested Area | NASS Ave |
|---|---|---|---|---|---|---|
| Corn | 94,983,301 | 0.43% | 94,572,035 | 96,405,000 | 88,851,000 | 92,628,000 |
| Soybeans | 69,810,086 | −0.03% | 69,829,899 | 76,080,000 | 75,315,000 | 75,697,500 |
| Winter Wheat | 34,784,199 | −0.22% | 34,860,122 | 41,819,000 | 35,023,000 | 38,421,000 |
| Fallow/Idle Cropland | 24,395,076 | −12.24% | 27,382,251 | * 14,145,567 | ** 36,382,032 | n/a |
| Alfalfa | 16,167,152 | −5.52% | 17,059,748 | 19,213,000 | 18,827,000 | 19,020,000 |
| Cotton | 13,114,321 | 1.88% | 12,868,014 | 12,635,000 | 10,443,400 | 11,539,200 |
| Spring Wheat | 12,303,171 | 2.97% | 11,937,985 | 11,995,000 | 11,681,000 | 11,838,000 |
| Sorghum | 6,262,444 | −6.60% | 6,675,868 | 6,210,000 | 5,238,000 | 5,724,000 |
| Dbl WinWht/Soybeans | 5,311,121 | 2.85% | 5,159,595 | *** | *** | *** |
| Barley | 2,852,300 | −12.90% | 3,220,316 | 3,678,000 | 3,268,000 | 3,473,000 |
| Rice | 2,671,894 | −1.51% | 2,712,326 | 2,661,000 | 2,640,000 | 2,650,500 |
| Durum Wheat | 1,860,552 | −9.80% | 2,042,794 | 2,203,000 | 2,122,000 | 2,162,500 |
| Dry Beans | 1,743,309 | −6.65% | 1,859,213 | 1,632,700 | 1,573,600 | 1,603,150 |
| Canola | 1,700,926 | −2.23% | 1,738,835 | 1,631,500 | 1,593,100 | 1,612,300 |
| Peanuts | 1,657,438 | −1.42% | 1,680,900 | 1,526,000 | 1,486,000 | 1,506,000 |
| Sunflower | 1,595,069 | −8.79% | 1,735,327 | 1,804,500 | 1,735,400 | 1,769,950 |
| Oats | 1,285,192 | −33.81% | 1,719,707 | 2,746,000 | 1,091,000 | 1,918,500 |
| Sugarbeets | 1,238,159 | −0.55% | 1,244,915 | 1,244,100 | 1,215,900 | 1,230,000 |
Publisher’s Note: MDPI stays neutral with regard to jurisdictional claims in published maps and institutional affiliations. |
© 2021 by the authors. Licensee MDPI, Basel, Switzerland. This article is an open access article distributed under the terms and conditions of the Creative Commons Attribution (CC BY) license (http://creativecommons.org/licenses/by/4.0/).
Share and Cite
Lark, T.J.; Schelly, I.H.; Gibbs, H.K. Accuracy, Bias, and Improvements in Map** Crops and Cropland across the United States Using the USDA Cropland Data Layer. Remote Sens. 2021, 13, 968. https://doi.org/10.3390/rs13050968
Lark TJ, Schelly IH, Gibbs HK. Accuracy, Bias, and Improvements in Map** Crops and Cropland across the United States Using the USDA Cropland Data Layer. Remote Sensing. 2021; 13(5):968. https://doi.org/10.3390/rs13050968
Chicago/Turabian StyleLark, Tyler J., Ian H. Schelly, and Holly K. Gibbs. 2021. "Accuracy, Bias, and Improvements in Map** Crops and Cropland across the United States Using the USDA Cropland Data Layer" Remote Sensing 13, no. 5: 968. https://doi.org/10.3390/rs13050968