Article

Radiation Sensitivity Analysis of Ocean Wake Information Detection System Based on Visible Light Remote Sensing

1
Changchun Institute of Optics, Fine Mechanics and Physics, Chinese Academy of Sciences, Changchun 130033, China
2
University of Chinese Academy of Sciences, Bei**g 100049, China
3
Key Laboratory of Space-Based Dynamic & Rapid Optical Imaging Technology, Chinese Academy of Sciences, Changchun 130033, China
*
Author to whom correspondence should be addressed.
Remote Sens. 2022, 14(16), 4054; https://doi.org/10.3390/rs14164054
Submission received: 4 July 2022 / Revised: 13 August 2022 / Accepted: 16 August 2022 / Published: 19 August 2022
(This article belongs to the Special Issue Remote Sensing Applications in Ocean Observation)

Abstract

:
Various ships and submerged moving objects in the ocean are key targets of numerous remote sensors. Wake has developed into one of the key detection targets of ocean visible light remote sensing as the visible trail information left by moving objects on the ocean surface. In the situation of slow ship speed, deep draft, and the existence of air clouds and fog, the wake target signal is weak, and the signal-to-noise ratio is low due to the low reflectivity of the sea surface and the interference of the background waves on the sea surface. This paper analyzes the radiative sensitivity of visible light imaging systems for the most crucial wake detection indicator in order to address the aforementioned issues. The noise equivalent reflectance difference, which is widely used to describe radiative sensitivity in engineering, is derived and numerically simulated by establishing the imaging link model based on TDICCD. We calculated the noise equivalent reflectivity difference for eight bands commonly used in ocean remote sensing; results show that the index is generally on the order of 10 4 , and with the increase in the central wavelength, the value of noise equivalent reflectance difference also shows a downward trend and is stable within a certain value range. This research provides theoretical guidance for the engineering design of a visible spectrum imaging system for wake detection, aids in improving the imaging system’s capacity to detect weak wake signals, and provides a basis for subsequent wake detection and enhancement processing, removal of false wakes, and retrieval of ship information.

Graphical Abstract

1. Introduction

In the context of the rapid development of remote sensing technology, along with the urgent need for marine monitoring technology, remote sensing technology has a good application prospect in ocean detection. When the marine dynamic target moves, different types of wakes will be formed. Common marine wakes can be classified as three categories based on their formation mechanisms, surface wave wake, turbulent wake, and internal wave wake [1]. According to statistics, wake has the characteristics of wide range and long existence time. The interaction of the ship with the sea water, as well as the rotation of the propeller, are the main factors that influence the formation of wake. From the ship’s bow to a distance away from the stern, a clear and identifiable trace will be formed, and it has a strong scattering effect on electromagnetic waves. Therefore, wake detection can be carried out by a combination of various means. Compared with the common infrared imaging and SAR imaging methods, the image obtained by visible spectrum imaging has the advantages of high resolution and high contrast [2]. Therefore, we can obtain the wake information straight from the image and invert the dynamic target position information and its motion parameters, so as to better realize the strategic goal of wide-area and precise search on the sea surface, which has important application value.
Wake wave height is affected by sea surface wind speed and ship parameters. Due to the factors of sea surface background wave and low sea surface reflectivity, wake characteristics are relatively weak, which increases the difficulty of detection. Meanwhile, in the wake detection of visible spectrum, under the influence of environmental factors such as atmosphere and illumination and imaging system factors such as noise, the image quality after wake imaging will be further degraded, which is not conducive to the subsequent processing of the wake target. Therefore, for the visible light imaging system, how to improve imaging quality and achieve clear imaging of weak wake targets is a pressing issue that must be solved.
Recent research on wake targets is mainly based on two aspects. On the one hand, it is based on the characteristics of the wake, the establishment of different types of wake models, and the simulation of wake images [3,4,5,6,7]. On the other hand, it mainly focuses on image processing research on weak wake images, such as enhancing weak wakes through denoising and enhancement methods, so as to perform wake detection and extraction to obtain the speed, heading, and other parameters of marine moving targets [8,9,10,11]. However, if the wake target is too weak to be detected by the imaging system, that is, the wake information cannot be seen in the image, the subsequent image processing methods will not work. Therefore, in-depth research into the visible spectrum imaging system is required in order to discover the key to wake detection and ensure the existence of wake targets in image, which is one of the crucial issues that should be addressed in engineering practice.
In the design of most imaging systems in the visible spectrum, indicators such as spatial resolution and spectral resolution are often emphasized, but for wake detection, the most important indicator is radiative resolution (also known as radiative sensitivity), which refers to the minimum radiation difference that the remote sensor can distinguish when receiving spectral radiation signals, namely for the ability to distinguish between adjacent peaks and troughs in the wake. The smaller the indicator value, the stronger the ability of the imaging system to distinguish weak targets, and the higher the probability of detecting the wake target. In engineering practice, the indicator of noise equivalent reflectivity difference is often used to evaluate the imaging system in the visible spectrum [12], but this indicator has a wide range of applications; it is necessary to analyze its influencing factors in combination with the imaging mechanism of the wake target and to improve the radiative sensitivity through the parameter selection of the imaging system, so as to improve the imaging system’s ability to clearly image weak wakes.
This paper concentrates on the issue of clear imaging of the wake in the visible spectrum, and studies the imaging system in the visible spectrum mentioned above. Firstly, the typical Kelvin wake wave height is simulated by the point source disturbance model combined with the Michell thin ship theory; then, the time delay and integration charge coupled devices’ (TDICCD) imaging system’s imaging link model is established. Based on this, the indicator of noise equivalent reflectivity difference commonly used to describe radiative sensitivity in engineering is deduced and numerically simulated. Finally, the main factors affecting this indicator and the methods to improve the radiative sensitivity of the system are discussed.

2. Models and Methods

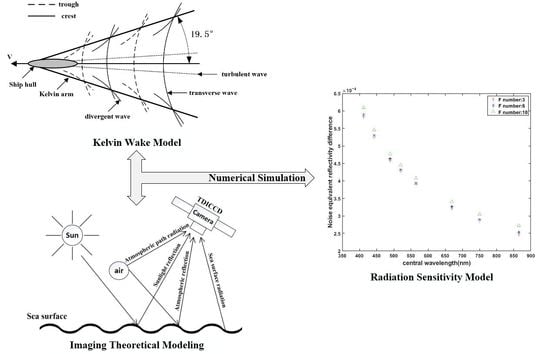
2.1. Kelvin Wake Model

Kelvin wake is one of the most common detected wakes in visible spectrum remote sensing applied to ocean monitoring, so this paper takes the Kelvin wake as an example to study. In 1887, Lord Kelvin pointed out that the trace generated by the ship is a surface gravity wave containing two types of wave systems, transverse wave and divergent wave [13]. Transverse wave and divergent wave within the wake angle of about 16 ° and 19.5 ° interfere with each other to form Kelvin arms, which are the main features of Kelvin wakes in optical images. Figure 1 shows the structure diagram of the ship’s Kelvin wake. It can be seen from the figure that the transverse wave propagates in the opposite direction of the ship’s sailing direction, while the divergent wave propagates in the vertical direction of the ship’s sailing direction.
Assuming that the ship sails along the negative x-axis at velocity U, the corresponding Kelvin wake wave height can be described as a linear superposition of many free surface waves with different propagation directions, amplitudes, and frequencies [14].
ς ( x , y ) = Re π 2 π 2 F ( θ ) exp [ i k 0 sec 2 θ ( x cos θ + y sin θ ) ] d θ
where Re is a symbol representing the real part, k 0 = g / U 2 , g is the acceleration of gravity, and F θ represents the free spectrum of the ship. The free spectrum F θ of a ship can usually be described by the Michell thin ship theory [15], which holds that the intensity of water flow generated by the ship’s transverse center point source has a certain proportional relationship with the local slope of the hull:
F θ = 2 k 0 π sec 3 θ y x , z z exp k 0 z sec 2 θ + k 0 x sec θ d x d z
where y x , z is the characteristic equation describing the shape of the hull, which is a function of the offset position x and the draft z. For the convenience of calculation, the ship is simplified as an ellipsoid.
y x , z = b 1 x 2 / l 2 d z 0 , l < x < l 0 z < d
where d is the draft depth, b is half the width of the ship, and l is half the length of the ship.
In fact, the front and rear parts of the ship have different effects on the water surface, and the stern of the ship has a certain drag effect on the water surface. Therefore, in order to be more realistic, the parameter of viscosity coefficient C is added. The integral term of Formula (1) is divided into two parts, which represent the influence of the bow and stern on the sea surface, respectively, and the part representing the stern is multiplied by the viscosity coefficient C = 0.6 to obtain the Kelvin wake wave height expression.
ς ( x , y ) = 4 b π k 0 l π 2 π 2 [ 1 exp ( k 0 d sec θ ) ] sin [ k 0 sec 2 θ ( x cos θ + y sin θ ) ] d θ ς ( x , y ) = ς ( x l , y ) + C ς ( x + l , y )
Factors including sea surface wind speed, ship speed, ship size, and draft depth affect the Kelvin wake wave height. When the Kelvin wake appears on the sea surface, its fluctuation causes the roughness of the sea surface to change, modifying the facet’s slope. The slope of an ideal reflecting surface is the result of adding the Kelvin wake slope and the wind wave slope, according to the paper by Liu et al. [16]. Therefore, the distribution of sea surface reflectivity can be obtained according to the Cox–Munk model [17]:
R = ρ P S x S k x , S y S k y 4 cos θ r cos 4 θ n
where ρ is the Fresnel reflectivity, P S x S k x , S y S k y is the probability density function of the wave slope, θ r is the reflection zenith angle, and θ n is the inclination angle of the facet.
The change in Kelvin wake wave height leads to similar reflectivity changes in the crest and trough regions of the sea surface, and the changes in reflectivity at different positions on sea surface result in changes in reflected radiation on sea surface, thus affecting the information received by the detector. The presence or absence of reflection discrepancies between crests and troughs determines whether or not the wake characteristics may be seen in the designated wake imaging region. With an increase in the reflection difference between the crest and trough, wake features become more significant. According to the paper by Song et al. [18], in which this phenomenon was analyzed, the minimum reflectance difference between the crests and troughs of the imaging area are defined as the reflectance resolution R r . In general, the reflectance resolution of wake targets is around 10 3 10 4 , which may be lower if sea conditions are complex. Therefore, for visible imaging system, how to detect the wake target with such weak radiation difference is a big problem.

2.2. Imaging Theoretical Modeling

In applications for airborne and spaceborne remote sensing, with the increasing level of remote sensing information application requirements, the imaging performance requirements of cameras are also becoming higher and higher, but the improvement of spatial resolution or spectral resolution will always be accompanied by a decrease in radiative resolution. In order to solve this problem, more high-resolution cameras choose TDICCD as their detector. The sensor’s own line-by-line energy accumulation capability can solve the issue of weak energy in a single integration, and it has obvious benefits in an ocean’s visible spectrum remote sensing with weak incident energy. As a result, the imaging link modeling process is mainly analyzed for TDICCD in this section, including its imaging principle, noise model, and imaging link analysis, which provides the basis for the derivation of the radiative sensitivity model in the next section.

2.2.1. TDICCD Imaging Principle

The full name of TDICCD is time delay and integration charge coupled devices, which is an application form of area array CCD. The number of columns equals the number of pixels in a row, and the number of rows is the integral grade M of the TDICCD. Its working principle is shown in Figure 2. In the flight direction of the imaging system, each row of CCD photosensitive pixels images the same target. By imaging the same target multiple times at different times and accumulating charges, the photosensitive ability of the pixels is improved, thereby improving the ability to identify and acquire the target. TDICCD not only enhances the exposure of signals but also increases the noise. However, since signals increase linearly, whereas noise increases nonlinearly, the SNR of the system will also increase with the increase in integral grade, thus improving the sensitivity of the imaging system.

2.2.2. Noise Model

Noise can affect the image quality of the camera. The existence of noise will not only cause the degradation of image quality and reduce its SNR but also affect the subsequent image-based wake enhancement algorithm, resulting in inaccurate wake extraction and even algorithm failure when the noise is severe. Therefore, whether to improve image quality or to ensure the accuracy of subsequent algorithms, it is necessary to reduce or eliminate noise as much as possible.
The noise in the TDICCD imaging process mainly includes photon shot noise, dark current noise, readout noise, and fixed pattern noise. However, wake detection relies on the radiation difference between the crest and trough, and since the difference between them is very small, there may be only a few gray values reflected on the image, so the suppressed fixed pattern noise may also affect subsequent image processing, so the fixed pattern noise cannot be ignored in this paper.
Photon shot noise is the inherent noise of TDICCD devices and is caused by random fluctuations in the number of photons reaching the sensor. Its expression satisfies the discrete Poisson distribution function, and its equivalent electron is:
σ s h o t = n ¯ = N s i g n a l
where n ¯ is the average charge number and N s i g n a l is the signal charge number.
Dark current noise is a quantity closely related to detector temperature. When there is no signal input, a detector with a certain temperature produces a dark current offset due to the irregular thermal motion of electrons, forming dark current noise, and its equivalent electron is:
σ d a r k = N d a r k
where N d a r k is the number of electrons in the dark current.
Readout noise mainly includes reset noise and amplifier noise, and its equivalent noise electron is:
σ r m s = N r m s K c
where N r m s is the root mean square noise; K c is the charge conversion scaling factor.
The noise that the detector pixel produces with different outputs for the same input due to the difference in the bias or response of each detector pixel is called fixed pattern noise, also called response non-uniformity, which is defined as [19]:
U = σ R R
where σ R is the mean square error of the response rate of each pixel; R is the average response rate of each pixel.
Non-uniformity is manifested as fixed pattern noise, and the fixed pattern noise of each pixel is described by the number of electrons as:
σ F P N = U N s i g n a l
Therefore, the total noise electrons in the system can be obtained as:
N = σ s h o t 2 + σ d a r k 2 + σ r m s 2 + σ F P N 2
For the imaging system using a TDICCD sensor, when the integral grade is M, the quantity of noise electrons satisfies the following relation:
N n o i s e = M σ s h o t 2 + M σ d a r k 2 + M σ r m s 2 + M σ F P N 2 = M N

2.2.3. Wake Imaging Link Model

Lighting conditions in remote sensing imaging applications can be roughly divided into two categories. One is that the sun elevation angle is appropriate and the illumination is relatively sufficient, and ideal imaging effects can be achieved by setting a reasonable integral grade or integration time; another is the weak lighting condition when the sun elevation angle is low, and some objects are drowned out by noise in the image because the radiance is too low. In order to improve the imaging sensitivity and signal-to-noise ratio under low-light conditions, it is necessary to start with the imaging link and further explore high-sensitivity imaging measures.
The four main components of the sea surface radiance that the detector obtains are the sea surface radiation itself, the scattering of background radiation to the sky by the sea, the scattering of radiation from the sea to the sun, and the radiation of the atmospheric path above the sea surface, as shown in Figure 3. The formula for the total energy of radiation reaching the detector from the sea surface can be obtained:
L = τ a ε L b b λ ; T + ρ L s k y + L s u n + L p a t h
where τ a is the atmospheric transmittance between the sea surface and detector; ε is the sea surface emissivity; ρ is the sea surface reflectivity; L b b λ ; T is the blackbody radiant exitance with temperature T and wavelength λ ; L s k y is the sky incident irradiance on the sea surface; L s u n is the sun incident irradiance on the sea surface; and L p a t h is the atmospheric path irradiance.
At room temperature, the radiant exitance of the blackbody in the wavelength range of visible light is approximately zero [20]. Therefore, radiation from the sea surface itself is ignored in the visible wavelength range. At the same time, since the magnitude of sunlight reflection is much higher than that of sky light reflection and atmospheric path radiation (the experimental data are shown in Figure A1 of Appendix A), we only consider the reflection of sunlight by the sea surface. So Equation (13) can be simplified as:
L = τ a ρ L s u n
When the light reaches the TDICCD sensor through the optical system, the illumination received by its photosensitive element is:
E T D I C C D = π τ o L 4 F 2
where F represents the F number of the optical system, and τ o is the total transmittance of the optical system.
For a multispectral camera, when the integral grade is M, the quantity of signal electrons generated by a detector in a certain spectral band is:
N M = E T D I C C D A d M T int λ c η Δ λ π h c = ρ L s u n A d τ a τ 0 M T int λ c η Δ λ 4 F 2 h c
where A d is the area of the TDICCD detector; T int is the integration time; λ c is the center wavelength; η is the quantum efficiency; Δ λ is the spectral band width; h is Planck’s constant; and c is the speed of light.
According to the noise model, the noise of M times is simulated, and the quantity of noise electrons integrated for M times is added to the quantity of electrons in the pixel signal. The whole quantity of electrons generated is:
N t o t a l = N s i g n a l + 1 M N
The calculation formula of the digital image signal obtained by the signal charge after correlated double sampling, preamplification, and analog-to-digital conversion circuit is:
D N = N t o t a l 2 n N f u l l w e l l
where n is the quantization bits and N f u l l w e l l is the full well capacity of the TDICCD.
The choice of quantization bits will affect the imaging quality. High quantization bits can reduce quantization noise and increase the grayscale range of the image, thereby increasing the grayscale difference between the crests and troughs of the wake, which is more conducive to distinguishing the wake target from the image. However, higher quantization bits will greatly increase the amount of data, so we should not blindly pursue high quantization bits. For the high reflectivity resolution required by wake detection, the quantization bit is generally 12 ∼ 14 bit.
The imaging model can be stated as follows in light of the analysis above:
D N = f ( ρ , F , M , n )
The wake imaging system’s output digital signal value D N is influenced by the F number, quantization bits n, integral grade M, and reflectivity ρ . The imaging system must be capable of distinguishing the radiation difference between the crest and trough in order to produce a clear image of the wake. The imaging system’s output signal should satisfy the following requirements when the reflectivity of the crest and trough is ρ c and ρ t :
Δ D N = D N c D N t 1
where Δ D N is the output digital signal’s difference value. When Δ D N is not less than 1, the digital response of the crest and the trough (that is, the gray value of the corresponding image) is not exactly the same. In this instance, the wakes in the image may exhibit overall characteristics of the peaks and troughs, and further image processing can amplify this difference and make it easier to detect. Δ D N typically needs to be substantially higher than 1, as a big value of Δ D N in engineering applications represents a clear wake. After determining the reflectivity of the wake, the optical system’s F number, quantization number, and integral grade can be carefully chosen to produce a clear image of the wake target.

2.3. Radiative Sensitivity Modeling

Radiometric resolution refers to the responsiveness of a remote sensor to distinguish subtle changes in the input radiation, that is, radiometric sensitivity. In visible light, near-infrared, and short-wave infrared bands, the noise equivalent reflectance difference N E Δ ρ is usually used to represent the radiative sensitivity of the remote sensor; in medium-wave and long-wave infrared, the noise equivalent temperature difference N E Δ T is usually used to represent the remote sensor radiative sensitivity [21]. Referring to the design of most visible ocean remote sensors, the requirement of noise equivalent reflectance difference is generally N E Δ ρ < 5 × 10 4 , but this requirement is mainly for ocean water color remote sensing, not for wake detection. Therefore, the noise equivalent reflectance difference of our visible spectral imaging system for wake detection is analyzed.
N E Δ ρ is the smallest detectable change in reflectivity of a ground target and is defined as the change in reflectivity of a ground target source required to produce a signal equivalent to system noise. It can be expressed as:
N E Δ ρ = ρ S / N
where ρ is the reflectivity change required to generate signal S ; S is the signal; and N is noise.
In general, the condition defined by the SNR is a target with a reflectivity ρ , which is:
S N R ρ = N ρ N n o i s e
If the signal difference between two targets with different reflectivity (that is, the crests and troughs of the wake) is less than or equal to the noise at this time, the two targets cannot be distinguished. Therefore, by calculating the SNR of the difference between two target signals with different reflectivity, it can be obtained from Equation (16):
S N R Δ ρ = N c N t N n o i s e = L s u n A d τ a τ 0 M T int λ c η Δ λ 4 F 2 h c ( ρ c ρ t ) = L s u n A d τ a τ 0 M T int λ c η Δ λ 4 F 2 h c Δ ρ
According to the above definition, we can obtain another important index, the noise equivalent reflectivity N E Δ ρ . In the above equation, if S N R Δ ρ is as small as 1, the two targets with different reflectivity cannot be distinguished. So when S N R Δ ρ equals 1, the resulting Δ ρ is N E Δ ρ . Therefore, N E Δ ρ of the multispectral camera is obtained:
N E Δ ρ M = 4 F 2 N n o i s e h c τ o τ a A d L s u n T int M λ c η Δ λ
N E Δ ρ is a key parameter. N E Δ ρ is a crucial metric to measure the capability of the visible imaging system. When detecting the same wake target, the higher the N E Δ ρ (that is, the smaller the value), the bigger the difference between the distinguishable wake crests and troughs and the better the capacity to detect the wake.

3. Simulation

3.1. Kelvin Wake Model

The ship’s Kelvin wake is simulated using the mathematical model of the Kelvin wake mentioned above, and the simulation results are displayed in Figure 4. In the simulation, it is assumed that the ship moves in the negative direction of the x-axis, the size of the ship is 80 m × 20 m, the draft is 3 m, and the simulation area is 800 m × 800 m.
Figure 4a,c are the Kelvin wakes without considering the influence of viscosity at ship speeds of 6 m/s and 10 m/s. It is obvious from the simulation results that the Kelvin wake is mainly composed of two wave systems, the transverse wave propagating in the x-direction and diffuse wave propagating in the y-direction, and both the transverse wave and the diffuse wave show significant periodic characteristics. Additionally, the wave height and wavelength of the Kelvin wake increase to a certain extent with the increase in ship speed, and the difference between the wave crest and trough becomes more obvious, which is more conducive to the detection of the imaging system. Figure 4b,d show the Kelvin wake of the ship considering the viscous effect at 6 m/s and 10 m/s speed, respectively. The figure demonstrates that the Kelvin wake consists of point sources in the bow and stern, and the superposition of the two parts of the wake will also have a certain impact on the detection. Therefore, in order to facilitate calculation, the influence of viscosity is not taken into account by the Kelvin wake model in the follow-up study of this paper.
Different ship size, speed, draft, and other parameters will produce different Kelvin wakes. The most direct effect of the Kelvin wake is to adjust the roughness of the sea surface and affect the reflectivity of the sea surface. For the detector, how to design the key parameters to achieve clear imaging of the above Kelvin wakes is another content of this paper. So, we derive and simulate the radiative sensitivity of the system.

3.2. Radiative Sensitivity Model

Through the analysis of the radiative sensitivity model, we obtain the expression of the N E Δ ρ . Then, we roughly calculate the N E Δ ρ of common spectral bands in marine remote sensing detection, which also provides a theoretical basis for the corresponding indicators of visible light imaging systems in engineering practice. The parameters required in the calculation process and the way to obtain it are shown in Figure 5.
Firstly, set the imaging parameters that need to be determined according to the parameters of the TDICCD detector, including optical system transmittance, integration time, detector area, and quantum efficiency. Table 1 shows the imaging simulation parameters; the solar irradiance outside the atmosphere in the common bands of ocean remote sensing is shown in Table 2.
MODTRAN software was used for the analysis of atmospheric transmittance. The weather model was sunny and cloudless in the experiment. The observation location was the South China Sea, and the aerosol model was the Navy aerosol model. At the observation height of 5km, the atmospheric transmittance of the visible light and near-infrared bands when the solar zenith angle is 0° and the detection system is vertically observed is shown in Figure 6.
According to the engineering practice experience, the F number of the imaging system is selected as 3, 6, and 10, the integral grade is selected as 16, and the noise electron number is simulated according to Equations (6)–(12). Formula (24) is used to calculate the noise equivalent reflectivity difference, and the calculation results are shown in Figure 7.
The figure demonstrates that the calculated noise equivalent reflectivity difference is generally in the order of 10 4 , and with the increase in the central wavelength, the value of noise equivalent reflectance difference also shows a downward trend and is stable within a certain value range. At the same time, with the decrease in the F number of the imaging system, the value of the noise equivalent reflectivity difference also decreases. Therefore, in engineering practice, under the premise of balancing the processing difficulty and cost, the F number of the imaging system should be reduced as much as possible to improve the radiative sensitivity of the system, thereby increasing the probability of detecting wake targets.

4. Discussion

According to the above calculation process, the factors affecting the radiative sensitivity of the imaging system are mainly two aspects: the optical system and the image sensor. The influencing parameters of the optical system include the system F number and the total transmittance of the optical system; the influencing parameters of the image sensor include integration time, integral grade, noise, and so on. Based on the above influencing factors, the methods to improve the radiative sensitivity of the system are discussed.

4.1. Improve the Optical System

In the previous section, the impact of the system F number on radiative sensitivity was analyzed. Reducing the system F number, that is, increasing the aperture of the optical system, can improve the energy converging on the image plane, thereby improving the radiative sensitivity of the system. However, the increase in aperture will increase the development cost and processing difficulty of the system, so in practical application, the system aperture is usually determined first, and the system is improved by improving other influencing factors. The total transmittance of an optical system is typically a function of the lens’s transmittance, the transmittance of semi-reflecting and semi-transmitting, and the transmittance of the neutral variable filter in the center of the field of view, which can be improved by optimizing the lens material and coating. At the same time, it is also necessary to put forward requirements for the optical–mechanical structure design of the system to reduce the influence of stray light in the system.

4.2. Reduce Camera Noise

According to the analysis in Section 2.2.2, the size of the noise is closely related to the number of incident photons. Assuming that the inhomogeneity of the system is 1 % , Figure 8 shows the change in the RMS electron number of noise when incident photons are different.
Figure 8 shows that when there are few incident photons, the system noise is mainly determined by readout and dark current noise. They have nothing to do with the number of incident photons and are mainly determined by the electronic parameters of the detector. When the number of incident photons is large, the noise is mainly determined by the photon shot noise, and other radiation sources besides target radiation should be reduced as far as possible. When the number of incident photons is large, the fixed graphic noise is the main influence, and it is particularly important to reduce the pixel non-uniformity.
For the detection of marine targets, the overall irradiance of the sea surface is low, so it is necessary to adjust the parameters such as the integral grade and gain to make the irradiance obtained by the imaging system within a high range to meet the imaging needs. Therefore, the number of incident photons in the system will be in a high range, and the fixed pattern noise of the system cannot be ignored. It is necessary to reduce the non-uniformity of the imaging system as much as possible through the radiometric calibration and subsequent image processing and provide preprocessing operations for the recognition and enhancement of wake images.

4.3. Increase the Pixel Area

The sensitivity of the camera is also proportional to the quantum efficiency of the detector and the pixel area. The quantum efficiency is difficult to improve due to the influence of the semiconductor material and the wavelength of the incident light. Therefore, the pixel area can be indirectly increased by the binning method to improve the sensitivity of the detector. A binning operation on multiple pixels increases the total number of signals of merged pixels, which is more conducive to detecting wake targets under weak light conditions. Meanwhile, pixel binning also improves the image SNR. The conventional imaging mode and the 2 × 2 binning imaging mode for pixels are shown in Figure 9. When the binning operation is used for both directions at the same time, the proportion of the image remains unchanged, but the spatial resolution will decrease accordingly.
However, there are some limitations with pixel binning. Although pixel binning can improve the radiative resolution under some conditions, it also decreases the signal level. Pixel binning is used in high-resolution sensors, which can improve the radiative sensitivity and will not have a big impact on the image quality when the signal level decreases. In the case of moderate resolution sensors or even lower, pixel binning may have a big impact on the image quality when the signal level decreases, and it is difficult to obtain the wake information through subsequent image processing. Therefore, pixel binning is not suitable for all sensors and needs to be considered comprehensively.
In the above discussion section, some methods to improve the radiation sensitivity are proposed by analyzing the optical system and image sensor. However, the difficulty and cost should be considered comprehensively in the design of the imaging system. Therefore, we selected some methods in the above discussion which can be used in the imaging system design of wake detection. First, the F number of the optical system can be increased. Since the focal length of the system remains unchanged, increasing the F number of the system is equivalent to increasing the aperture of the system. Then, after the CCD sensor is selected, the non-uniformity of the imaging system can be corrected to reduce its total noise. Finally, the binning operation can also be performed on its pixels to achieve the purpose of improving the radiative sensitivity of the system.
In addition, there is a mutual constraint between radiative resolution and spatial resolution. Spatial resolution is the smallest pixel that is distinguishable on the ground. Generally speaking, when the spectral resolution remains the same, the minimum resolvable pixel increases with the increasing instantaneous field of view, while the spatial resolution decreases. At the same time, the greater the instantaneous radiation energy, the stronger the ability to detect the weak energy difference, namely, the higher the radiative resolution. In order to improve the radiative resolution, it is necessary to sacrifice part of the spatial resolution, so as to improve the wake detection capability of the system. Therefore, in the research and application of remote sensing technology, it is necessary to find a balance between high spatial resolution and high radiative resolution, in order to achieve the desired effect.

5. Conclusions

In this paper, an analysis of the radiative sensitivity of an imaging system in the visible spectrum is carried out. The Kelvin wake wave height is simulated by the point source disturbance model combined with the Michell thin ship theory. The TDICCD imaging system’s imaging link model is established. Based on this, the noise equivalent reflectivity difference is deduced, and numerical simulation is carried out. Results show that this indicator is generally in the order of 10 4 , and with the increase in the central wavelength, the value of the indicator shows a downward trend and is stable within a certain value range. The main factors affecting this index and the methods to improve the radiative sensitivity of the system are discussed, which can be used to optimize and improve the system in the future. This research helps to improve the ability of the visible spectrum imaging system to detect weak wake signals and paves the way for subsequent wake detection and enhancement processing, removal of false wakes, and retrieval of ship information. It should be noted that this paper mainly discussed and analyzed the Kelvin wake as an example. The noise equivalent reflectance difference model is also applicable to turbulent wake, vortex, and internal wave wake, and different types of wakes can be calculated separately in the future.

Author Contributions

Conceptualization, S.Y. and H.Q.; methodology, S.Y. and H.Q.; software, S.Y.; writing—original draft preparation, S.Y. and H.Q.; writing—review and editing, S.Y., H.Q., S.T., L.Z. and X.W.; funding acquisition, H.Q. All authors have read and agreed to the published version of the manuscript.

Funding

This research was funded by the National Natural Science Foundation of China under Grant 62075219 and the Key Technological Research Projects of Jilin Province, China under Grant 20190303094SF.

Data Availability Statement

Not applicable.

Acknowledgments

The authors would like to thank the anonymous reviewers for their valuable comments.

Conflicts of Interest

The authors declare no conflict of interest.

Abbreviations

The following abbreviations are used in this manuscript:
TDICCDTime delay and integration charge coupled devices
SNRSignal-to-noise ratio
N E Δ ρ The noise equivalent reflectance difference
N E Δ T The noise equivalent temperature difference

Appendix A

We calculated the three kinds of radiation by MODTRAN software, and the calculation results are as follows:
Figure A1. Sky and solar radiation: (a) solar irradiance; (b) the radiance of sky background radiation; (c) the radiance of atmospheric path.
Remotesensing 14 04054 g0a1

References

  1. Tunaley, J.; Buller, E.; Wu, K.; Rey, M. The simulation of the SAR image of a ship wake. IEEE Trans. Geosci. Remote Sens. 1991, 29, 149–156. [Google Scholar] [CrossRef]
  2. Liu, Y.; Deng, R. Ship wakes in optical images. J. Atmos. Ocean. Technol. 2018, 35, 1633–1648. [Google Scholar] [CrossRef]
  3. Xue, F.; **, W.; Qiu, S.; Yang, J. Wake Features of Moving Submerged Bodies and Motion State Inversion of Submarines. IEEE Access 2020, 8, 12713–12724. [Google Scholar] [CrossRef]
  4. Xue, F.; **, W.; Qiu, S.; Yang, J. Airborne optical polarization imaging for observation of submarine Kelvin wakes on the sea surface: Imaging chain and simulation. ISPRS J. Photogramm. Remote Sens. 2021, 178, 136–154. [Google Scholar] [CrossRef]
  5. Zilman, G.; Zapolski, A.; Marom, M. On detectability of a ship’s Kelvin wake in simulated SAR images of rough sea surface. IEEE Trans. Geosci. Remote Sens. 2014, 53, 609–619. [Google Scholar] [CrossRef]
  6. Sun, X.; Cai, M.; Wang, J.; Liu, C. Numerical Simulation of the Kelvin Wake Patterns. Appl. Sci. 2022, 12, 6265. [Google Scholar] [CrossRef]
  7. Ahmadibebi, A.; Jones, B.; Shirkhodaie, A. Physics-based wake modeling for marine vehicles activity recognition based on simulated synthetic aperture radar. In Proceedings of the SPIE, Ocean Sensing and Monitoring XIV, Orlando, FL, USA, 3 April–13 June 2022; Volume 12118, pp. 107–119. [Google Scholar]
  8. Zhao, H.; Ji, Z.; Zhang, Y.; Sun, X.; Song, P.; Li, Y. Mid-infrared imaging system based on polarizers for detecting marine targets covered in sun glint. Opt. Express 2016, 24, 16396–16409. [Google Scholar] [CrossRef] [PubMed]
  9. Song, M.; Qu, H.; Zhang, G.; Tao, S.; **, G. variational model for sea image enhancement. Remote Sens. 2018, 10, 1313. [Google Scholar] [CrossRef]
  10. Zhu, S.; Chen, Z.; Kang, L. Satellite-borne SAR low-contrast signals wave wake image enhancement based on a bilateral rapid filtering visualization algorithm. In Proceedings of the 2019 IEEE International Conference on Signal Processing, Communications and Computing (ICSPCC), Dalian, China, 20–22 September 2019; pp. 1–3. [Google Scholar]
  11. Srivastava, R.; Christmas, J. Analysis of Sea Waves and Ship Wake Detection. In Proceedings of the OCEANS 2022-Chennai, Chennai, India, 21–24 February 2022; pp. 1–10. [Google Scholar]
  12. Wang, J.; Wang, Y.; Li, C. Noise model of hyperspectral imaging system and influence on radiation sensitivity. J. Remote Sens. 2010, 14, 607–620. [Google Scholar]
  13. Kelvin, L. On ship waves. Proc. Inst. Mech. Engrs. 1887, 38, 409–434. [Google Scholar]
  14. Oumansour, K.; Wang, Y.; Saillard, J. Multifrequency SAR observation of a ship wake. IEEE Proc. -Radar Sonar Navig. 1996, 143, 275–280. [Google Scholar] [CrossRef]
  15. Wang, H. Spectral comparisons of ocean waves and Kelvin ship waves. In Proceedings of the Seventh Offshore Mechanics and Arctic Engineering Symposium, New York, NY, USA; 1988; Volume 2, pp. 253–261. [Google Scholar]
  16. Liu, Y.; Deng, R.; Zhao, J. Simulation of Kelvin wakes in optical images of rough sea surface. Appl. Ocean. Res. 2019, 89, 36–43. [Google Scholar] [CrossRef]
  17. Cox, C.; Munk, W. Measurement of the roughness of the sea surface from photographs of the sun’s glitter. Josa 1954, 44, 838–850. [Google Scholar] [CrossRef]
  18. Song, M.; Wang, S.; Zhao, P.; Chen, Y.; Wang, J. Modeling Kelvin wake imaging mechanism of visible spectral remote sensing. Appl. Ocean. Res. 2021, 113, 102712. [Google Scholar] [CrossRef]
  19. Wang, Y. Influence of Infrared Detector Response Nonuniformity on System Sensitivity. Infrared Laser Eng. 2006, 3, 258–261. [Google Scholar]
  20. Wu, X.; Smith, W.L. Emissivity of rough sea surface for 8–13 µm: Modeling and verification. Appl. Opt. 1997, 36, 2609–2619. [Google Scholar] [CrossRef] [PubMed]
  21. Han, X. Calculation of radiation sensitivity for spaceborne multispectral scanner. Infrared Res. (Ser. A) 1988, 3, 213–217. [Google Scholar]
Figure 1. Kelvin wake diagram.
Remotesensing 14 04054 g001
Figure 2. TDICCD imaging principle.
Remotesensing 14 04054 g002
Figure 3. Ocean radiative transfer model.
Remotesensing 14 04054 g003
Figure 4. Simulation results of Kelvin wake under different conditions: (a) U = 6 m/s, viscous effects are not considered; (b) U = 6 m/s, considering the viscous effect; (c) U = 10 m/s, viscous effects are not considered; (d) U = 10 m/s, considering the viscous effect.
Remotesensing 14 04054 g004aRemotesensing 14 04054 g004b
Figure 5. Calculation process of noise equivalent reflectivity difference.
Remotesensing 14 04054 g005
Figure 6. Simulation results of atmospheric transmittance.
Remotesensing 14 04054 g006
Figure 7. The noise equivalent reflectivity difference in different bands.
Remotesensing 14 04054 g007
Figure 8. The total noise electrons in the system.
Remotesensing 14 04054 g008
Figure 9. Conventional imaging and binning imaging schematic diagram.
Remotesensing 14 04054 g009
Table 1. Fixed Simulation Parameters.
ParametersValue
Optical system total transmittance0.7
Detector pixel size ( μ m )17.5 × 17.5
Pixel number3072
Quantum efficiency0.5
Integration time (ms)4
Table 2. The solar irradiance outside the atmosphere in different bands.
Central Wavelength (nm)Irradiance ( W m 2 μ m 1 )
4121760
4431877
4901950
5201933
5651705
6701456
7501235
865958
Publisher’s Note: MDPI stays neutral with regard to jurisdictional claims in published maps and institutional affiliations.

