1. Introduction
Three-dimensional (3D) point cloud data refers to a set of points defined by the X, Y, and Z in the geo-coordinate system [
1], which can be obtained from various sources such as laser scans, images, and videos based on specific equipment and technologies [
2,
3,
4]. Three-dimensional point cloud data is capable of representing the external surfaces of objects with geometric details and texture, which can be imported and processed by computers, providing effective support for digital storage as well as further analysis. Cultural heritage, such as historical buildings, archaeological sites, and stone carvings, etc., are objects with complex geometries and the historical memory of mankind. It is critical to reconstruct, protect and restore cultural heritage in digital forms and sustain them in the long run, and this is where 3D point cloud data proves to be a reliable data source [
5,
6,
7]. Applying 3D point cloud data in the cultural heritage field has gained more and more attention in academic and industry communities since 2000 [
8,
9,
10]. In recent years, it has become a multidisciplinary field that interacts with a number of disciplinaries, covering art, archaeology, computer science, environmental science, applied physics, and chemistry analysis [
11,
12,
13,
14]. As such, it is necessary to provide insightful information for those interested in investigating how this field has evolved over the past two decades.
Some scholars have conducted literature reviews and surveys on specific topics through organizing the related work of 3D point cloud in the cultural heritage field in a methodology-based way. For example, Cheng et al. (2018) [
15] presented a comprehensive review of LiDAR data registration in photogrammetry and remote sensing. It reveals that multi-angle and multi-scale data obtained from various types of LiDAR hardware plays an essential role in diverse applications serving cultural heritage protection. Tobiasz et al. (2019) [
16] surveyed the state-of-the-art documentation, management, and sustainability techniques in cultural heritage. Moyano et al. (2021) [
17] reviewed the historical building information modeling (HBIM) process to extract geometries of cultural heritage from the point cloud to create digital twins, particularly for the archaeological and architectural heritage. Santos et al. (2022) [
18] summarized existing work on historical timber structures using HBIM, focusing on various geometric surveying and 3D modeling methods and nongeometric information used for conservation, testing, and monitoring. However, those reviews and surveys do not conduct a comprehensive, systematic, or quantitative analysis to reveal the research topics, research trends and patterns, and future research directions in the domain of utilizing 3D point cloud for cultural heritage.
Scientometrics is defined as the “quantitative study of science, communication in science and science policy” [
19], which is regarded as the science of science by some scholars. Fortunato et al. (2018) [
20] explained “science of science” as using large-scale data on the production of science to search for universal and domain-specific patterns. The scientometric analysis used for literature review is a branch of informatics that quantitatively analyzes and maps patterns in scientific literature in order to understand the research themes, emerging trends, and the knowledge structure of a research. Zhao et al. (2017) [
21] conducted a scientometric review of building information modeling (BIM) research between 2005–2016, providing researchers and practitioners with an in-depth understanding of the status and trend of BIM research worldwide. Martinez et al. (2019) [
22] conducted a scientometric review of the articles published between 1999 and 2019 concerning the computer vision techniques applied for construction to provide support for future research efforts. Rashidi et al. (2020) [
23] quantitatively analyzed the research patterns in the modern bridge monitoring field, consisting of dominated sub-fields, co-occurrence of keywords, network of researchers and their institutions within the last decade. Balz (2021) [
24] presented in-depth scientometric analysis of the full texts of all papers published in MDPI’s Remote Sensing between 2009 and 2021, revealing distinctive styles and writing patterns, trends in publications, readability of abstracts and papers, and institutional co-authorship worldwide.
As such, we explore the literature concerning 3D point cloud used in the cultural heritage field from the Web of Science (WoS) database, which returns a large number of publications in English including title, author, abstract, keyword, journal, and citation information. The non-English publications not included in the bibliographical database are out of scope for our scientometric exploration, which may introduce a bias among the academic range of publishes we are surveying. The publications in other languages and databases can be further added for a larger-scale analysis. The co-occurrence and co-citation relationship exist between different publications. Such information lays a solid information for composing multi-type networks of various entities, such as keyword co-occurrence and document co-citation, which are sufficient to represent the intellectual landscape of a scientific field [
25]. Those networks can be visualized by knowledge map**, which is an emerging approach and the knowledge structure for literature analysis. It is helpful for researchers and engineers, as well as business investigators, to uncover and understand the hot topics, multidisciplinary interaction patterns, develo** trends, academic cooperation between scholars and countries, etc., providing a holistic and comprehensive portrait for a research domain. In this study, we use CiteSpace [
26], a scientometric analysis and visualization software, to make a co-citation and co-occurrence analysis of those studies related to 3D point cloud data in the field of cultural heritage.
The main objectives of this study focus on making a term (i.e., key noun phrases) co-occurrence network analysis to acquire hot topics, making a document co-citation network analysis to identify key literature, making a collaborative country network analysis to reflect national cooperation, and making a category co-occurrence network analysis to explore the interdisciplinary intersection in the domain of 3D point cloud data for cultural heritage.
There is no scientometric network-based review of recent studies on 3D point cloud data for cultural heritage to investigate the hot topics and general development trends of this domain through collecting and analyzing the qualified journal publications from WoS. Our work fills this gap and contributes to the identification of emerging hotspots, research structure and research evolution of this domain through constructing the scientometric networks based on those WoS publications and discovering the clusters and bursting entities from scientometric networks. The scientometric analysis results not only provide scholars (architects, archaeologists, art historians, geographers, etc.) with a structured view on state-of-art literature, but also aids them to capture the research hotspots, landmark literature, as well as the changes of research themes over time in an efficient way. Such information is critical for scholars, especially for those beginners who are new to this domain.
The rest of this paper is organized as follows.
Section 2 introduces the background knowledge concerning the technological and application aspects of 3D point cloud data in the cultural heritage field.
Section 3 presents the methodological framework for reviewing the relevant studies and provides an overview of CiteSpace software as an analysis and visualization tool.
Section 4 analyzes and discusses the results. Finally, the main conclusions are drawn in
Section 5.
3. Methodology
This section presents our data collection strategy, visualizes new trends, analyzes general development, and identifies roles with significant influence in employing 3D point cloud data for cultural heritage.
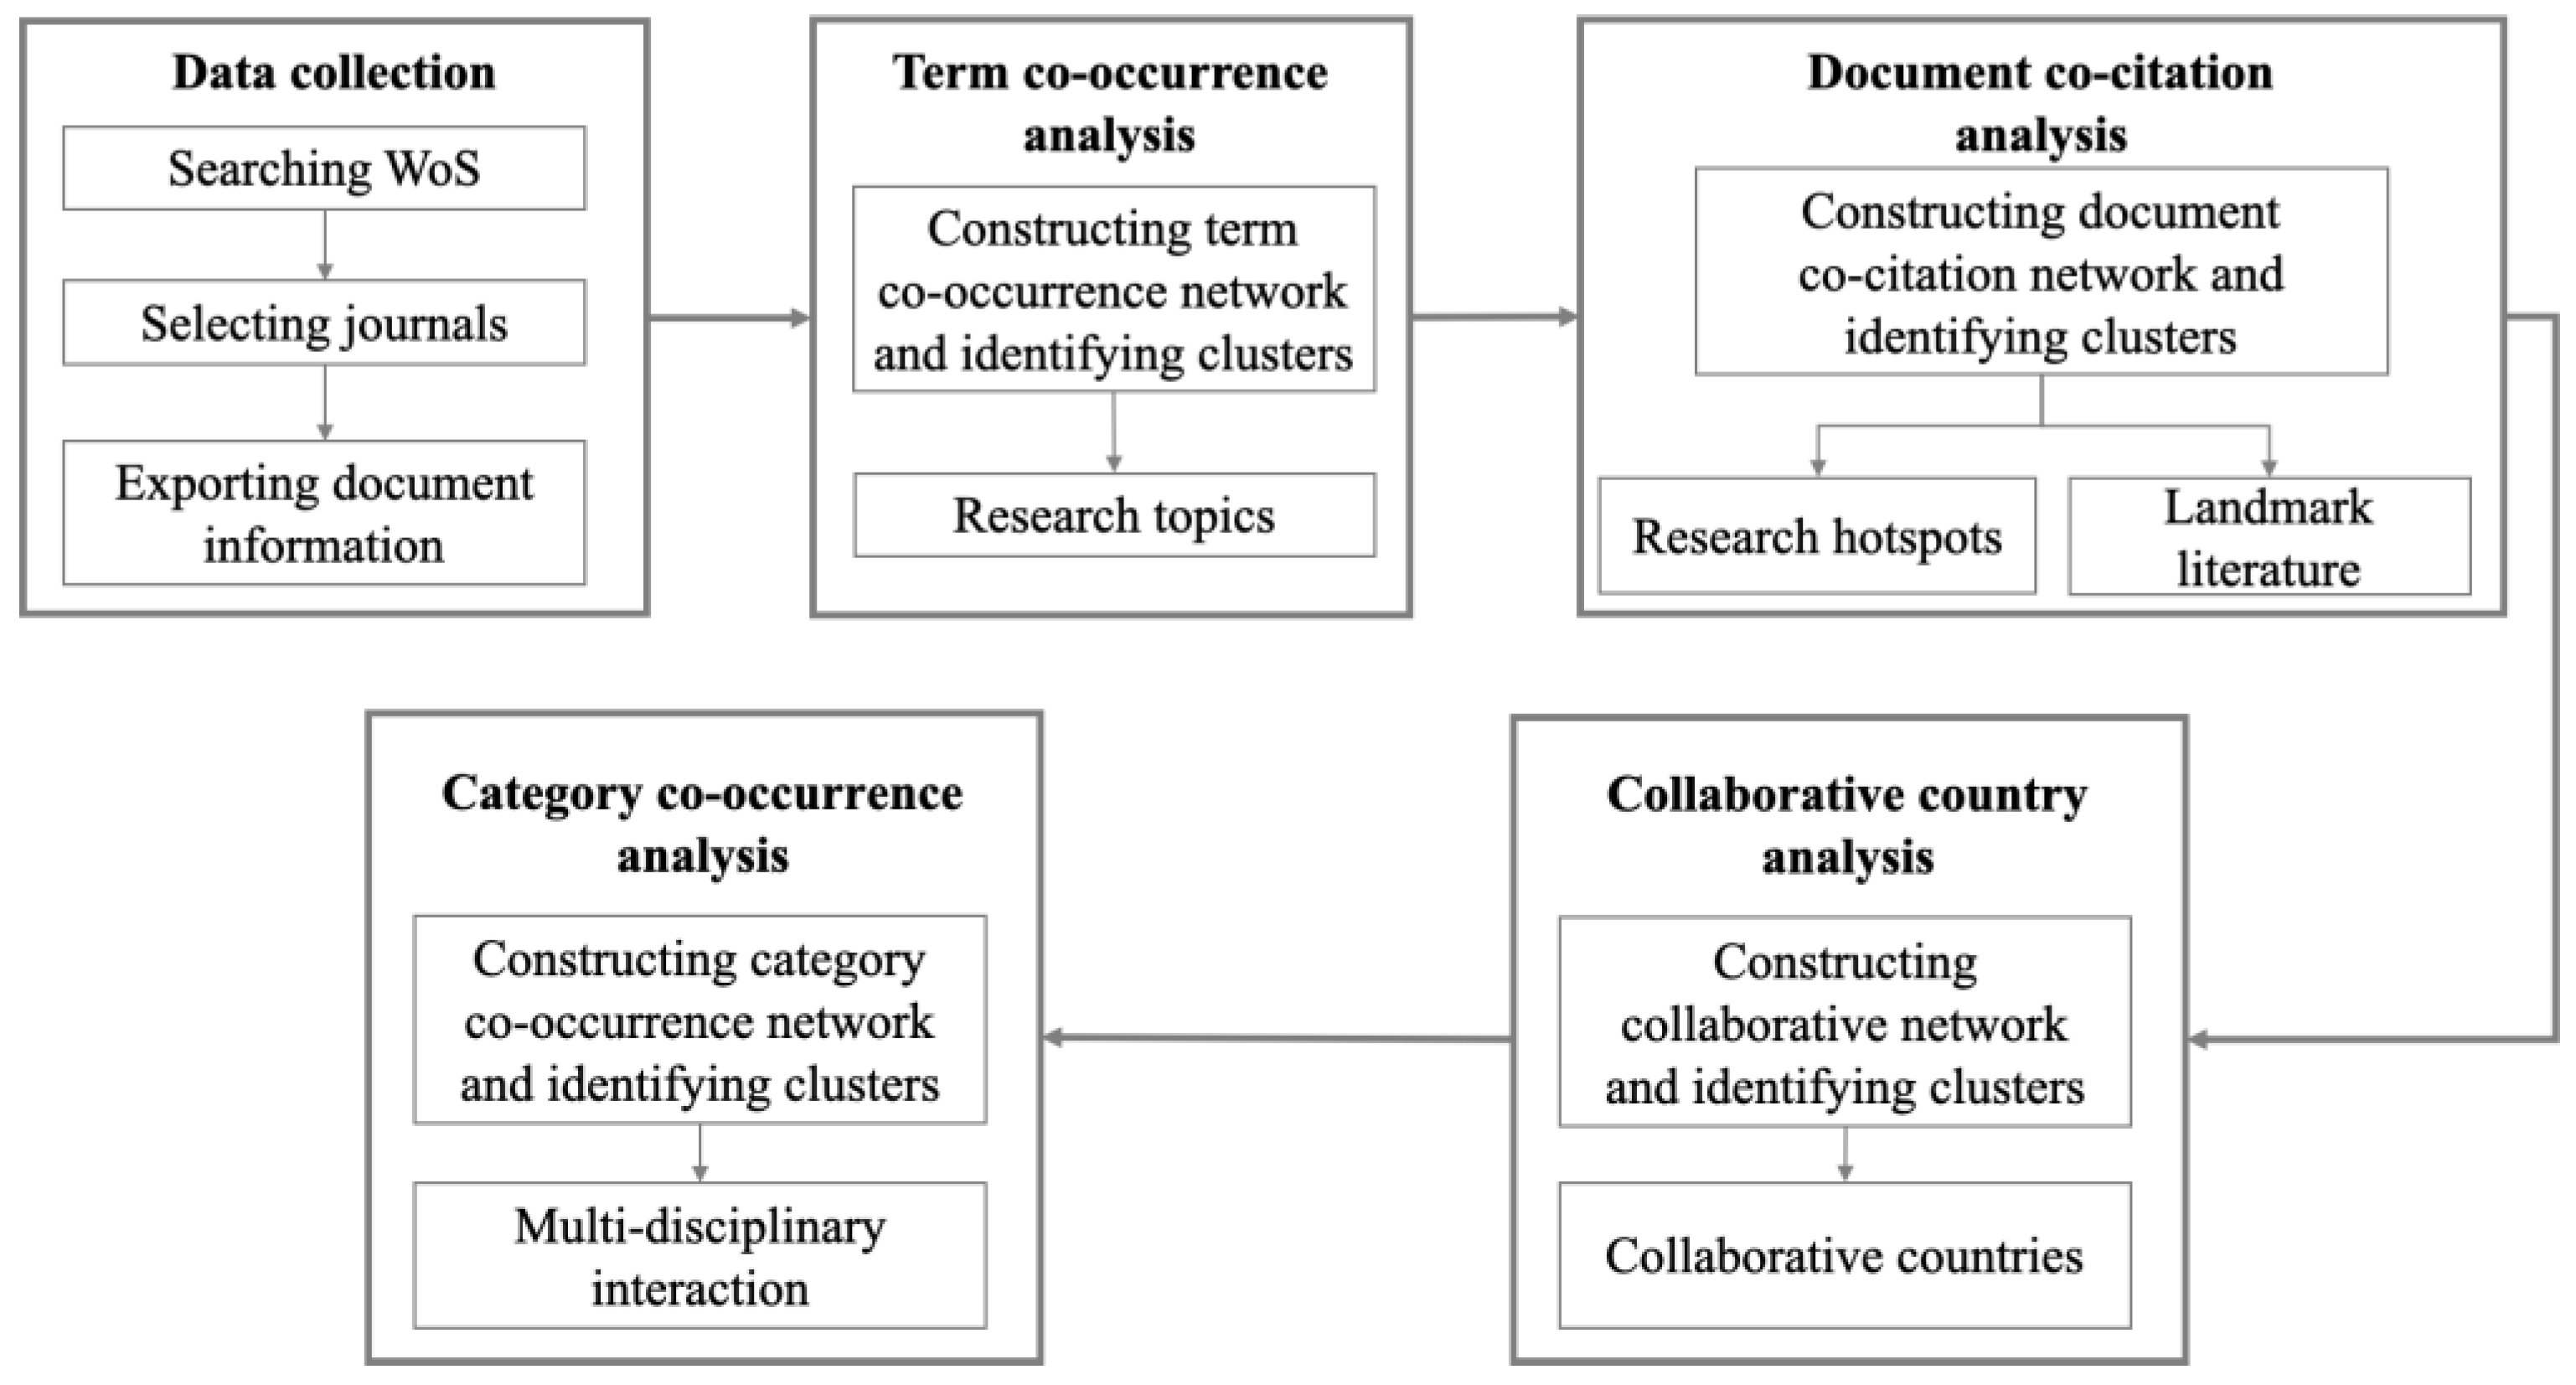
Figure 1 demonstrates the overall framework for the scientometric analysis of the literature in this domain, which mainly includes data collection, term co-occurrence analysis, document co-citation analysis, national collaboration analysis and category co-occurrence analysis.
First, we collected qualified literature from the WoS using appropriate queries, e.g., topics and journals. The obtained literature was then processed by a series of analysis and visualization using CiteSpace software. We conducted term (i.e., noun phrases included in the title, abstract, keywords and keywords plus) co-occurrence analysis through a knowledge network to identify the main clusters, representing a wide range of research topics in the domain of 3D point cloud for cultural heritage.
Landmark articles were identified through the document co-citation network, and the research basis and research hotspots that scholars are interested in were determined according to the clustering results. Moreover, the collaborative country network and category co-occurrence network were established to indicate the national collaboration and multidisciplinary intersection, respectively. More details regarding each are elaborated in the following sections.
3.1. Data Collection
In this work, we selected the high-quality papers that were published in journals rather than those published in conference proceedings as our research data. This is because the content of conference papers is limited to the themes of the conferences, which usually leads to a surge of papers in certain research directions in a short period of time. Such bursts in a short time undermines the balance of the survey data. As such, we only selected journal papers to review the research dynamics regarding 3D point cloud data used in the cultural heritage field.
The paper data were retrieved from three databases on the Thomson Reuters Web of Science (WoS) on 15 August 2022, including Science Citation Index Expanded (SCI-Expanded), Social Sciences Citation Index (SSCI), Arts & Humanities Citation Index (A&HCI). A set of topics combined with “AND” and “OR” logic was selected for querying the literature to be reviewed. Specifically, the keywords and their logic used in this work are ((point cloud*)) AND ((heritage*) OR (relic*) OR (historic building*) OR (ancient*) OR (architectural*) OR (archaeological*)), where “AND” means the topics occur at the same time in a paper, “OR” means at least one of those topics occur, and “*” represents any characters. For instance, the papers including “point cloud” and “heritage” and the papers including “point cloud” and “historic buildings” can be returned by the above-mentioned query. As a result, a total of 349 qualified journal papers (article, early access, and review article) included in the WoS were obtained, covering a wide range of journals with the scope of cultural heritage as well as remote sensing and surveying and map**. Among the search results, journals with more than or equal to three related articles were selected.
Table 1 lists the selected journals and the number of related papers included by each journal, which can be used as an indicator illustrating the closeness of the journal scope to 3D point cloud for cultural heritage. For example, the journals named “
Remote Sensing”, “
ISPRS International Journal of Geo-Information” and “
Journal of Cultural Heritage” include more related papers, revealing researchers in the surveyed field have more intention to publish their work in those journals.
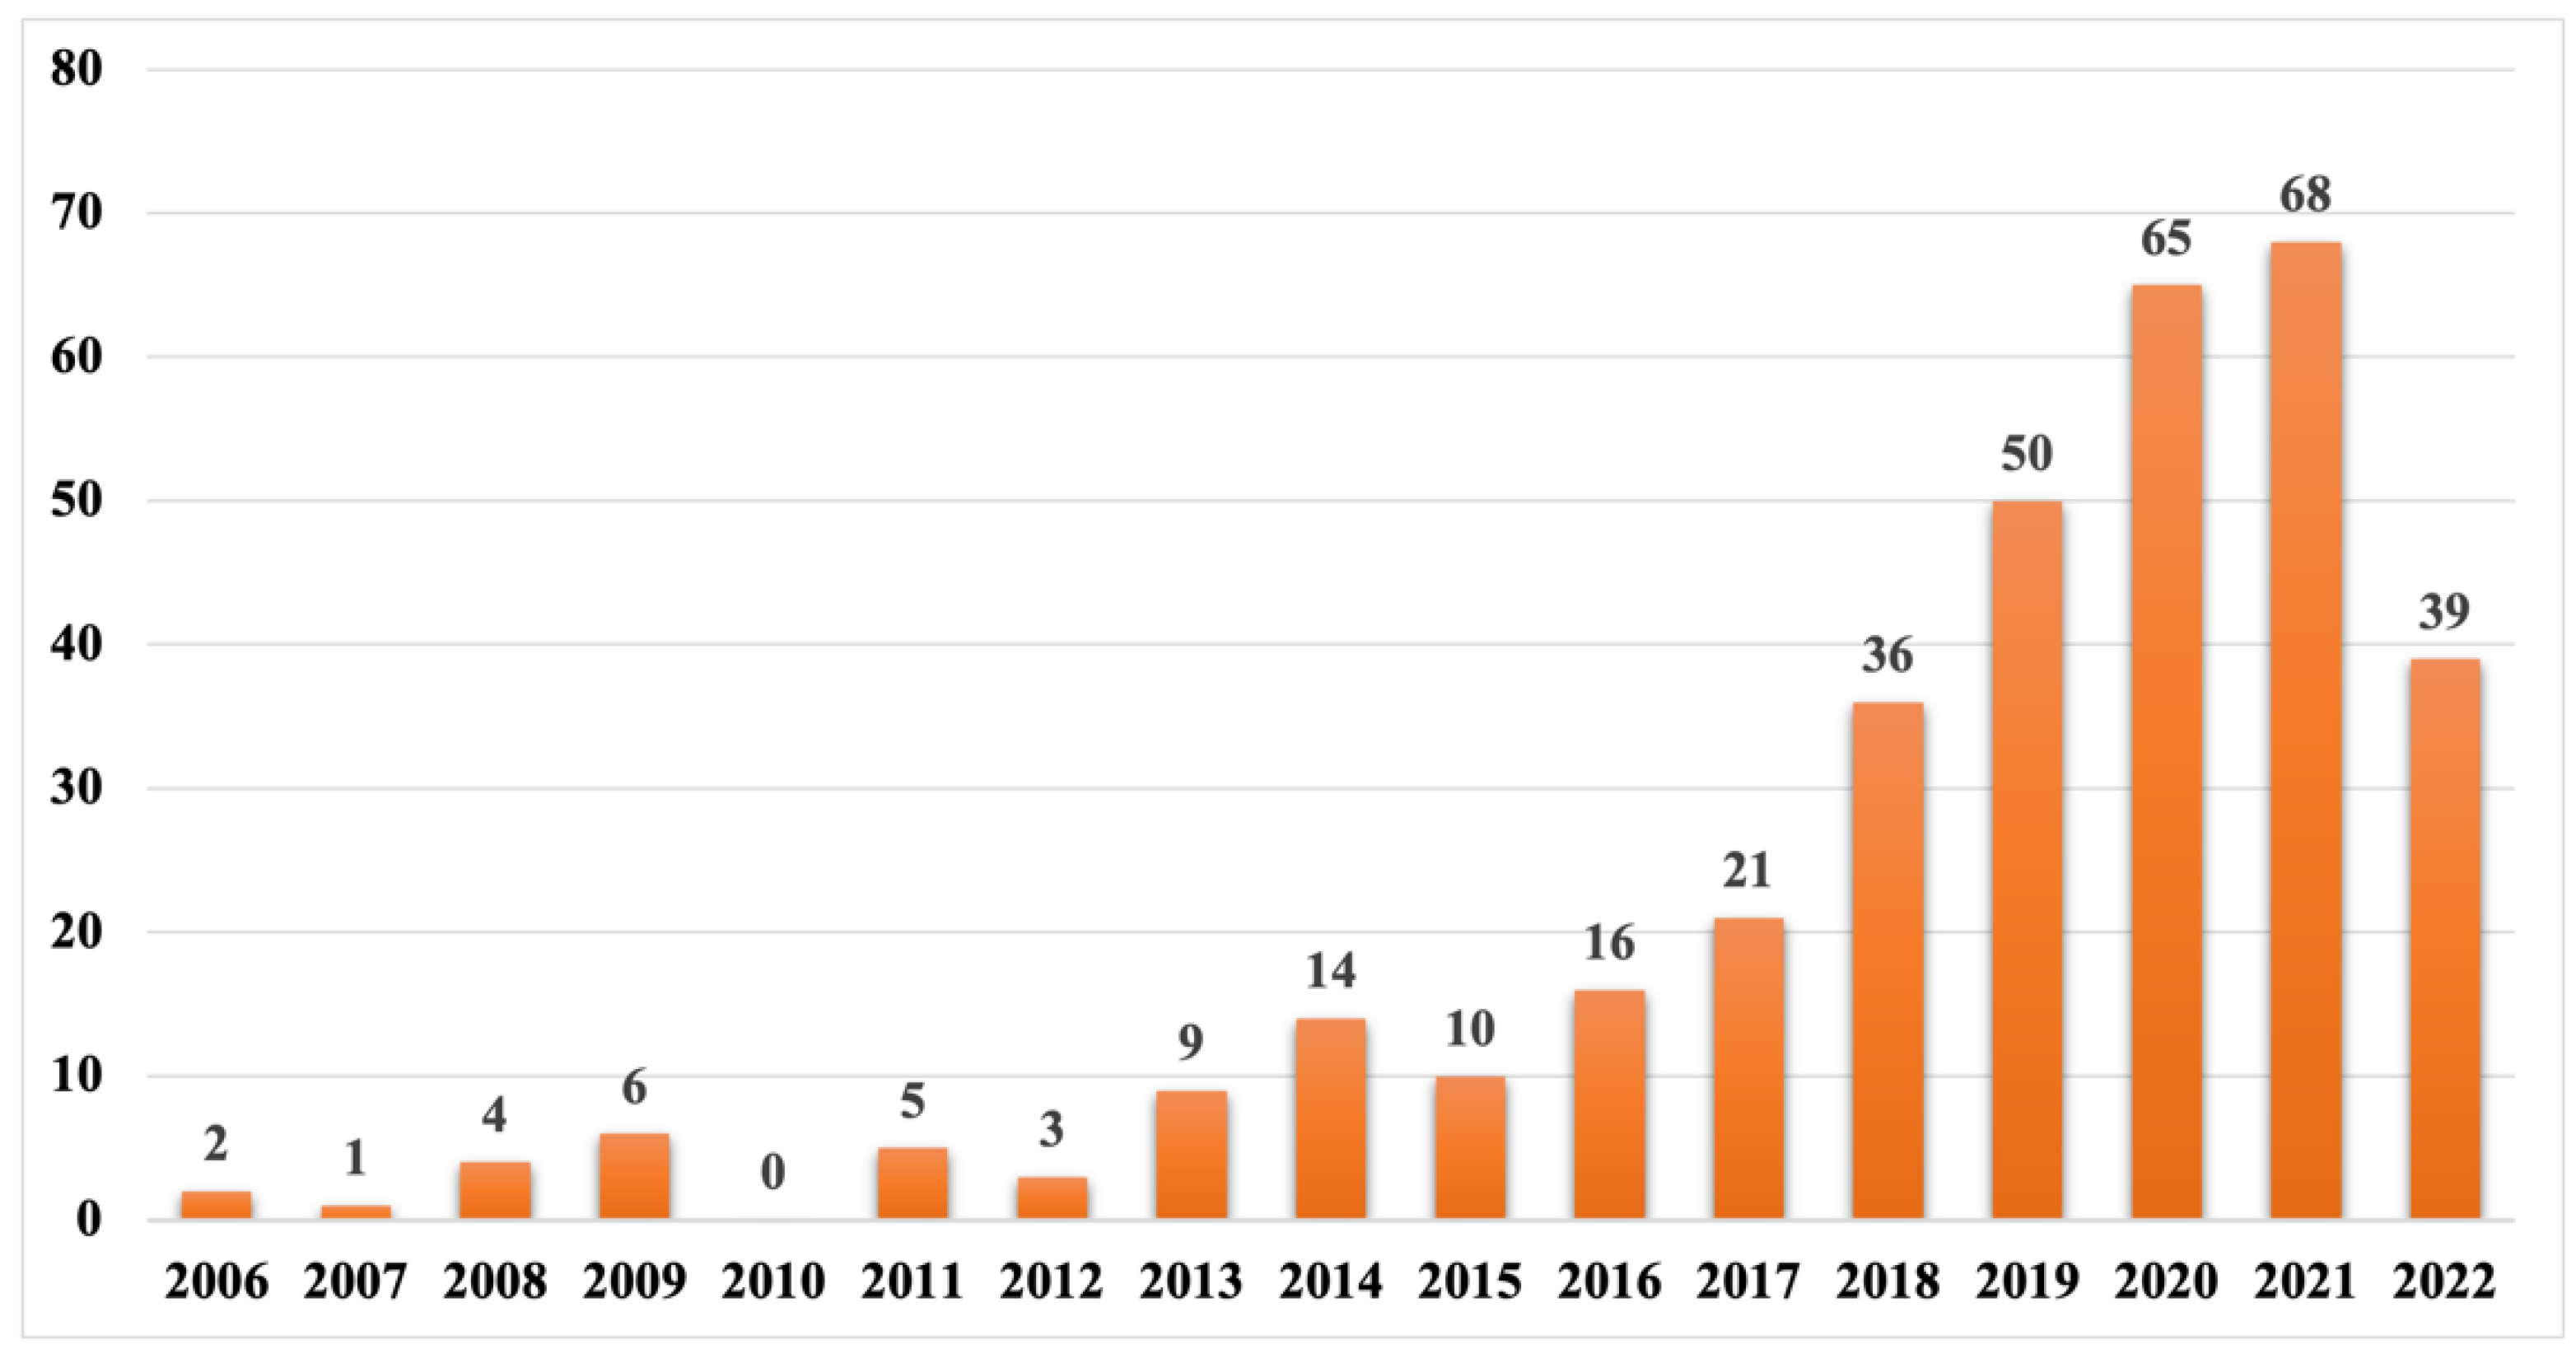
Besides that, we also counted the number of papers published yearly to investigate general research development. As shown in
Figure 2, the first journal paper related to 3D point cloud and cultural heritage was published in 2006 [
63]. Since then, the yearly number of published papers follows an increasing trend, especially after the year of 2016. There is a decrease from 2021 to 2022 since only journal papers published before September 2022 were counted in this survey. The ever-increasing pattern indicates that researchers have shown more and more interest in exploring the capability of leveraging 3D point cloud for cultural heritage and this research direction has gained more and more attention during the past two decades.
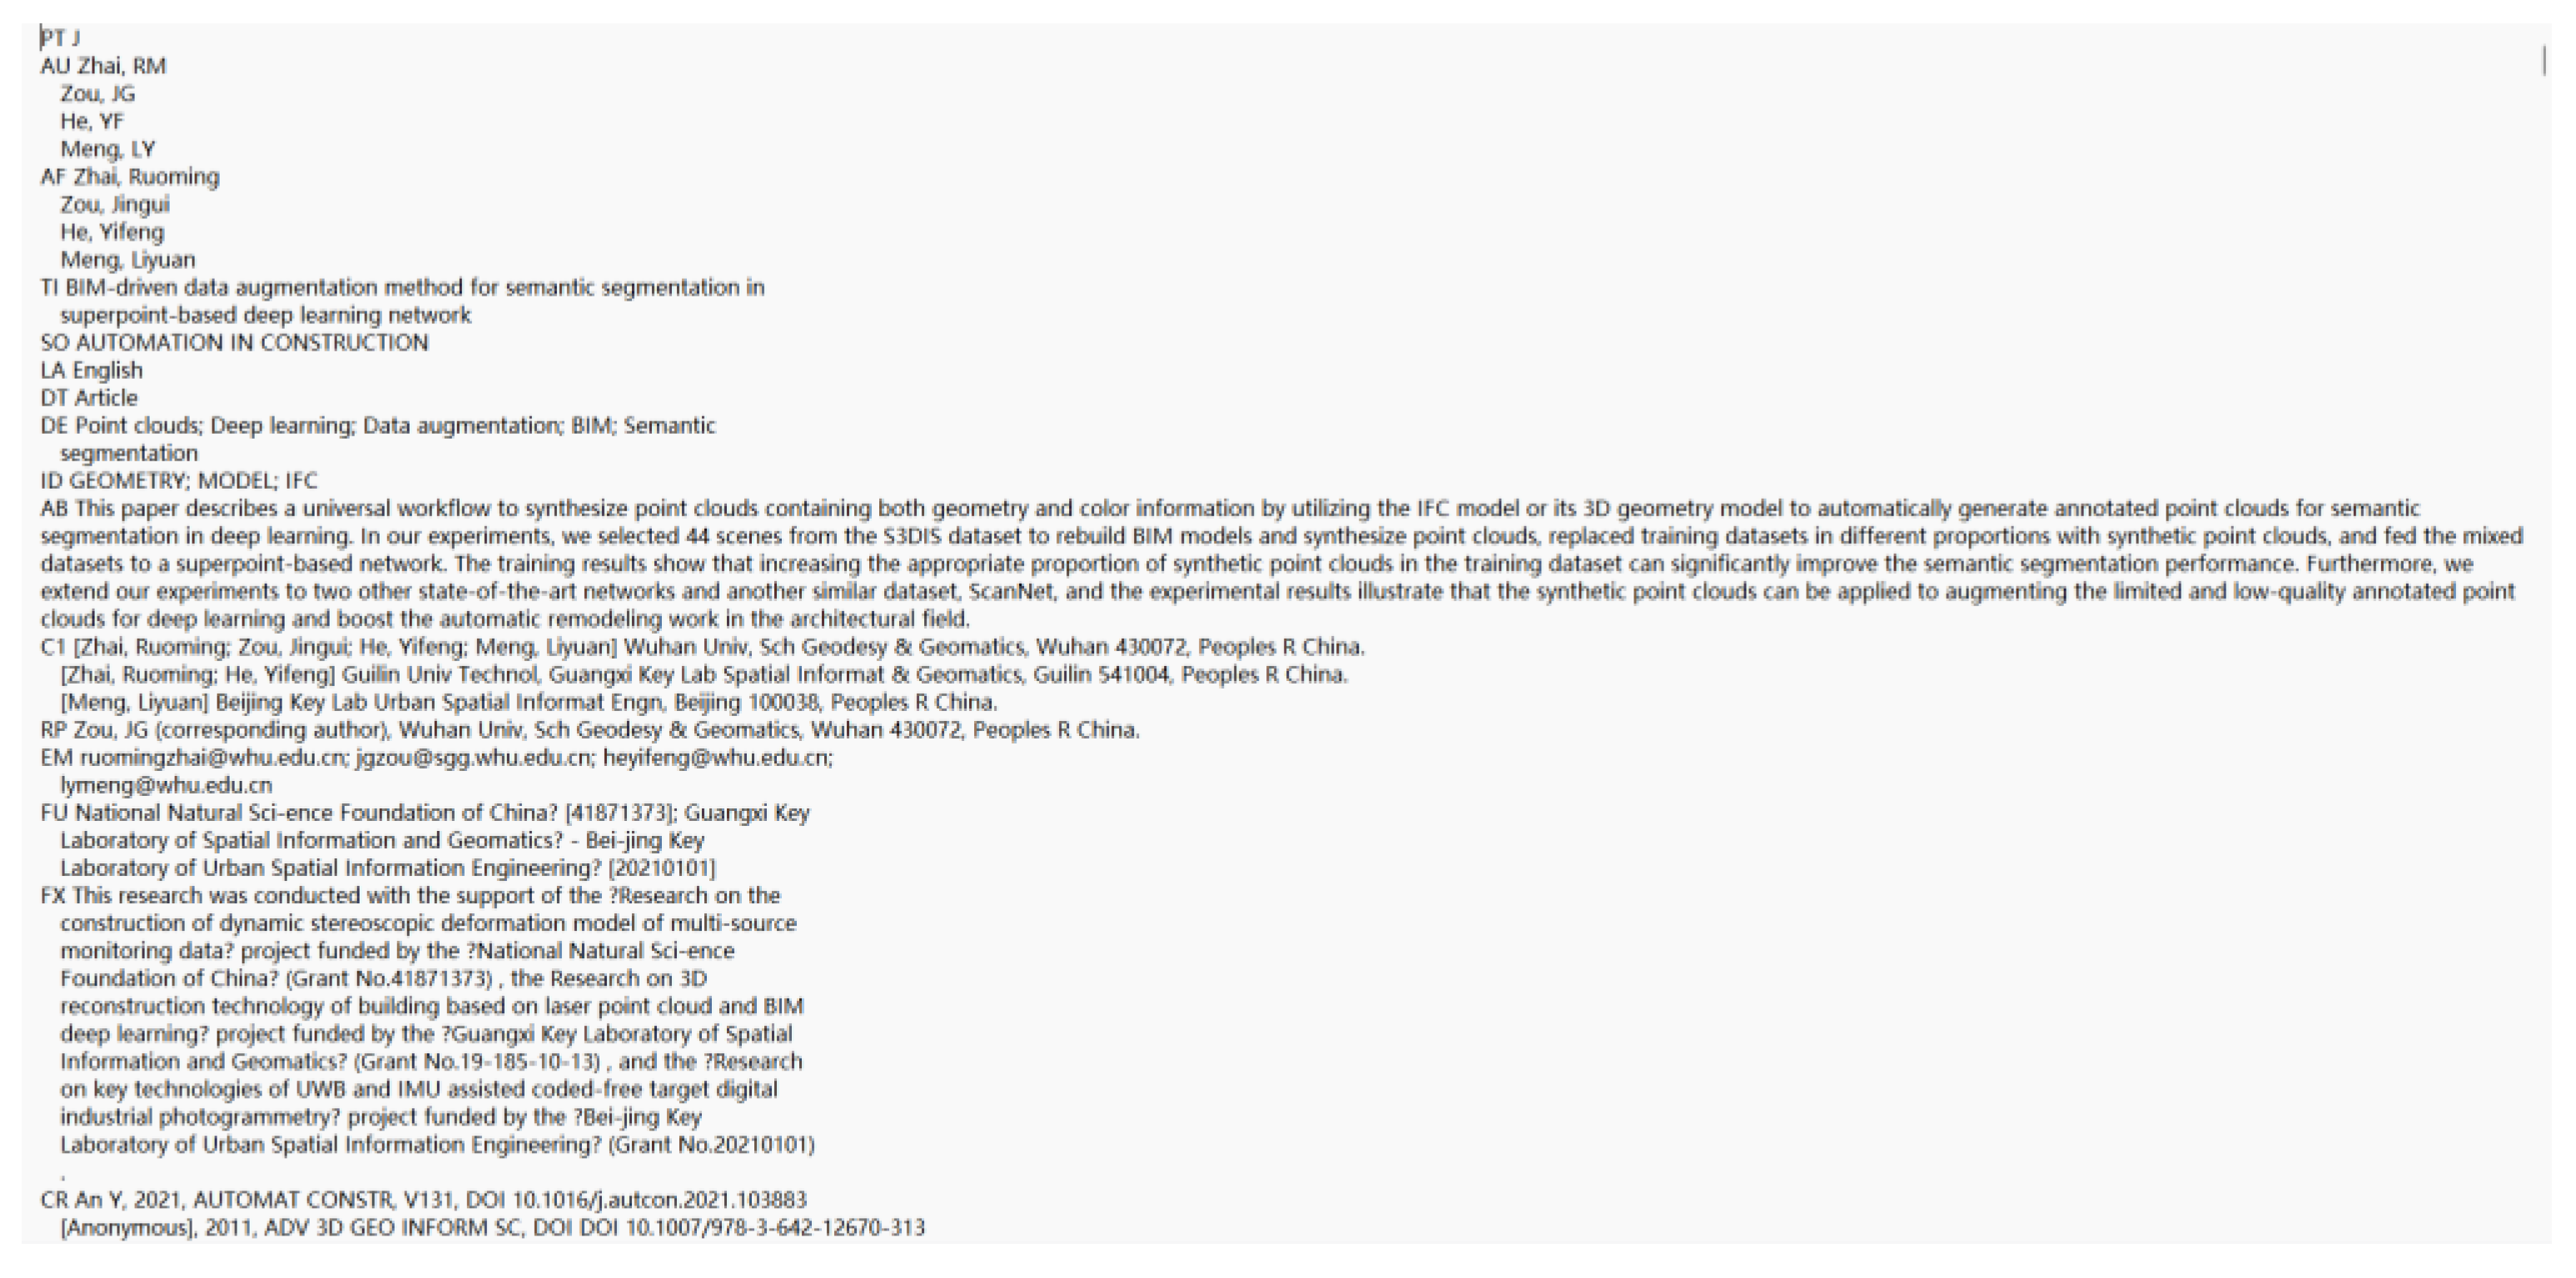
Despite the general statistical information described above, the detailed information of each qualified paper can be found in the bibliography document, including title, authors, institution, fundings, abstract, keywords, references, etc. A capture of such information is shown in
Figure 3.
3.2. Analysis Tools—CiteSpace Software
CiteSpace [
105,
106,
107,
108], a citation and co-occurrence network analysis and visualization software based on scientometrics, was used to analyze and visualize the knowledge embedded in the scientific literature that were collected in
Section 3.1. The analysis results presented by CiteSpace can reveal the research network structure and research regularity, as well as the spatial distribution related research. It identifies landmarks, hot spots, emerging trends, and key points based on the literature collected from various knowledge bases.
In this work, we conducted four types of network analysis, including term co-occurrence network analysis, document co-citation network analysis, collaborative country network analysis, and category co-occurrence network analysis. The nodes and links are the basic elements of the networks returned by CiteSpace. The types of nodes include noun terms (e.g., keywords, abstracts, and titles), authors, countries, categories, etc. The size of the nodes reflects the frequency of relevant data occurrence. The links are the relationships between nodes, e.g., co-citation relationship and co-occurrence relationship. The thickness of the links indicates the strength of the relationship between the nodes.
Specifically, the term co-occurrence network analysis was conducted to identify the main research topics in the field of 3D point cloud for cultural heritage. A knowledge map showing the term co-occurrence can reflect hot topics [
109]. The term is defined as noun phrases extracted from the title, abstract, keywords, and keywords plus, providing information about the main content of an article. The part-of-speech (i.e., POS) tagging technology, a widely-used natural language processing (NLP) tool, was used to realize the above-mentioned term extraction [
110]. Since the research topics are usually composed of a set of noun phrases that highlight the main idea of the research, we selected the top K terms to reflect hot research topics. The nodes are the terms, and the links are drawn by investigating the co-occurrence relationship between terms. This paper reflects a research topic through the top ten noun phrases that are most relevant to the topic. With regard to a research domain, the term co-occurrence network analysis can reflect the temporal distribution and strength change of research topics. The document co-citation network analysis illustrates that if there exists a co-citation relationship between two documents (i.e., articles), it indicates that those two documents are associated and there is a link connecting them. In this case, a node in the network represents a document. The milestone documents are judged by the importance of nodes in the network. The structure and characteristics of the document co-citation network is able to show the research focus, research interest, research intention as well as research trends in the reviewed field [
111]. The collaboration country network analysis identifies the association between research communities that may locate in different countries, depicting the research cooperation at the national level. The size of nodes (i.e., countries) and the thickness of links (i.e., the times that different countries cooperate) help to identify the contributions of different countries to the research domain [
112]. As each article is assigned with one or more subject categories (e.g., cultural heritage, geography, and remote sensing), the category co-occurrence network analysis aims at finding out the key disciplines as well as the interaction between different disciplines. Furthermore, the clustering analysis was conducted based on the four types of networks, from which the hot research topics, the key articles, the popular research location and closely-related research subjects can be identified over time.
In order to quantificationally explain the network analysis results, a number of parameters were selected [
107,
108,
110,
113]. The degree of modularity reflects the structure’s clarity at the decomposed cluster level, which is usually measured by Q value. If the Q value is more than 0.3, it means that the modularization of the network is significant. As the Q value increases, the clustering performance of the network improves. The silhouette score of a cluster (i.e., S) measures the homogeneity of its members. If the S value is over 0.7, it means that the clustering results are reasonable. As S moves closer to 1, the homogeneity of the network increases. A network with a high modularity degree and high average silhouette score is desirable. With regard to investigate the centrality of nodes, two types of measures were used, including betweenness centrality and degree centrality. The betweenness centrality is generally derived as a measure of centrality, which refers to the times that a node as an intermediary bridges another two nodes on the shortest path [
108,
114]. The degree centrality of a node refers to the number of links it connects [
115,
116]. The higher the degree centrality, the more central the node. The bursts value measures the rate of changes over time [
117]. The higher the bursts value is, the more potentially an abrupt change occurs. A node with strong bursts usually indicates an exciting work that has attracted significant attention during a short period.
4. Results and Discussion
4.1. Term Co-Occurrence Network Analysis
Since researchers often express in different ways, the words used in different forms are likely to represent the same meaning, e.g., synonyms, singular, plural, abbreviations, etc. In this work, we configured CiteSpace software in order to keep the semantic consistency of certain terms. For instance, in terms of synonyms, we converted “3-d model” and “three-dimensional model” to “3d model”. The “historical building” was unified as “historic building”. The plural, such as “3d point clouds “, “3d documentations”, “buildings”, “3d scanners”, “devices”, etc., were all replaced with their singular form. With regard to abbreviations, “tls” and “terrestrial laser” were replaced with “terrestrial laser scanning”, “uav” was replaced with “unmanned aerial vehicle”, “bim” was replaced with “building information modeling”, “hbim” was replaced with “historic building information modeling”, etc. There also exists certain differences between American English and British English, resulting in spelling problems. In this case, we used American English for consistency, e.g., replacing “modelling” with “modeling”.
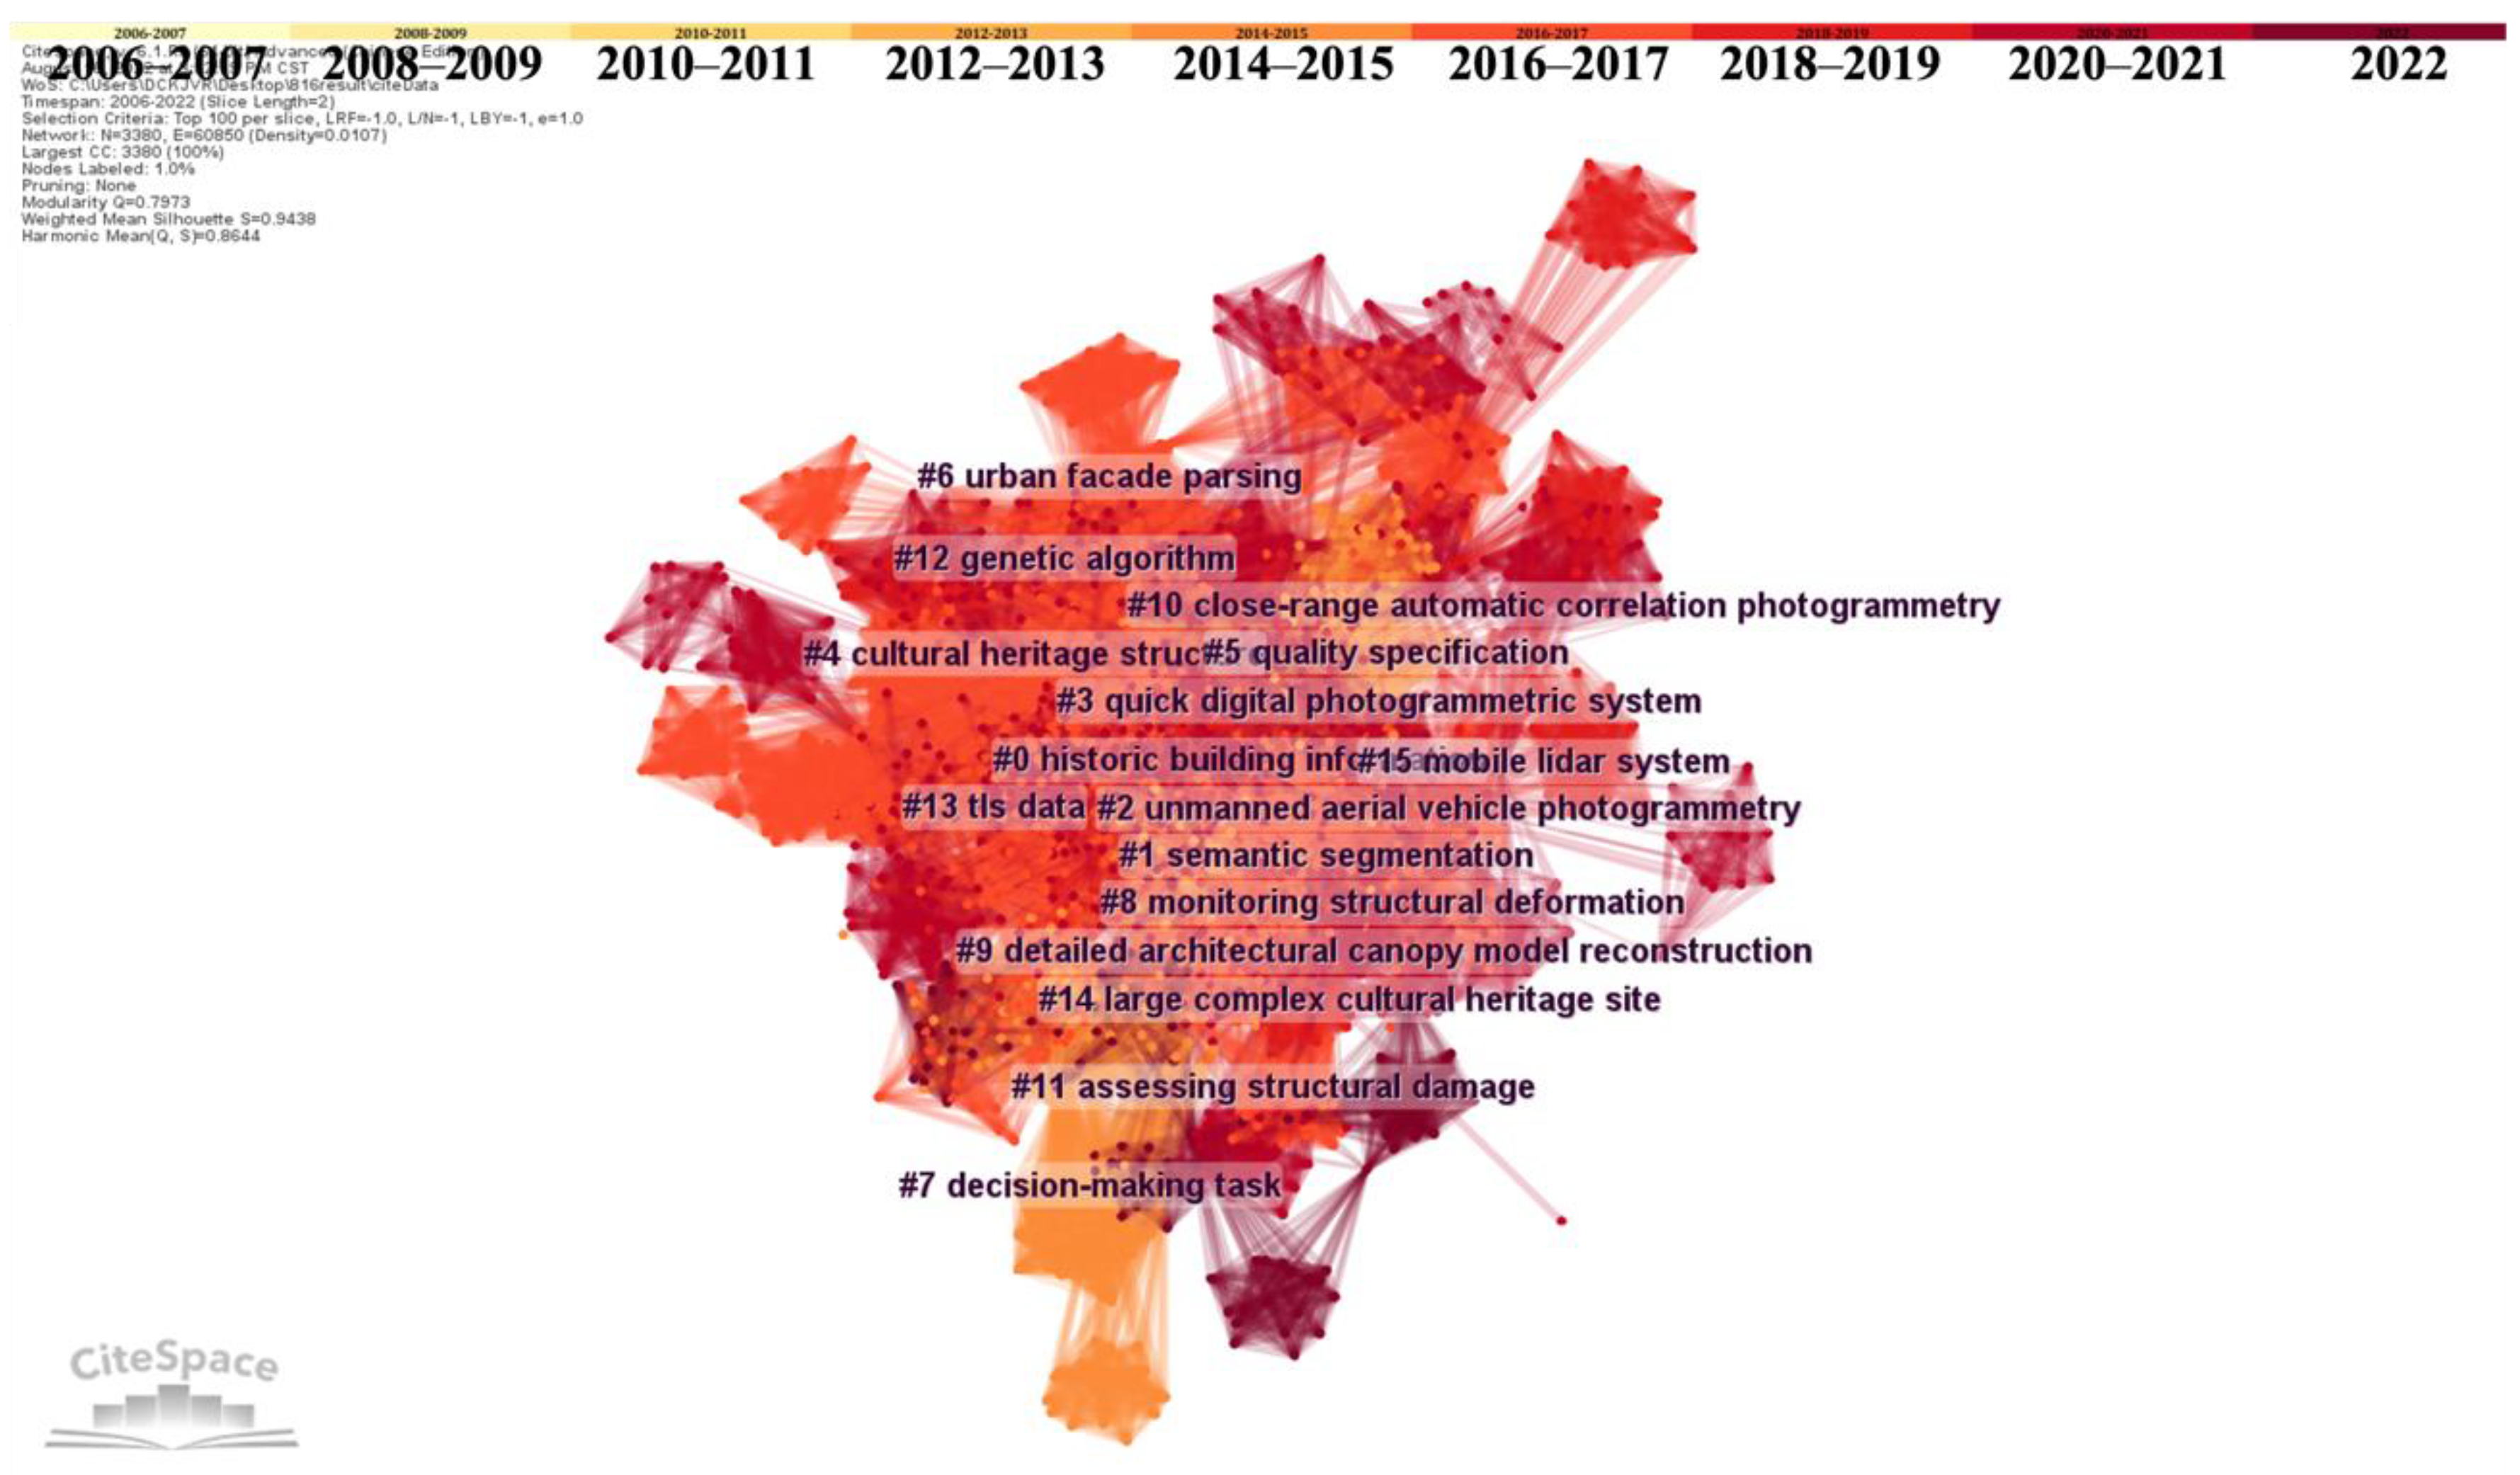
The literature was analyzed using CiteSpace software by setting the time slice as two years, e.g., ranging from 2008 to 2009. The nodes (i.e., terms) of each time slice were derived from the noun phrase of the top N cited articles, where N is equal to 100, that has been widely used for such analysis. As a result, a total of 3380 nodes and 60,850 links were included in the term co-occurrence network, which are visualized in
Figure 4. A link between two nodes represents the term co-occurrence relationship. The link color corresponds to the color of the time slice when the link was first established between a pair of terms.
Based on the composed term co-occurrence network, we further conducted a clustering analysis to better explore the research patterns and extract the hot research terms. The Modularity indicated by Q is equal to 0.7973 that is over 0.3, and the Weighted Mean Silhouette indicated by S is equal to 0.9438 that is over 0.7, which both fall into the reasonable range by referring to the explanation of those parameters in
Section 2.2. This illustrates the efficiency of our clustering analysis results. As shown in
Table 2, the cluster labels, average research year, cluster size, and silhouette score are summarized for the top 16 clusters. The label of each cluster was automatically extracted from the terms that were included in this cluster using the log-likelihood ratio (LLR) algorithm provided by CiteSpace [
110]. The average year was computed by averaging the publishing years of all articles in this cluster. The cluster size indicates the number of articles included in this cluster. The Silhouette scores are all over 0.7 and close to 1, meaning high homogeneity of the network. In other words, the terms grouped in the same cluster are highly similar.
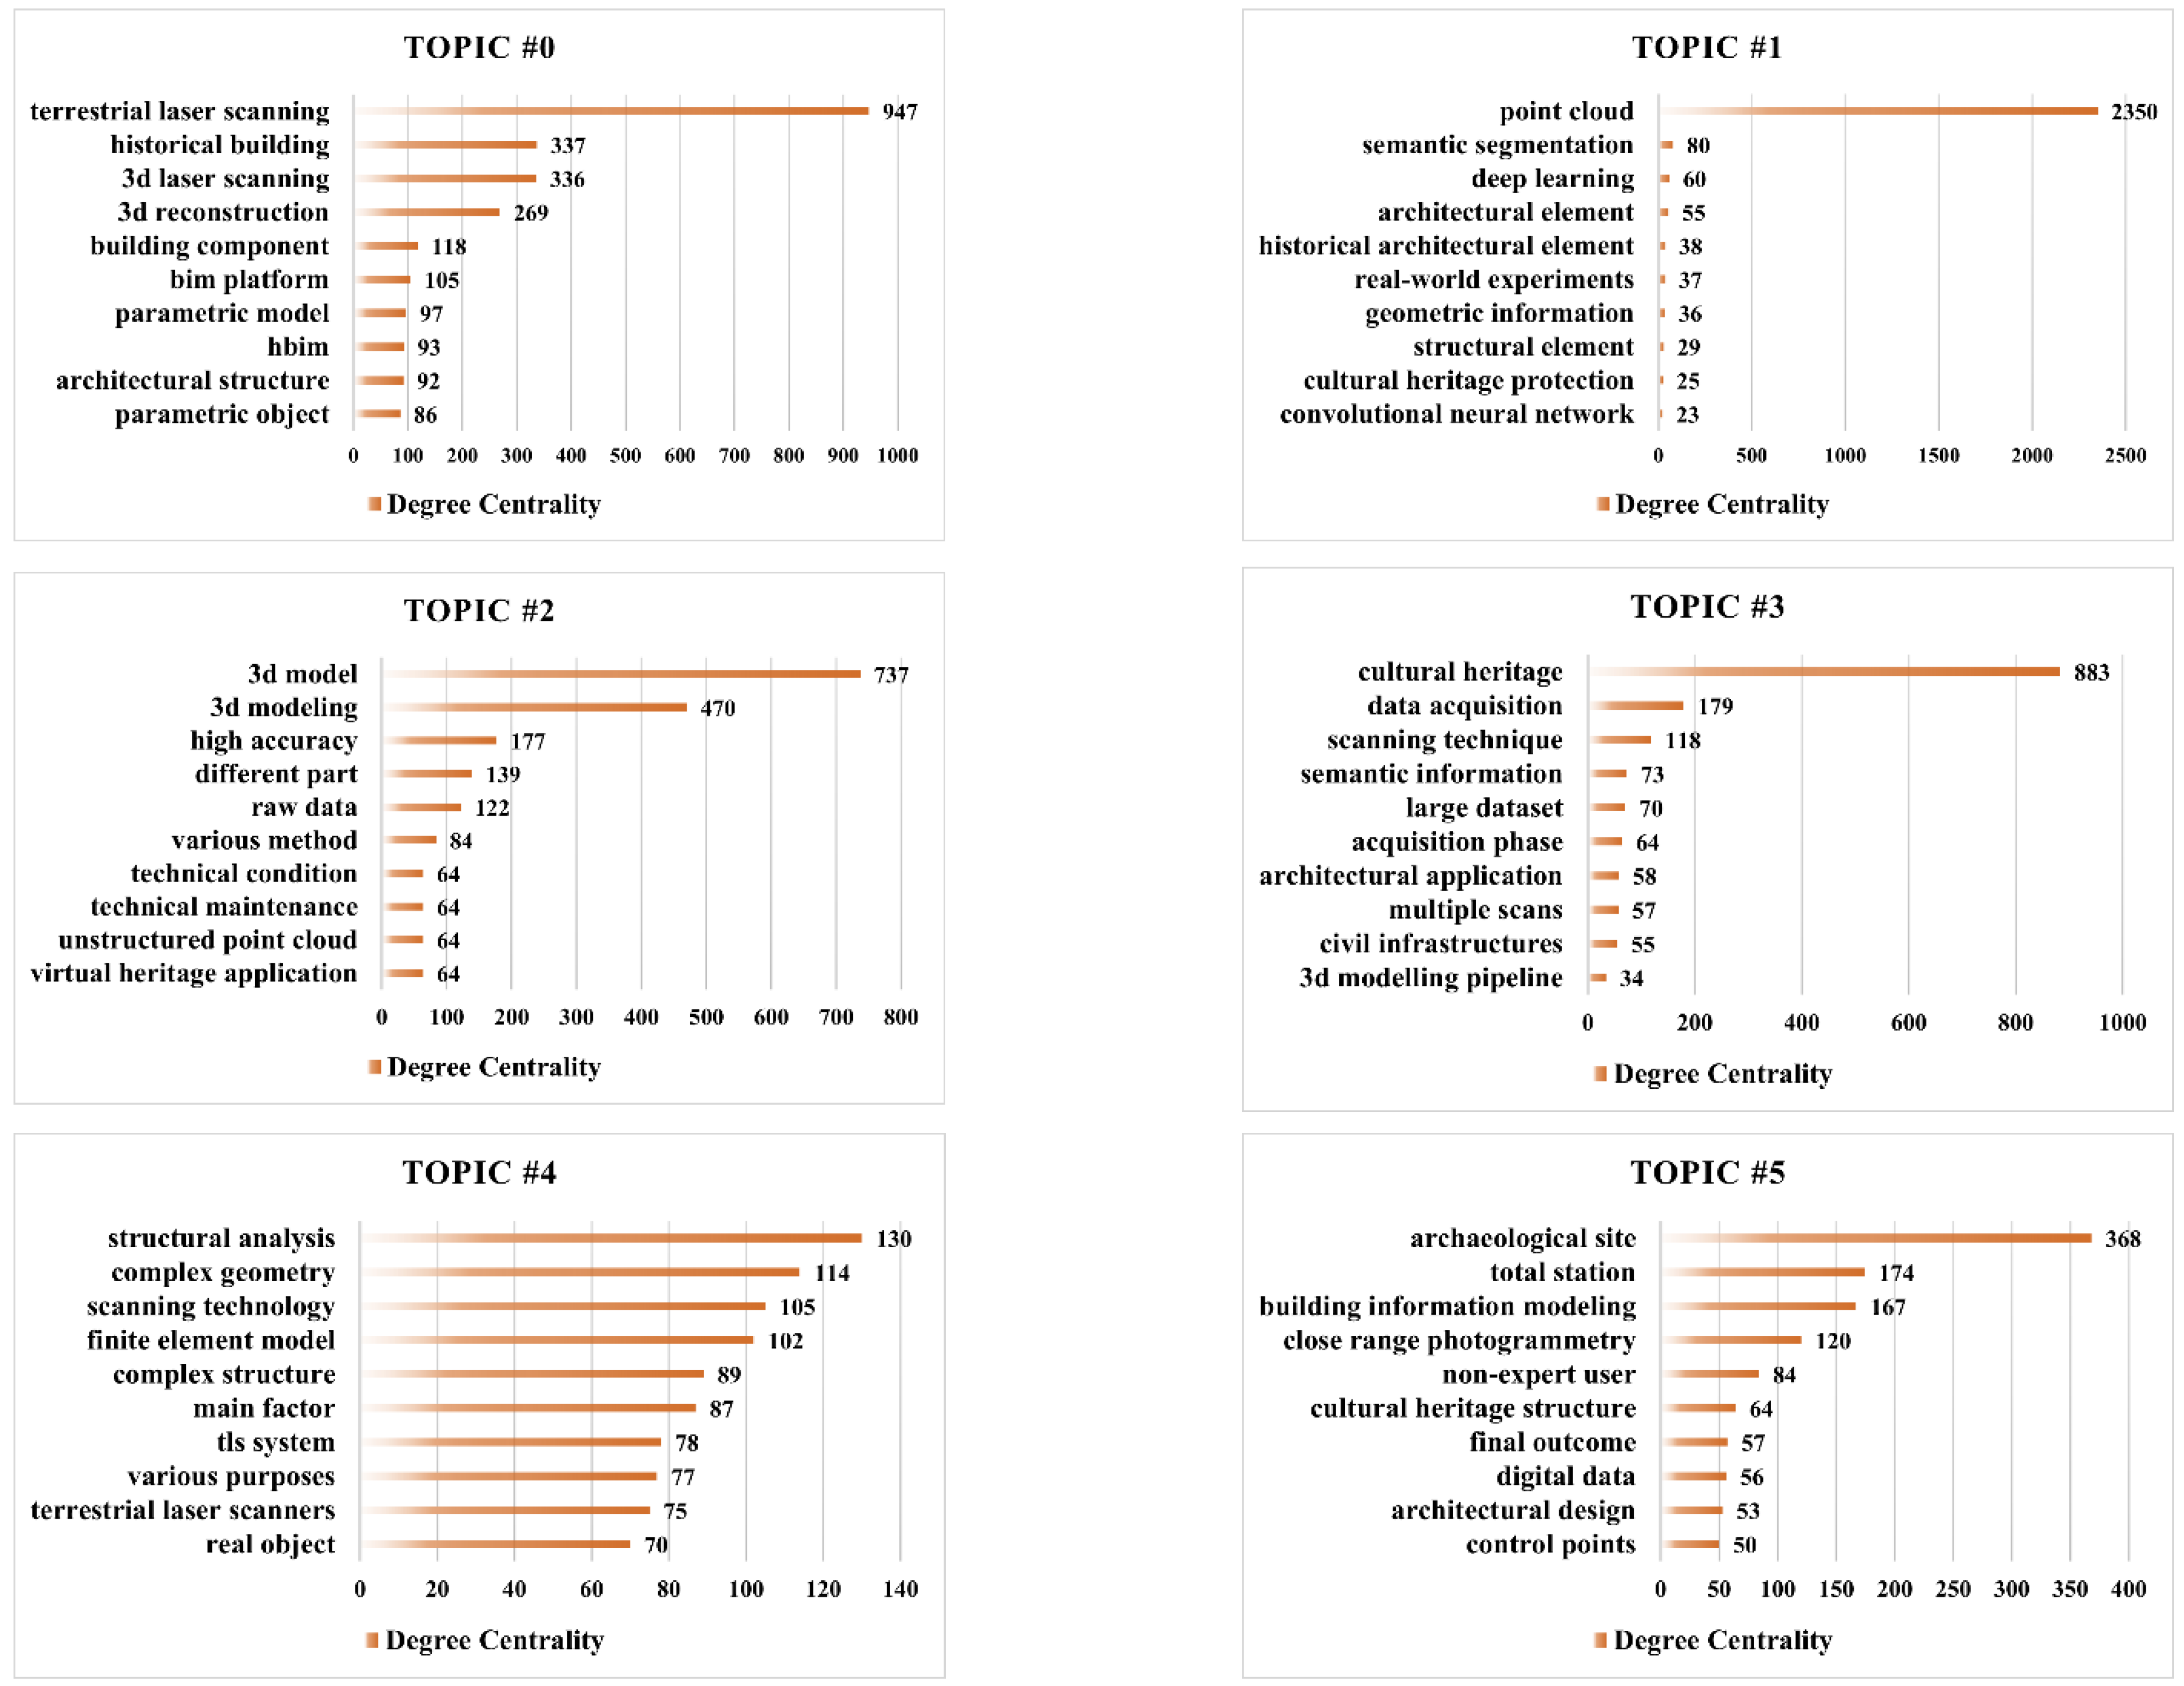
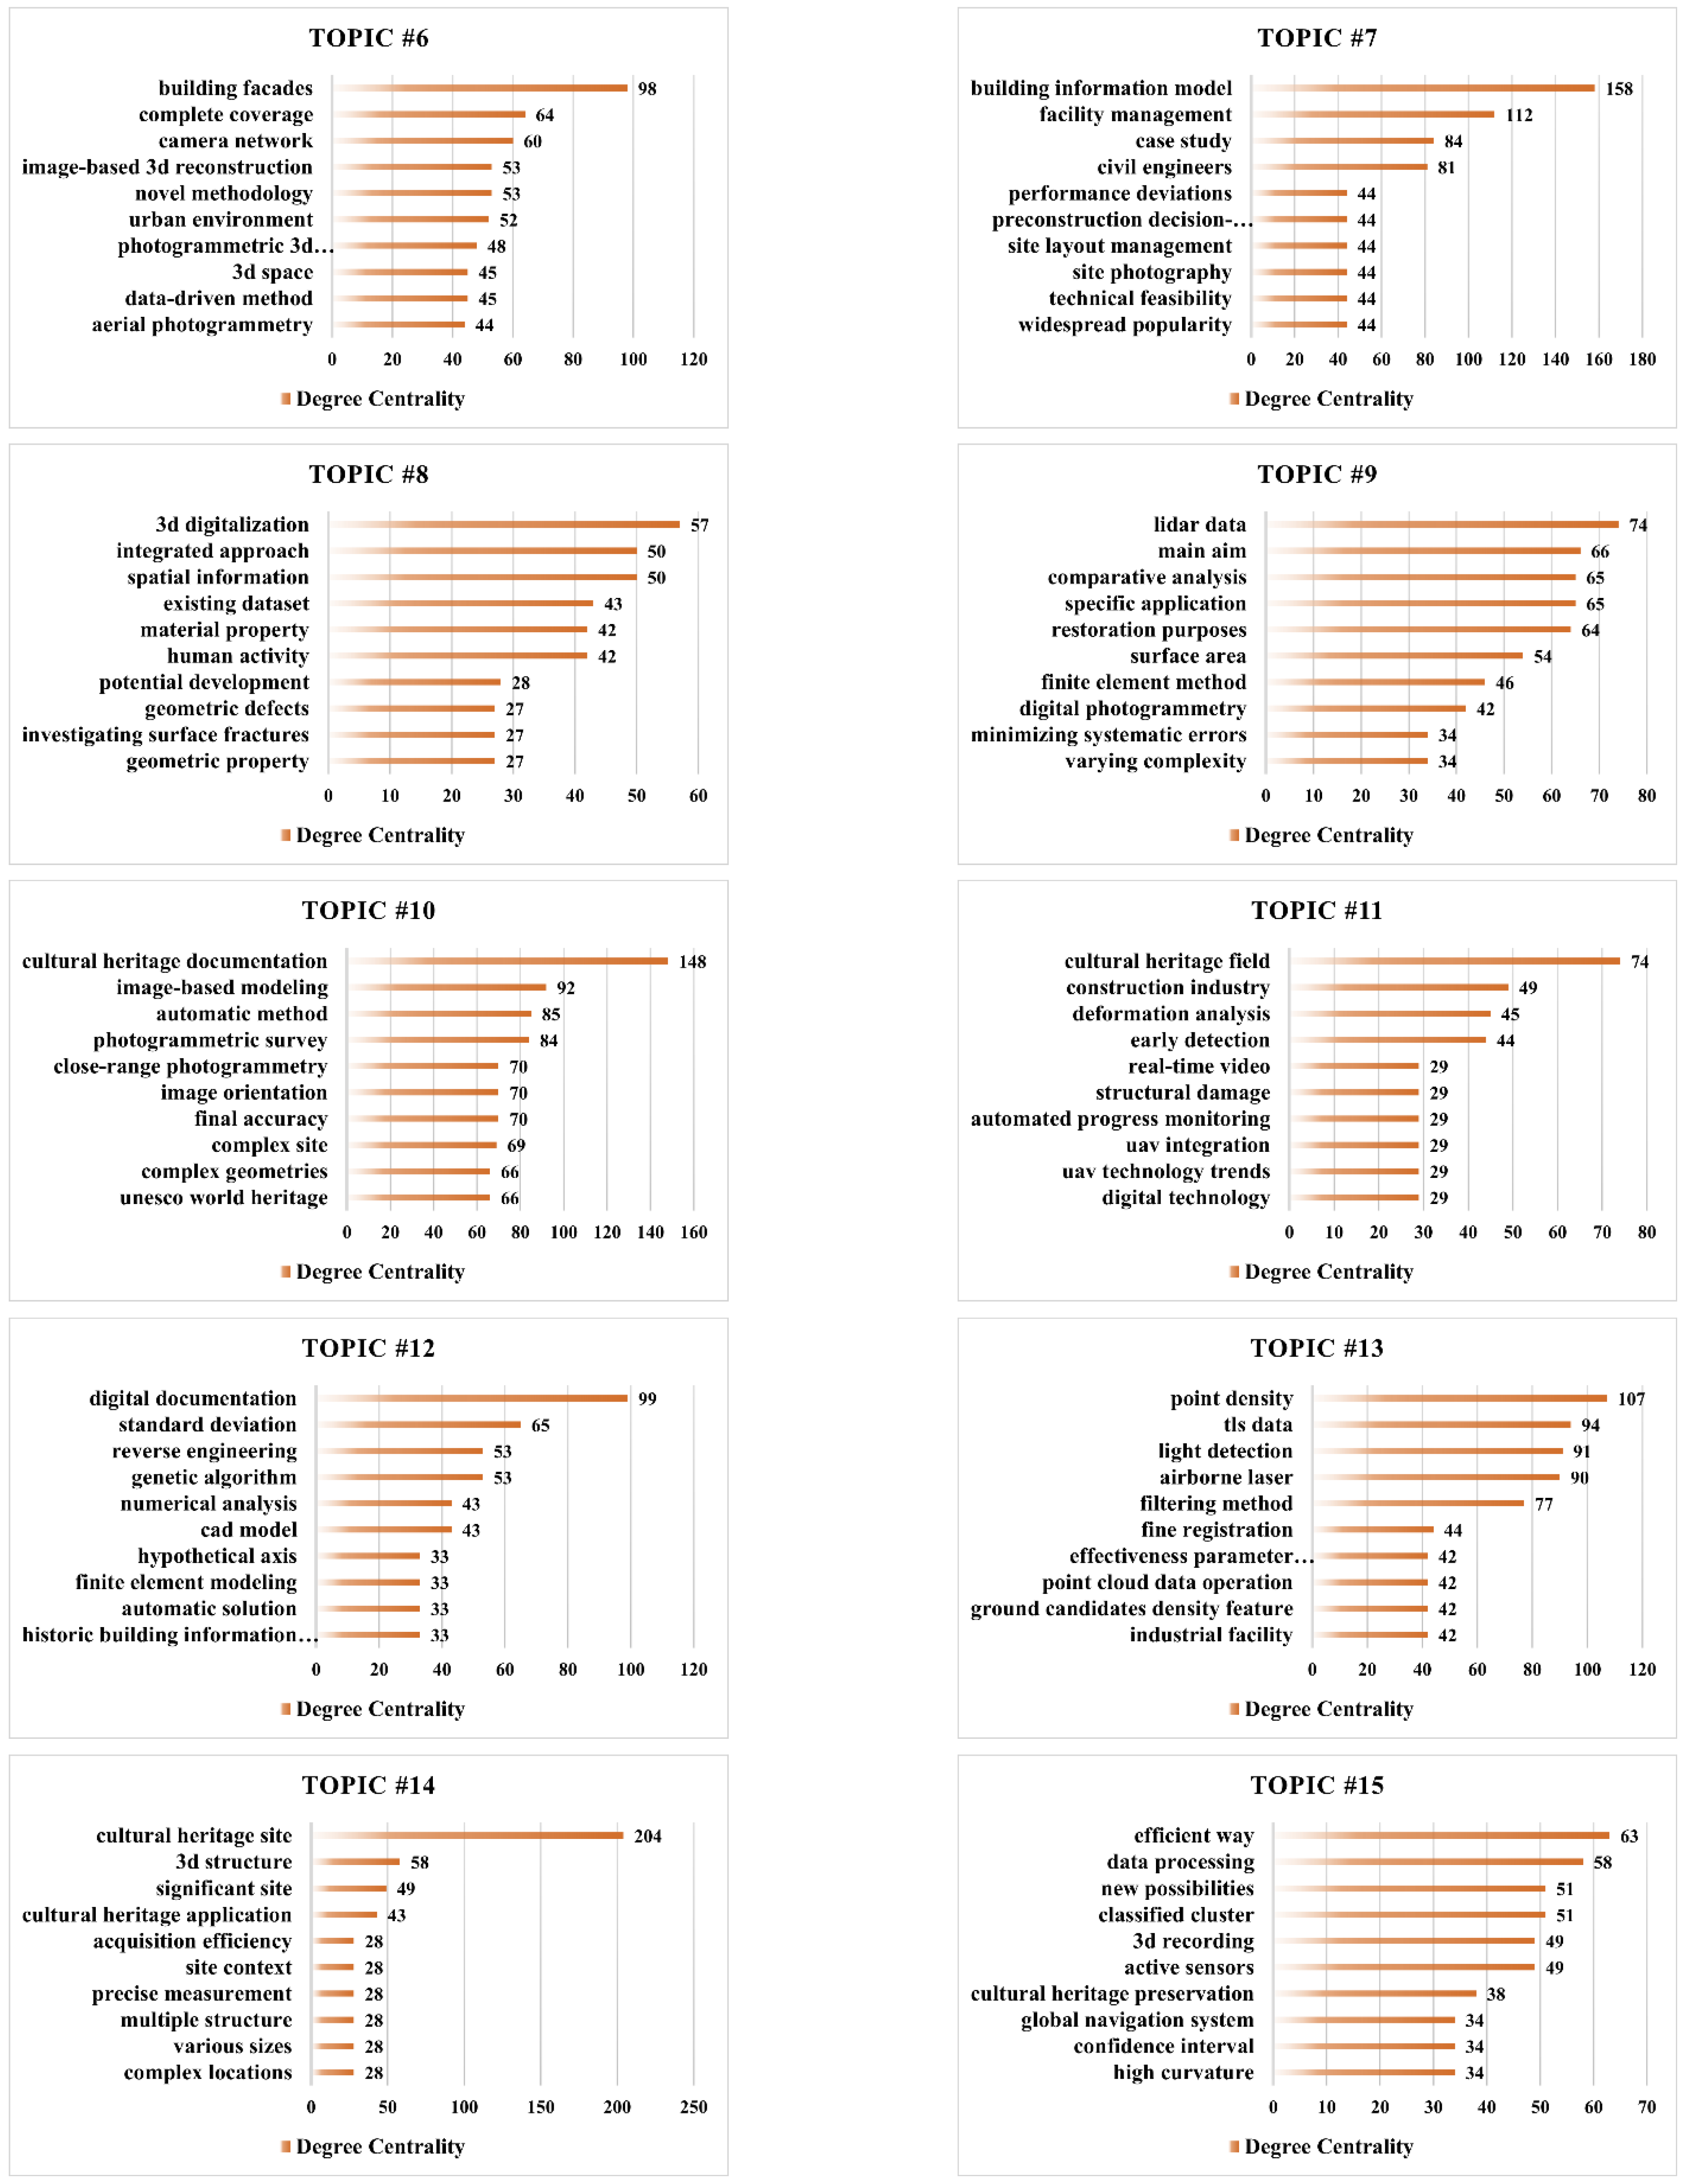
Each cluster consists of a list of terms and they own different degree centrality. The degree centrality measures the number of connections this term has, which can reflect the importance of this term in the network. In other words, those terms with higher degree centrality are more frequently used in the surveyed domain. The higher the degree centrality of the term is, the more focus and attention it gains in the research field. As such, those terms with high degree centrality, together with the cluster label, can be used to infer the research topics of each cluster. In this work, we selected the top ten terms by ranking their degree centrality to represent the research topics. The research topics of the top 16 clusters are summarized in
Figure 5, including the representative terms and their degree centrality.
As shown in
Figure 5, the topic number aligns with the cluster number. Topic #0 was retrieved from the largest and latest Cluster #0, which includes 208 articles. The cluster was labeled as “historic building information”. The average research year is 2018. The representative terms in this cluster include “terrestrial laser scanning”, “bim platform”, “hbim”, “architectural structure”, and “parametric object”, revealing that 3D point cloud data is the main data source in the BIM and HBIM, which are both used for parametric modeling of architectural cultural heritage to express the architectural structure. The top-term analysis results align with the background ground knowledge presented in
Section 2.2.3, e.g., HBIM is a typical application of 3D point cloud data in the cultural heritage field, indicating that the scientometric analysis holds the potential to efficiently mine the hot research topics in the reviewed field.
Topic #1 refers to the second largest Cluster #1 and was labeled as “semantic segmentation”. The topic includes terms such as “architectural element”, “deep learning” and “convolutional neural network”. It reflects the most advanced technology level of point cloud semantic segmentation that is mainly applied to the geometric structure segmentation of historical buildings.
Topic #2 labeled as “unmanned aerial vehicle photogrammetry”, Topic #3 labeled as “quick digital photogrammetric system”, Topic #10 labeled as “close-range automatic correlation photogrammetry”, Topic #13 labeled as “tls data” and Topic #15 labeled as “mobile lidar system” are all related to the technical approaches of 3D point cloud data acquisition. The average research years of the above topics is relatively early because point cloud data acquisition is the primary task in the research field. Different topics reflect the distinctive technical characteristics of point cloud data acquisition methods in cultural heritage. For example, the term “global navigation system” is included in the topic “mobile lidar system”, indicating that the mobile lidar data acquisition equipment needs to be equipped with a navigation system.
Topic # 5 labeled as “quality specification” is related to the quality assessment of 3D point cloud data. Topic #4 was labeled as “cultural heritage structure”, where the term “finite element model” indicates an important method used for the structural analysis of architecture heritage. Topic #6 labeled as “urban facade parsing”, Topic #7 labeled as “decision-making task”, Topic #8 labeled as “monitoring structural deformation” and Topic #11 labeled as “assessing structural damage” all focused on the practical applications of point cloud data for cultural heritage protection.
4.2. Document Co-Citation Network Analysis
The document co-citation network analysis was performed for the identification of key articles in the domain of 3D point cloud for cultural heritage during the timespan ranging from 2006 to 2022. Similar to
Section 4.1, the node selection was based on the Top 100 articles in each time slice covering two years. Each time slice was rendered with a unique color. The link color corresponds to the specific time slice. As shown in
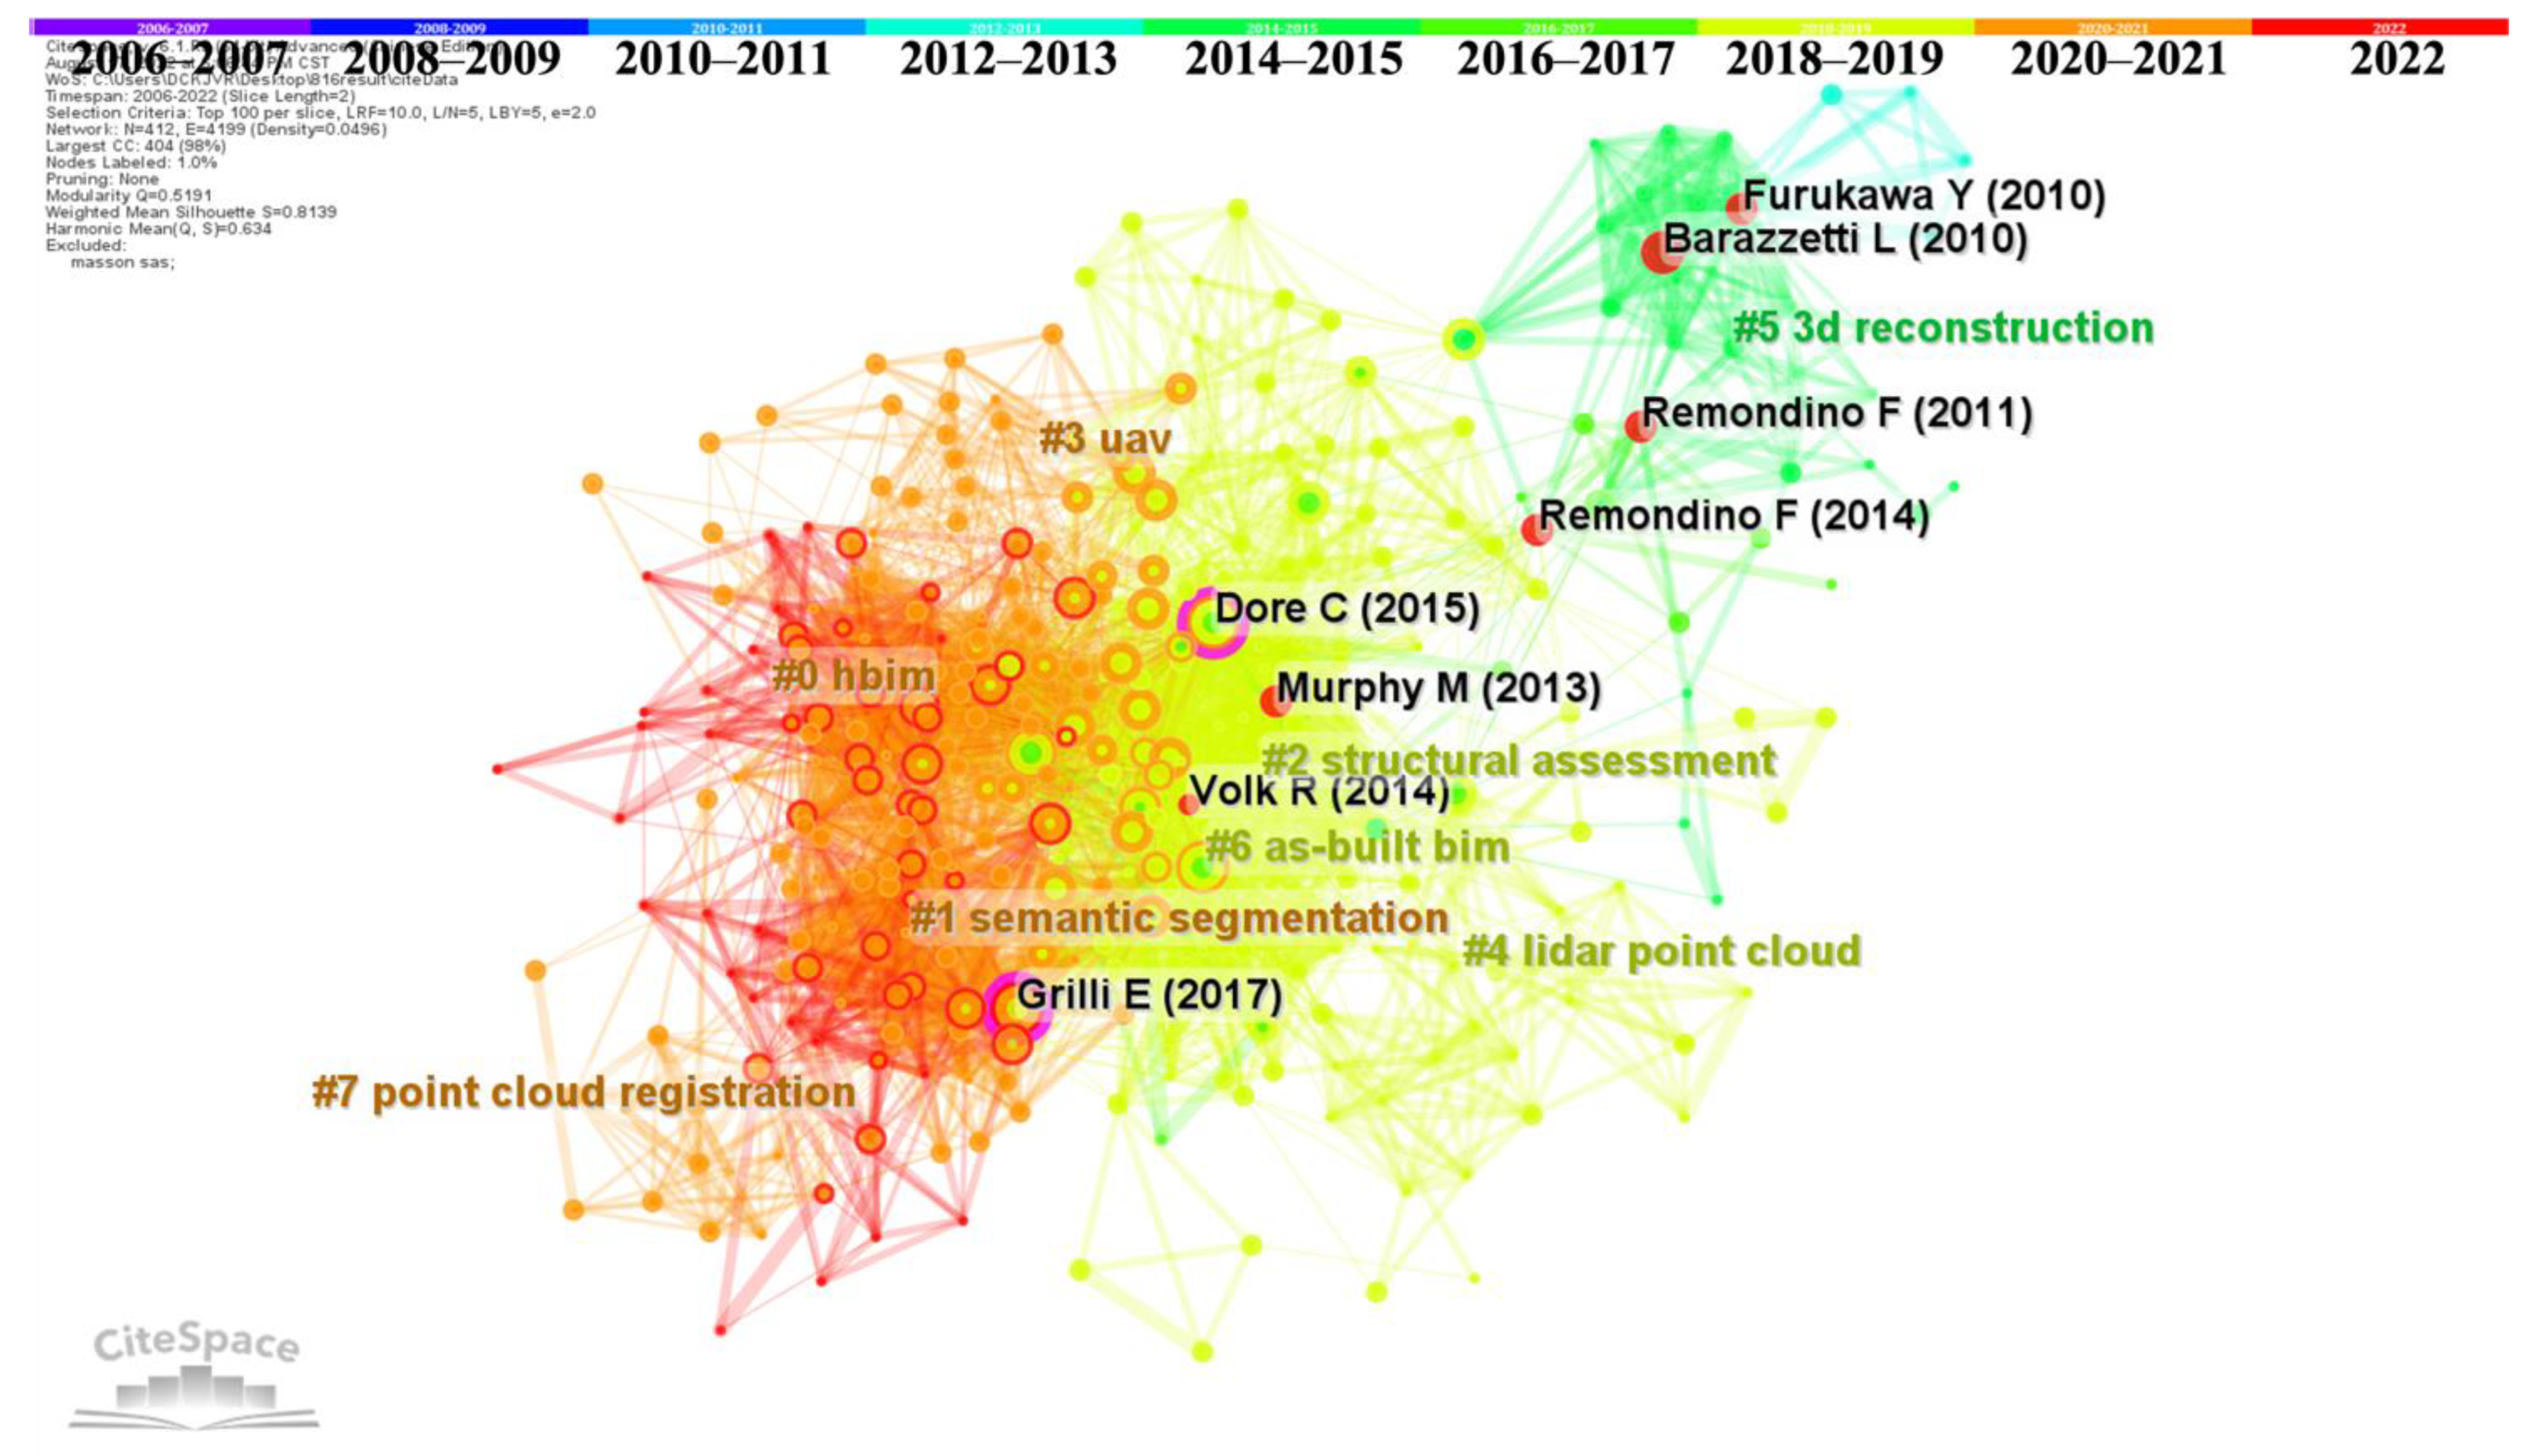
Figure 6, the merged document co-citation network contains 412 nodes and 4199 links. The nodes represent the cited references among the collected articles. The links connecting nodes represent the document co-citation relationship. The concentric tree rings represent the temporal pattern of the publications in the corresponding years. The pink circle around the nodes represents a betweenness centrality score more than 0.1. The Red circles around the nodes indicate the number of times an article has been cited in a short period of time, representing strong citation burst patterns. The purple circles indicate those articles that hold strong centrality, which means that this paper is a hub between two research directions in the surveyed domain. Larger node sizes suggest that the publication had been cited more frequently and implies that the paper is an important one within the knowledge domain. In other words, those articles with a large nodal size and purple rings are critical and worth reading for researchers who intend to grasp the main idea of this domain efficiently. The indexes of clustering effects are illustrated by a Modularity Q equal to 0.5191 > 0.3 and a Weighted Mean Silhouette S equal to 0.8139 > 0.7, indicating that the composed network is supportive for exploring document co-citation patterns.
We further investigated the details of those articles surrounded by purple circles and red circles, which are with high betweenness centrality and strong citation bursts, respectively. The article details are summarized in
Table 3, including the authors, titles, journal names and publication year. These articles can be regarded as the landmark articles in the domain of leveraging 3D point cloud for cultural heritage. The most central article was proposed by Grilli et al. (2017) [
118], who concluded that 3D point cloud semantic segmentation technology could improve the knowledge expression ability of cloud data and could be applied for BIM. Dore et al. (2015) [
119] proposed HBIM technology for the structural simulation analysis of historical buildings. Both of these two articles were published in the
Int Arch Photogramm, which indicates that this journal plays a central role among all journals that are relevant to 3D point cloud for cultural heritage on the other side. Furthermore, those landmark articles extracted by the scientometric analysis tool exactly reflect the research trends that was discussed in
Section 2.3.
Among the six articles with strong citation bursts, Furukawa et al. (2009) [
120] and Barazzetti et al. (2010) [
121] proposed different image-based 3D reconstruction methods, which were cited 3757 and 233 times, respectively, and extracted from Google Scholar on 16 August 2022. Remondino et al. (2011) [
122] surveyed the 3D scanning and photogrammetry techniques that contributed significantly to the digital 3D documentation, map**, conservation, and representation of landscapes and heritages. Remondino et al. (2014) [
123] also presented a critical review and analysis of the dense image-matching algorithms, available as open-source and commercial software, for the generation of dense point clouds. Image matching is one of the key steps for 3D modeling and map**. As such, the above four papers can be regarded as the knowledge base of image-based and LiDAR sensor-based 3D reconstruction of cultural relics. In addition, Murphy et al. (2013) [
124] and Volk et al. (2014) [
125] reviewed HBIM and BIM technology for cultural heritage protection.
Table 3.
Landmark articles in the document co-citation network analysis.
Table 3.
Landmark articles in the document co-citation network analysis.
| Author | Year | Journal Abbr. | Title |
|---|
| Articles with high betweenness centrality score |
| Grilli et al. [118] | 2017 | Int Arch Photogramm | A review of point clouds segmentation and classification algorithms |
| Dore et al. [119] | 2015 | Int Arch Photogramm | Structural simulations and conservation analysis Historic Building Information Model (HBIM) |
| Articles with strong citation burst |
| Furukawa et al. [120] | 2010 | IEEE T Pattern Anal | Accurate, sense, and robust Multiview stereopsis |
| Remondino et al. [123] | 2014 | Photogramm Rec | State of the art in high density image matching |
| Barazzetti et al. [121] | 2010 | Photogramm Rec | Orientation and 3D modelling from markerless terrestrial images: combining accuracy with automation |
| Volk et al. [125] | 2014 | Automat Constr | Building Information Modeling (BIM) for existing buildings—Literature review and future needs |
| Remondino et al. [122] | 2011 | Remote Sens-Basel | Heritage recording and 3D modeling with photogrammetry and 3D scanning |
| Murphy et al. [124] | 2013 | ISPRS J Photogramm | Historic Building Information Modelling—Adding intelligence to laser and image based surveys of European classical architecture |
The clustering analysis of the document co-citation network was also conducted to investigate the large and active areas of the domain. Combined with the clustering analysis and the cluster labels shown in
Figure 6, the knowledge structure of point cloud data in the field of cultural heritage is constantly formed. Image-based and 3D laser scanning are the main techniques for 3D reconstruction, which are indicated by three clusters including Cluster #3 uav and Cluster #4 lidar point cloud and Cluster #5 3D reconstruction. As indicated by Cluster #6 as-built bim and Cluster #0 hbim, the point cloud semantic segmentation technology has been used to enhance the knowledge expression ability of point cloud data and assist in the automatic construction of BIM and HBIM. Besides, the structural assessment of cultural heritage represented by Cluster #2 relies on the parametric model constructed by BIM and HBIM technology.
4.3. Collaborative Country Network Analysis
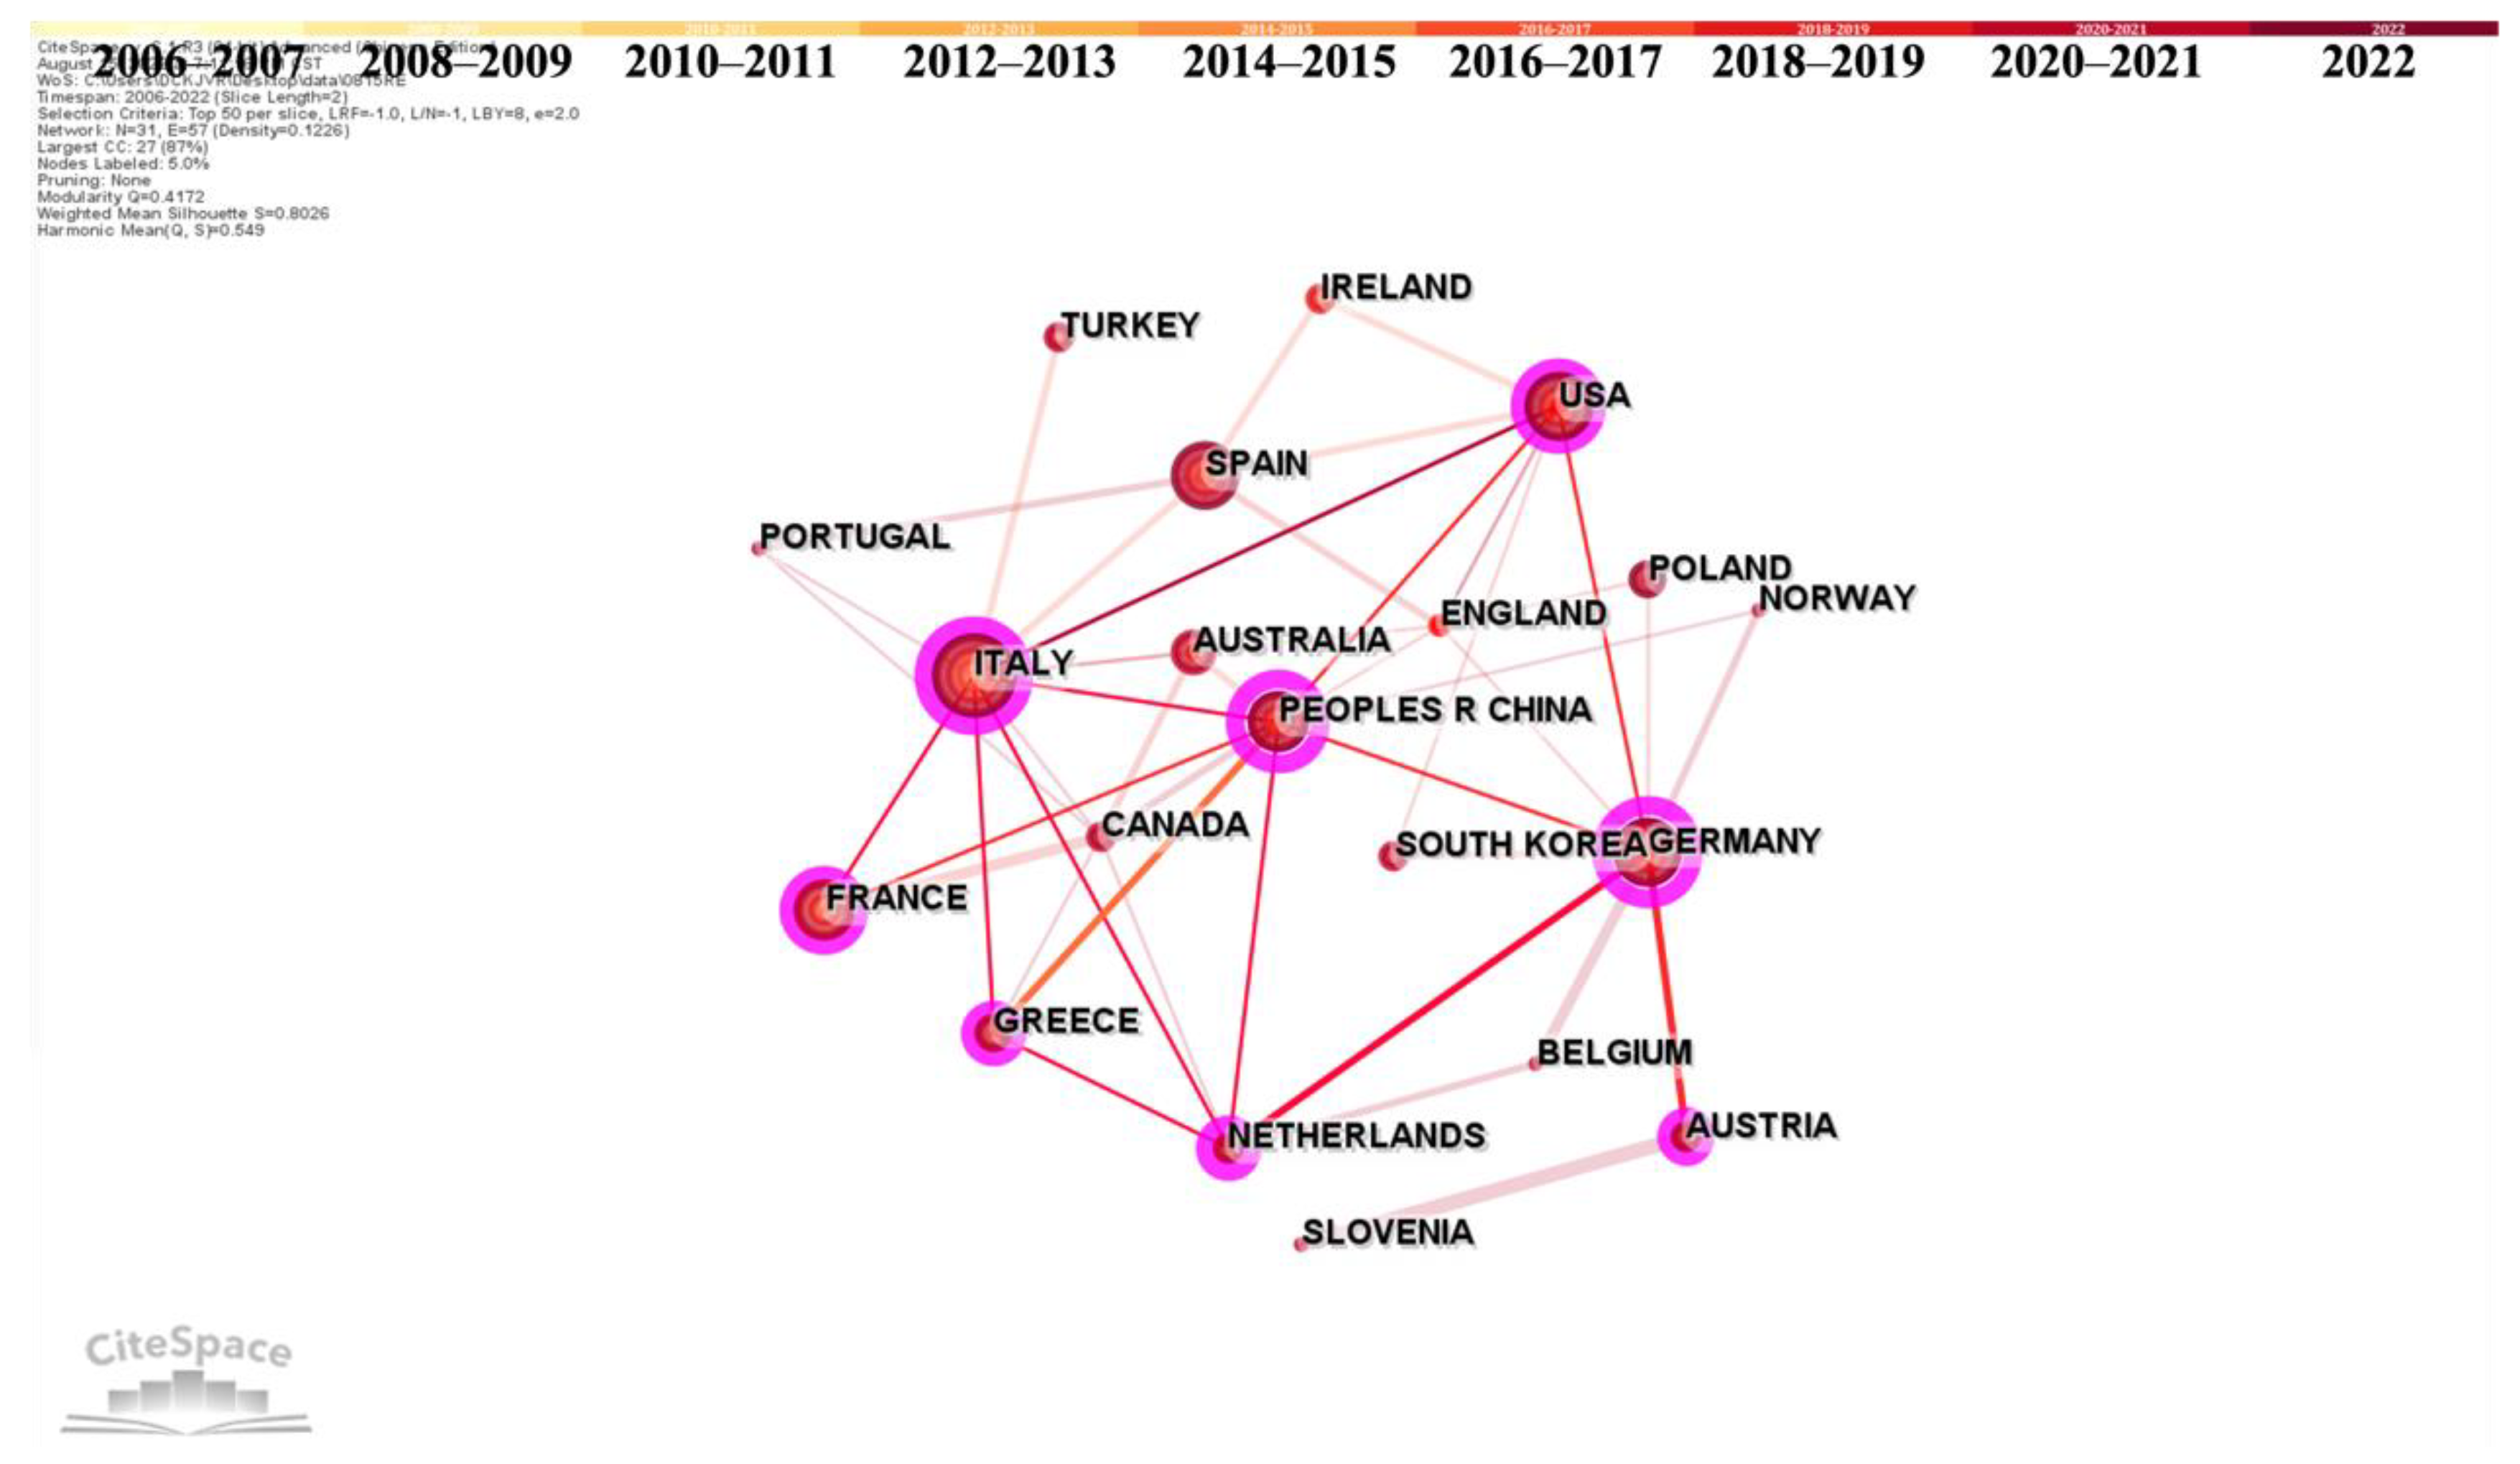
This section aims at analyzing and visualizing the national research collaboration network that is made by research institutions worldwide. In the collaborative country network, the country information was extracted from the authors’ affiliation. A country acts as a node, and the collaboration between countries compose the links. As shown in
Figure 7, a total of 31 nodes and 57 links were included in this network. The concentric tree rings reveal the temporal patterns of the articles published by this country. The color of each concentric circle indicates the year of the publications, while the pink circle around the nodes represents how the betweenness centrality score is over 0.1. The thickness of the pink circles reflects the importance of this country in the research domain. The color of the links aligns with the colors of the corresponding year when the national research cooperation first appeared. The thicker the link, the stronger the national collaboration. The red circles around the nodes indicate the citation bursts of the node. The Modularity Q is equal to 0.4172 that is over 0.3 and the Weighted Mean Silhouette S is equal to 0.8026 that is over 0.7, both of which indicates this collaborative country network is meaningful.
As shown in
Figure 7, Italy is the landmark node with the largest radius, indicating that the key article in the domain of 3D point cloud for cultural heritage comes from Italy. As evidence, the first author of this key article titled “From point cloud data to building information modelling: an automatic parametric workflow for heritage” is a researcher from the Department of Architecture, Built Environment, and Construction Engineering, Politecnico di Milano, Milan, Italy. In addition, USA, China, Germany, Netherlands, France, and Greece also own thick pink circles, indicating that they are central countries and make critical contributions to this research domain.
The top five central countries ranked by the betweenness centrality are shown in
Table 4. The number of world heritage sites of each country is also listed for correlation analysis. Among all of the countries, Italy has the highest degree centrality of 12 and a betweenness centrality of 0.40. This aligns with the fact that Italy plays a landmark role in the reviewed files, and it owns the largest circle with the most connections with other countries as is shown in
Figure 7. In contrast, Germany has a degree centrality of 10 but has the highest betweenness centrality of 0.46. It reveals that Germany can be regarded as the most important intermediary bridging other countries via the shortest path. Furthermore, it presents a positive correlation between the centrality scores and the number of cultural heritage sites located in each country. The countries with more international cooperation also tend to have more cultural heritage sites. For example, Italy owns 58 world cultural heritage sites, ranking first with regard to the number of world cultural heritage sites. Similarly, China owns 56 world cultural heritage sites and Germany owns 51 world heritage sites, ranking second and third regarding the number of world cultural heritage sites all over the world, respectively, both of which have higher centrality scores.
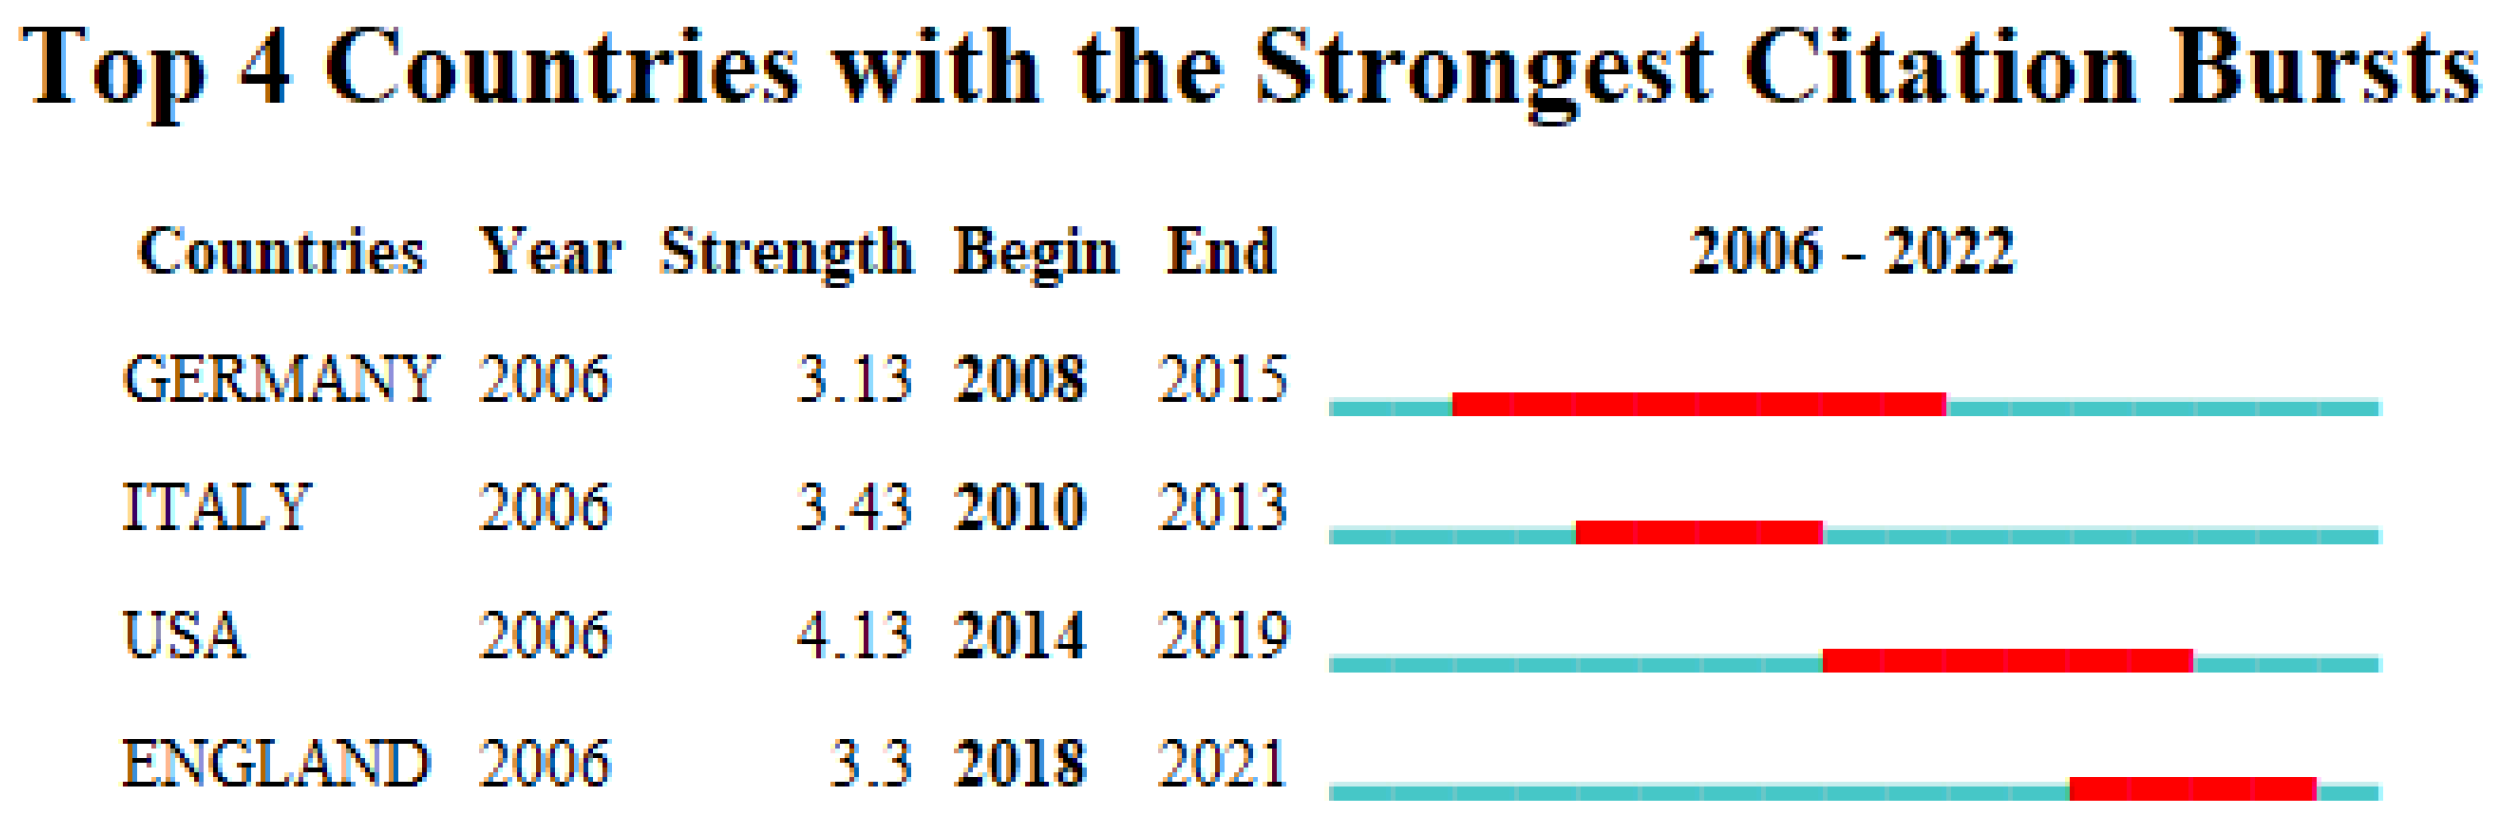
We further performed a burst analysis to explore the development trends of deploying 3D point cloud for cultural heritage from 2006 to 2022 in terms of each country. The top four countries with the strongest citation burst are illustrated in
Figure 8. The USA has the strongest citation burst of 4.13 in five years ranging from 2014 to 2019, while the citation burst occurring in Germany lasts the longest period but with the weakest pattern among those four countries. Italy showed a burst around 2010. The publications originating from Italy drew burst attention concerning the point cloud data used in the cultural heritage field around 2010. England owns the newest citation burst from 2018 to 2021. It shows that England has received a lot of attention from other researchers in recent studies. Such changes may be affected by policy guidance.
4.4. Category Co-Occurrence Network Analysis
This section focuses on the analysis of the co-occurrence of categories to identify the main categories that the articles associate with as well as the interdisciplinary patterns among all categories. The category information was extracted from the field of “Categories/Classification” of WoS, indicating the research areas that this article belongs to.
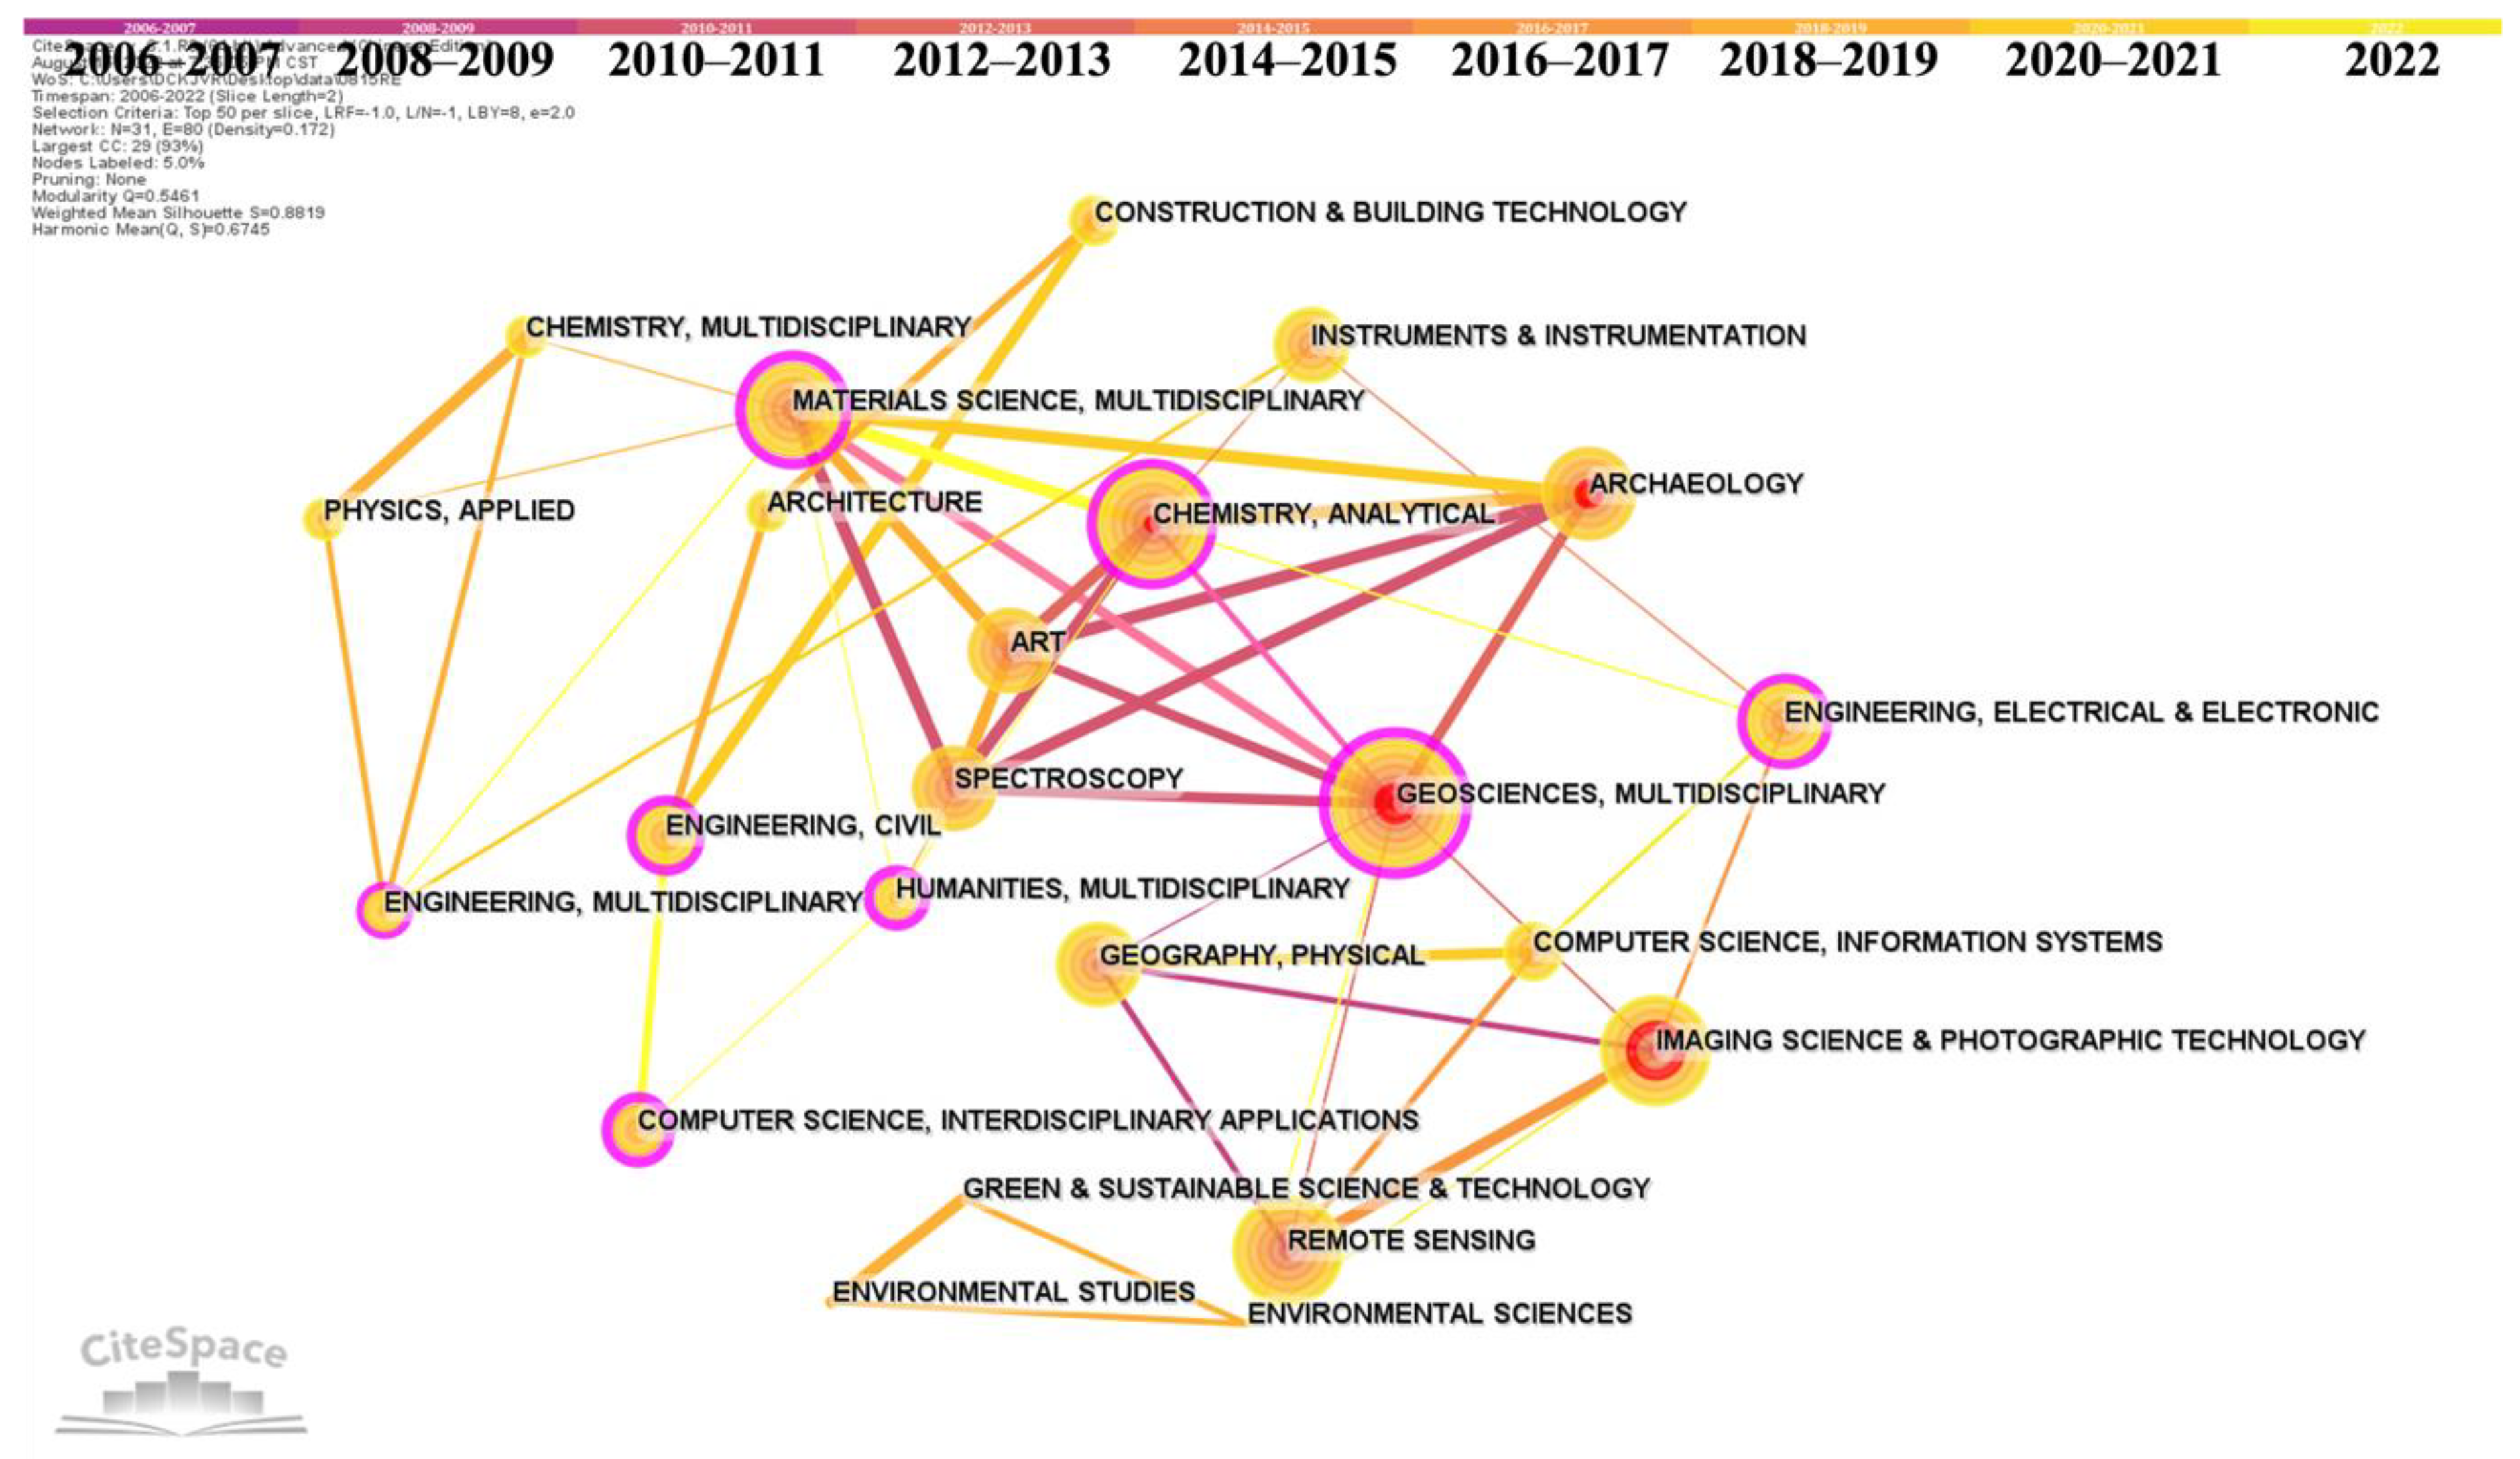
Figure 9 demonstrates the temporal visualization of those categories in the bibliographic literature that are related to 3D point cloud data for cultural heritage. The nodes refer to the subject categories. If two categories co-occur in one article, there is a link between them. We have selected the top 30 categories for each time slice in the timespan ranging from 2006–2022 to compose the category co-occurrence network. The merged network of subject categories consists of 24 categories and 70 links. The Modularity Q = 0.5461 > 0.3, Weighted Mean Silhouette S = 06745 > 0.7, indicating this network makes sense.
In order to better interpret the results represented in
Figure 6, we use the same color and symbols as were introduced in
Section 4.3 for consistency. Correspondingly, the concentric tree rings reveal the temporal patterns of the articles published in this category, and the color of each concentric circle indicates the year of the publications. The pink circle around the nodes represents how the betweenness centrality score is over 0.1. The thicker the pink circle, the higher the betweenness centrality of this category. The color of the links aligns with the color of the corresponding year when the cross-disciplinary first appeared between the two categories. The thickness of the links reflects the strength of the category co-occurrence relationship. As the application of point cloud in the field of cultural heritage is a typical interdisciplinary research domain, a number of strong connections can be found between the categories. For instance, Geosciences is strongly correlated with archaeology, art, and spectroscopy. It is obvious that the category of “Geosciences Multidisciplinary” has the largest radius and is surrounded by a thick pink circle, indicating that it is the most highly cited category and a central category of the domain. This aligns with the fact that integrating point cloud data with 3D GIS is a typical application in the cultural heritage field that was introduced in
Section 2.2.4. Aiming to investigate the centrality of each category and their contribution to facilitating the interdisciplinary research, we summarized the betweenness centrality scores of the top ten categories in
Table 5. The quantitative scores prove that both “Geosciences Multidisciplinary” and “Humanities Multidisciplinary” are the most central categories in the domain of 3D point cloud data for cultural heritage, which holds the same centrality score of 0.53. A major difference exists in the publication year, illustrating that the former is the most central area researched in the last decade while the latter is the most central area researched in recent years. Following them closely are the categories of “Materials Science Multidisciplinary”, “Computer Science Interdisciplinary Applications” and “Chemistry Analytical” with the centrality score of 0.44, 0.44 and 0.40, respectively.
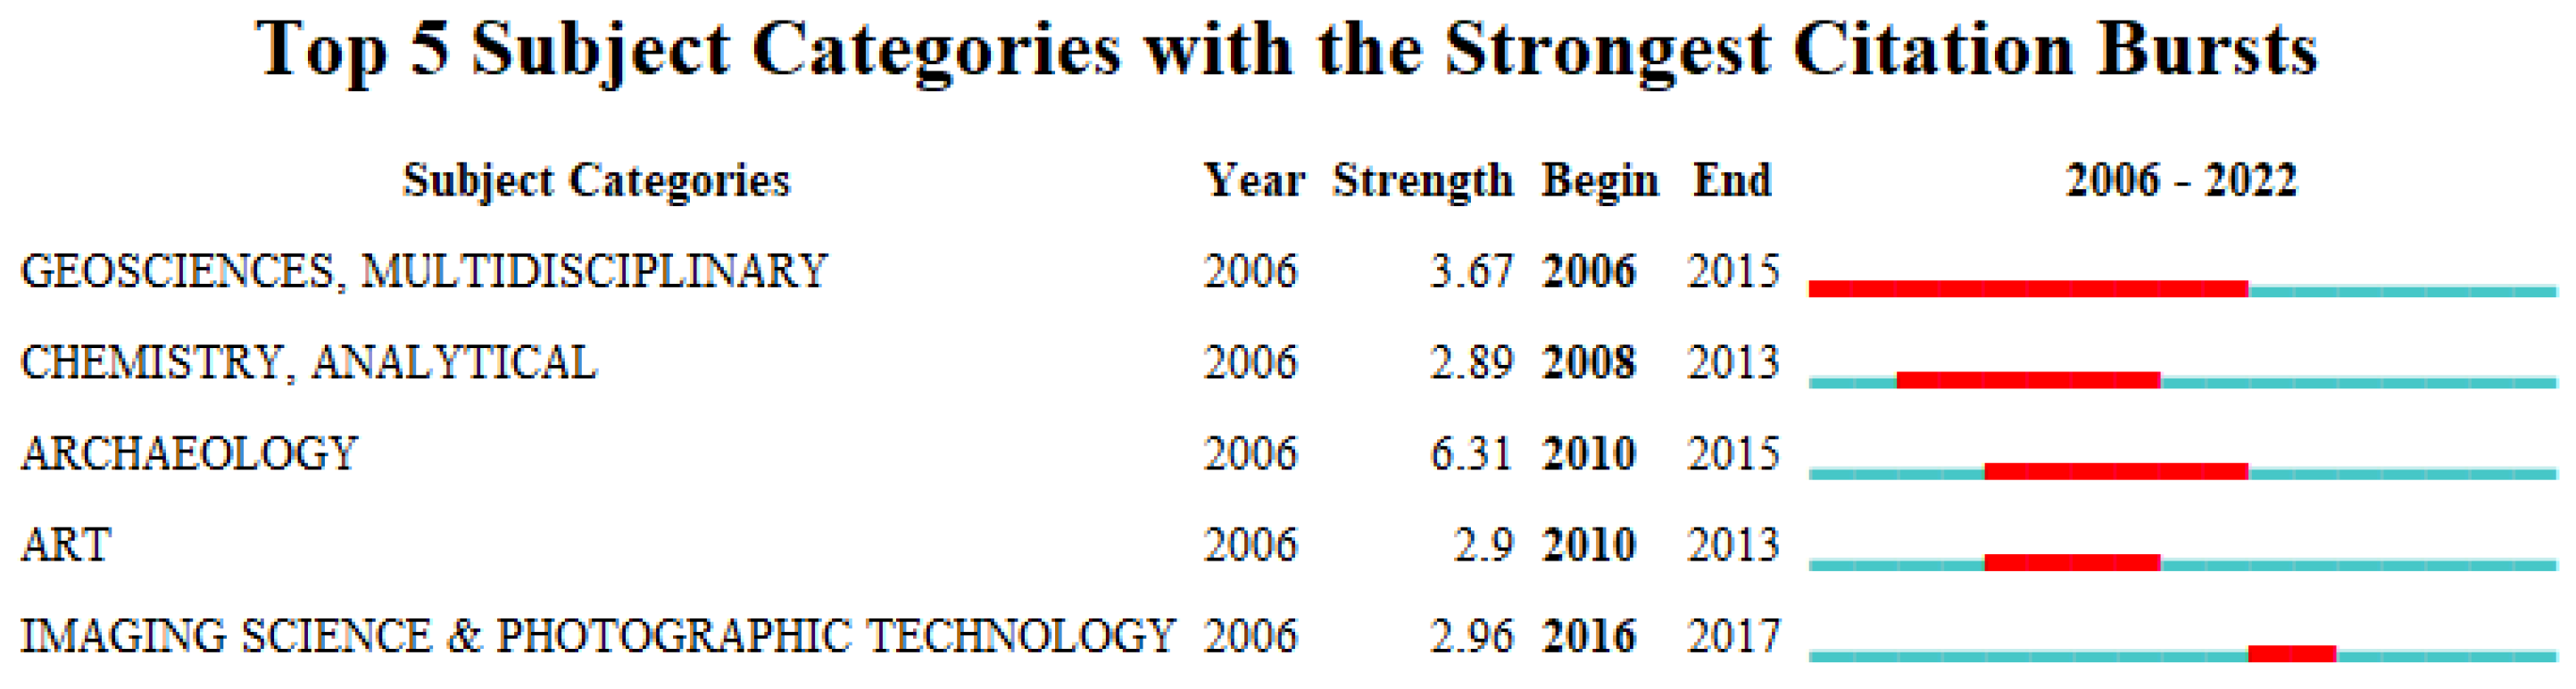
Burstiness identifies the subject categories which are active in the relevant research area during a period. The higher the citation bursts of a disciplinary, the more connections it has with other disciplinaries. The history of the citation burst of the top five subject categories is demonstrated in
Figure 10. The results reveal that “Archaeology” is the category with the strongest citation burst of 6.31 from 2010 to 2015. “Geosciences Multidisciplinary” is the earliest and the longest active category lasting for 9 years from 2006 to 2015. The most recent citation bursts occur in “Imaging Science Photographic Technology” from 2016–2017. This may be because more and more advanced image-based techniques (e.g., image-based dense point cloud matching algorithms) have been leveraged to improve the performance of employing 3D point cloud for cultural heritage in recent years. This aligns with the landmark article presented in
Table 3, namely, Remondino et al. [
123] (2014), which summarized the state of the art in high density image matching techniques and drew high attention in the field of 3D point cloud for cultural heritage.
5. Conclusions
In this work, CiteSpace software was used to conduct the scientometric analysis of the research concerning employing 3D point cloud for cultural heritage in order to investigate the research productivity as well as the emerging trends. The research, published as journal papers, were collected from the Web of Science database with a timespan ranging from 2006 to 2022. Based on the collected papers, a total of four networks have been generated and visualized for the scientometric analysis, including the term co-occurrence network analysis, document co-citation network analysis, collaborative country network analysis and category co-occurrence network analysis. A number of remarkable results have been obtained from those analyses. The main terms extracted through measuring their log-likelihood ratio and centrality can reflect multiple data acquisition methods (e.g., total station, terrestrial laser scanners and UAV integration), information extraction and fusion (e.g., building information modeling, historic building information modeling and semantic segmentation) as well as the popular applications (e.g., cultural heritage documentation, restoration purposes, deformation analysis, and structural damage), which compose the research hotpots in this field. Based on the document co-citation network analysis, the paper proposed by Barazzetti L et al. (2010) [
121] has been the most cited work since 2010 and holds strong citation bursts, which can be regarded as landmark research in the surveyed domain. At the national level, it is interesting that countries such as Germany, China, and Italy, which own numerous world heritage sites, have also contributed more in the academic research of this domain. From the perspective of disciplines, the research of 3D point cloud for cultural heritage features has significant features of interdisciplinary, crossing “geoscience”, “materials science”, “chemistry”, “environmental sciences” and “humanities”. This, in turn, puts forward higher requirements for the research in this field, leading to greater challenges we are potentially facing in the future. It is an inevitable trend to strengthen the exchange and cooperation at the national level and the joint efforts of multiple disciplines. These findings provide valuable reference for those who are engaged in the field of 3D point cloud data for cultural heritage and helps them to have a comprehensive and systematic understanding of the research topics, hot issues and development trends.
Despite the achievements obtained in this work, there still exists space for improvement in the near future. As the articles surveyed in this work are only in English and collected from the Web of Science database, some relevant research may have been missed in this review. In the future, those articles either written in other languages (e.g., Chinese) or recorded in other databases (e.g., Scopus), can be included for further comparison analysis.


