

Evaluation of Copernicus DEM and Comparison to the DEM Used for Landsat Collection-2 Processing

Abstract
:1. Introduction
2. Datasets Used in the Study
2.1. Copernicus DEM (CopDEM)
2.1.1. Primary Motivation and Usage [30,31]
2.1.2. Heritage
2.1.3. Format and Quality Layers

| DGED format: | EEA 1−10, GLO 2−30, GLO–90 |
| DTED format: | GLO–30, GLO–90 |
| INSPIRE format: | EEA–10 |
2.1.4. Copernicus DEM Accuracy
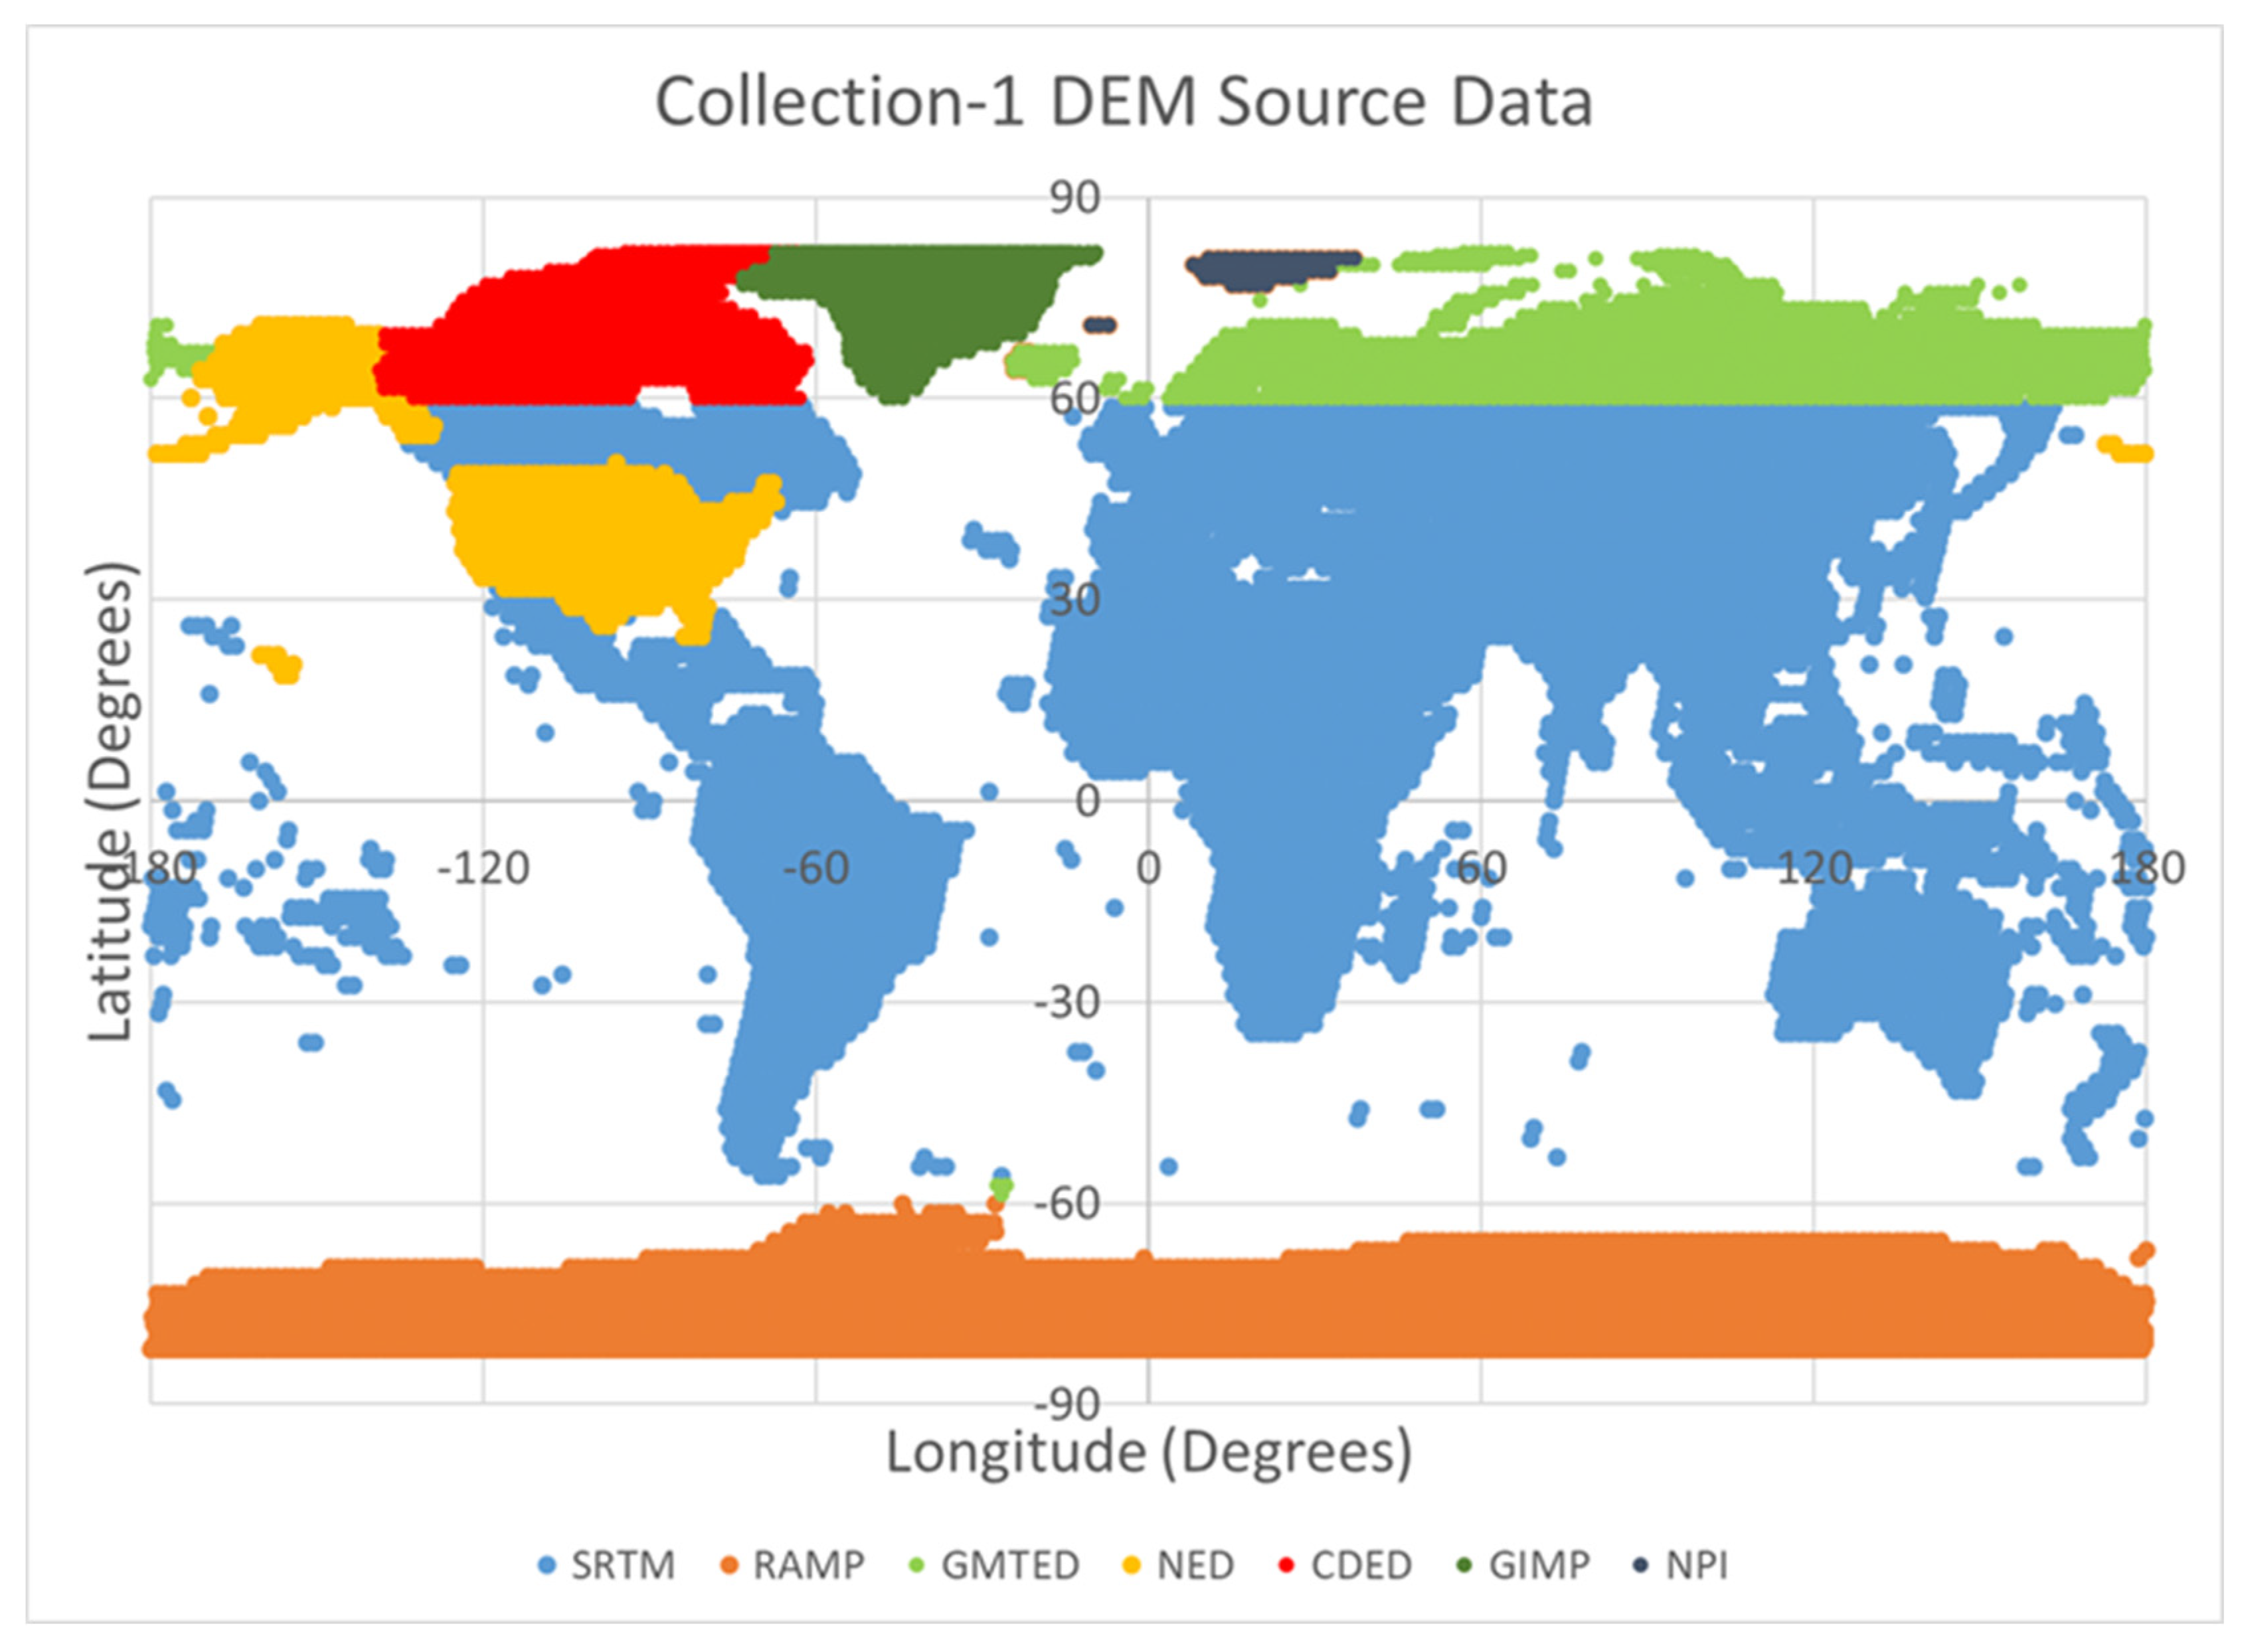
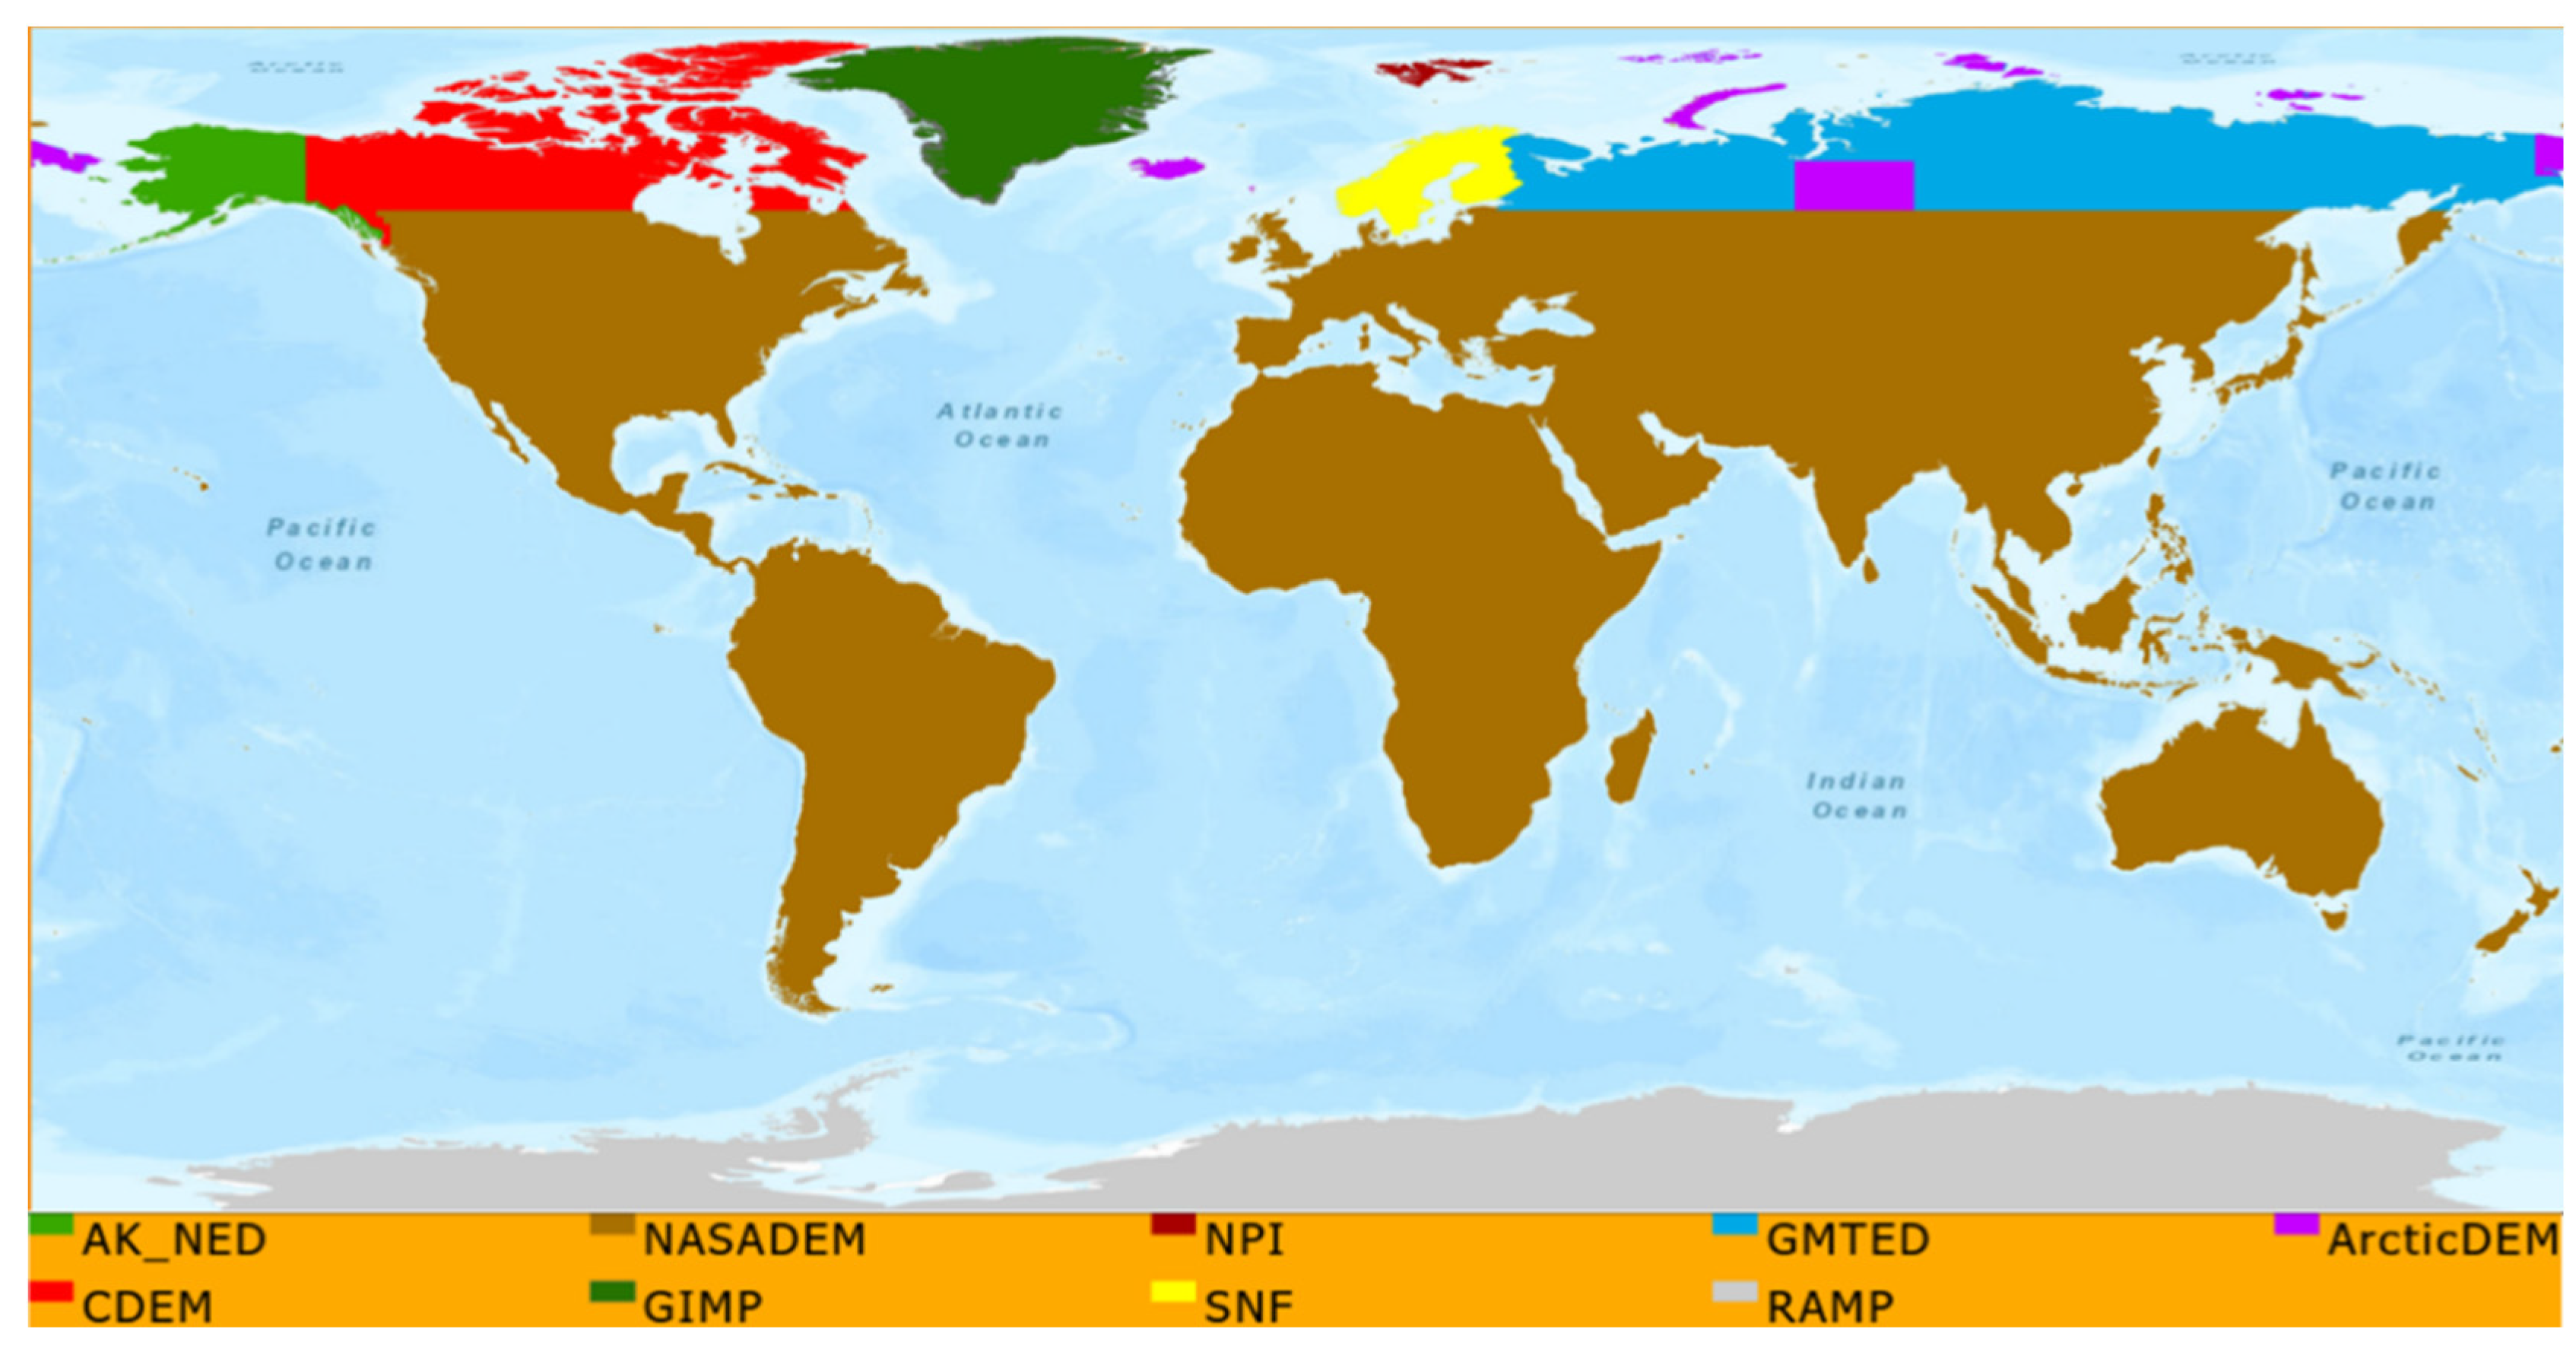
2.2. Landsat Collection-2 DEM
2.3. National Geodetic Survey (NGS)
2.4. Ice, Cloud, and Land Elevation Satellite (ICESat)
3. Methodology
3.1. Accuracy Assessment
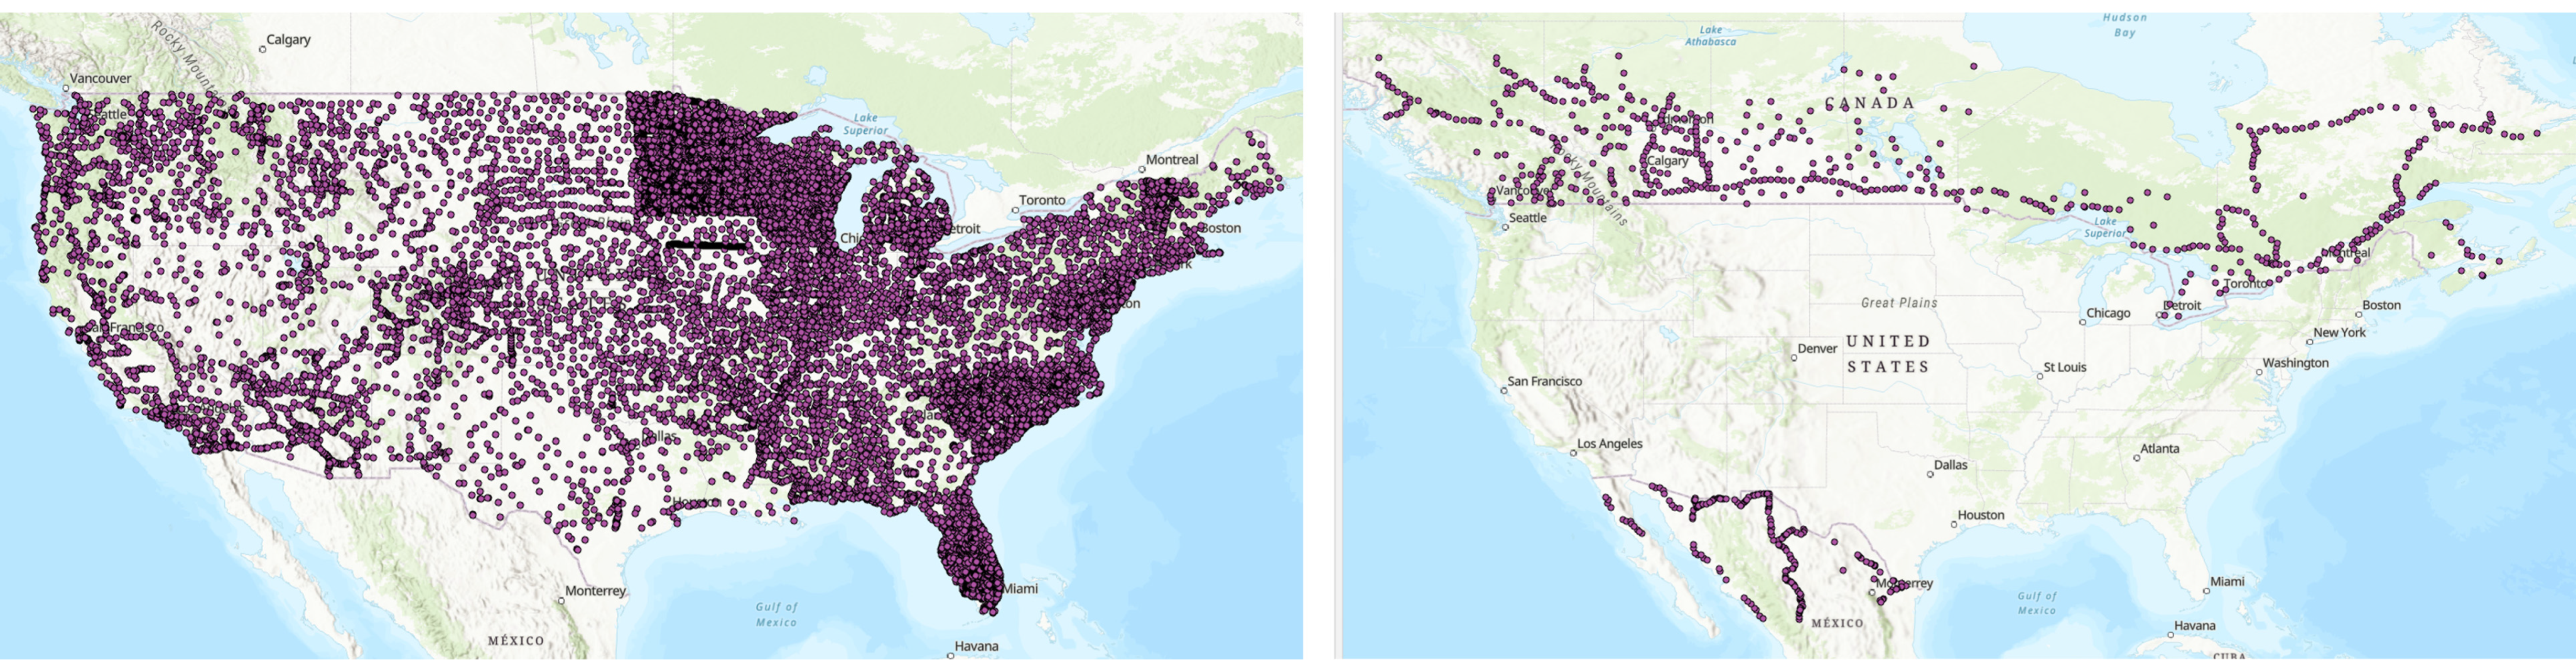
3.1.1. NGS Points
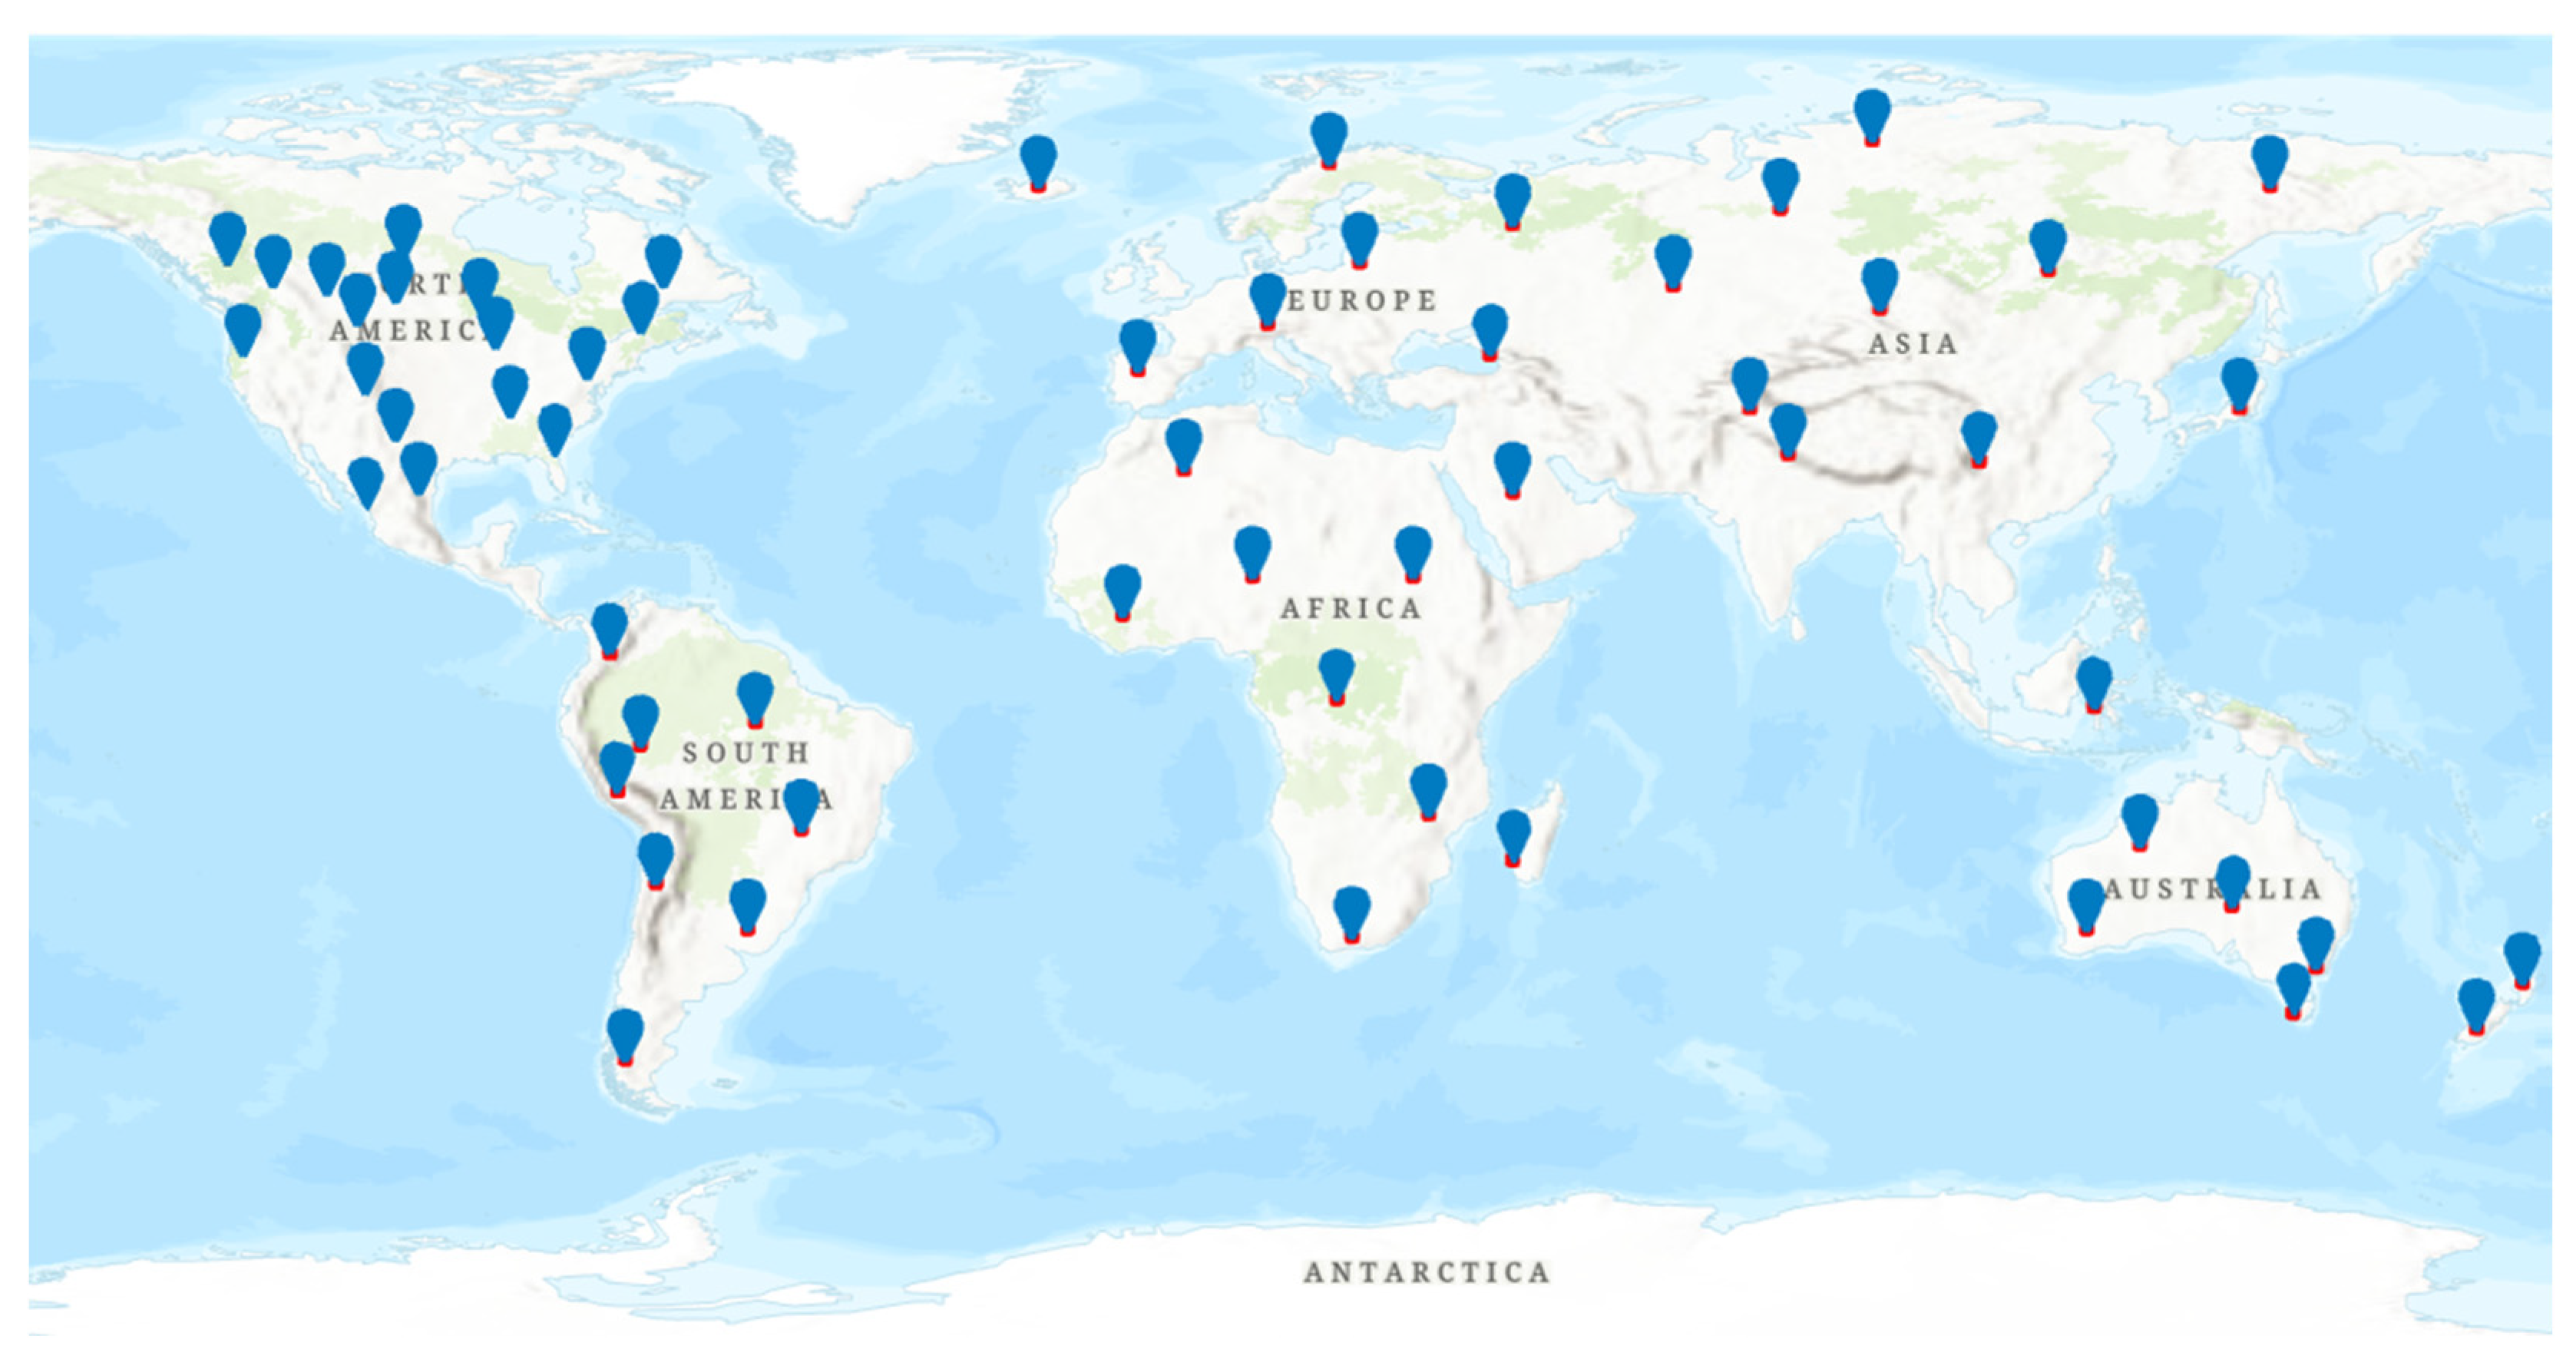
3.1.2. ICESat-2 Advanced Topographic Laser Altimeter System (ATLAS) Points
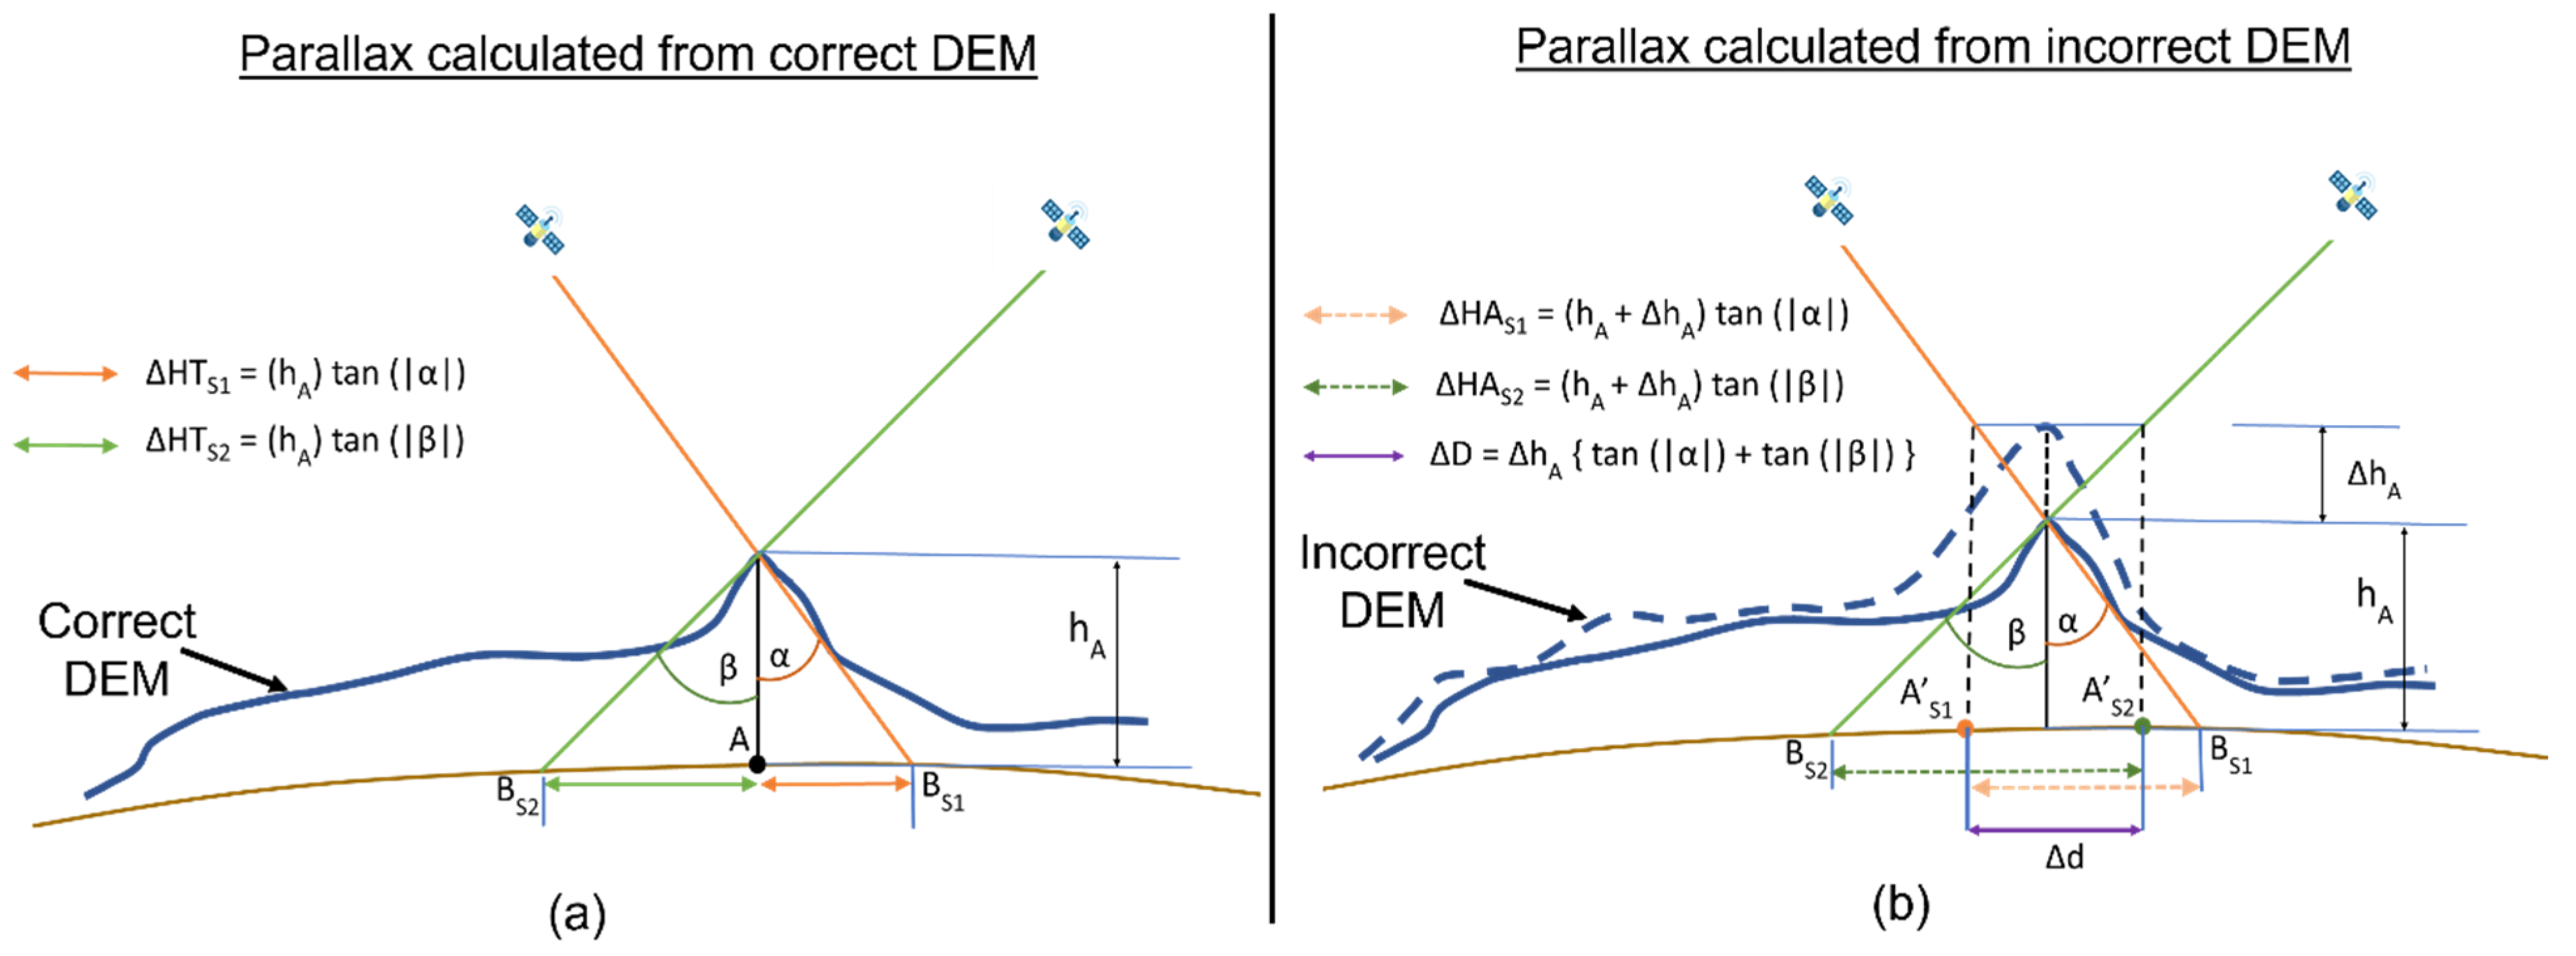
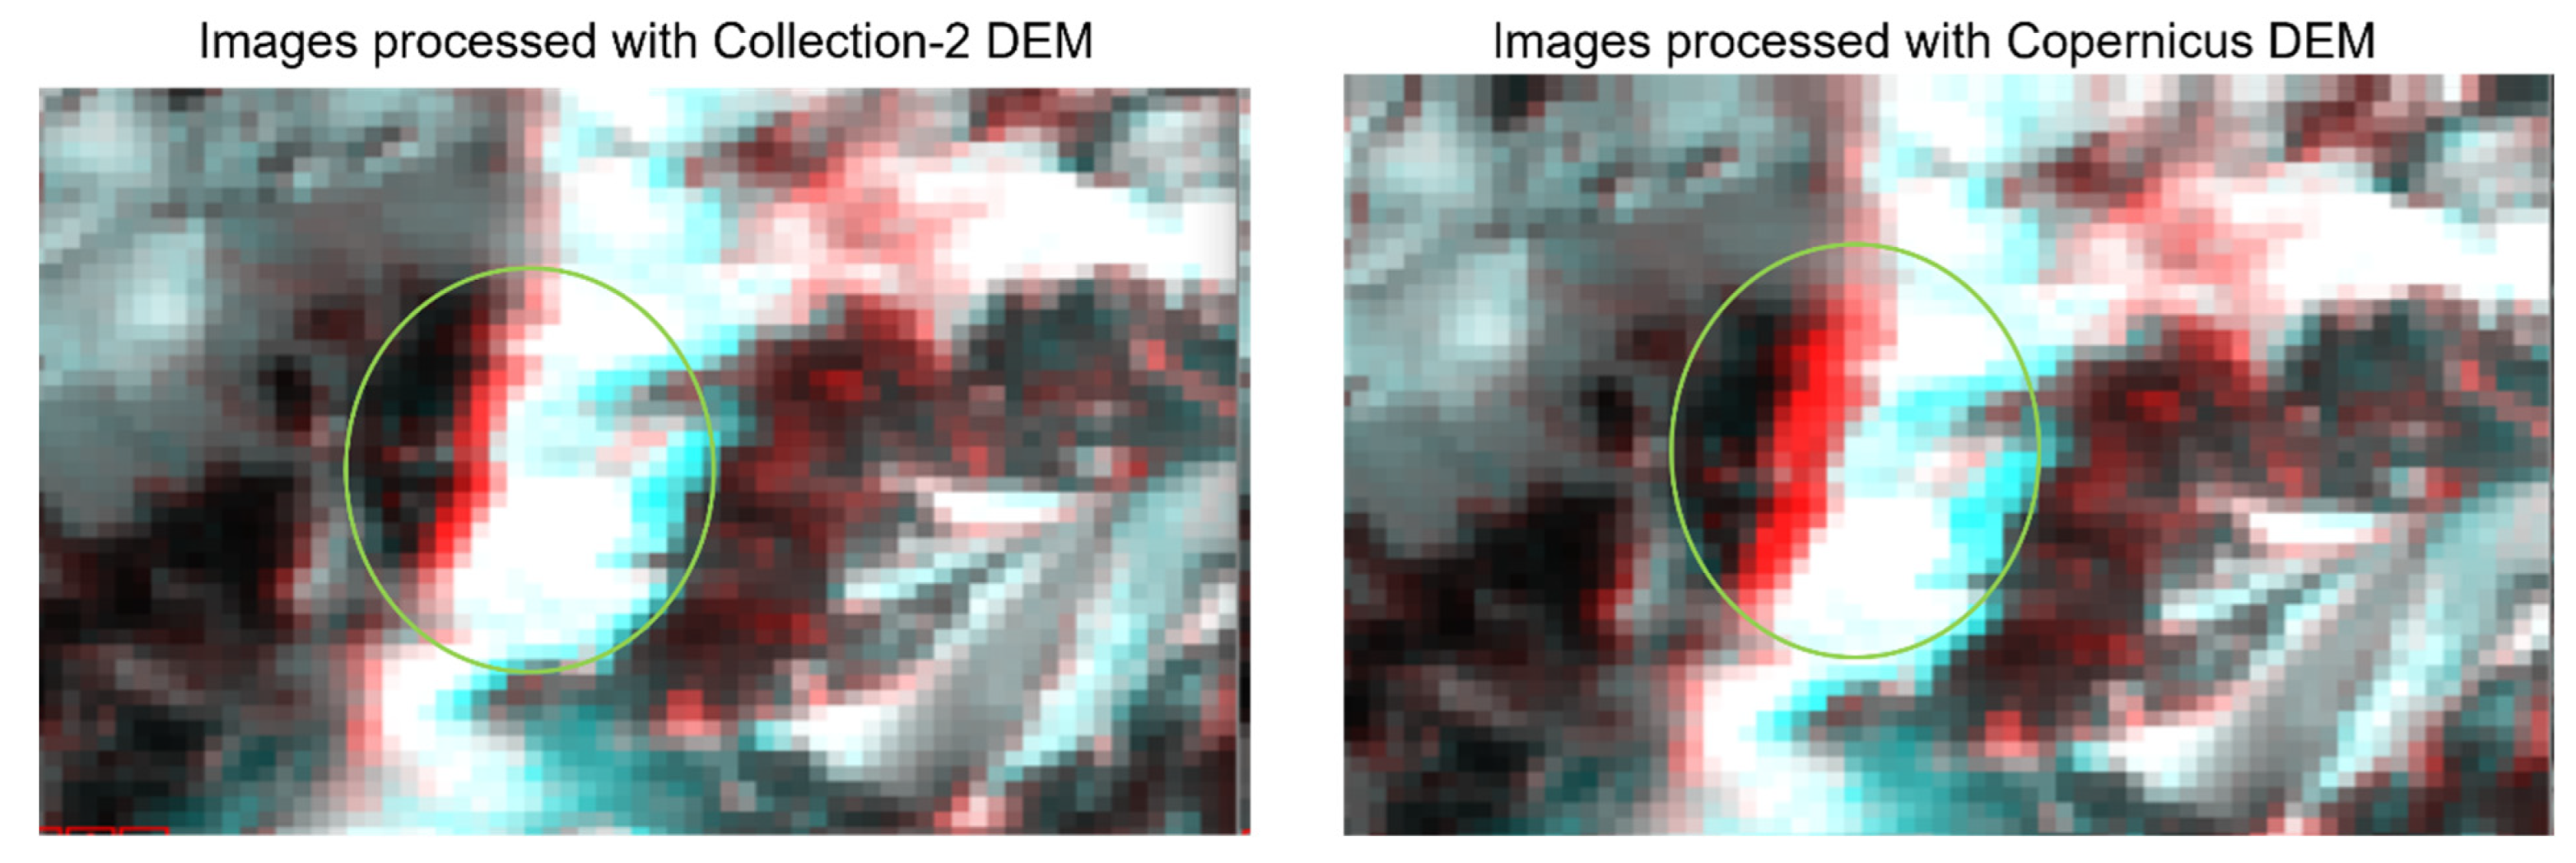
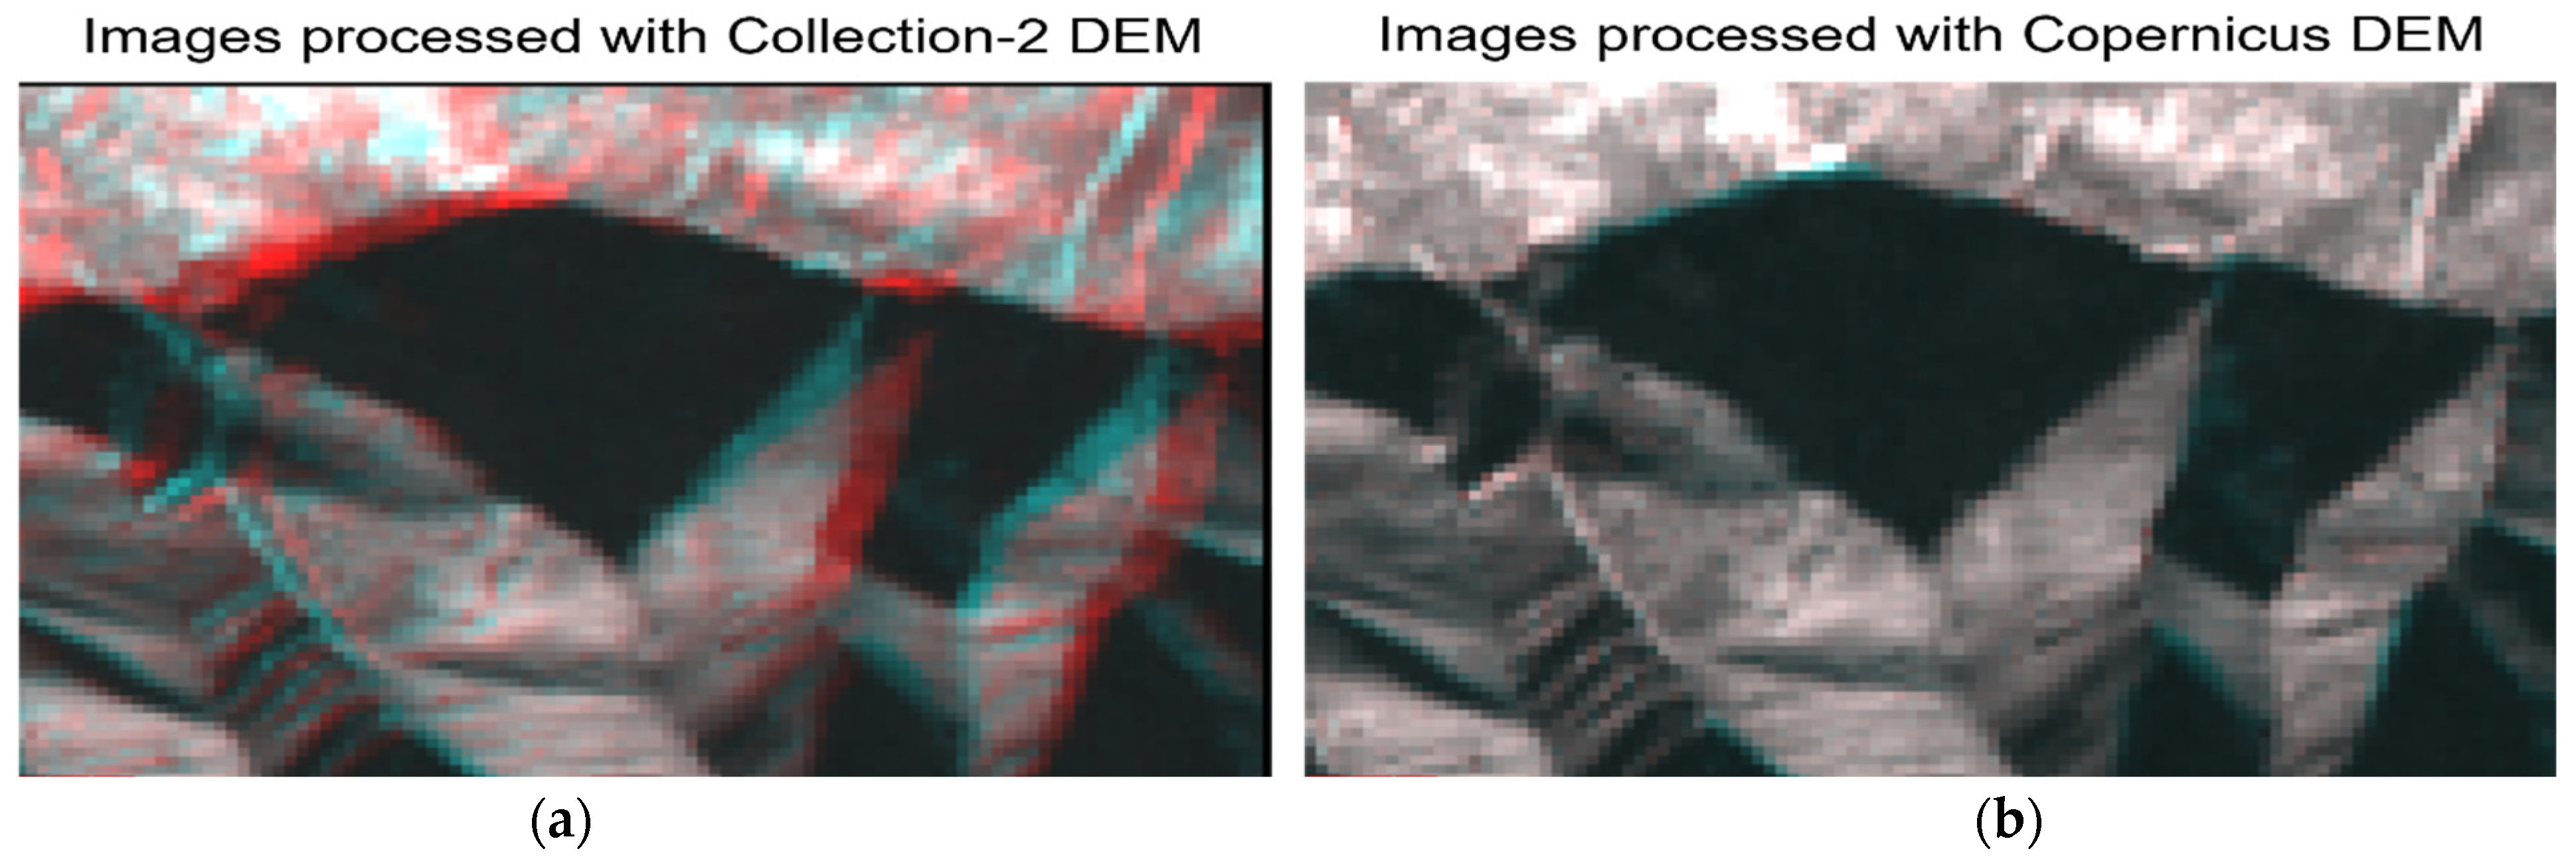
3.2. Anaglyph Analysis
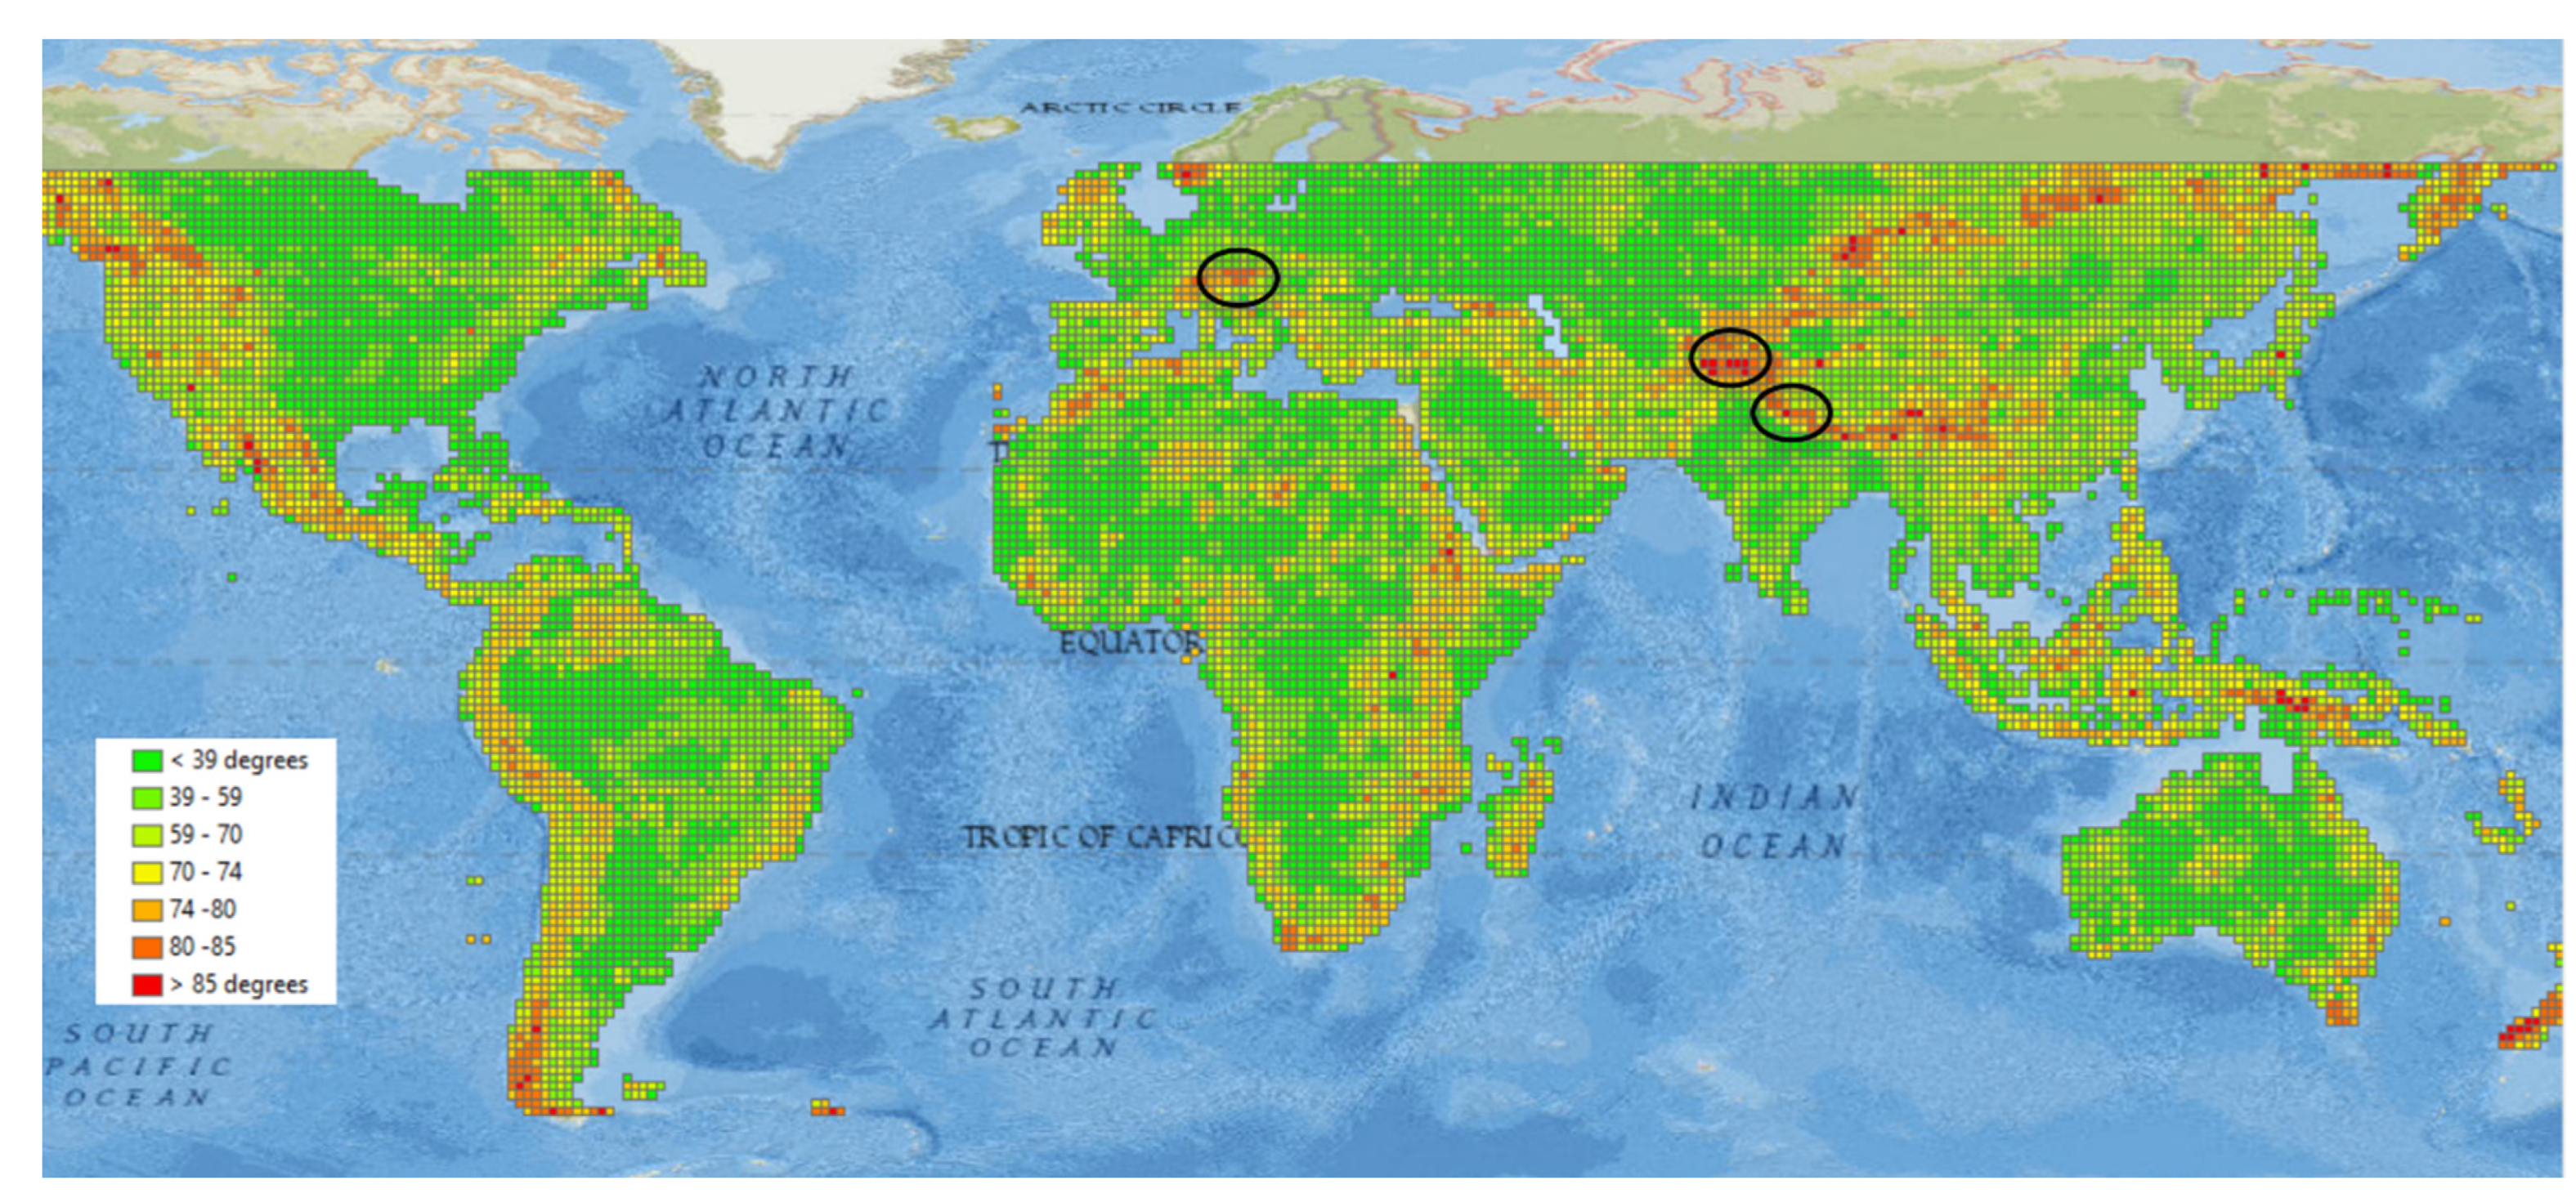
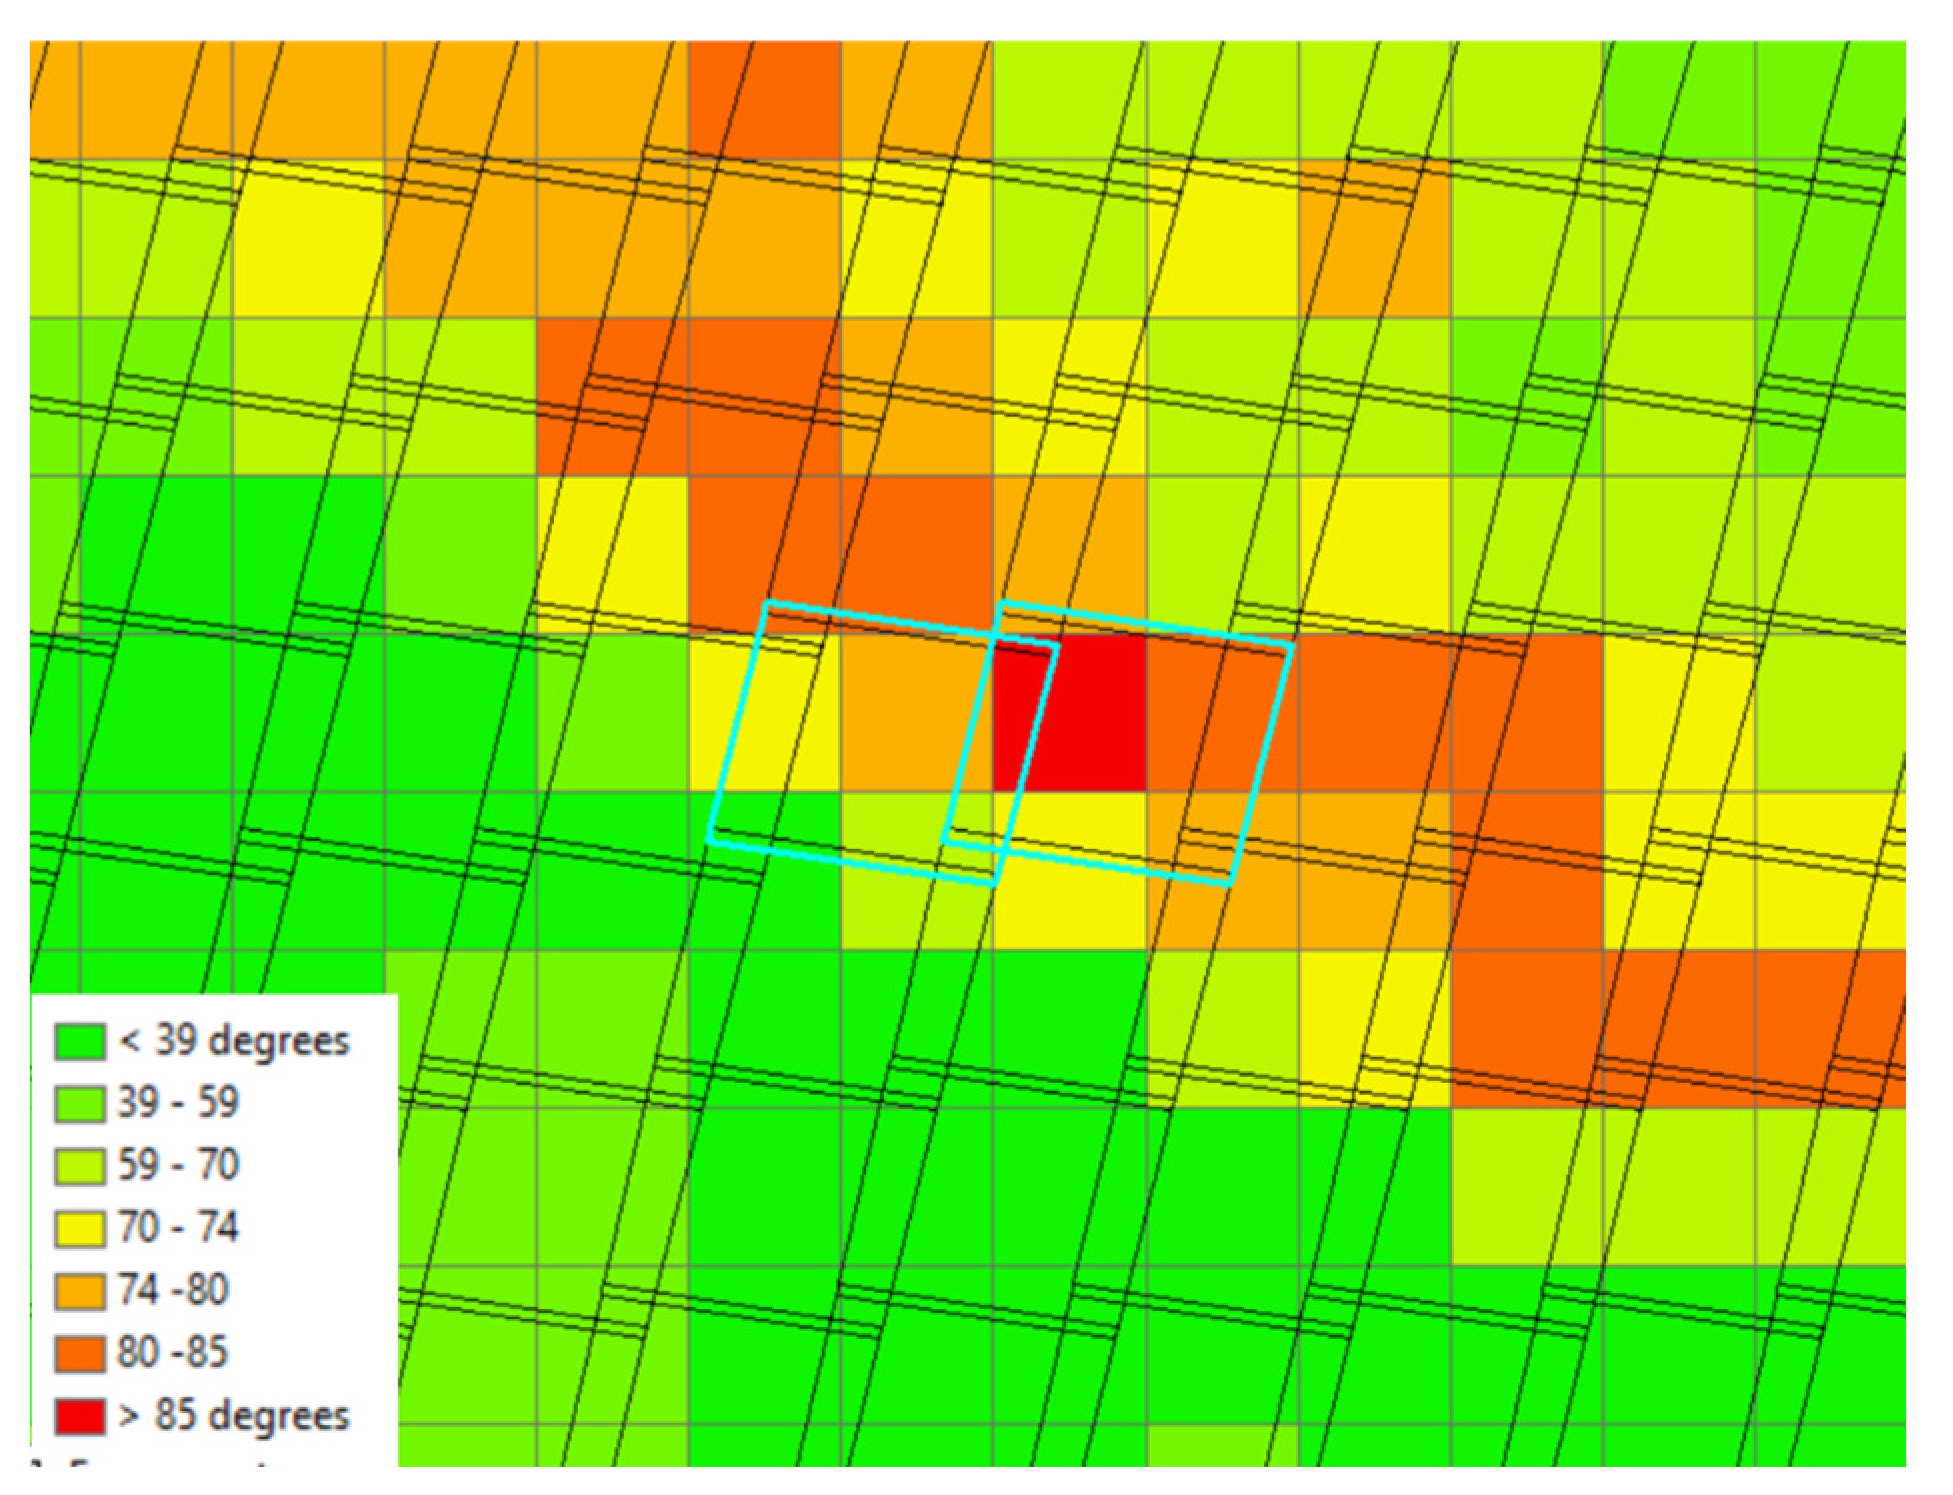
- Find a mountainous region that has significant path-to-path overlap in the WRS-2 grid.
- Within those two overlap** grid cells, process two Landsat images to Level-1 Precision Terrain Correction (L1TP) with the CopDEM and then process them using the Collection-2 DEM. Acquisition dates for the two selected images must be very close (i.e., we found it best if the acquisition dates were within 10 days of one another) to minimize seasonal differences. We prioritized seasonal closeness over temporal closeness, but both were preferred if possible. We used Band 8 (panchromatic) from the Landsat 8 satellite to take advantage of the increased 15 m resolution. We used the USGS Image Assessment System (IAS) to process the imagery.
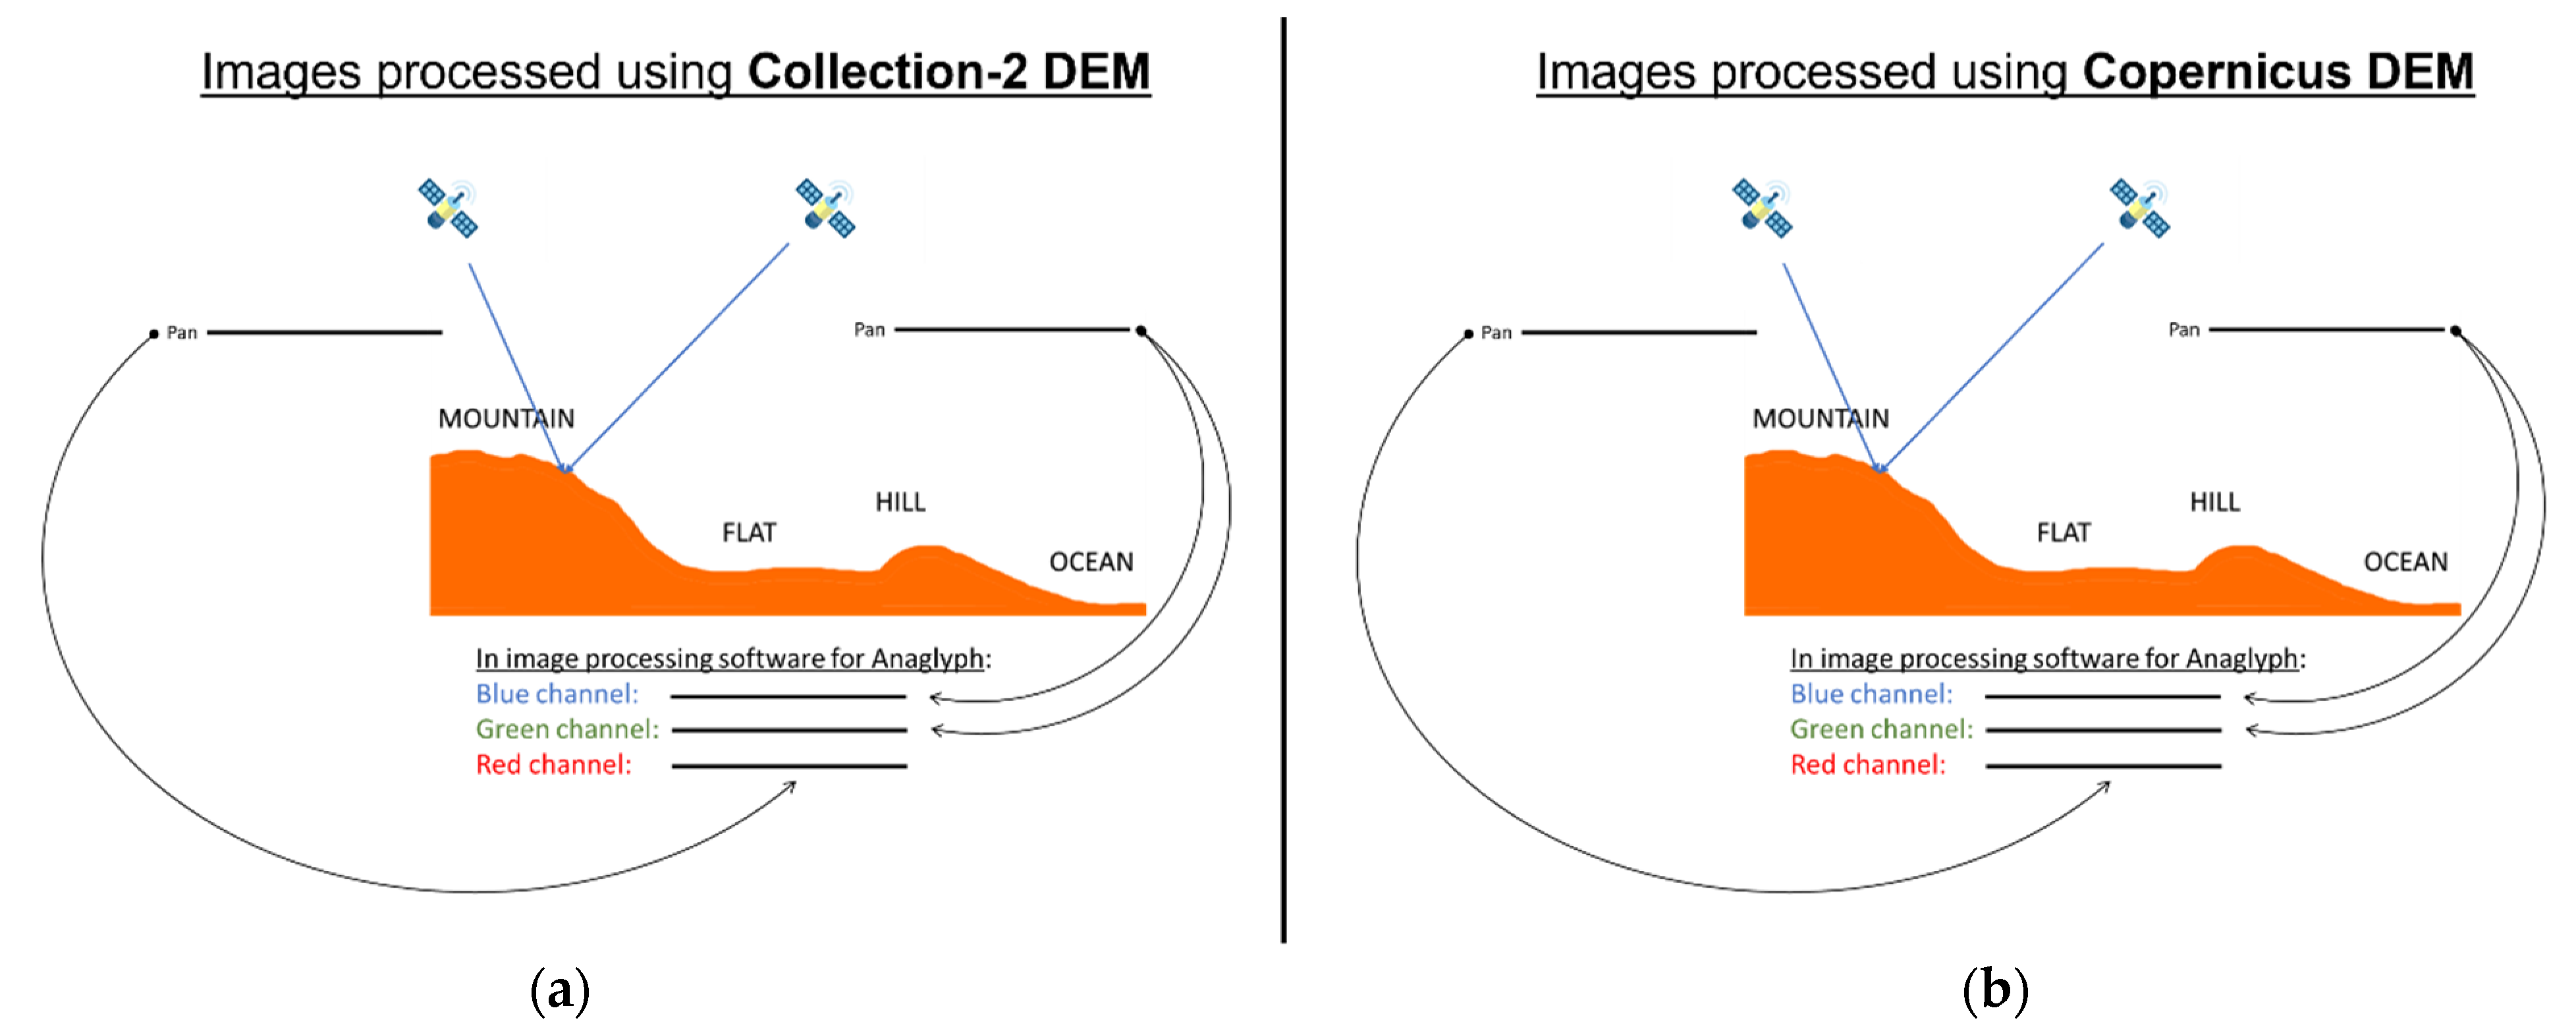
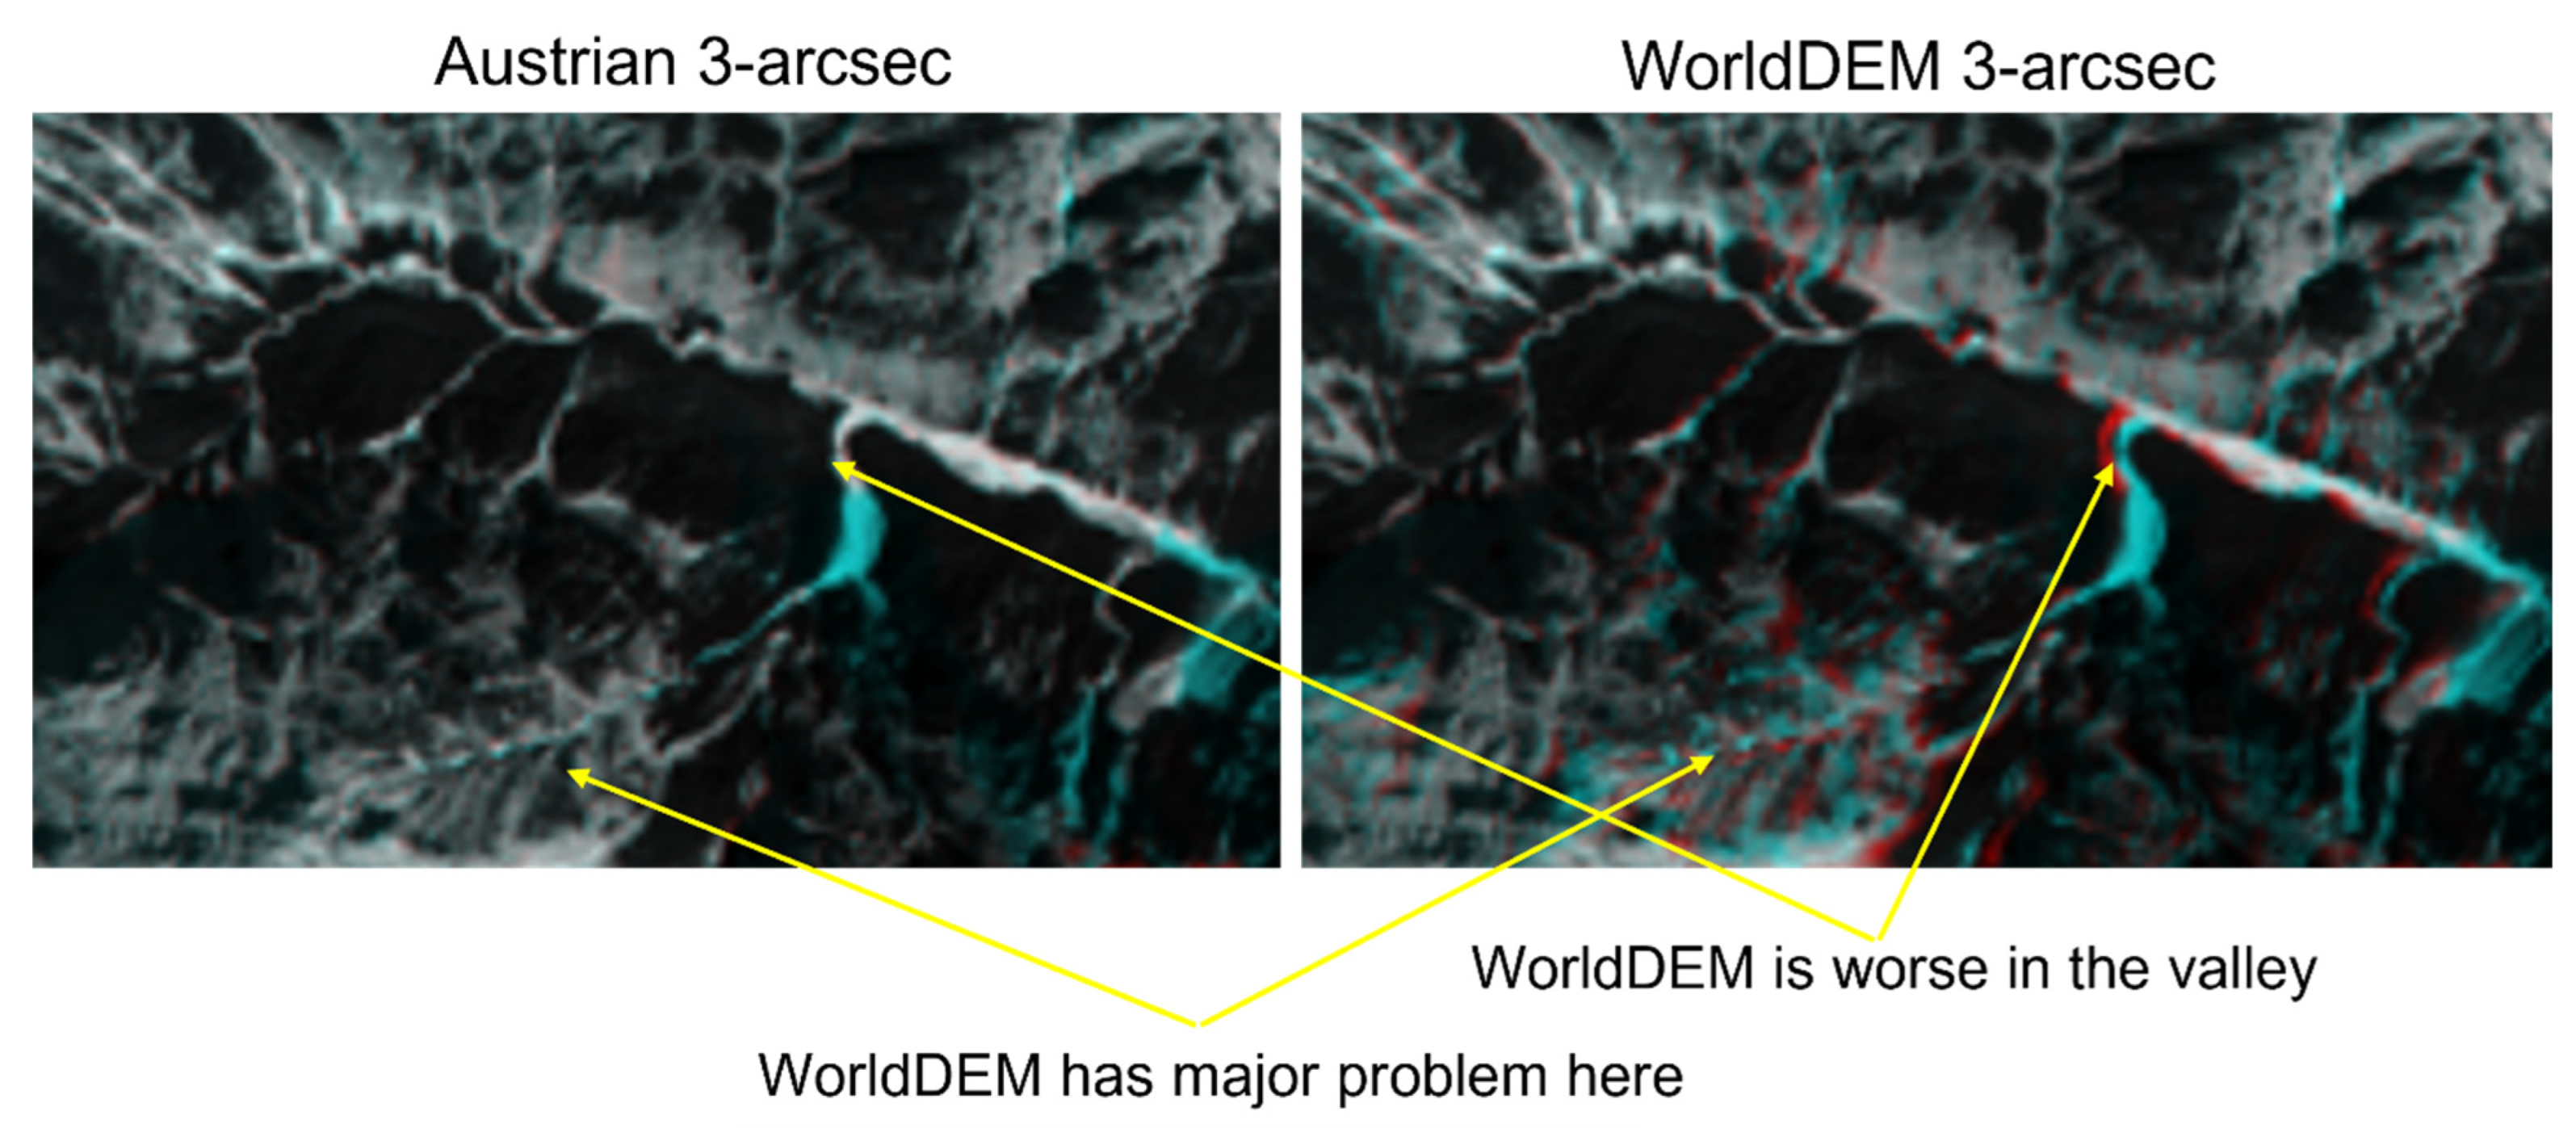
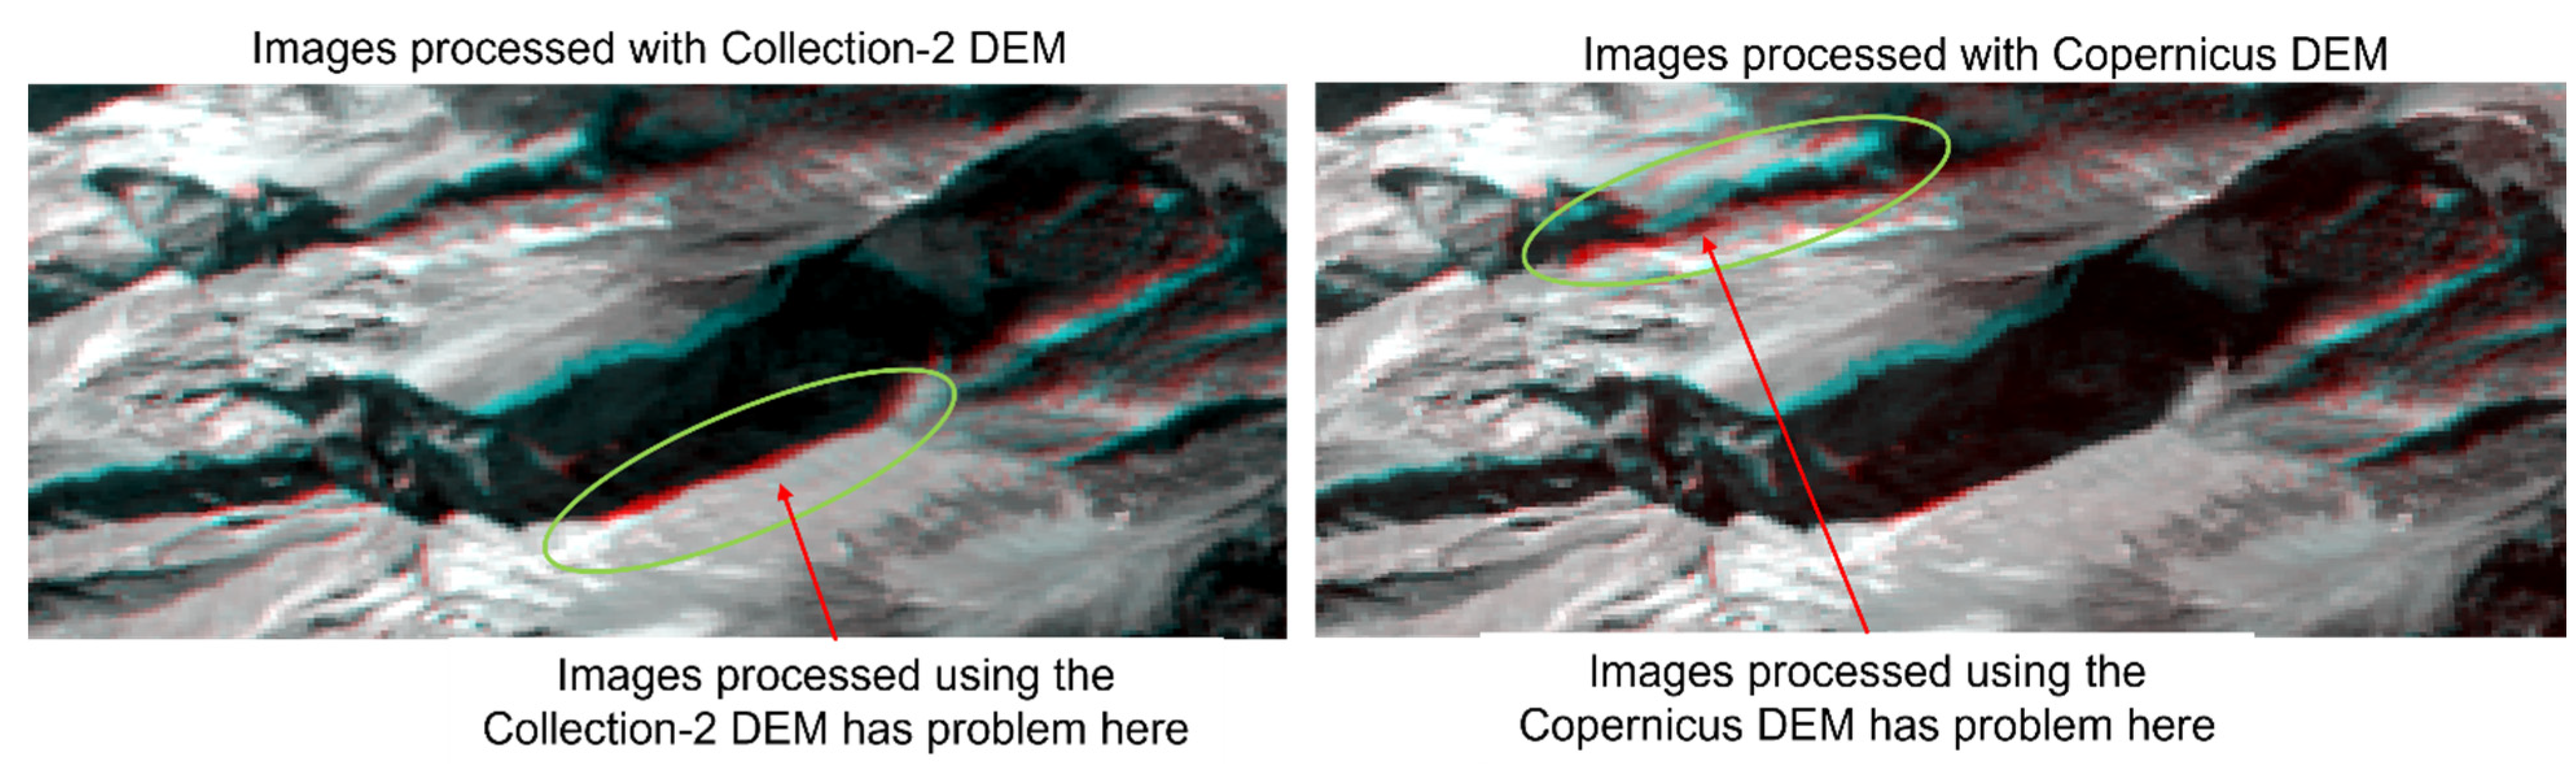
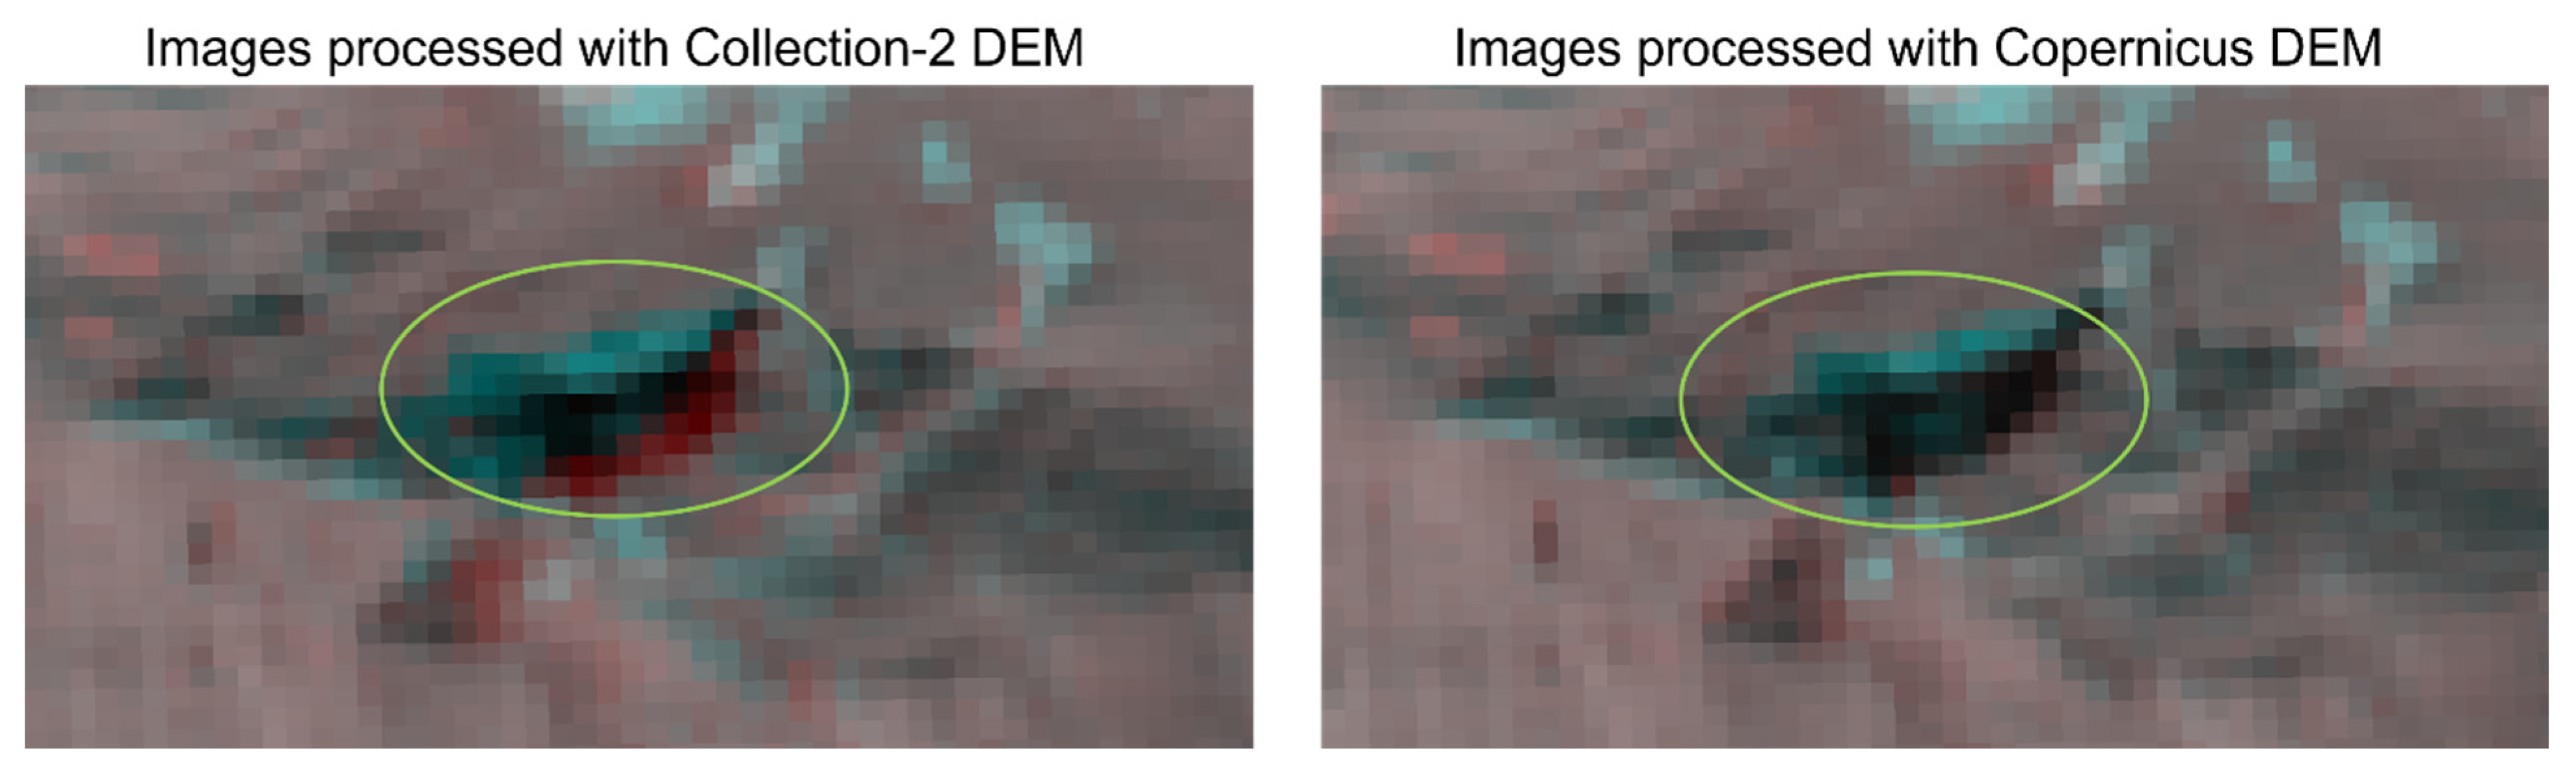
- For each of the image pair composites, set the Green and Blue bands to the same scene and Red to be the other scene from a different view angle. Do this for both cases (with CopDEM and Collection-2 DEM) and compare the results to see if there are differences in the anaglyphs. If one of the RGB composites presents additional shifts in color patterns then there are misalignments between the two images used to create that composite, which are due to the elevation error in the DEM dataset.
3.2.1. South of 60°N. Latitude: NASADEM, Focusing on Regions of High Relief
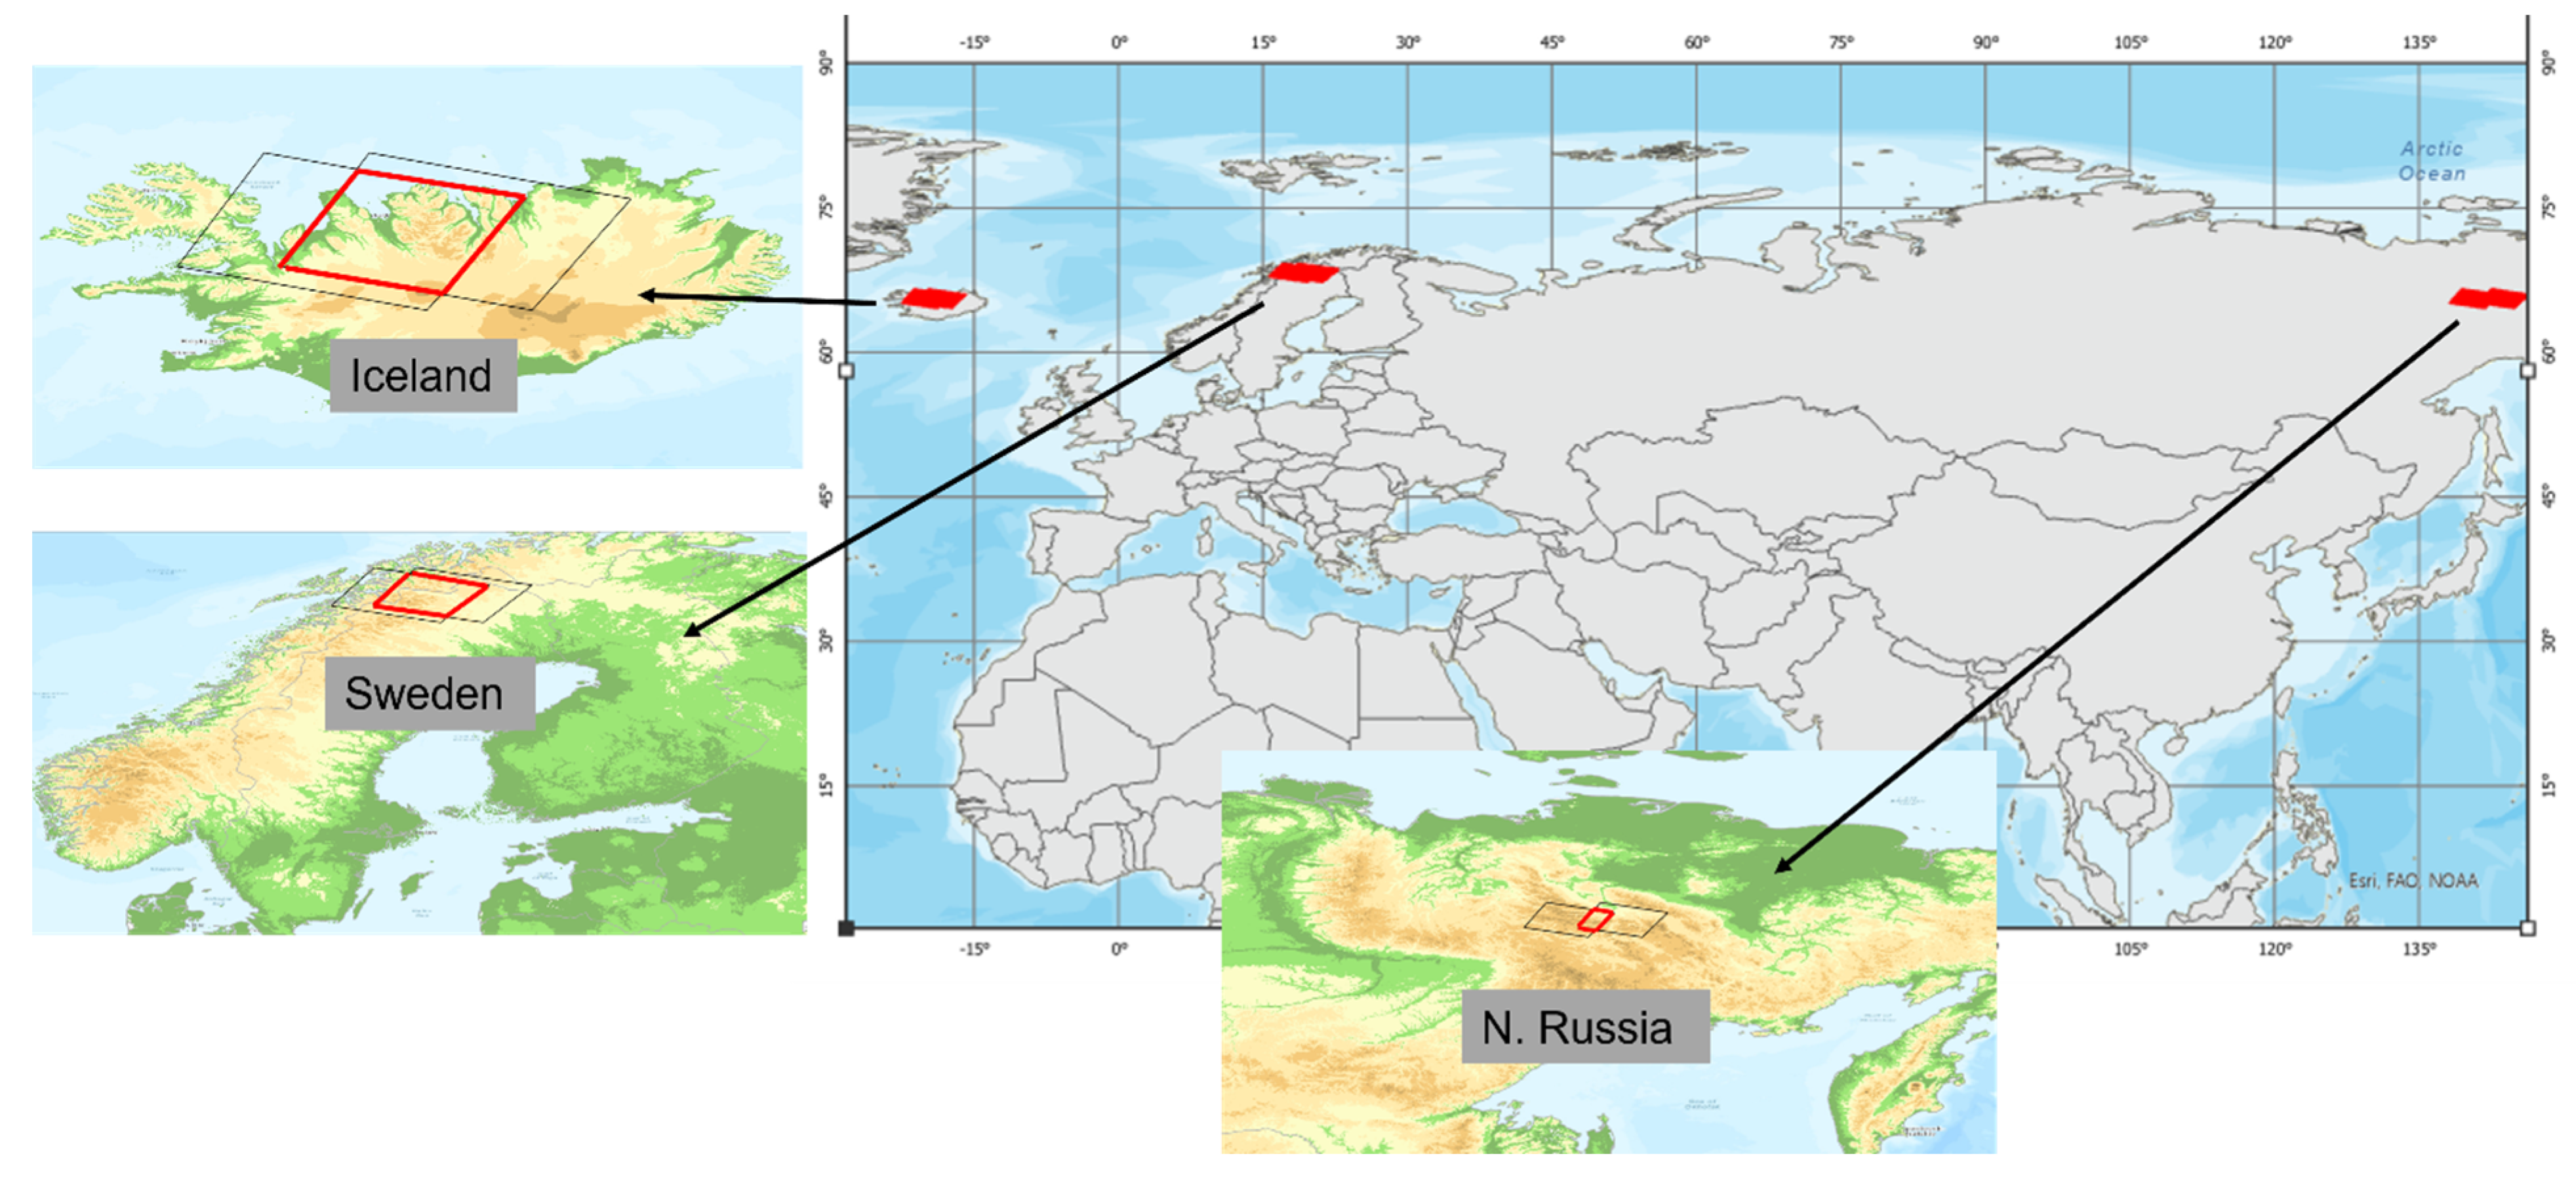
3.2.2. North of 60°N. Latitude: SNF, ArcticDEM, and GMTED
4. Results and Discussion
4.1. Quantitative Assessment
4.1.1. North America Accuracy Assessment Using NGS Points
4.1.2. Global Accuracy Assessment Using ICESat-2 Data
4.2. Qualitative Assessment
4.2.1. Anaglyphs Created South of 60°N. Latitude
4.2.2. Anaglyphs Created North of 60°N. Latitude
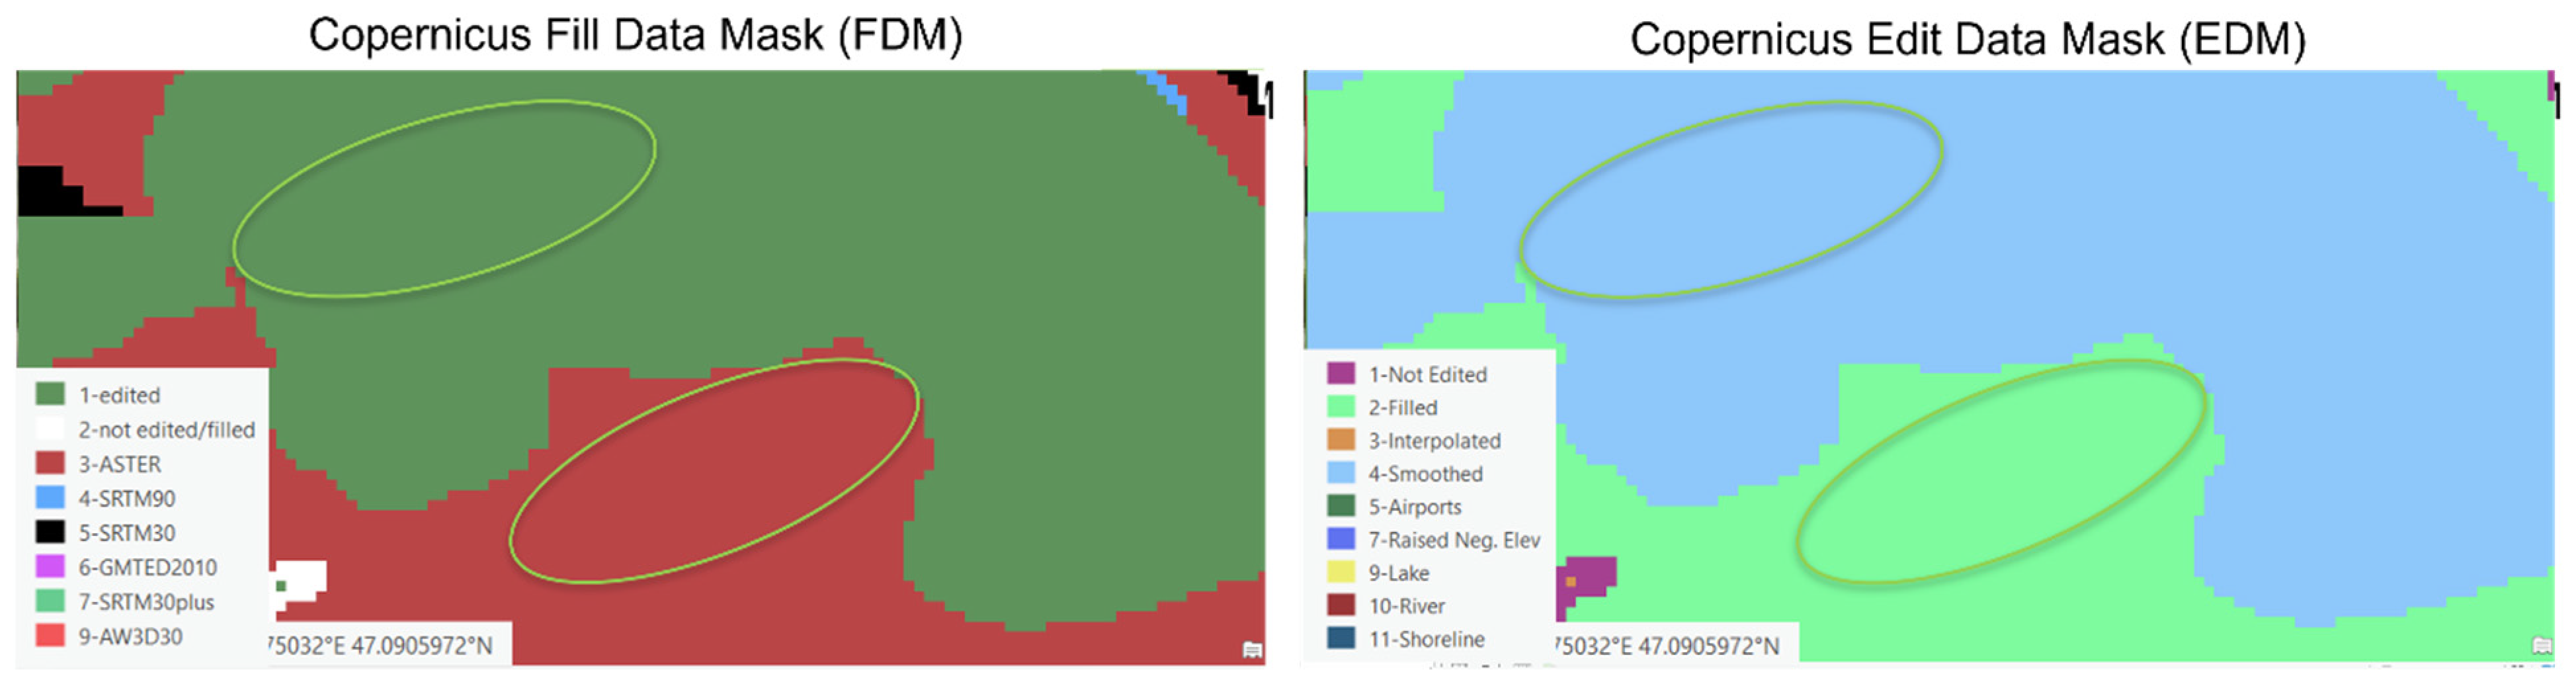
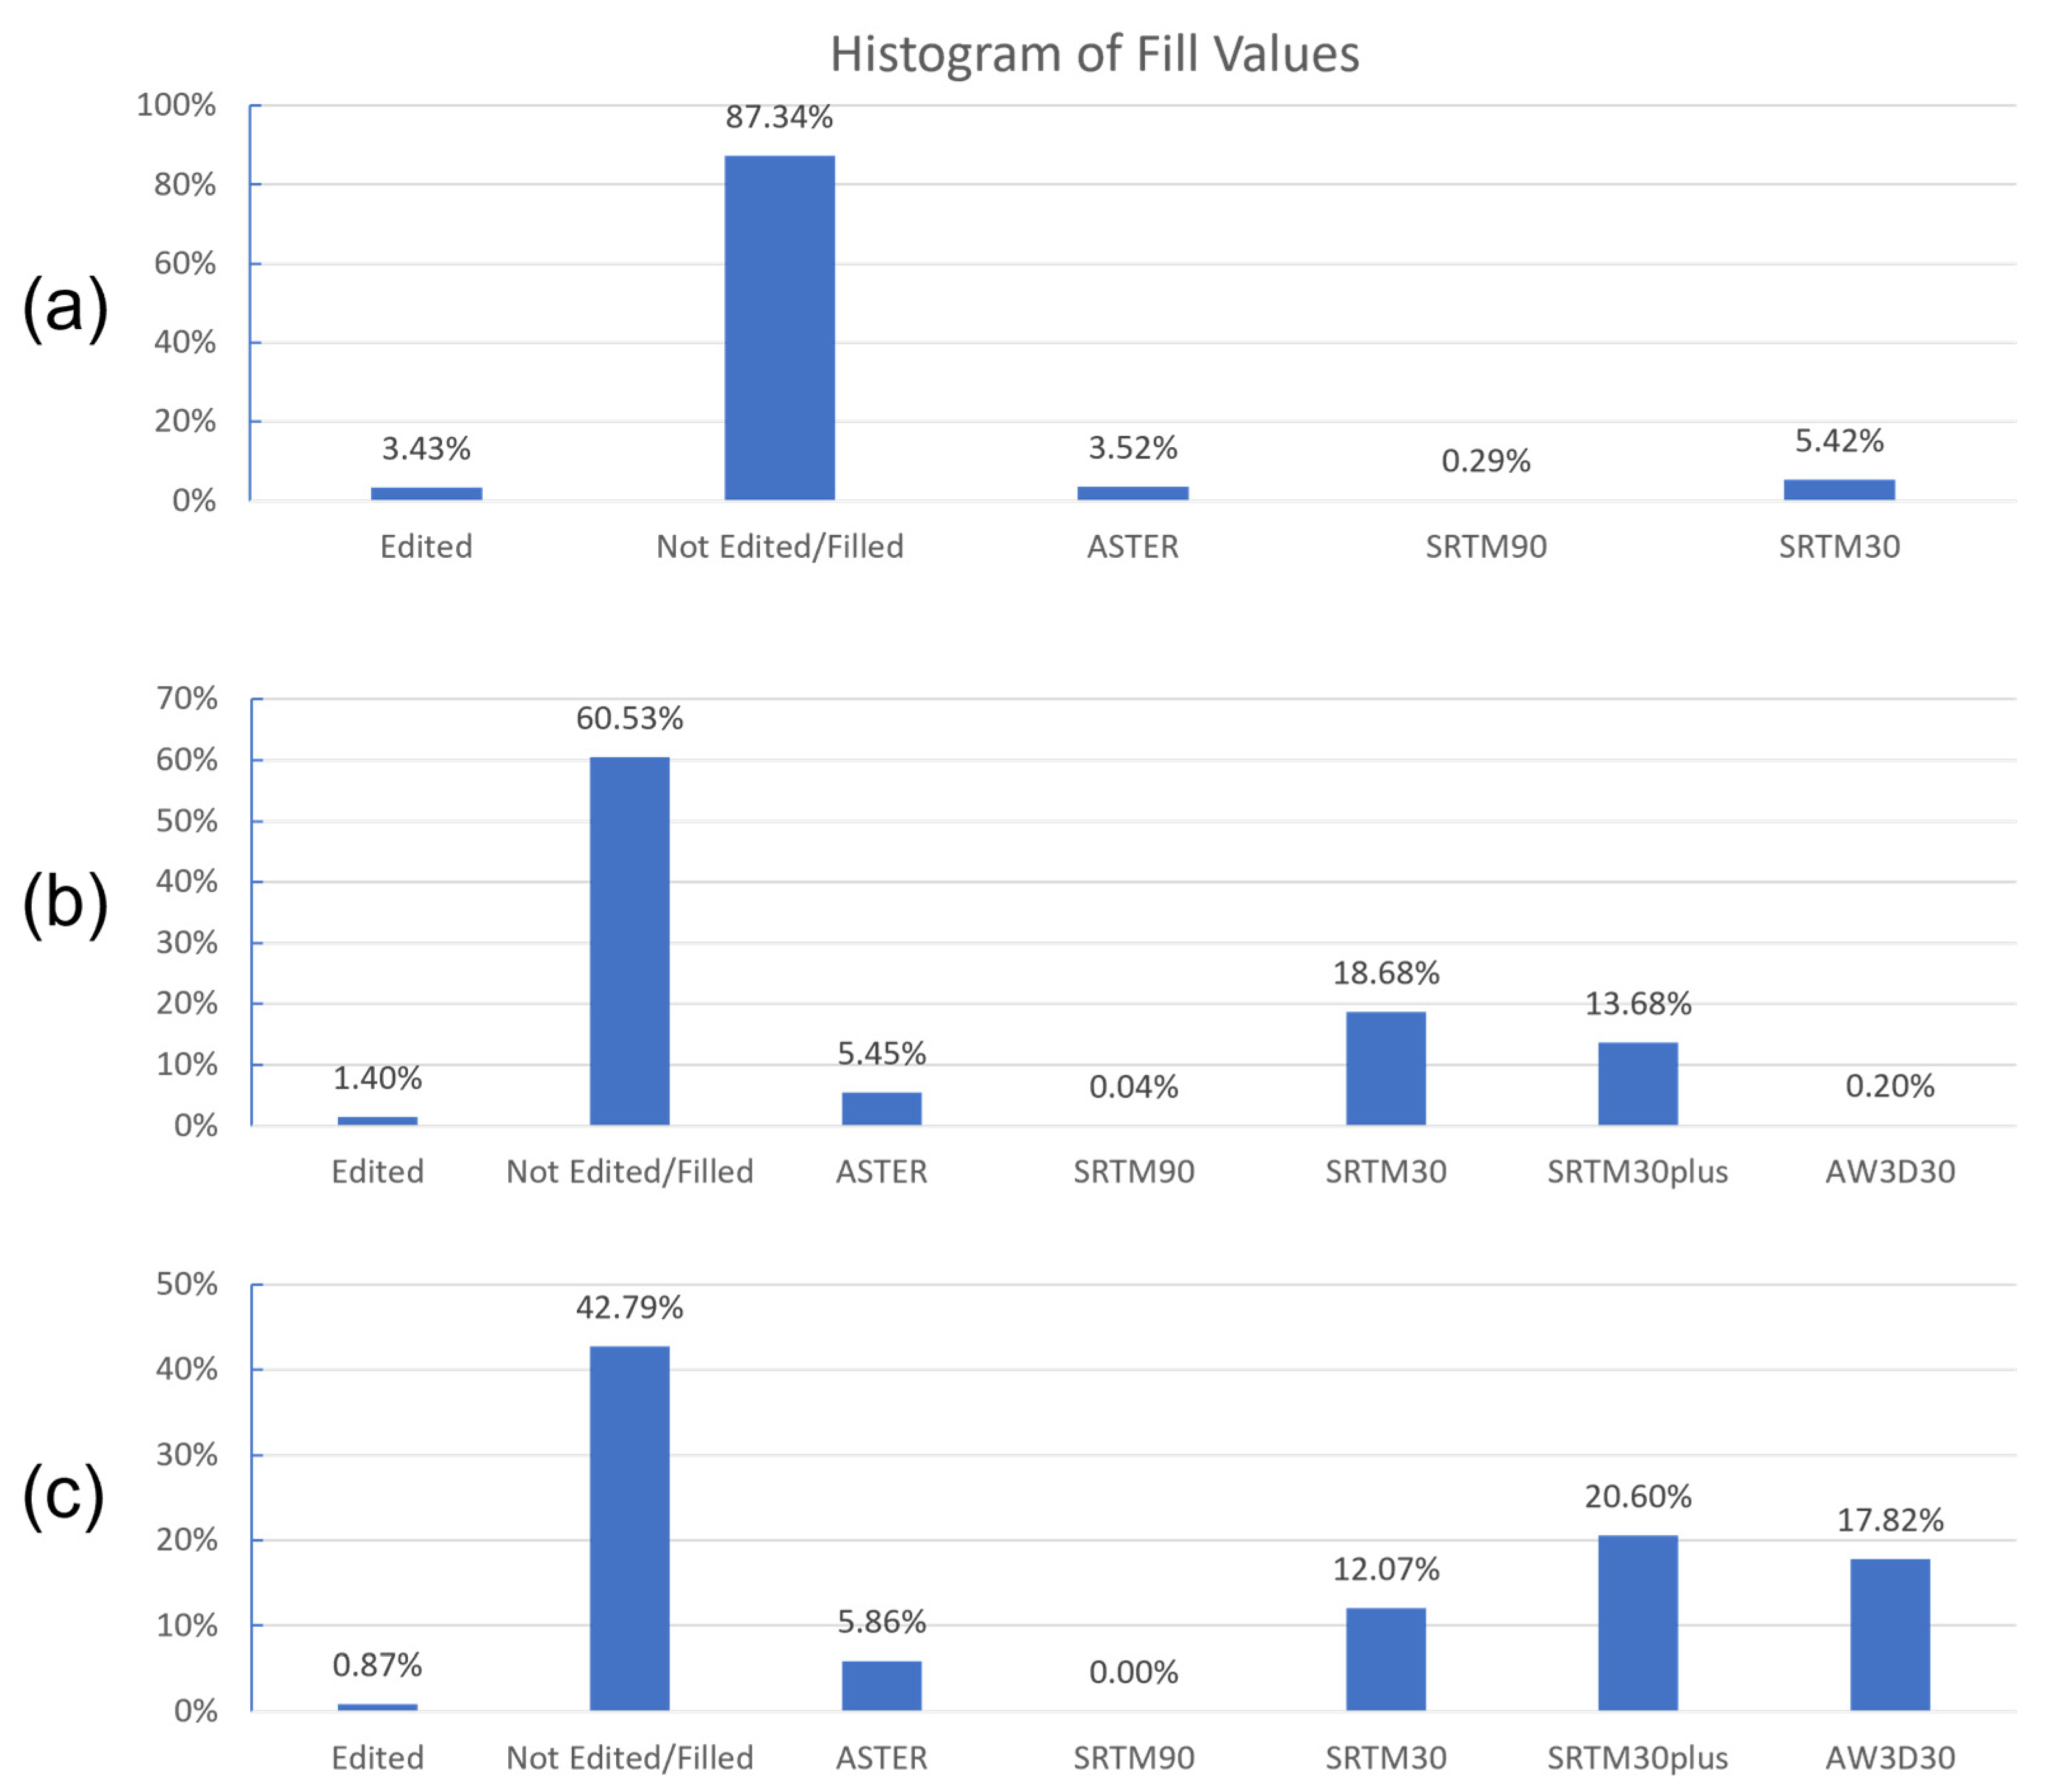
4.2.3. Fill Analysis of CopDEM
5. Conclusions
Author Contributions
Funding
Data Availability Statement
Acknowledgments
Conflicts of Interest
Abbreviations
| ASTER | Advanced Spaceborne Thermal Emission and Reflection Radiometer |
| Cal/Val CDEM | Calibration and Validation Canadian Digital Elevation Model |
| CONUS DEM | Continental United States Digital Elevation Model |
| DGED DSM | Defense Gridded Elevation Data Digital Surface Model |
| DTED | Digital Terrain Elevation Data |
| DTM | Digital Terrain Model |
| EGM | Earth Gravity Model |
| ESA ESRI | European Space Agency Environmental Systems Research Institute |
| GDEM | Global Digital Elevation Model |
| GLS | Global Land Survey |
| GMTED2010 | Global Multiresolution Terrain Elevation Data 2010 |
| ICESat | Ice, Cloud, and Land Elevation Satellite |
| NASA | National Aeronautics and Space Administration |
| NED | National Elevation Dataset |
| NGS NPI | National Geodetic Survey Norwegian Polar Institute |
| RAMP | Radarsat Antarctic Map** Project |
| RMSE | Root Mean Square Error |
| SNF SRTM | Sweden–Norway–Finland DEM Shuttle Radar Topography Mission |
| STD | Standard Deviation |
| USGS | U.S. Geological Survey |
References
- Franks, S.; Storey, J.; Rengarajan, R. The New Landsat Collection-2 Digital Elevation Model. Remote Sens. 2020, 12, 3909. [Google Scholar] [CrossRef]
- Crippen, R.; Buckley, S.; Agram, P.; Belz, E.; Gurrola, E.; Hensley, S.; Kobrick, M.; Lavalle, M.; Martin, J.; Neumann, M.; et al. Nasadem Global Elevation Model: Methods and Progress. Int. Arch. Photogramm. Remote Sens. Spatial Inf. Sci. 2016, XLI-B4, 125–128. [Google Scholar] [CrossRef]
- Gesch, B.; Muller, J.; Farr, T.G. The Shuttle Radar Topography Mission-Data Validation and Applications. Photogramm. Eng. Remote Sens. 2006, 72, 233. [Google Scholar]
- Noltimier, K.F.; Jezek, K.C.; Sohn, H.G.; Li, B.; Liu, H.; Baumgartner, F.; Kaupp, V.; Curlander, J.C.; Wilson, B.; Onstott, R. RADARSAT Antarctic Map** Project-Mosaic Construction. In Proceedings of the IEEE 1999 International Geoscience and Remote Sensing Symposium. (Cat. No.99CH36293), Hamburg, Germany, 28 June–2 July 1999; Volume 5, pp. 2349–2351. [Google Scholar]
- Danielson, J.J.; Gesch, D.B. Global Multi-Resolution Terrain Elevation Data 2010 (GMTED2010); US Department of the Interior, US Geological Survey: Washington, DC, USA, 2011.
- Fact Sheet 2009-3053: The National Map-Elevation. Available online: https://pubs.usgs.gov/fs/2009/3053/ (accessed on 15 March 2023).
- Natural Resources of Canada Canadian Digital Elevation Model: Product Specifications-Edition 1.1; Map Information; Government of Canada, Natural Resources: Ottawa, Canada, 2016.
- Howat, I.; Negrete, A.; Smith, B. MEaSURES Greenland Ice Map** Project (GIMP) Digital Elevation Model, Version 1. Cryosphere 2015, 8, 1509–1518. [Google Scholar] [CrossRef]
- Jaklin, G.S. NORwEGIAN POLAR INsTITUTE. 2006. Available online: https://www.npolar.no/en/ (accessed on 15 March 2023).
- Rengarajan, R.; Choate, M.; Storey, J.C.; Franks, S.; Micijevic, E. Landsat Collection 2 Geometric Calibration Updates. In Earth Observing Systems; SPIE: Washington, DC, USA, 2020; Volume 11501. [Google Scholar]
- Landsat Collection 2 Fact Sheet; U.S. Geological Survey: Reston, VA, USA, 2021; Series: 2021–3002.
- Rizzoli, P.; Martone, M.; Gonzalez, C.; Wecklich, C.; Tridon, D.B.; Bräutigam, B.; Bachmann, M.; Schulze, D.; Fritz, T.; Huber, M. Generation and Performance Assessment of the Global TanDEM-X Digital Elevation Model. ISPRS J. Photogramm. Remote Sens. 2017, 132, 119–139. [Google Scholar] [CrossRef]
- Wessel, B.; Huber, M.; Wohlfart, C.; Marschalk, U.; Kosmann, D.; Roth, A. Accuracy Assessment of the Global TanDEM-X Digital Elevation Model with GPS Data. ISPRS J. Photogramm. Remote Sens. 2018, 139, 171–182. [Google Scholar] [CrossRef]
- Buckley, S.; Agram, P.S.; Belz, J.E.; Crippen, R.E.; Gurrola, E.M.; Hensley, S.; Kobrick, M.; Lavalle, M.; Martin, J.M.; Neumann, M.; et al. NASADEM Initial Production Processing Results: Shuttle Radar Topography Mission (SRTM) Reprocessing with Improvements. In Proceedings of the AGU Fall Meeting Abstracts, San Francisco, CA, USA, 12–16 December 2016; Volume 2016, p. G43A-1042. [Google Scholar]
- Høydedata Verrabotn 2007-Kartkatalogen. Available online: https://kartkatalog-geonorge-no.translate.goog/metadata/hoeydedata-verrabotn-2007/499893f8-2f6c-4fb2-949c-a273c1237d12 (accessed on 15 November 2021).
- Lantmäteriverket GSD Geografiska SverigeData. Produktbeskrivning: GSD-Höjddata, Grid 50+; Lantmäteriverket Stockholm. 2010. Available online: https://www.lantmateriet.se/en/geodata/geodata-products/product-list/terrain-model-download-grid-50/ (accessed on 2 May 2023).
- Digital Elevation Model|National Land Survey of Finland. Available online: https://www.maanmittauslaitos.fi/en/research/interesting-topics/digital-elevation-model (accessed on 15 November 2021).
- Morin, P.; Porter, C.; Cloutier, M.; Howat, I.; Noh, M.-J.; Willis, M.; Bates, B.; Willamson, C.; Peterman, K. ArcticDEM; A Publically Available, High Resolution Elevation Model of the Arctic. Egu Gen. Assem. Conf. Abstr. 2016, p. EPSC2016-8396. [Google Scholar]
- Newly Released Elevation Dataset Highlights Value, Importance of International Partnerships|U.S. Geological Survey. Available online: https://www.usgs.gov/news/newly-released-elevation-dataset-highlights-value-importance-international-partnerships (accessed on 22 December 2022).
- Bielski, C.; López-Vázquez, C.; Grohmann, C.H.; Guth., P.L.; TMSG DEMIX Working Group. DEMIX Wine Contest Method Ranks ALOS AW3D30, COPDEM, and FABDEM as Top 1 “Global DEMs. ar** 2011: Technologies and Applications, Nan**g, China, 26–29 May 2011; SPIE: Washington, DC, USA; Volume 8286, pp. 532–544. [Google Scholar]
- Saksena, S.; Merwade, V. Incorporating the Effect of DEM Resolution and Accuracy for Improved Flood Inundation Map**. J. Hydrol. 2015, 530, 180–194. [Google Scholar] [CrossRef]
- Teng, J.; Spencer, G. Impact of DEM Accuracy and Resolution on Topographic Indices. Environ. Model. Softw. 2010, 25, 1086–1098. [Google Scholar] [CrossRef]
- Zhang, J.X.; Chang, K.; Wu, J.Q. Effects of DEM Resolution and Source on Soil Erosion Modelling: A Case Study Using the WEPP Model. Int. J. Geogr. Inf. Sci. 2008, 22, 925–942. [Google Scholar] [CrossRef]
- Polidori, L.; El Hage, M. Digital Elevation Model Quality Assessment Methods: A Critical Review. Remote Sens. 2020, 12, 3522. [Google Scholar] [CrossRef]
- González, C.; Bachmann, M.; Bueso-Bello, J.-L.; Rizzoli, P.; Zink, M. A Fully Automatic Algorithm for Editing the TanDEM-X Global DEM. Remote Sens. 2020, 12, 3961. [Google Scholar] [CrossRef]


| DGED Format | |||||||
|---|---|---|---|---|---|---|---|
| Copernicus DEM instance | EEA–10 | ||||||
| GLO–30 | |||||||
| GLO–90 | |||||||
| LAT spacing | |||||||
| LON spacing | 0–50° | 0.4″ | 1× | 1.0″ | 1× | 3.0″ | 1× |
| 50–60° | 0.6″ | 1.5× | 1.5″ | 1.5× | 4.5″ | 1.5× | |
| 60–70° | 0.8″ | 2× | 2.0″ | 2× | 6.0″ | 2× | |
| 70–75° | 1.2″ | 3× | 3.0″ | 3× | 9.0″ | 3× | |
| 75–80° | |||||||
| 80–85° | 2.0″ | 5× | 5.0″ | 5× | 15.0″ | 5× | |
| 85–90° | 4.0″ | 10× | 10.0″ | 10× | 30.0″ | 10× | |
| Quality Layers | Data Format | |
|---|---|---|
| Editing Mask | EDM | 8-bit unsigned integer, GeoTIFF |
| Filling Mask | FLM | 8-bit unsigned integer, GeoTIFF |
| Height Error Mask | HEM | 32-bit floating point, GeoTIFF |
| Water Body Mask | WBM | 8-bit unsigned integer, GeoTIFF |
| Source Data Layer | SRC | KML vector file |
| Accuracy Layer | ACM | KML vector file |
| Pixel Value | Meaning |
|---|---|
| 0 | Void (no data) |
| 1 | Not edited |
| 2 | Infill of external elevation data |
| 3 | Interpolated pixels |
| 4 | Smoothed pixels |
| 5 | Airport editing |
| 6 | Raised negative elevation pixels |
| 7 | Flattened pixels |
| 8 | Ocean pixels |
| 9 | Lake pixels |
| 10 | River pixels |
| 11 | Shoreline pixels |
| 12 | Morphed pixels (series of pixels manually set) |
| 13 | Shifted pixels |
| Pixel Value | Meaning |
|---|---|
| 0 | Void (no data) |
| 1 | Edited (except filled pixels) |
| 2 | Not edited/not filled |
| 3 | ASTER 2 |
| 4 | SRTM90 3 |
| 5 | SRTM30 3 |
| 6 | GMTED2010 4 |
| 7 | SRTM30plus 5 |
| 8 | TerraSAR-X Radargrammetric DEM |
| 9 | AW3D30 6 |
| Location | WRS-2 Combo | Scenes Used | Max Slope | Elevation Range |
|---|---|---|---|---|
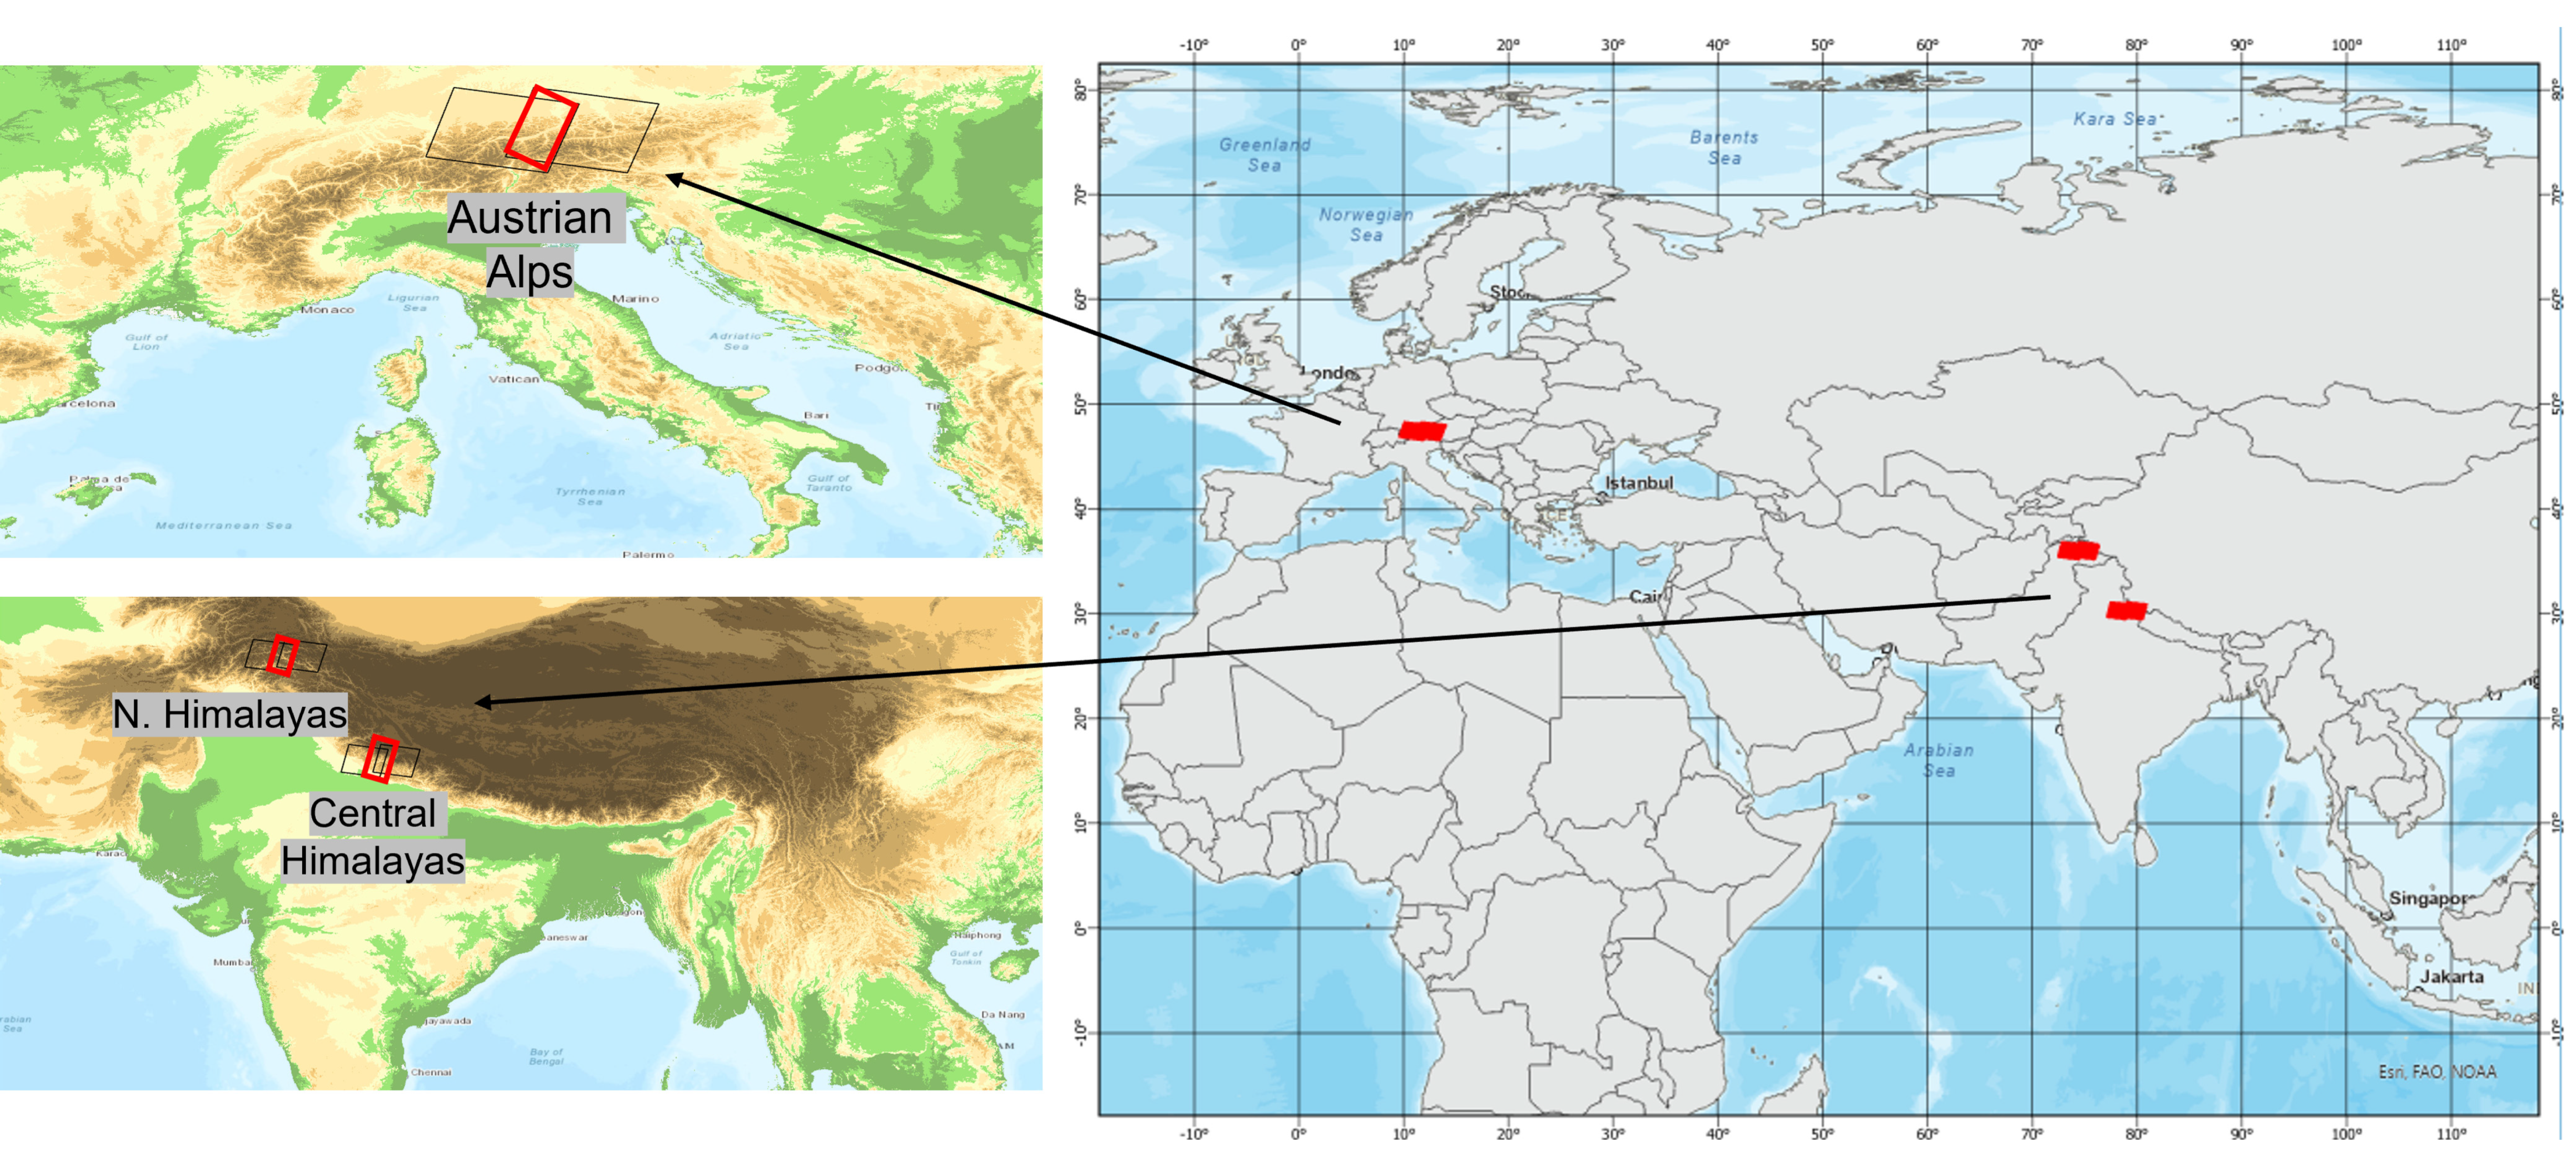
| Austrian Alps | 192/27 and 193/27 | LC81920272019264LGN00 | 83° | 132–3978 m |
| LC81930272020258LGN00 | ||||
| Himalayas | 145/39 and 146/39 | LC81460392015251LGN01 | 85° | 203–7804 m |
| (China/Nepal) | LC81450392020274LGN00 | |||
| N. Himalayas | 149/35 and 150/35 | LC81490352018216LGN00 | 86° | 591–8570 m |
| (Pakistan) | LC81500352018223LGN00 |
| Location | WRS-2 Combo | Scenes Used | C-2 Source DEM |
|---|---|---|---|
| Sweden/Norway | 196/12 and 197/12 | LC81960122020247LGN00 | SNF |
| LC81970122021208LGN00 | |||
| Iceland | 219/14 and 220/14 | LC82190142018258LGN00 | ArcticDEM |
| LC82200142018249LGN00 | |||
| N. Russia | 114/14 and 116/14 | LC81140142015251LGN01 | GMTED |
| LC81160142015249LGN01 |
| CONUS | Canada | Mexico | North America | |||||
|---|---|---|---|---|---|---|---|---|
| Copernicus | Collection-2 | Copernicus | Collection-2 | Copernicus | Collection-2 | Copernicus | Collection-2 | |
| # of Pts | 30,417 | 570 | 197 | 31,185 | ||||
| Range | −30 to 59 | −25 to 51 | −12 to 11 | −9 to 18 | −18 to 7 | −13 to 6 | −30 to 59 | −25 to 51 |
| Mean | 0.26 | 0.00 | −0.24 | 1.22 | 0.02 | 0.03 | −0.26 | 0.00 |
| Median | −0.12 | −0.23 | −0.16 | 1.06 | 0.07 | 0.12 | −0.12 | −0.21 |
| STD | 1.87 | 2.60 | 2.04 | 2.40 | 1.74 | 2.40 | 1.87 | 2.66 |
| RMSE | 1.90 | 2.63 | 2.07 | 2.68 | 1.75 | 2.41 | 1.90 | 2.66 |
| 90% | 2.76 | 3.80 | 3.07 | 4.23 | 1.61 | 3.48 | 2.76 | 3.83 |
| 95% | 3.91 | 5.36 | 4.57 | 5.17 | 2.47 | 4.72 | 3.91 | 5.40 |
| 99% | 6.72 | 9.24 | 6.51 | 7.97 | 4.89 | 10.67 | 6.72 | 9.43 |
| North America (18 Sites) | South America (8 Sites) | Europe (7 Sites) | Africa (8 Sites) | |||||
|---|---|---|---|---|---|---|---|---|
| Copernicus | Collection-2 | Copernicus | Collection-2 | Copernicus | Collection-2 | Copernicus | Collection-2 | |
| # of Pts | 208,094 | 65,657 | 93,262 | 206,364 | ||||
| Range | −81 to 40 | −81 to 46 | −64 to 21 | −117 to 20 | −40 to 41 | −169 to 126 | −29 to 5 | −21 to 21 |
| Mean | −1.57 | −0.49 | −0.89 | −0.94 | −1.20 | −0.21 | −0.40 | −0.43 |
| Median | −0.40 | −0.04 | −0.06 | −0.16 | 0.15 | 0.12 | −0.03 | −0.29 |
| Abs Median | 0.64 | 1.39 | 0.31 | 1.18 | 0.47 | 1.45 | 0.16 | 1.06 |
| STD | 3.60 | 3.40 | 3.54 | 4.30 | 4.10 | 4.45 | 1.50 | 2.00 |
| RMSE | 3.95 | 3.41 | 3.65 | 4.40 | 4.28 | 4.46 | 1.54 | 2.05 |
| LE90 | 5.58 | 4.56 | 2.75 | 4.37 | 6.11 | 6.64 | 1.20 | 3.11 |
| LE95 | 8.99 | 6.68 | 5.72 | 8.19 | 11.03 | 9.73 | 2.75 | 4.12 |
| LE99 | 16.91 | 12.27 | 20.85 | 20.84 | 18.88 | 15.73 | 6.55 | 6.91 |
| Asia (12 sites) | Australia (7 sites) | All Sites (60 sites) | ||||||
| Copernicus | Collection-2 | Copernicus | Collection-2 | Copernicus | Collection-2 | |||
| # of Pts | 203,210 | 112,576 | 889,113 | |||||
| Range | −98 to 85 | −267 to 393 | −42 to 11 | −42 to 54 | −98 to 85 | −267 to 393 | ||
| Mean | −0.32 | 0.80 | 0.10 | −0.32 | −0.71 | −0.16 | ||
| Median | 0.01 | 0.29 | 0.33 | −0.17 | −0.02 | −0.04 | ||
| Abs Median | 0.36 | 1.23 | 0.41 | 1.08 | 0.35 | 1.20 | ||
| STD | 1.96 | 8.70 | 1.65 | 2.50 | 2.80 | 5.00 | ||
| RMSE | 1.98 | 8.72 | 1.65 | 2.51 | 2.90 | 5.04 | ||
| LE90 | 2.33 | 13.71 | 0.93 | 3.11 | 2.72 | 4.84 | ||
| LE95 | 4.06 | 20.64 | 1.37 | 3.91 | 5.50 | 8.93 | ||
| LE99 | 8.15 | 33.54 | 5.10 | 8.54 | 14.13 | 22.88 | ||
| Copernicus Stats in N.A. Where Collection-2 Uses | Collection-2 Stats in N.A. | |||
|---|---|---|---|---|
| NASADEM | CDEM | NASADEM | CDEM | |
| # of Pts | 115,463 | 92,631 | 115,463 | 92,631 |
| Range | −59 to 33 | −81 to 40 | −52 to 43 | −81 to 46 |
| Mean | −1.62 | −1.5 | −0.90 | 0.02 |
| Median | −0.29 | −0.62 | −0.37 | 0.29 |
| Abs Median | 0.43 | 0.9 | 1.53 | 1.22 |
| STD | 3.9 | 3.25 | 3.66 | 2.90 |
| RMSE | 4.22 | 3.58 | 3.77 | 2.90 |
| LE90 | 5.57 | 5.58 | 5.27 | 3.62 |
| LE95 | 9.92 | 8.33 | 7.74 | 5.23 |
| LE99 | 18.45 | 13.40 | 13.59 | 10.05 |
| NASADEM (46 Sites) | CDEM (8 Sites) | SNF (1 Site) | ArcticDEM (2 Sites) | GMTED (3 Sites) | ||||||
|---|---|---|---|---|---|---|---|---|---|---|
| Copernicus | Collection-2 | Copernicus | Collection-2 | Copernicus | Collection-2 | Copernicus | Collection-2 | Copernicus | Collection-2 | |
| # of Pts | 672,299 | 92,631 | 18,632 | 51,548 | 54,003 | |||||
| Range | −98 to 85 | −117 to 393 | −81 to 40 | −81 to 46 | −8 to 14 | −28 to 22 | −16 to 17 | −169 to 126 | −29 to 14 | −267 to 120 |
| Mean | −0.60 | −0.53 | −1.50 | 0.02 | 0.47 | −0.48 | −0.20 | 0.38 | −1.70 | 3.70 |
| Median | 0.01 | −0.19 | −0.62 | 0.29 | 0.45 | −0.50 | 0.40 | 0.75 | −0.29 | 3.70 |
| Abs Median | 0.28 | 1.11 | 0.90 | 1.22 | 0.62 | 1.74 | 0.92 | 1.10 | 0.53 | 9.60 |
| STD | 2.64 | 3.00 | 3.25 | 2.90 | 1.18 | 3.40 | 2.06 | 4.00 | 4.10 | 15.90 |
| RMSE | 2.70 | 3.07 | 3.58 | 2.90 | 1.26 | 3.46 | 2.07 | 4.02 | 4.46 | 16.32 |
| LE90 | 2.06 | 3.59 | 5.57 | 3.62 | 1.58 | 5.73 | 3.22 | 3.72 | 4.96 | 23.07 |
| LE95 | 4.41 | 5.25 | 8.83 | 5.23 | 2.08 | 7.31 | 4.77 | 6.79 | 11.64 | 31.03 |
| LE99 | 13.85 | 11.97 | 13.40 | 10.05 | 4.62 | 10.99 | 7.67 | 15.52 | 18.50 | 46.06 |
| North America | South America | Europe | Africa | |||||
|---|---|---|---|---|---|---|---|---|
| Copernicus | Collection-2 | Copernicus | Collection-2 | Copernicus | Collection-2 | Copernicus | Collection-2 | |
| # of Pts | 858 | 125 | 511 | 21 | ||||
| Range | −53 to 17 | −43 to 29 | −44 to 4 | −52 to 12 | −32 to 41 | −50 to 62 | −22 to 3 | −17 to 6 |
| Mean | −9.90 | −8.40 | −8.10 | −10.20 | −7.90 | −5.40 | −6.50 | −5.90 |
| Median | −8.90 | −7.60 | −4.90 | −8.00 | −8.00 | −5.20 | −4.10 | −6.60 |
| Abs Median | 8.90 | 7.70 | 4.90 | 8.30 | 8.60 | 6.30 | 4.10 | 6.60 |
| STD | 7.70 | 7.30 | 10.00 | 10.90 | 9.70 | 8.60 | 7.20 | 6.20 |
| RMSE | 12.49 | 11.16 | 12.88 | 14.87 | 12.49 | 10.16 | 9.59 | 8.44 |
| LE90 | 18.18 | 15.20 | 20.98 | 26.32 | 20.79 | 14.38 | 14.59 | 12.76 |
| LE95 | 21.58 | 22.21 | 26.77 | 28.31 | 22.89 | 16.46 | 21.09 | 12.78 |
| LE99 | 41.16 | 38.38 | 42.31 | 45.37 | 28.99 | 32.64 | 22.21 | 16.67 |
| Asia | Australia | Global | ||||||
| Copernicus | Collection-2 | Copernicus | Collection-2 | Copernicus | Collection-2 | |||
| # of Pts | 529 | 137 | 2181 | |||||
| Range | −98 to 85 | −116 to 393 | −42 to 4 | −42 to 6 | −98 to 85 | −116 to 393 | ||
| Mean | −0.50 | −0.82 | −10.40 | −4.70 | −7.00 | −5.70 | ||
| Median | 0.08 | −0.05 | −1.77 | −3.27 | 10.90 | −5.80 | ||
| Abs Median | 4.50 | 5.40 | 2.60 | 3.40 | 7.40 | 6.80 | ||
| STD | 13.20 | 27.90 | 13.50 | 7.10 | 10.90 | 15.70 | ||
| RMSE | 13.20 | 27.89 | 16.97 | 8.46 | 12.98 | 16.73 | ||
| LE90 | 18.40 | 21.64 | 30.28 | 11.61 | 20.13 | 16.56 | ||
| LE95 | 26.71 | 33.29 | 33.93 | 14.12 | 25.72 | 24.47 | ||
| LE99 | 52.31 | 90.48 | 38.50 | 41.07 | 41.24 | 42.64 | ||
| Asia | Global | |||
|---|---|---|---|---|
| Copernicus | Collection-2 | Copernicus | Collection-2 | |
| # of Pts | 525 | 2177 | ||
| Range | −98 to 85 | −96 to 91 | −98 to 85 | −96 to 91 |
| Mean | −0.32 | −1.75 | −7.00 | −5.90 |
| Median | 0.08 | −0.05 | −6.40 | −5.80 |
| Abs Median | 4.50 | 5.40 | 7.40 | 6.70 |
| STD | 12.90 | 15.70 | 10.90 | 10.80 |
| RMSE | 13.20 | 15.90 | 12.98 | 12.31 |
| LE90 | 17.54 | 21.05 | 19.99 | 16.37 |
| LE95 | 25.74 | 28.17 | 25.20 | 23.95 |
| LE99 | 52.31 | 73.58 | 41.16 | 41.07 |
| Location | Minimum | Maximum | Mean | STD |
|---|---|---|---|---|
| Sweden/Norway | −335 | 282 | 0.21 | 6.81 |
| Iceland | −474 | 243 | 0.19 | 5.16 |
| Northern Russia | −263 | 563 | 6.02 | 25.65 |
Disclaimer/Publisher’s Note: The statements, opinions and data contained in all publications are solely those of the individual author(s) and contributor(s) and not of MDPI and/or the editor(s). MDPI and/or the editor(s) disclaim responsibility for any injury to people or property resulting from any ideas, methods, instructions or products referred to in the content. |
© 2023 by the authors. Licensee MDPI, Basel, Switzerland. This article is an open access article distributed under the terms and conditions of the Creative Commons Attribution (CC BY) license (https://creativecommons.org/licenses/by/4.0/).
Share and Cite
Franks, S.; Rengarajan, R. Evaluation of Copernicus DEM and Comparison to the DEM Used for Landsat Collection-2 Processing. Remote Sens. 2023, 15, 2509. https://doi.org/10.3390/rs15102509
Franks S, Rengarajan R. Evaluation of Copernicus DEM and Comparison to the DEM Used for Landsat Collection-2 Processing. Remote Sensing. 2023; 15(10):2509. https://doi.org/10.3390/rs15102509
Chicago/Turabian StyleFranks, Shannon, and Rajagopalan Rengarajan. 2023. "Evaluation of Copernicus DEM and Comparison to the DEM Used for Landsat Collection-2 Processing" Remote Sensing 15, no. 10: 2509. https://doi.org/10.3390/rs15102509