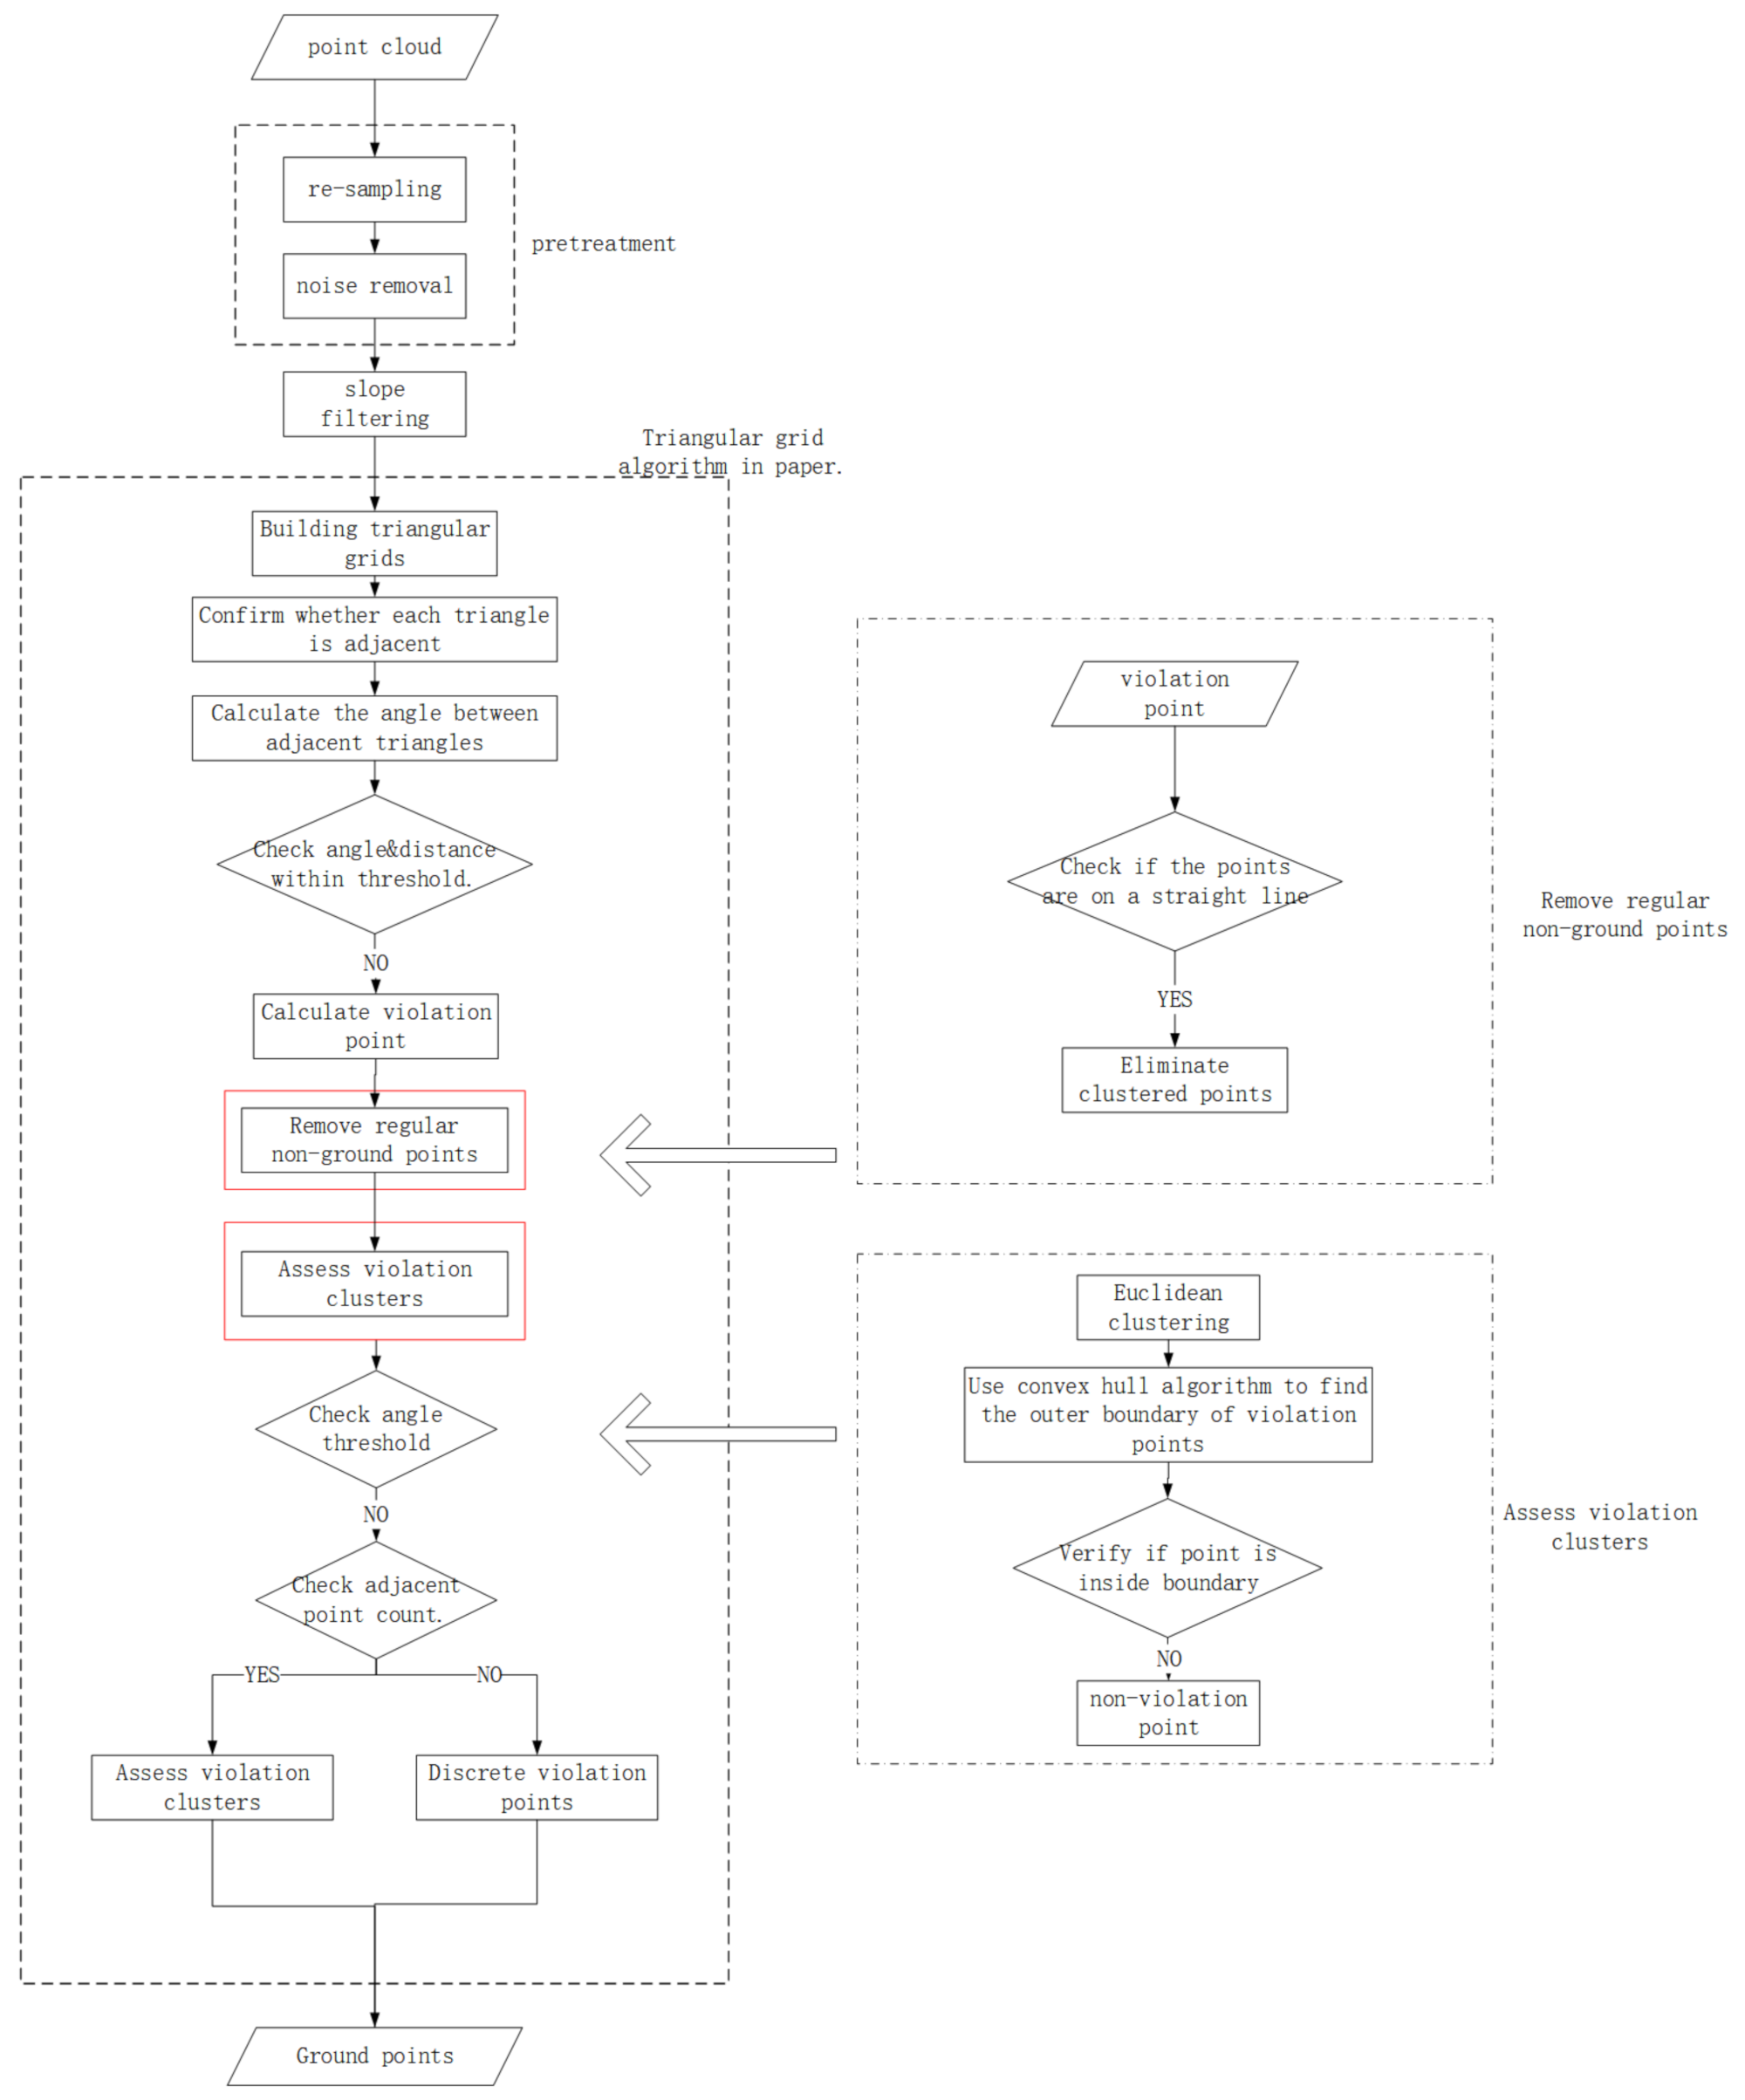
Figure 1.
The algorithm flowchart.
Figure 1.
The algorithm flowchart.
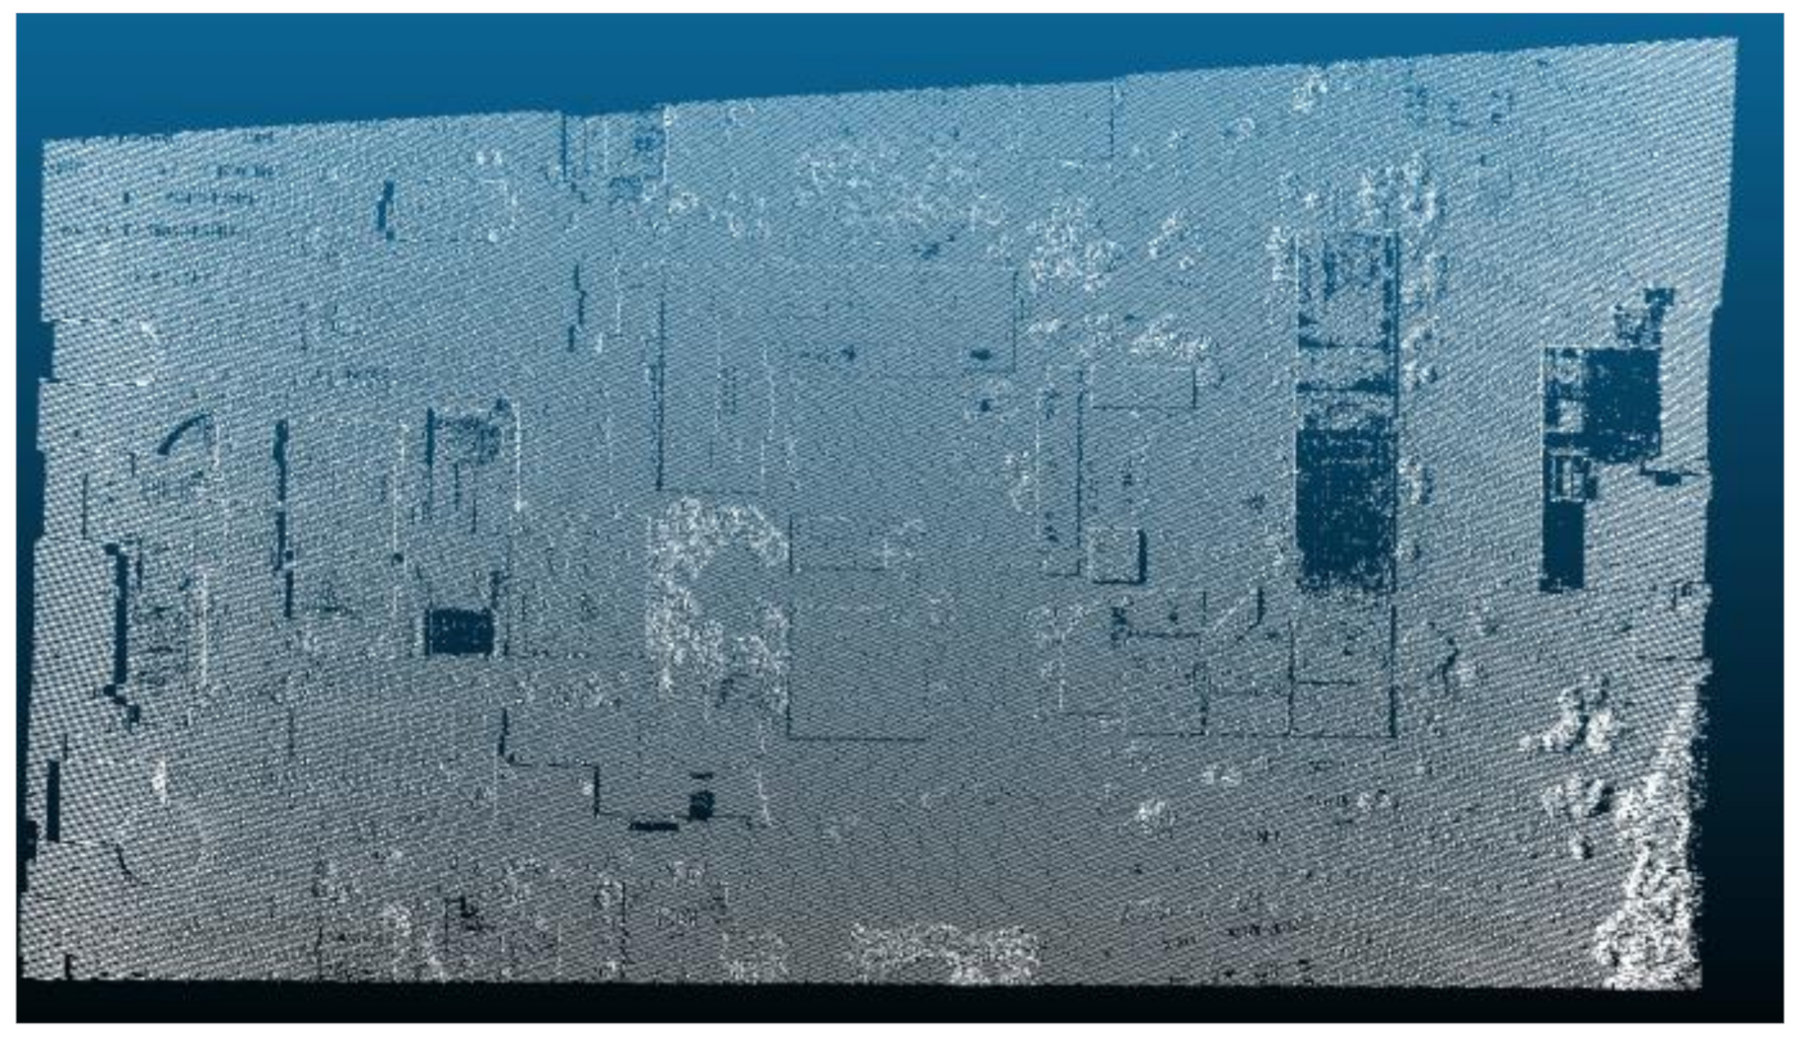
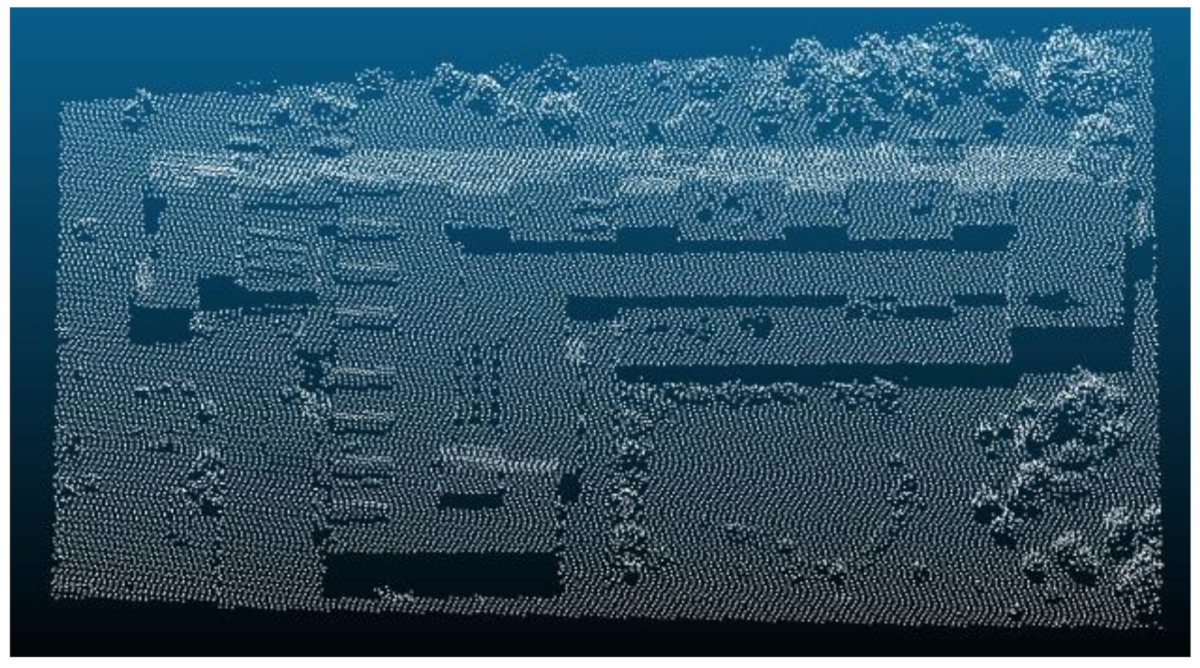
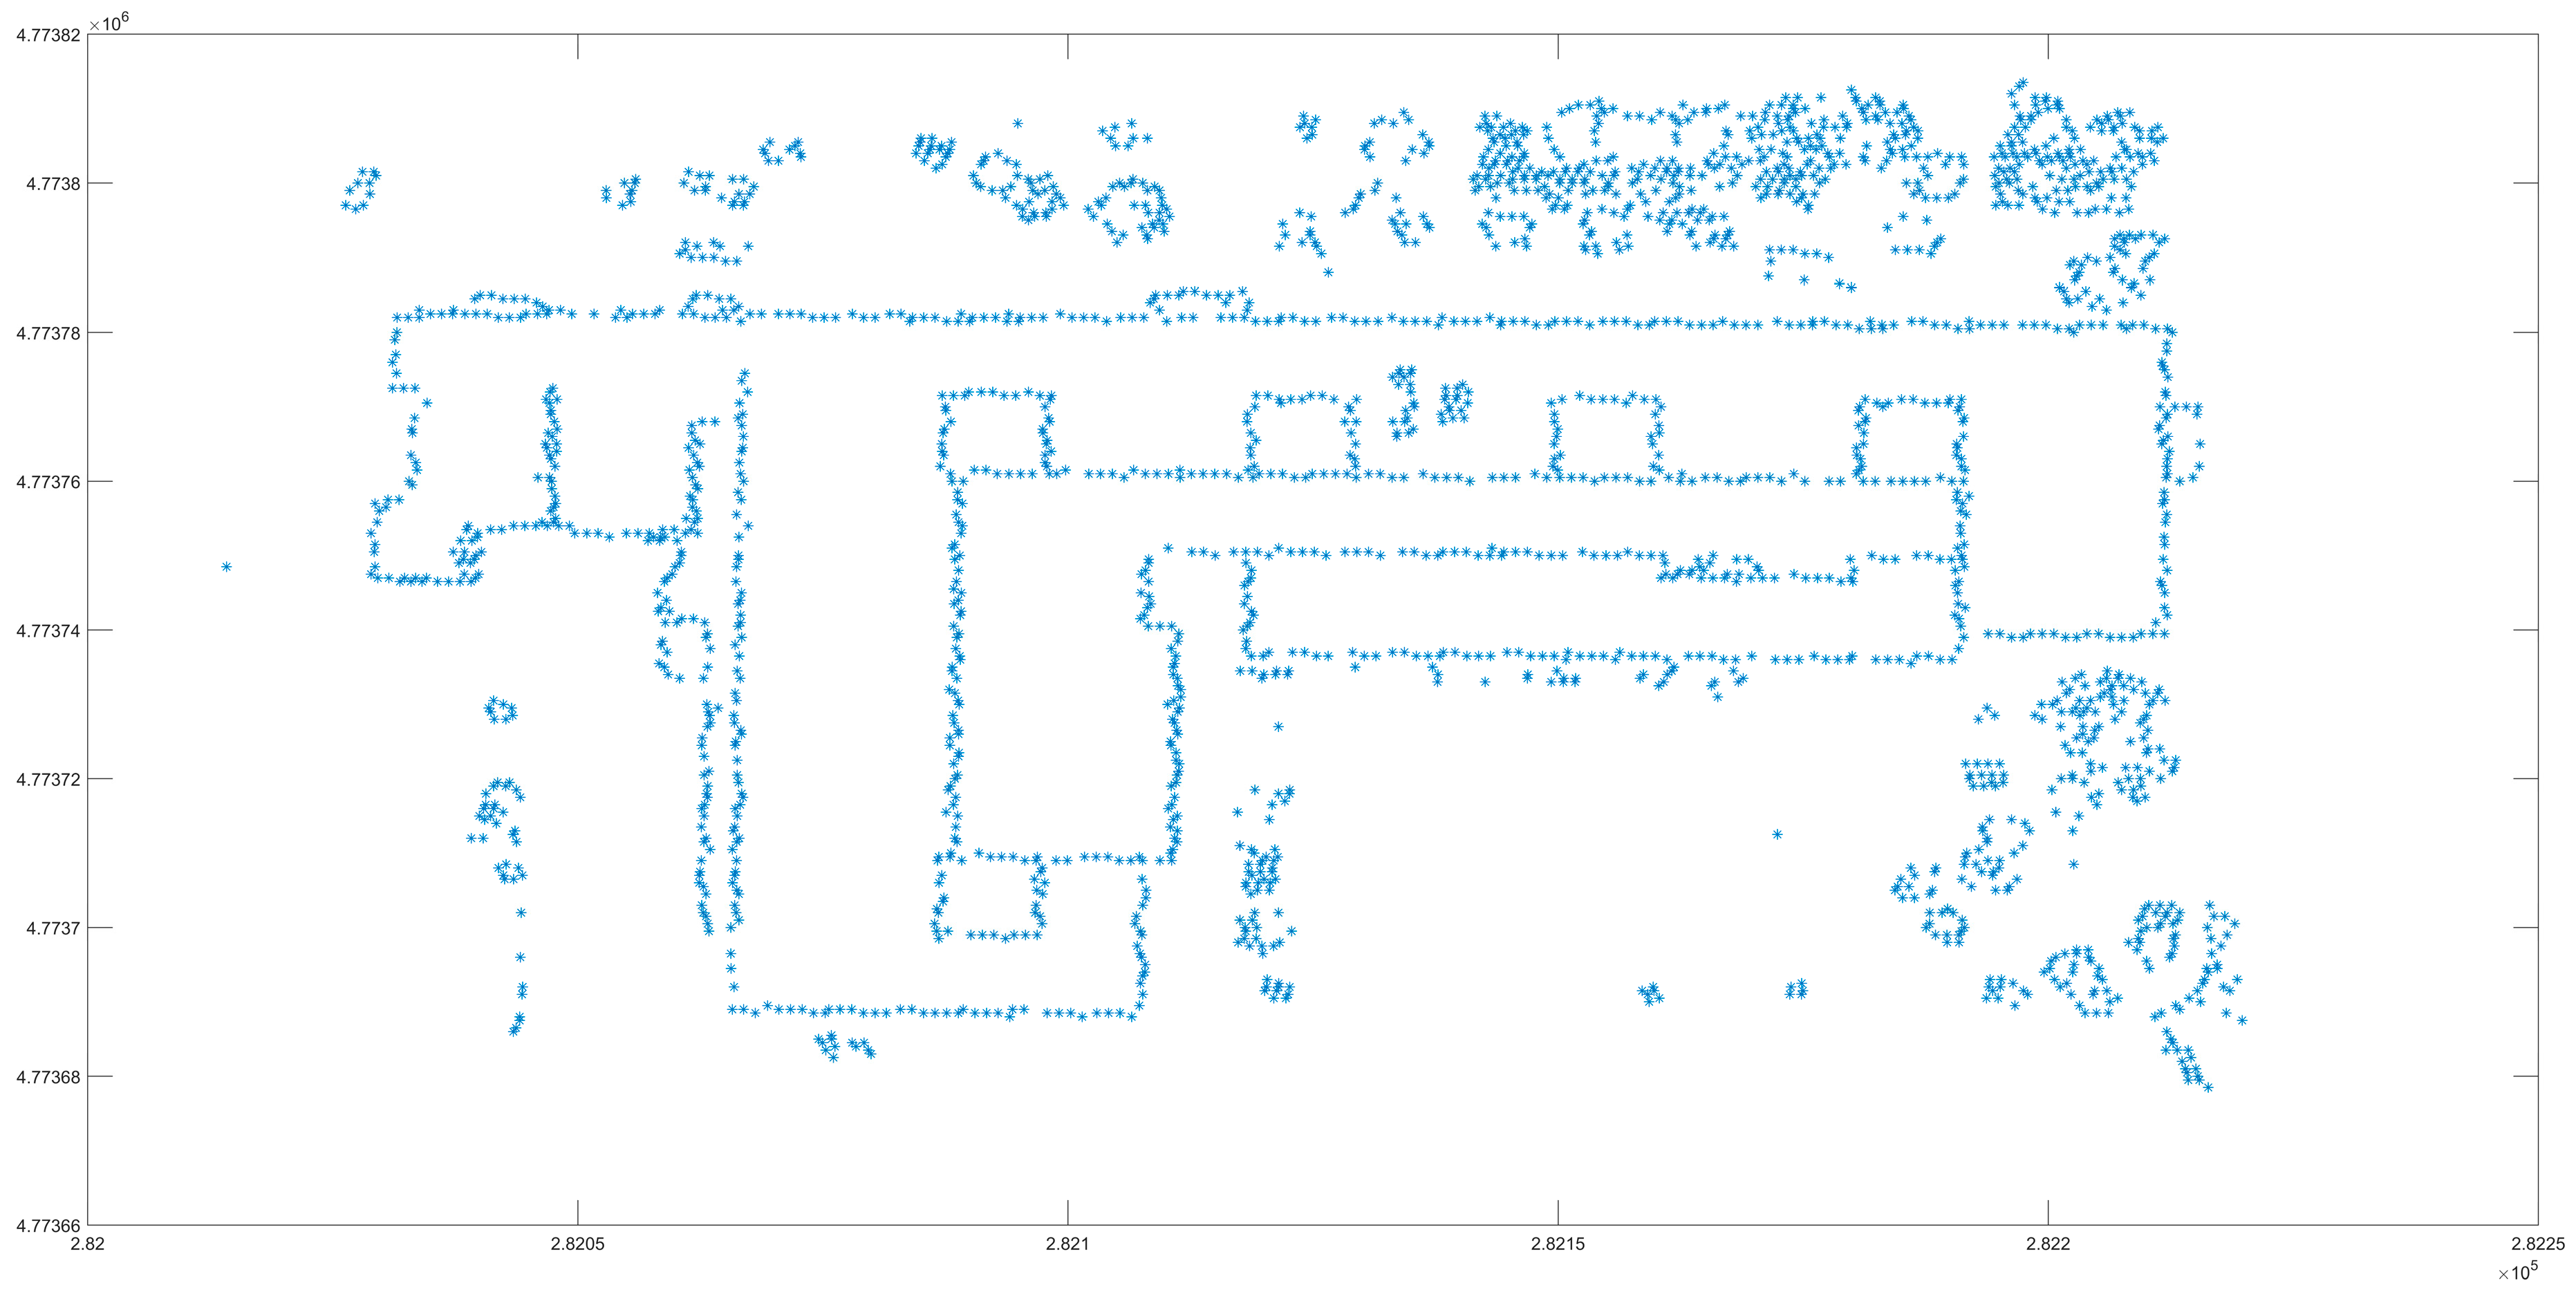
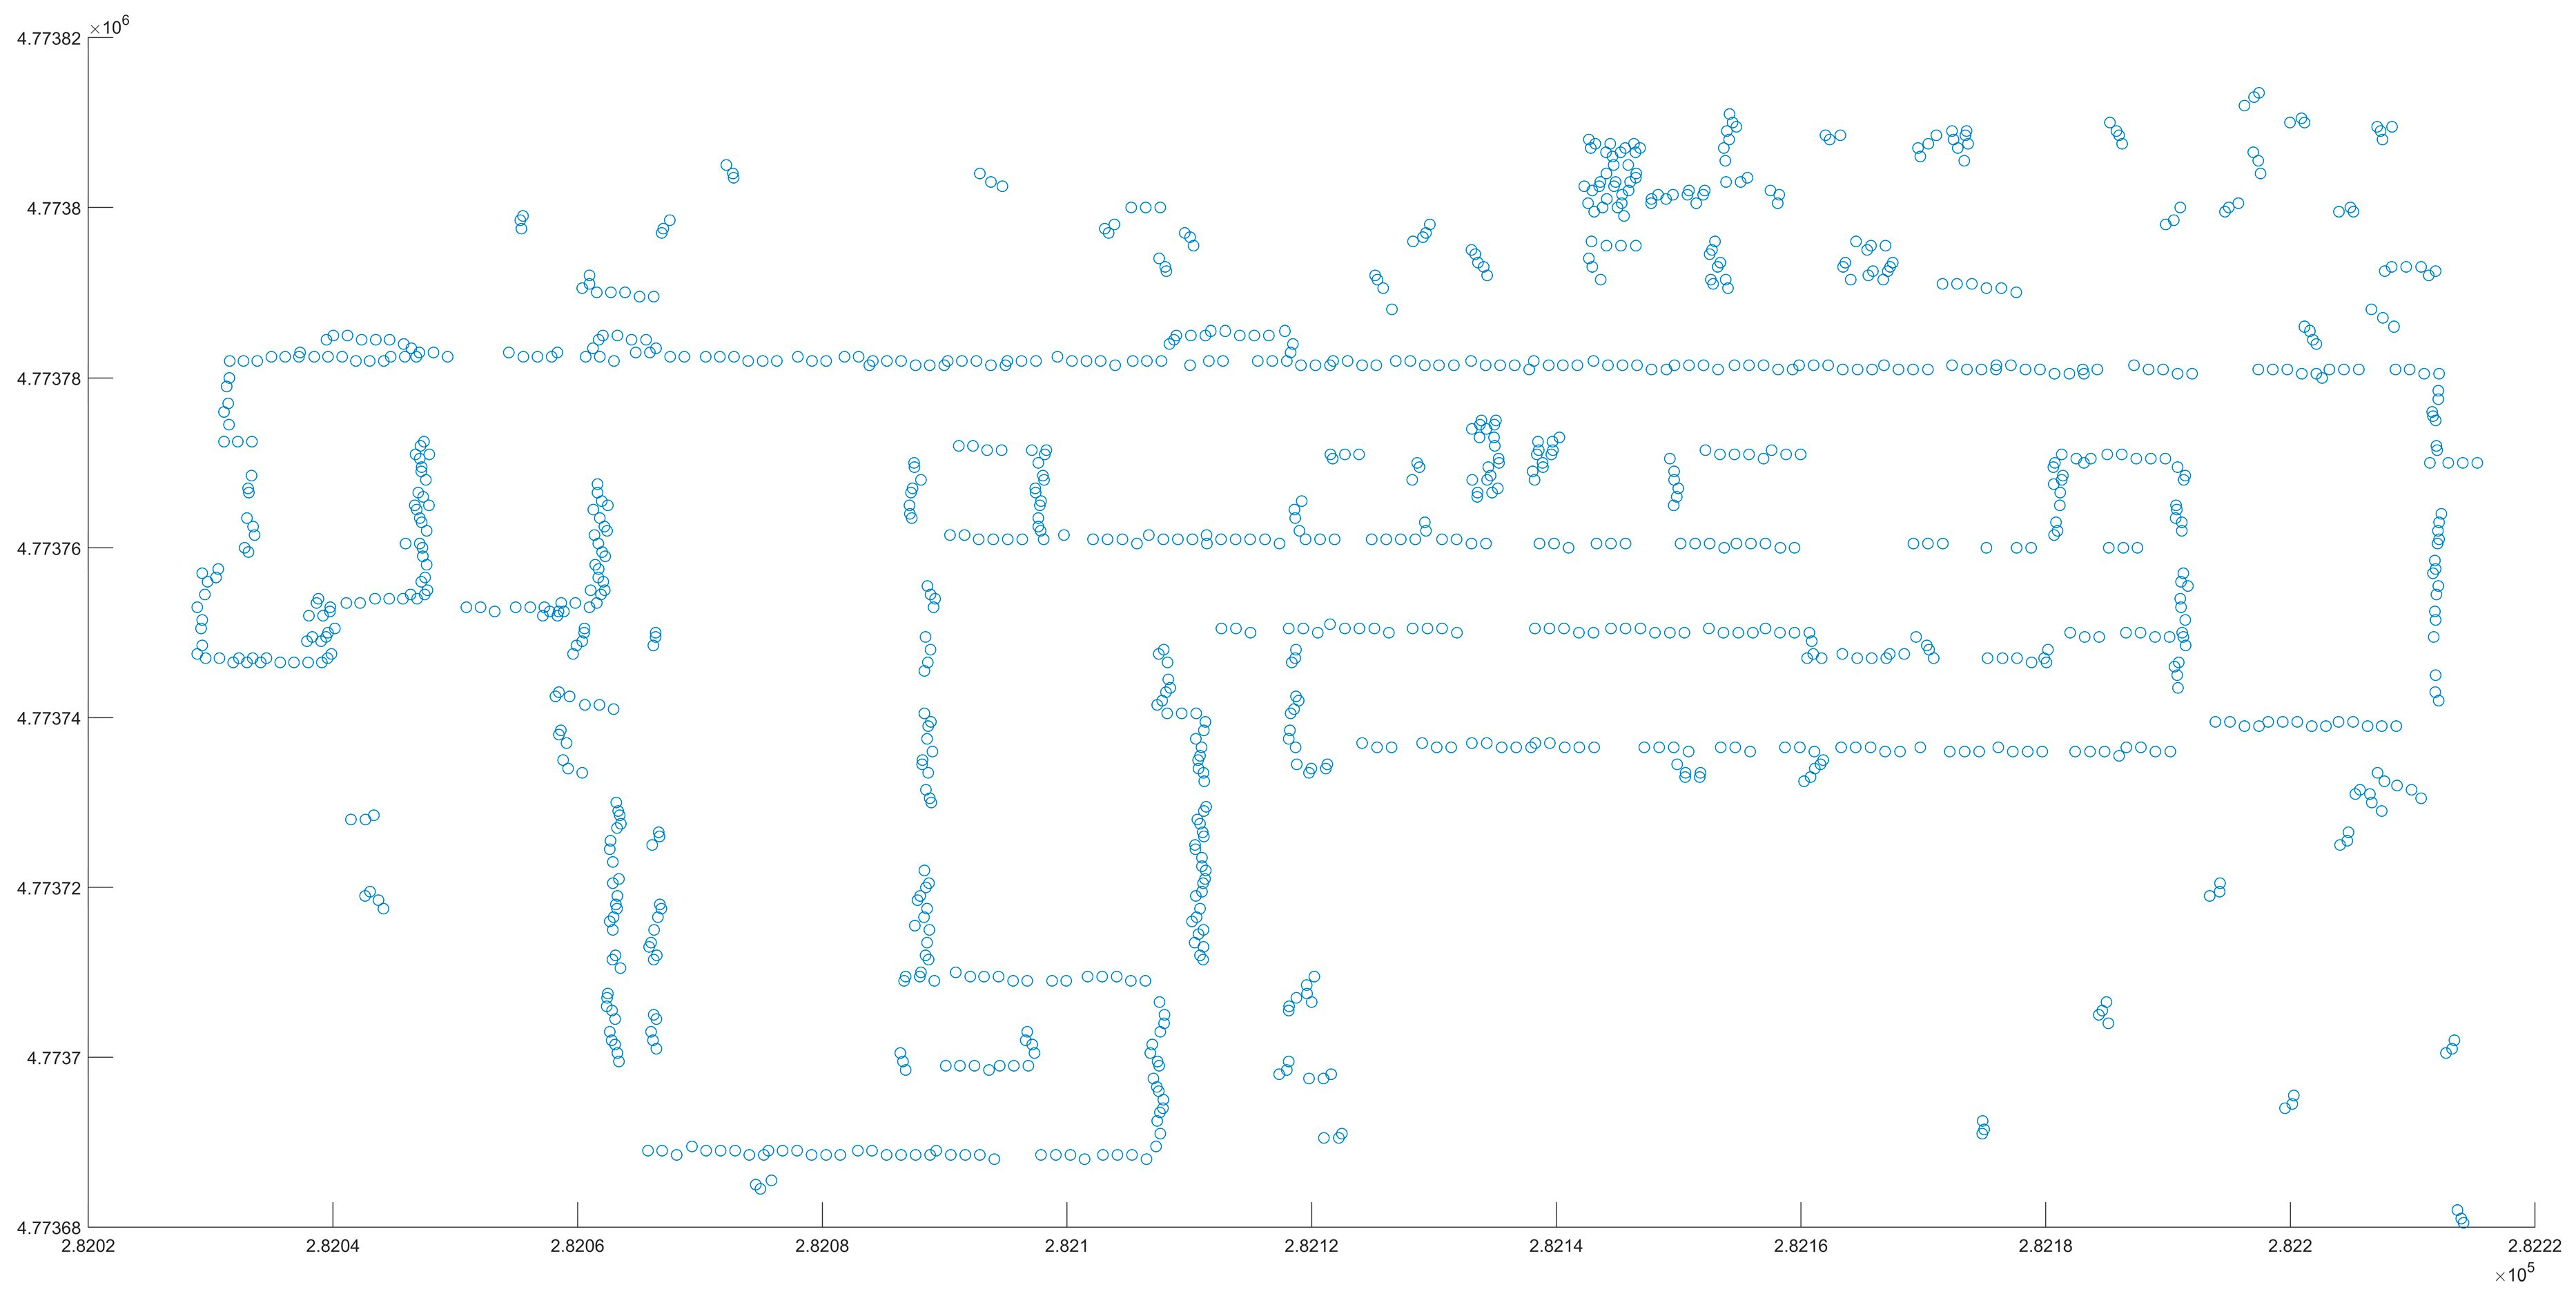
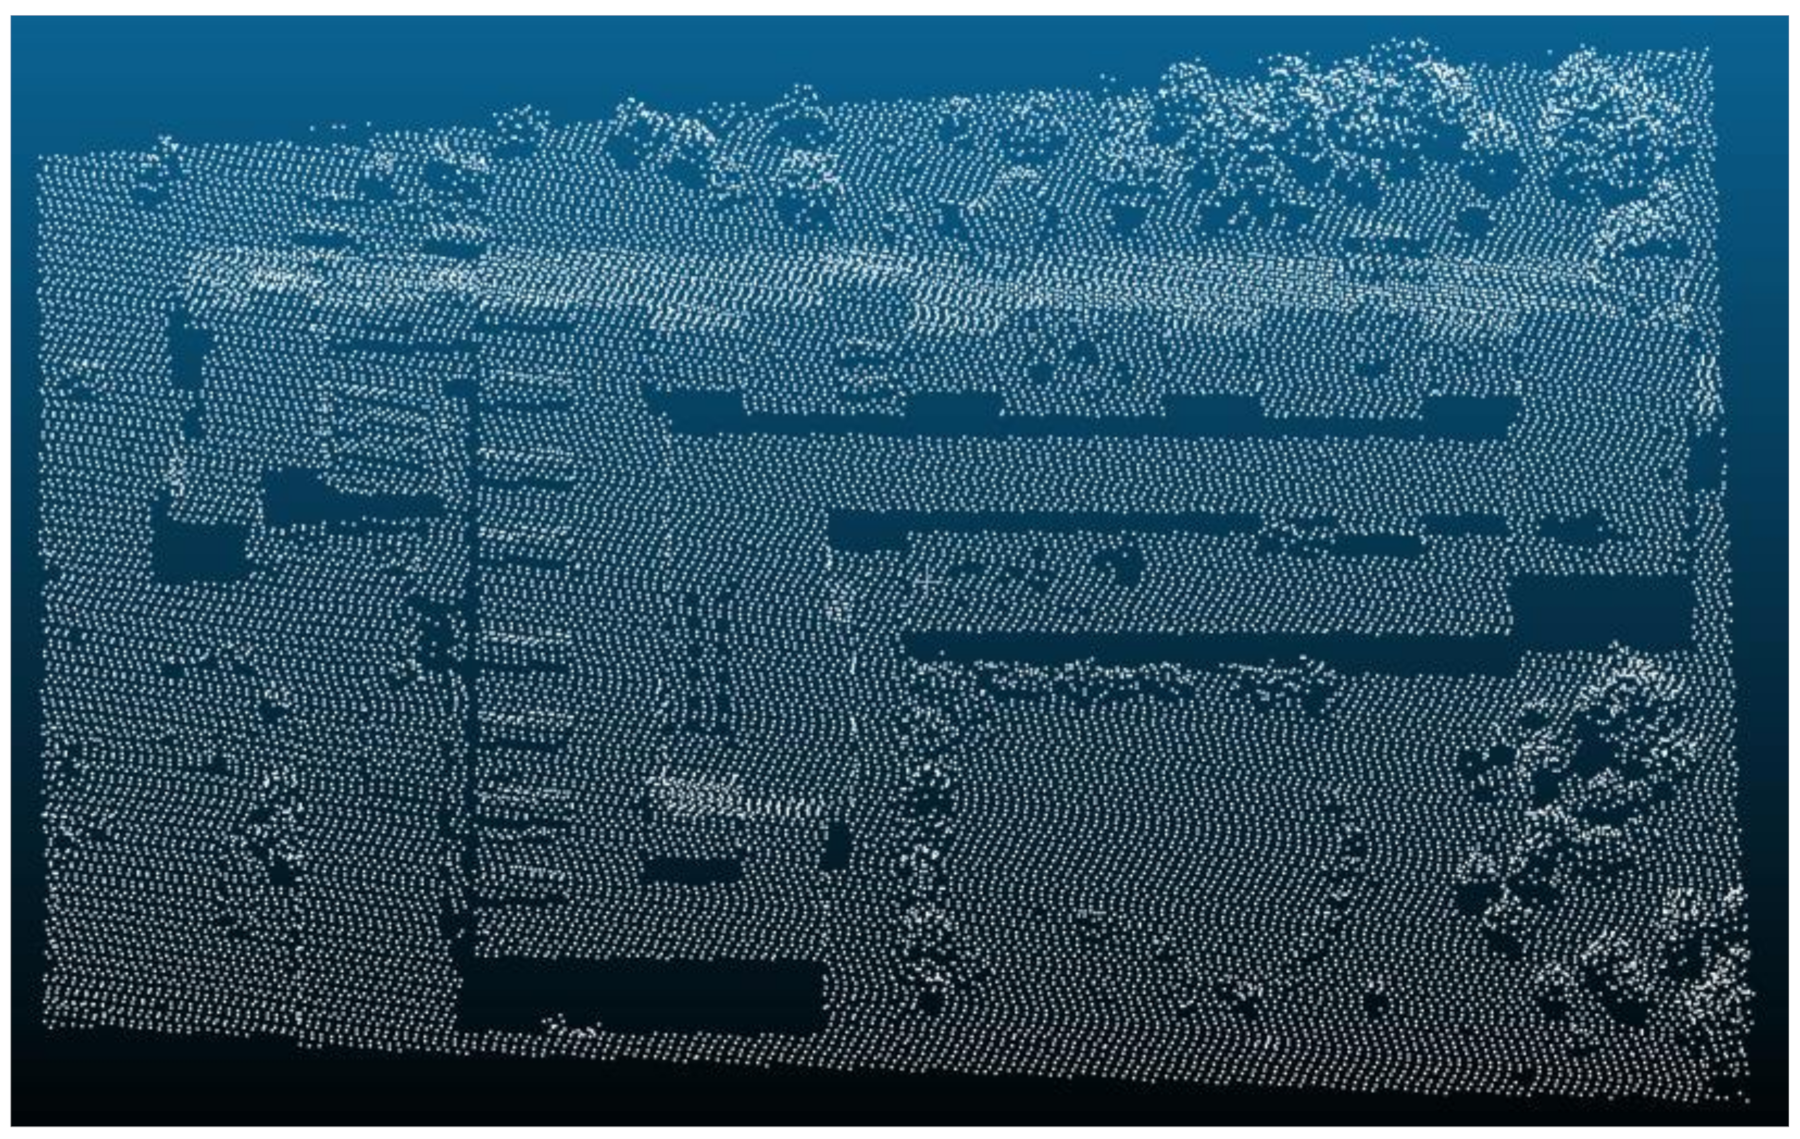
Figure 8.
The whole study is a point cloud.
Figure 8.
The whole study is a point cloud.
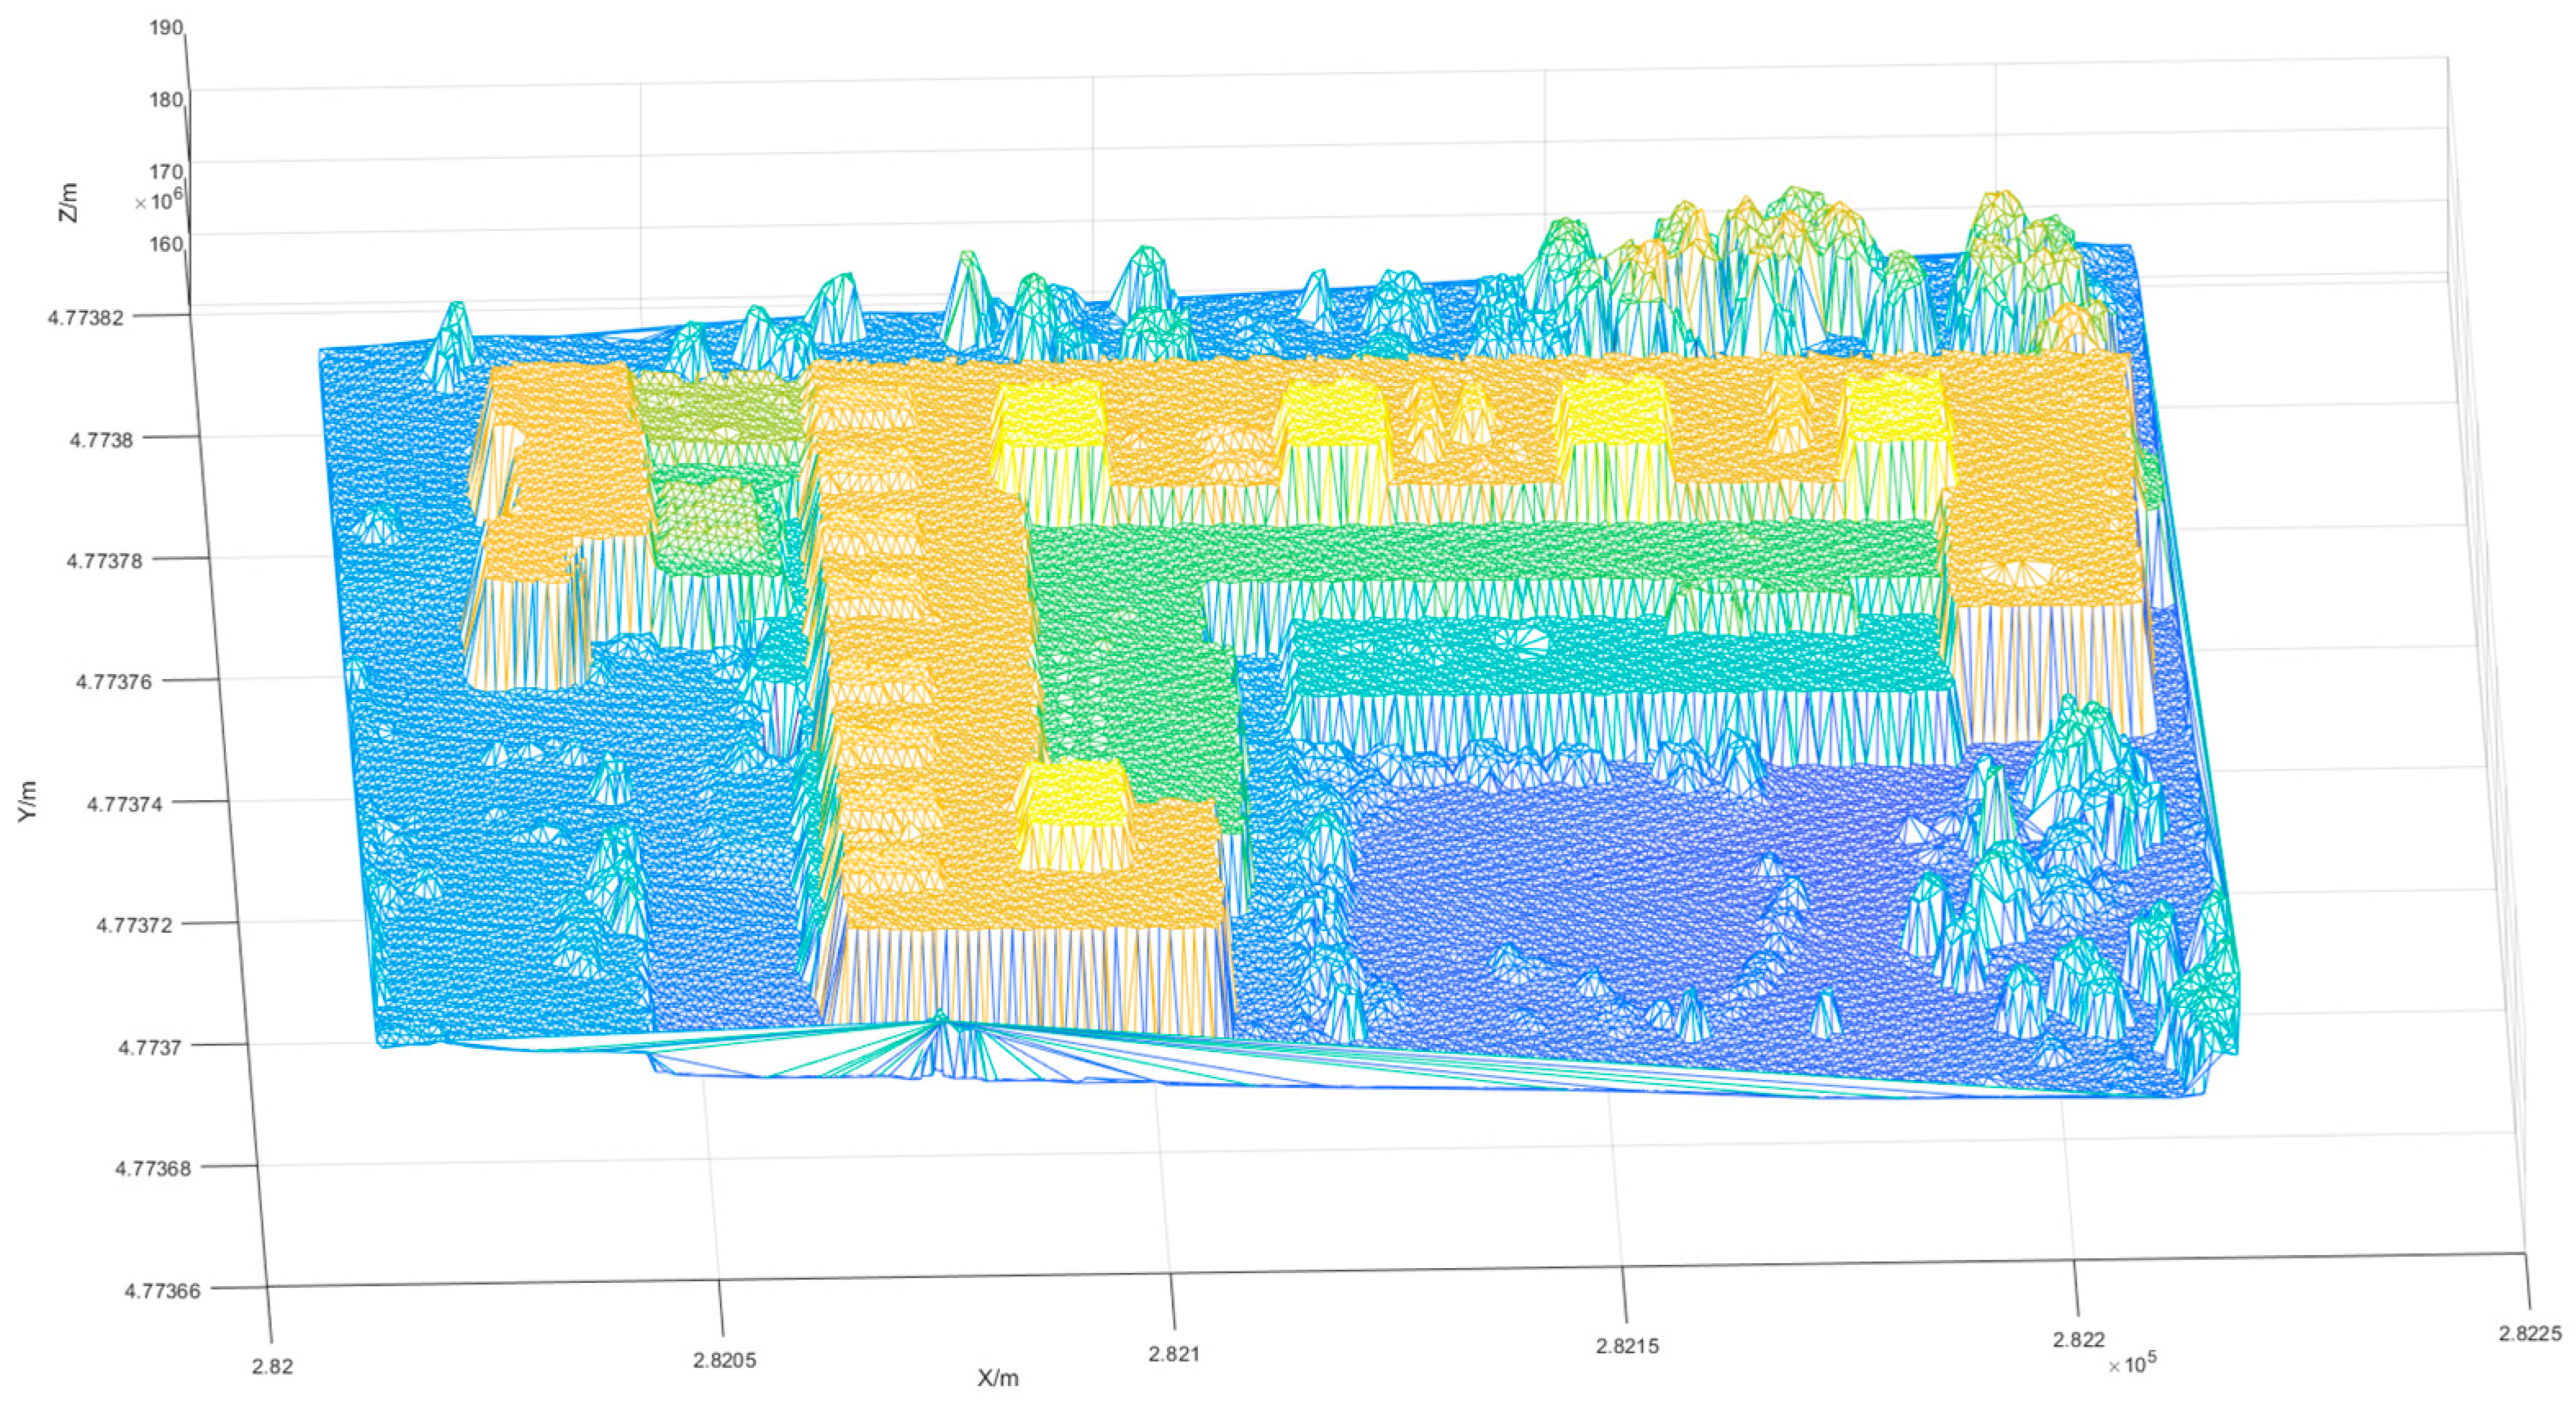
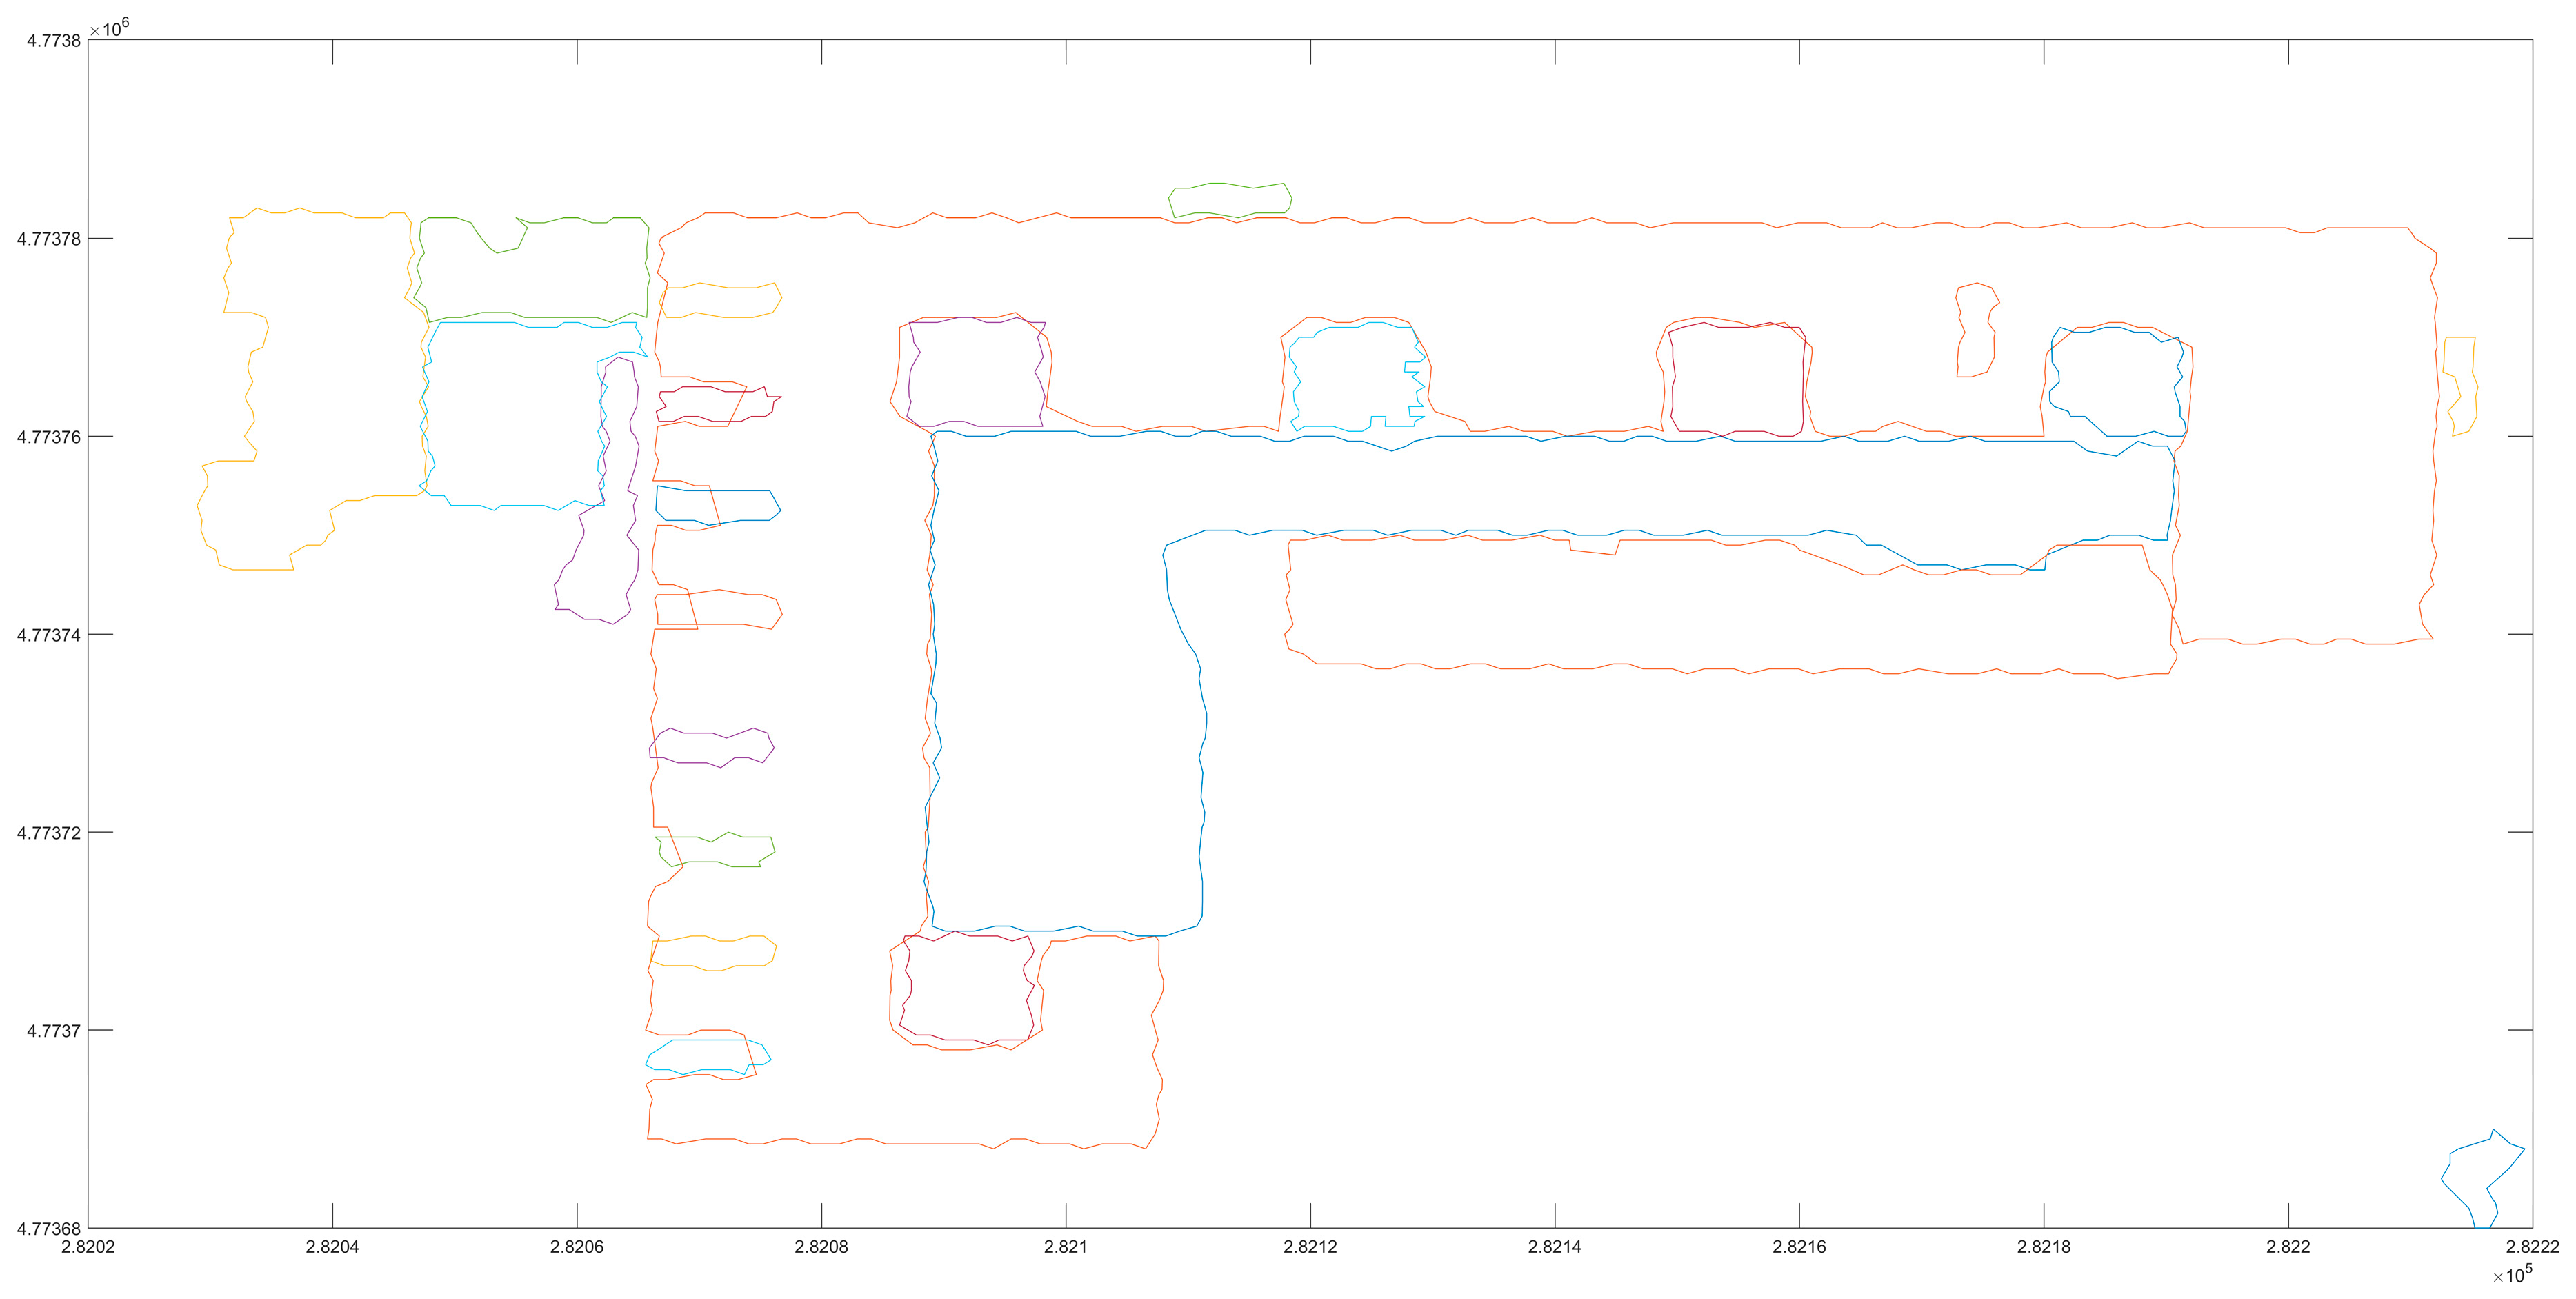
Figure 13.
The boundary of the clustering points (different colored boundaries represent the corresponding boundaries of different point sets after clustering).
Figure 13.
The boundary of the clustering points (different colored boundaries represent the corresponding boundaries of different point sets after clustering).
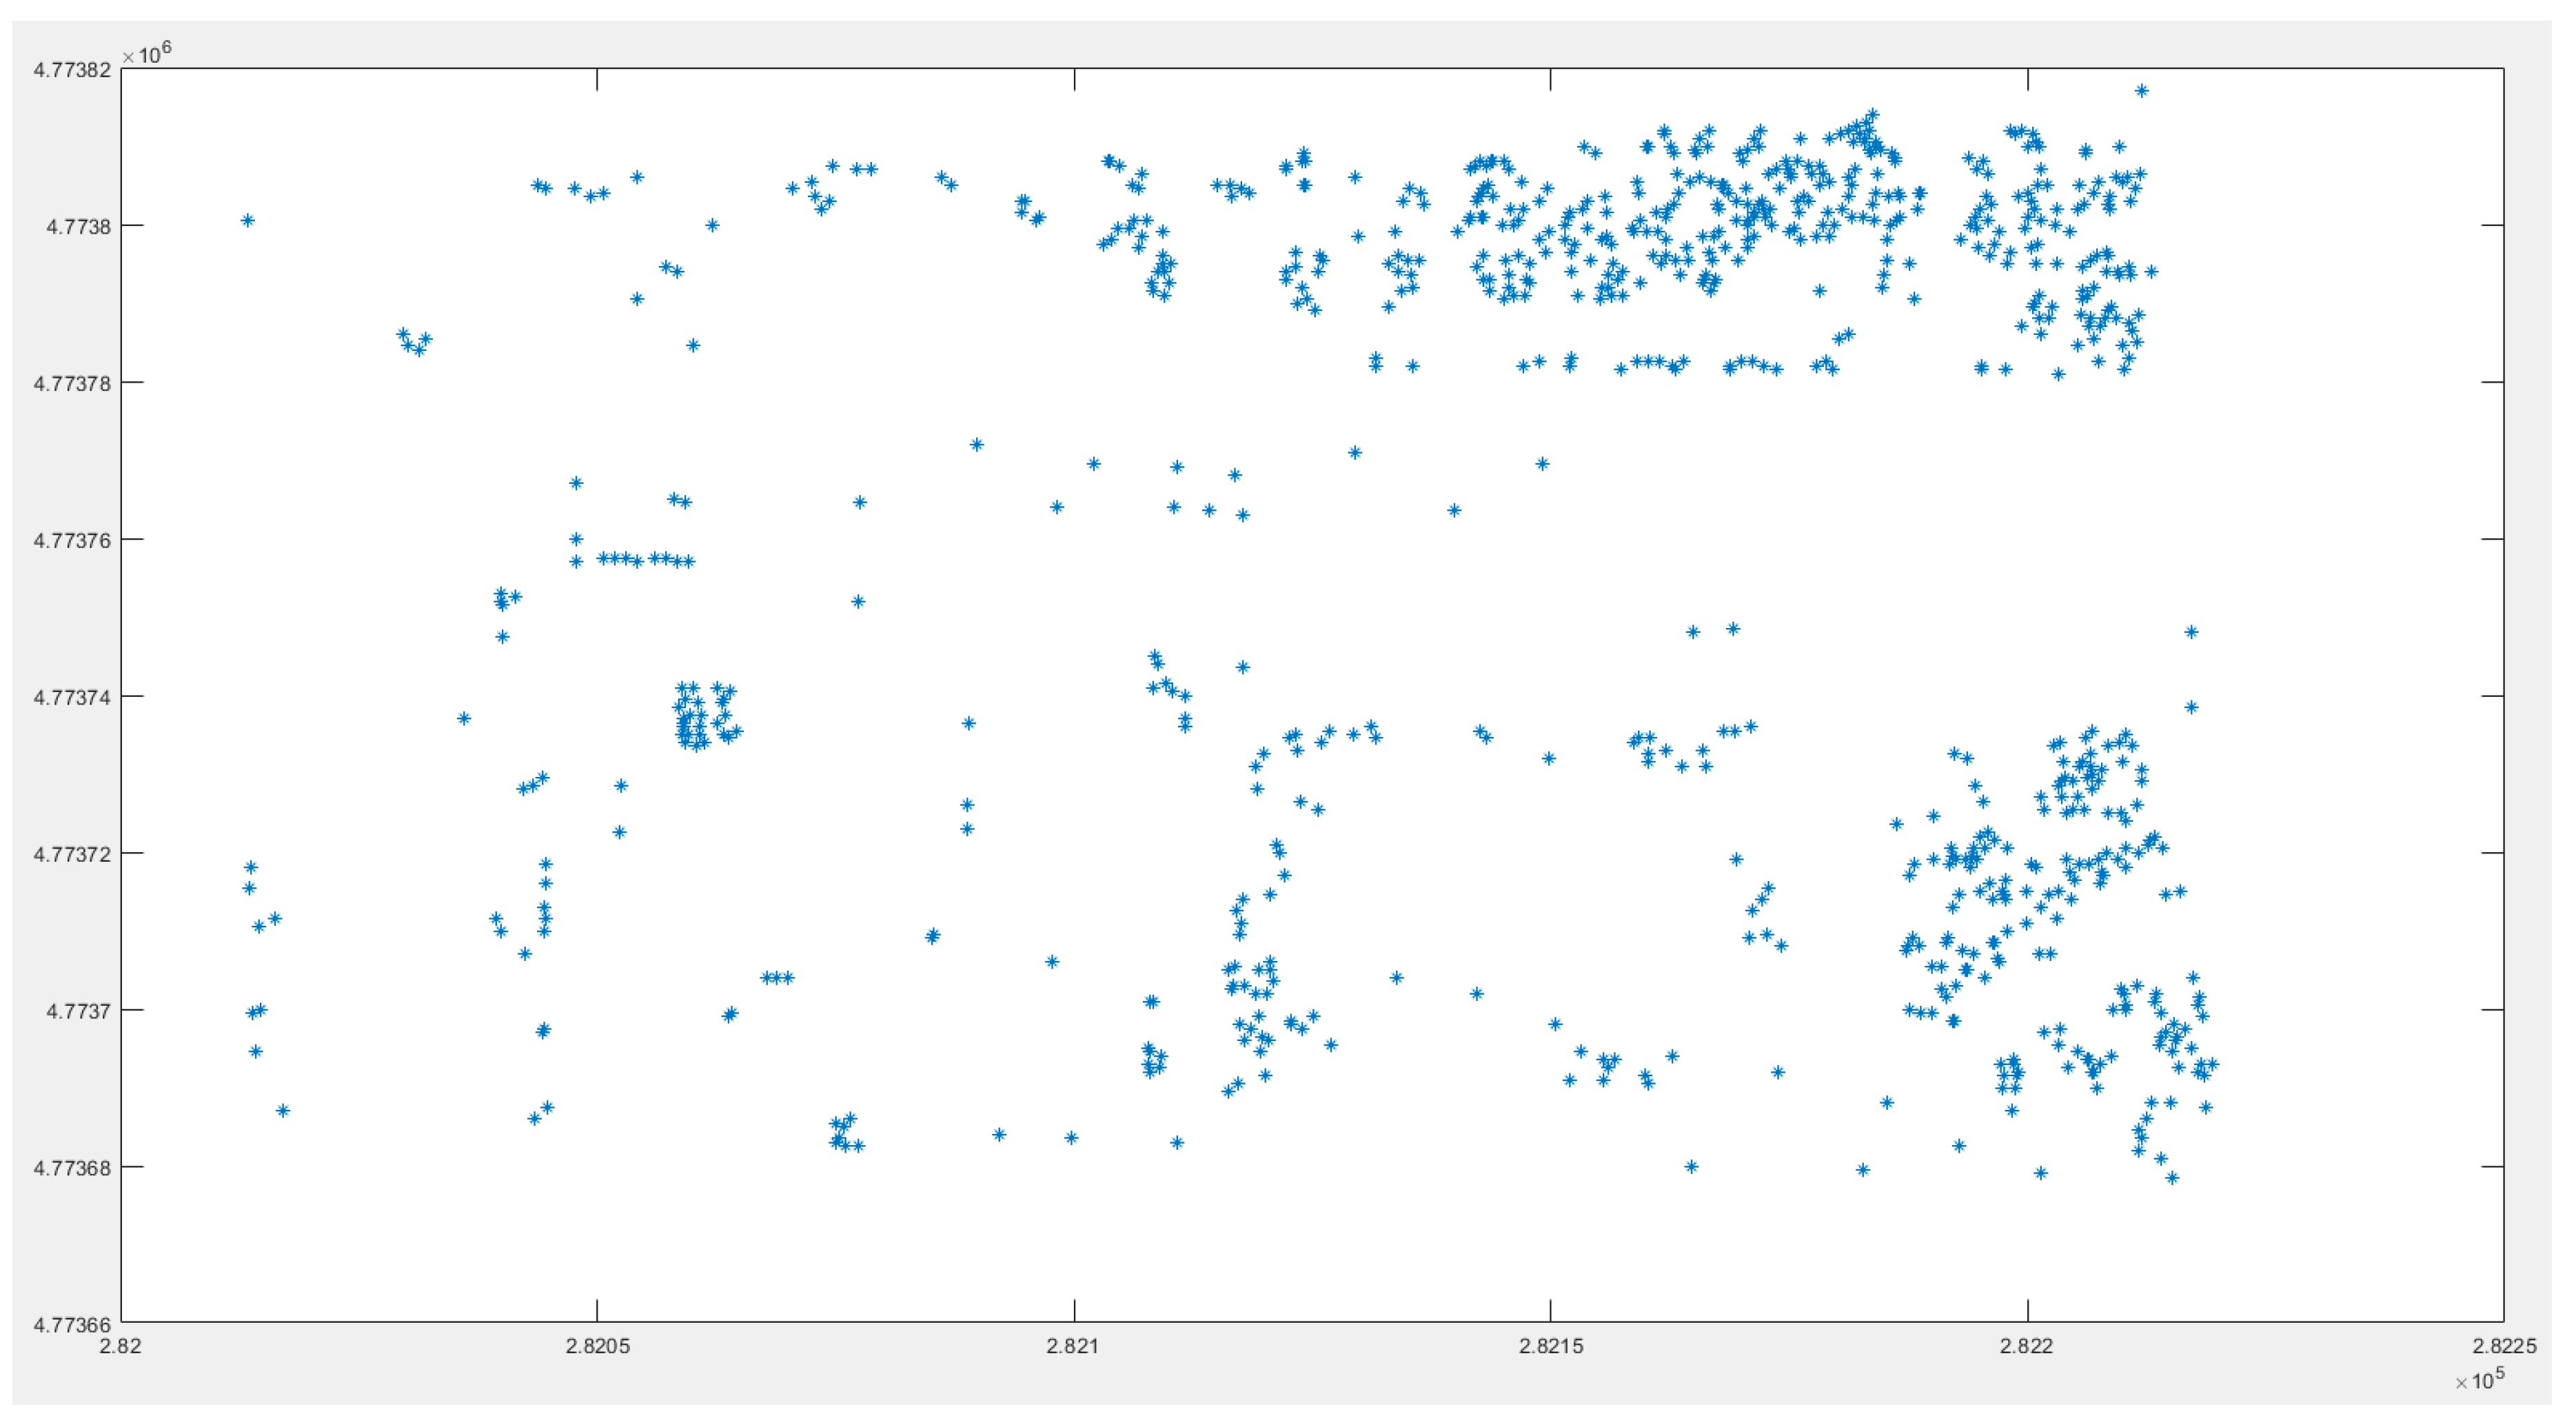
Figure 14.
The violation points of the second round.
Figure 14.
The violation points of the second round.
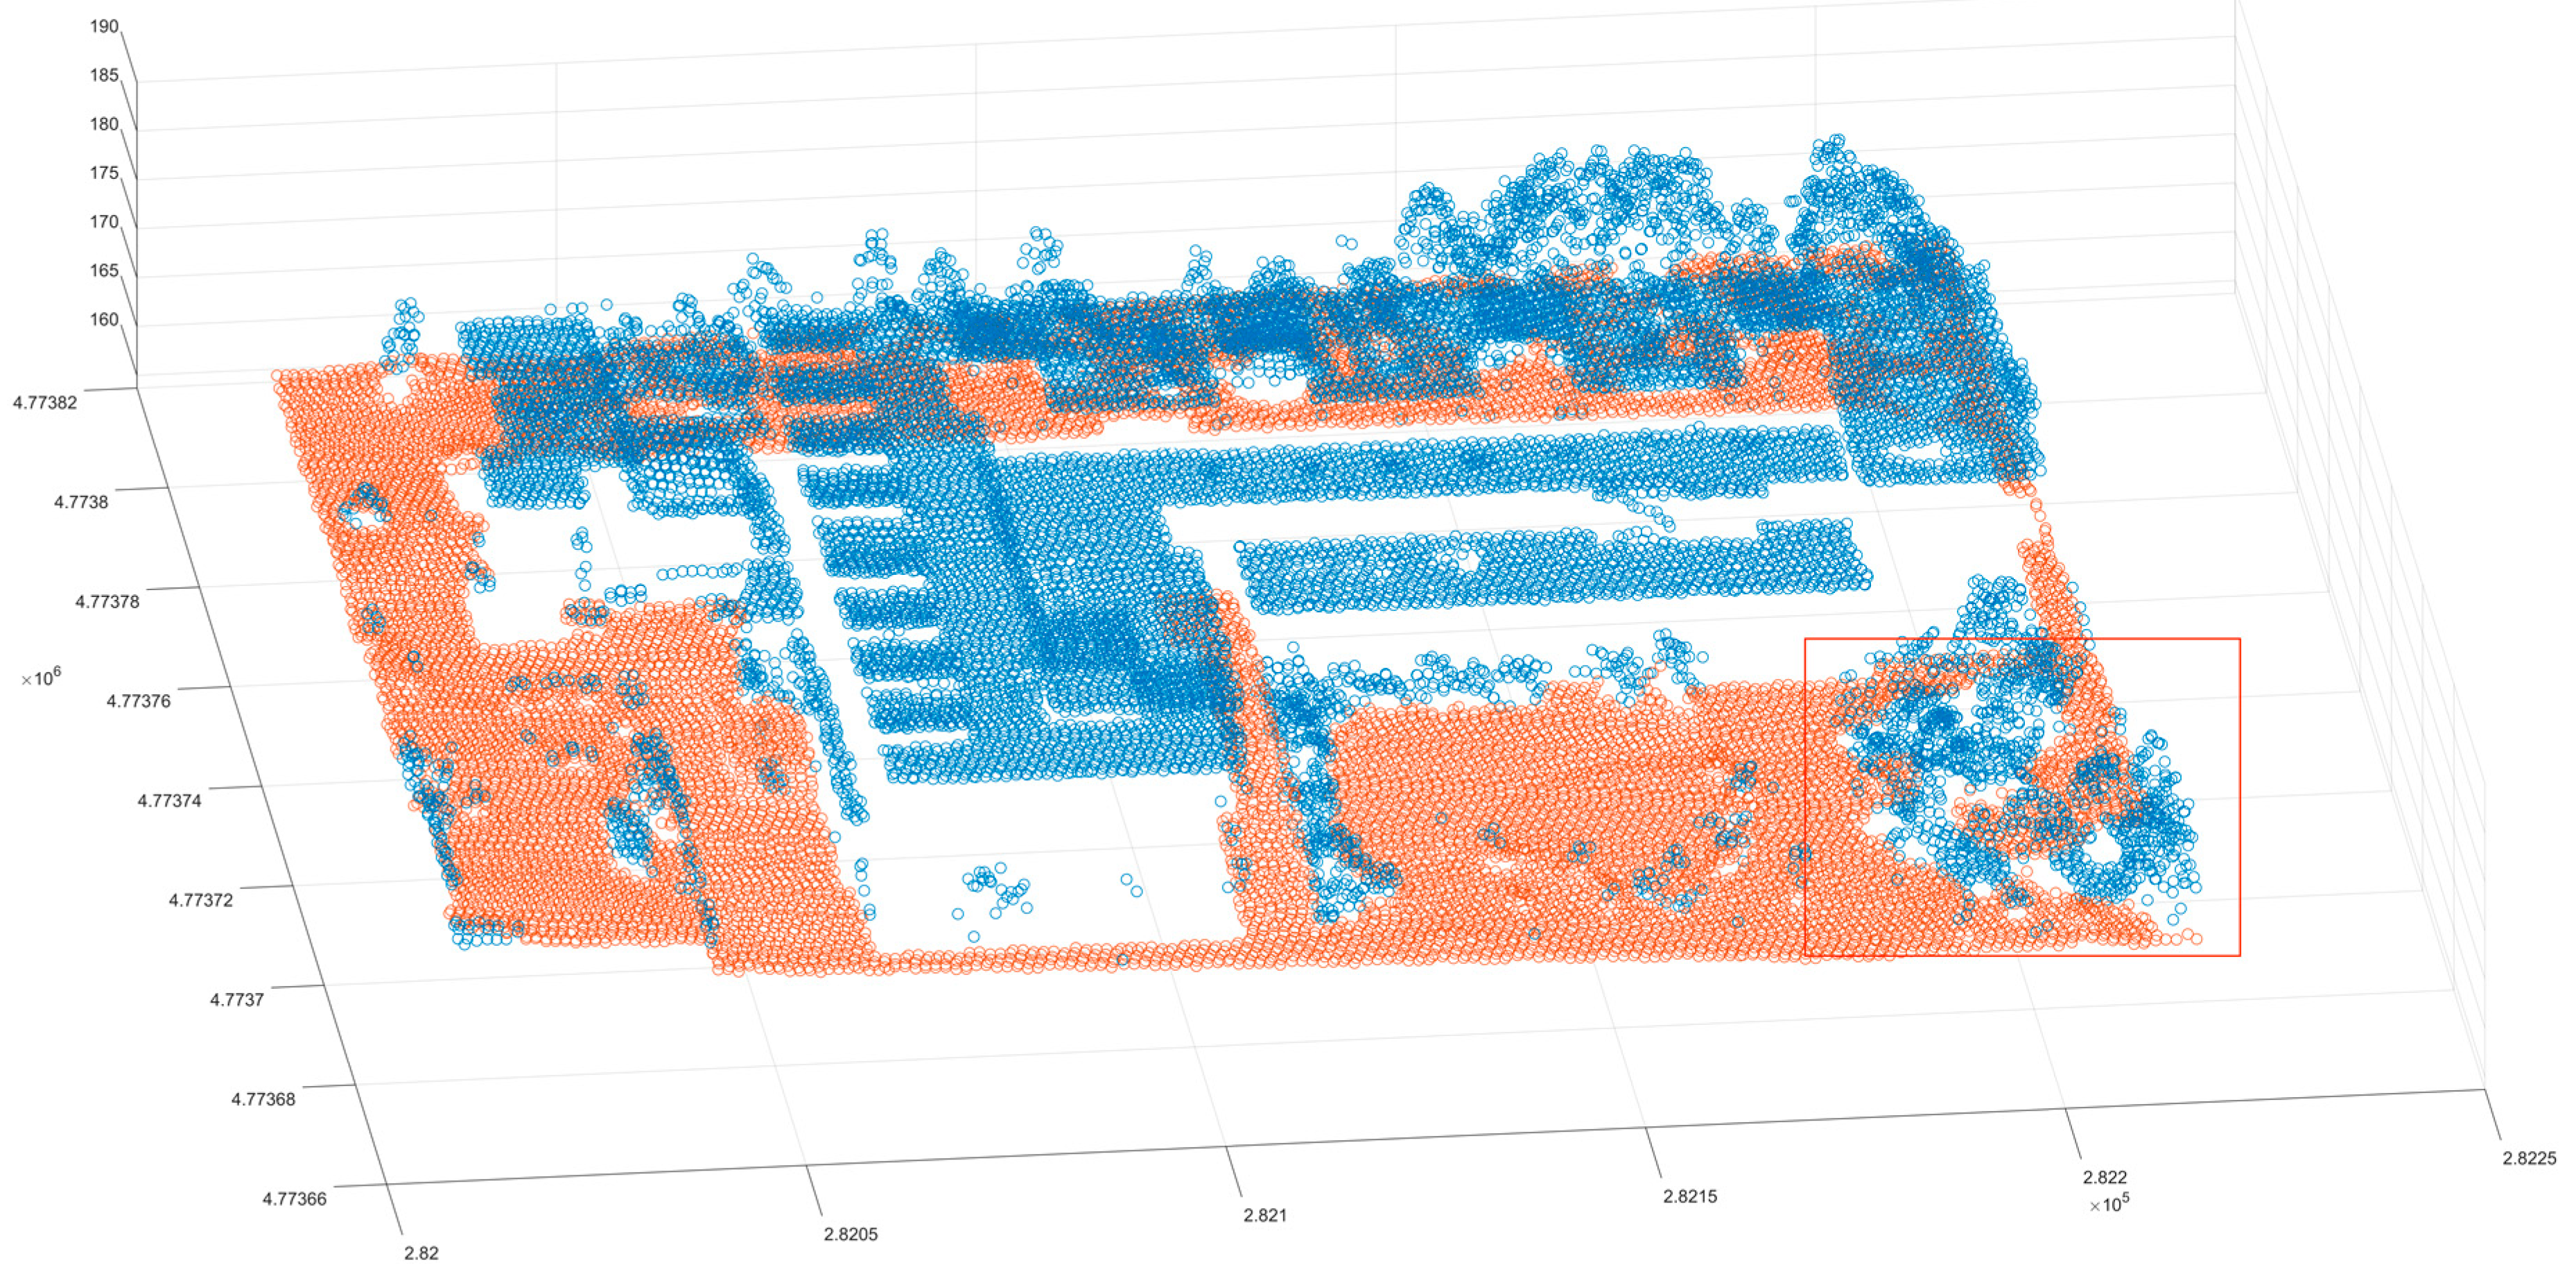
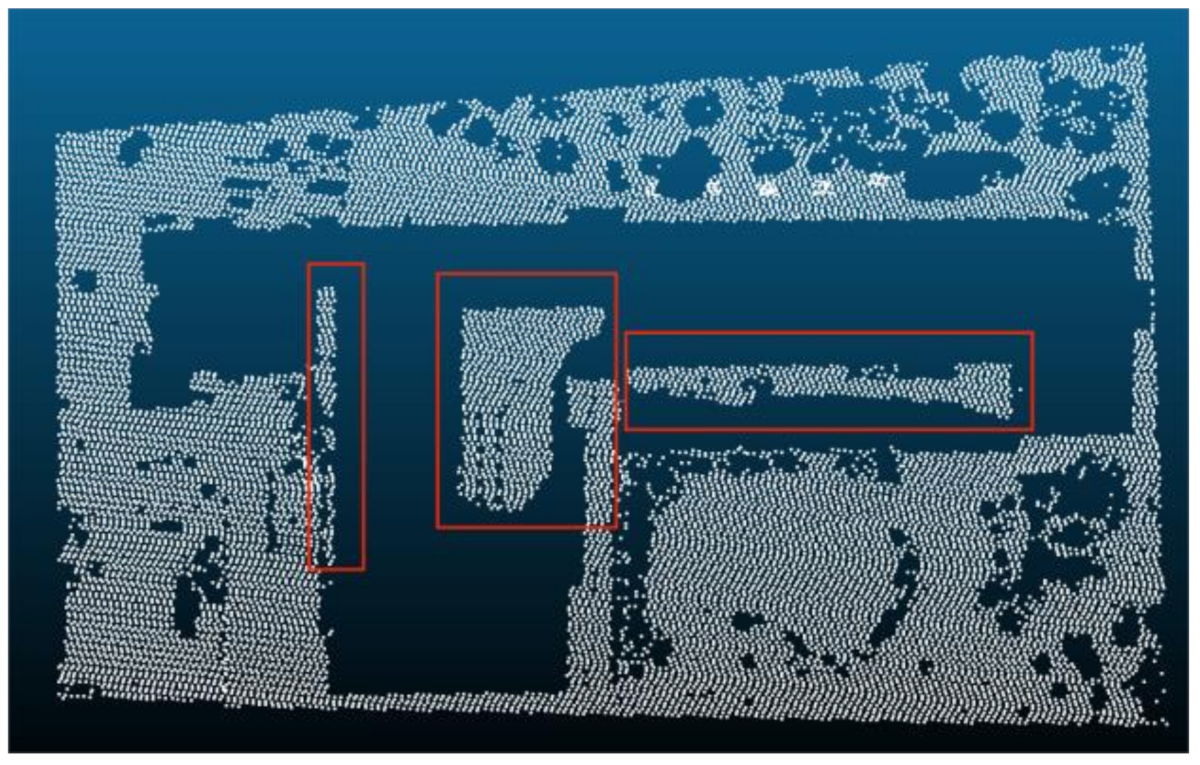
Figure 15.
The study area after the triangular grid filter (the blue dot indicates the non-ground point, the red dot indicates the ground point, and the red box indicates the ineffective area).
Figure 15.
The study area after the triangular grid filter (the blue dot indicates the non-ground point, the red dot indicates the ground point, and the red box indicates the ineffective area).
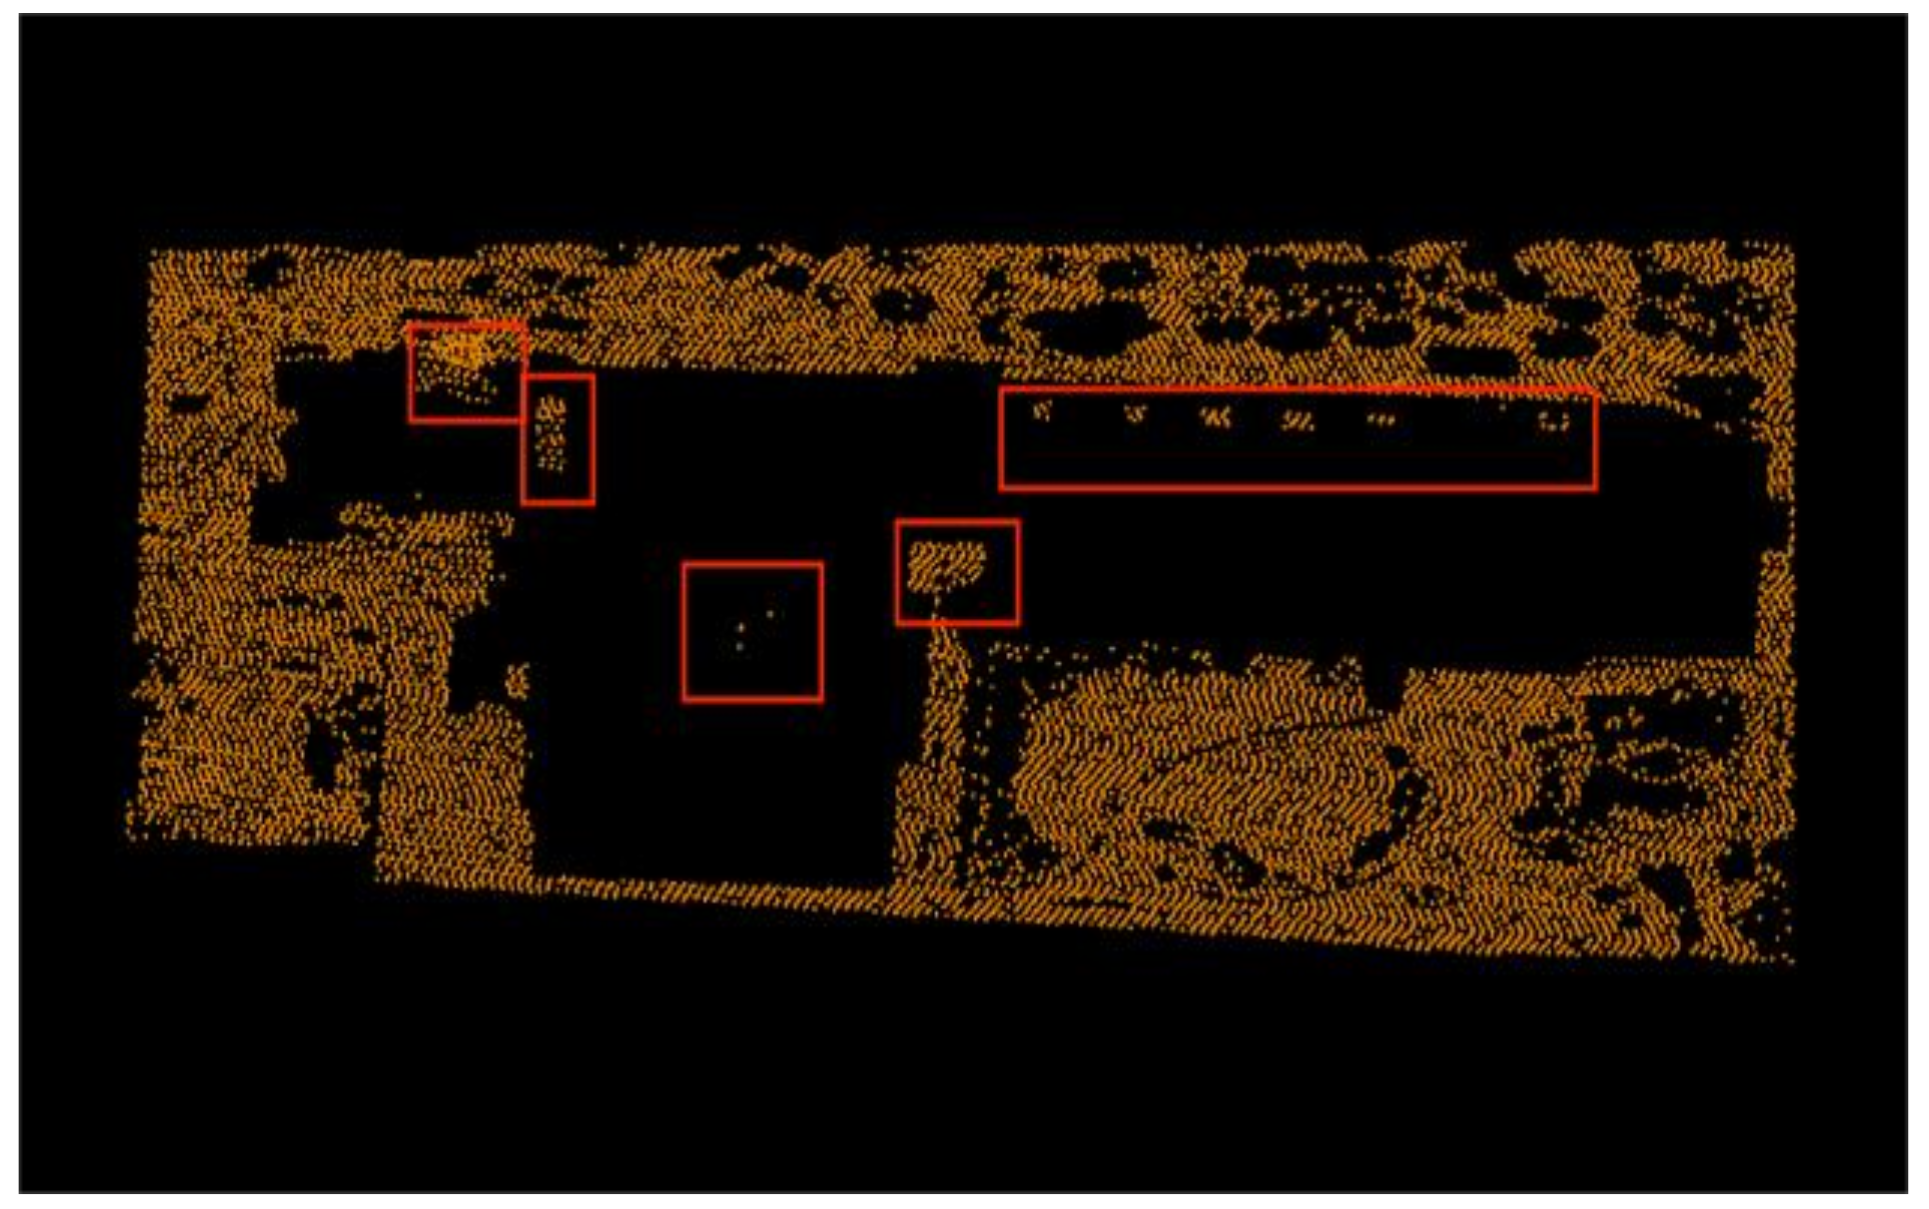
Figure 16.
The study area after the Slope Filter with a high threshold.
Figure 16.
The study area after the Slope Filter with a high threshold.
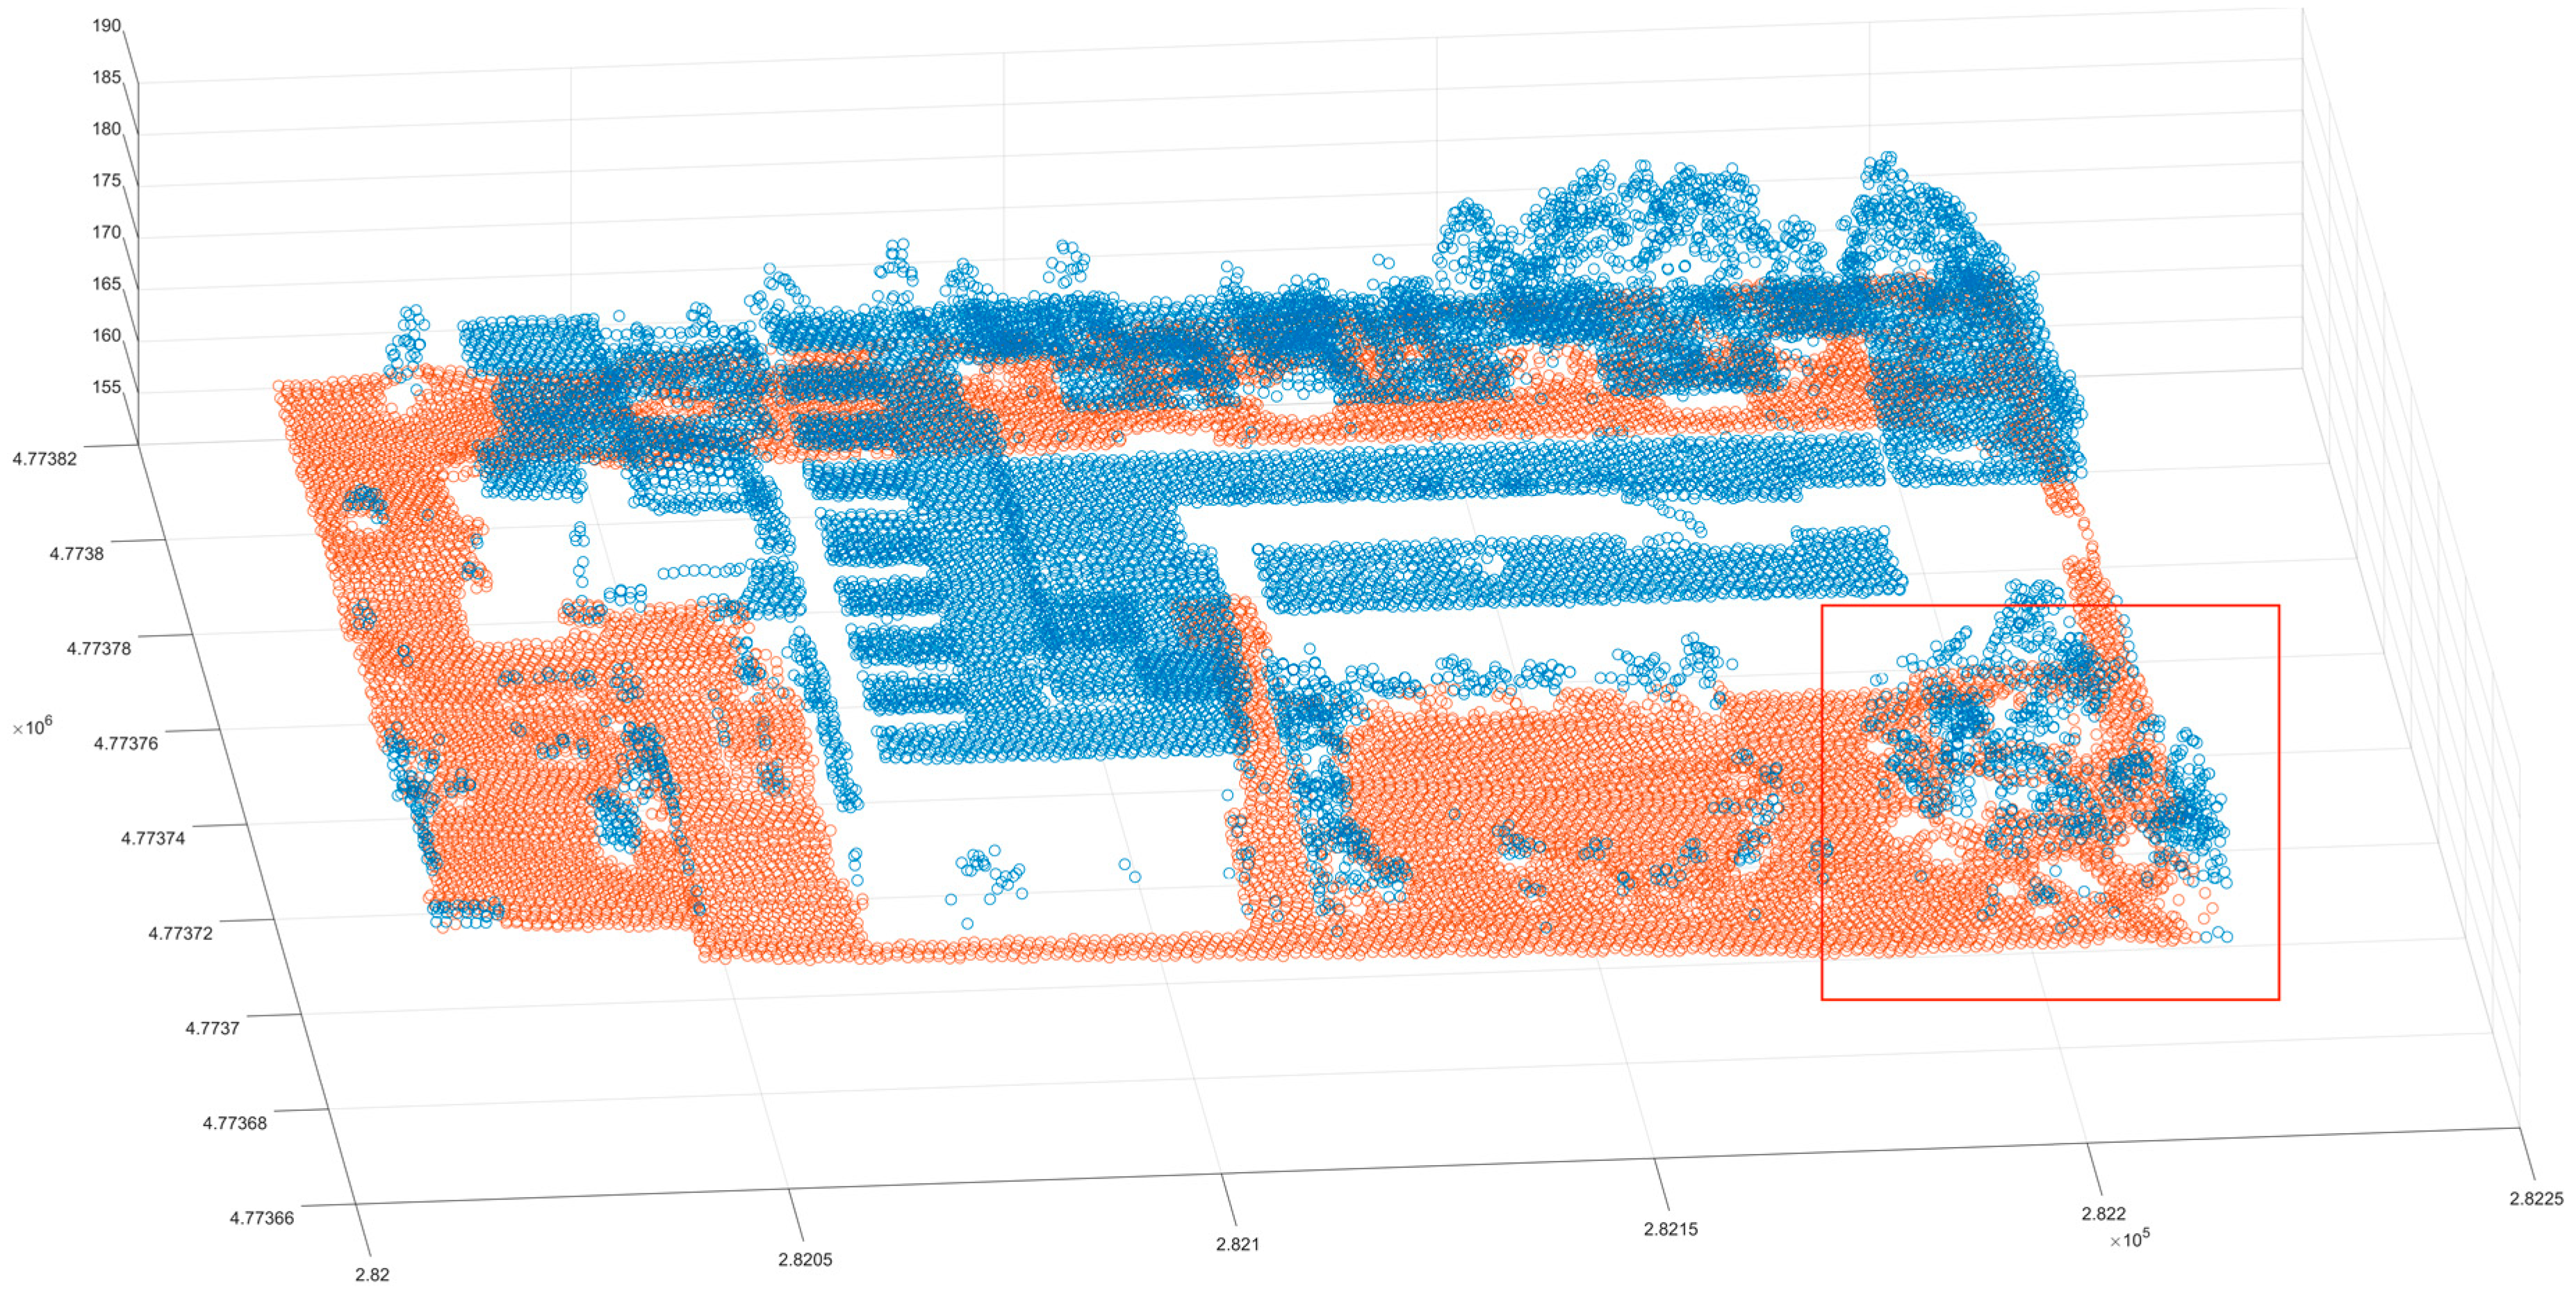
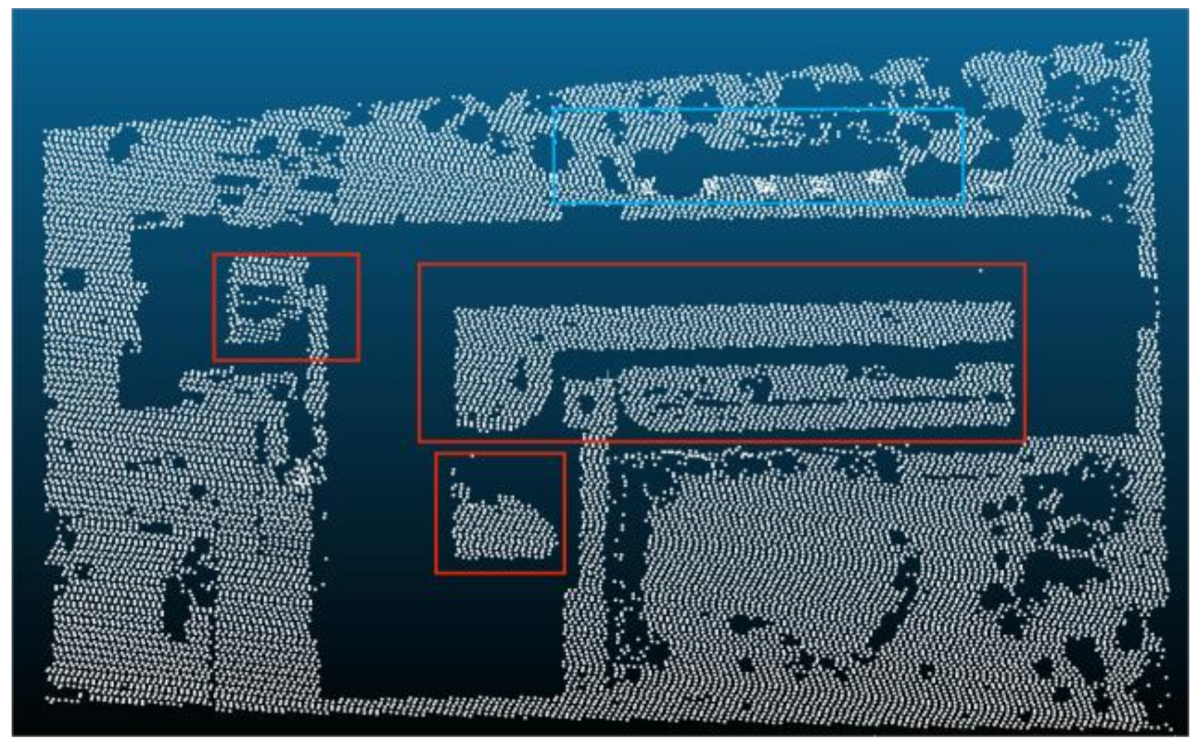
Figure 17.
The study area after the filtering process combining two methods (the blue dot indicates the non-ground point, the red dot indicates the ground point, and the red box indicates the same area effect after the improvement).
Figure 17.
The study area after the filtering process combining two methods (the blue dot indicates the non-ground point, the red dot indicates the ground point, and the red box indicates the same area effect after the improvement).
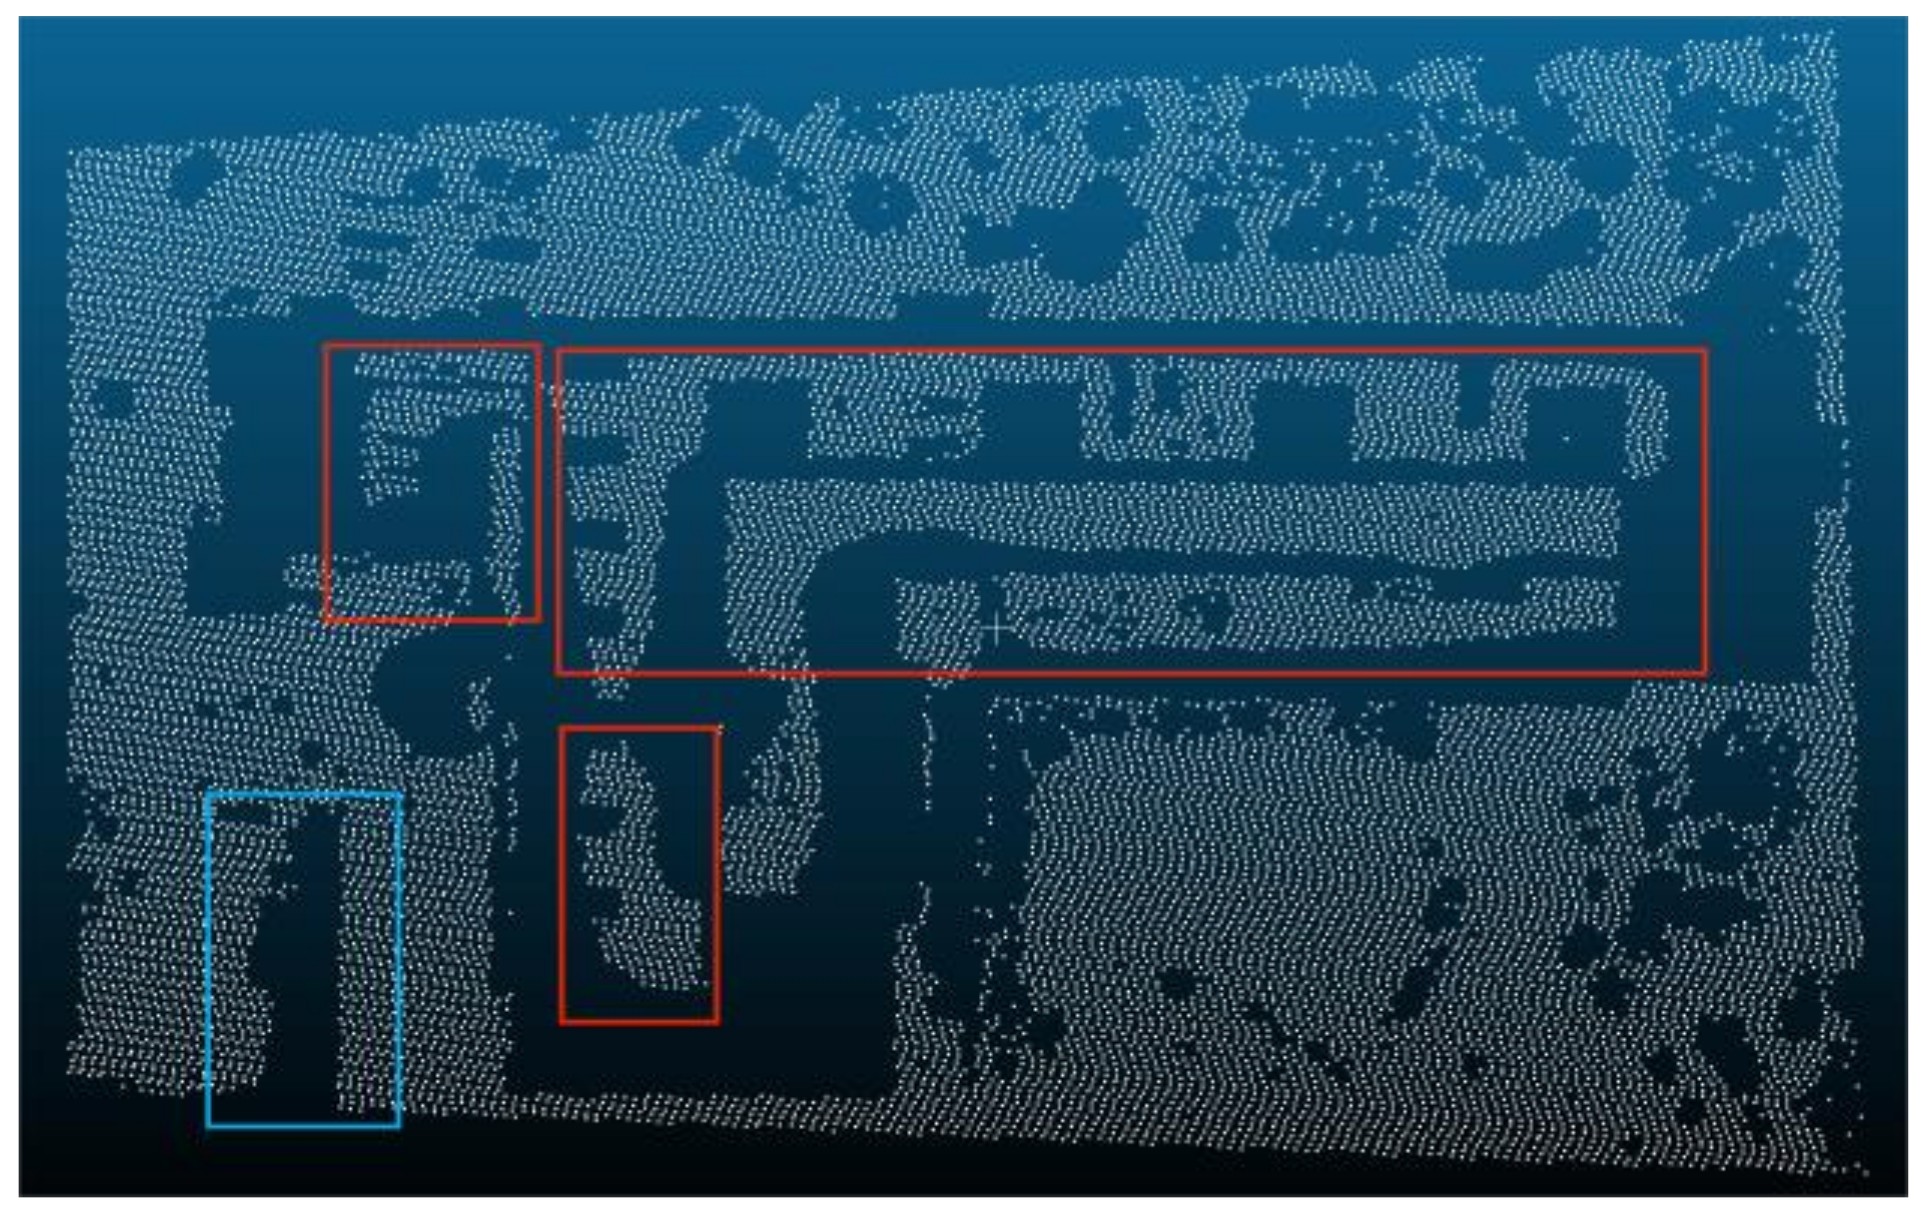
Figure 18.
The EMD Filter (the red box selection area indicates that the non-ground point is used as the ground point retention area).
Figure 18.
The EMD Filter (the red box selection area indicates that the non-ground point is used as the ground point retention area).
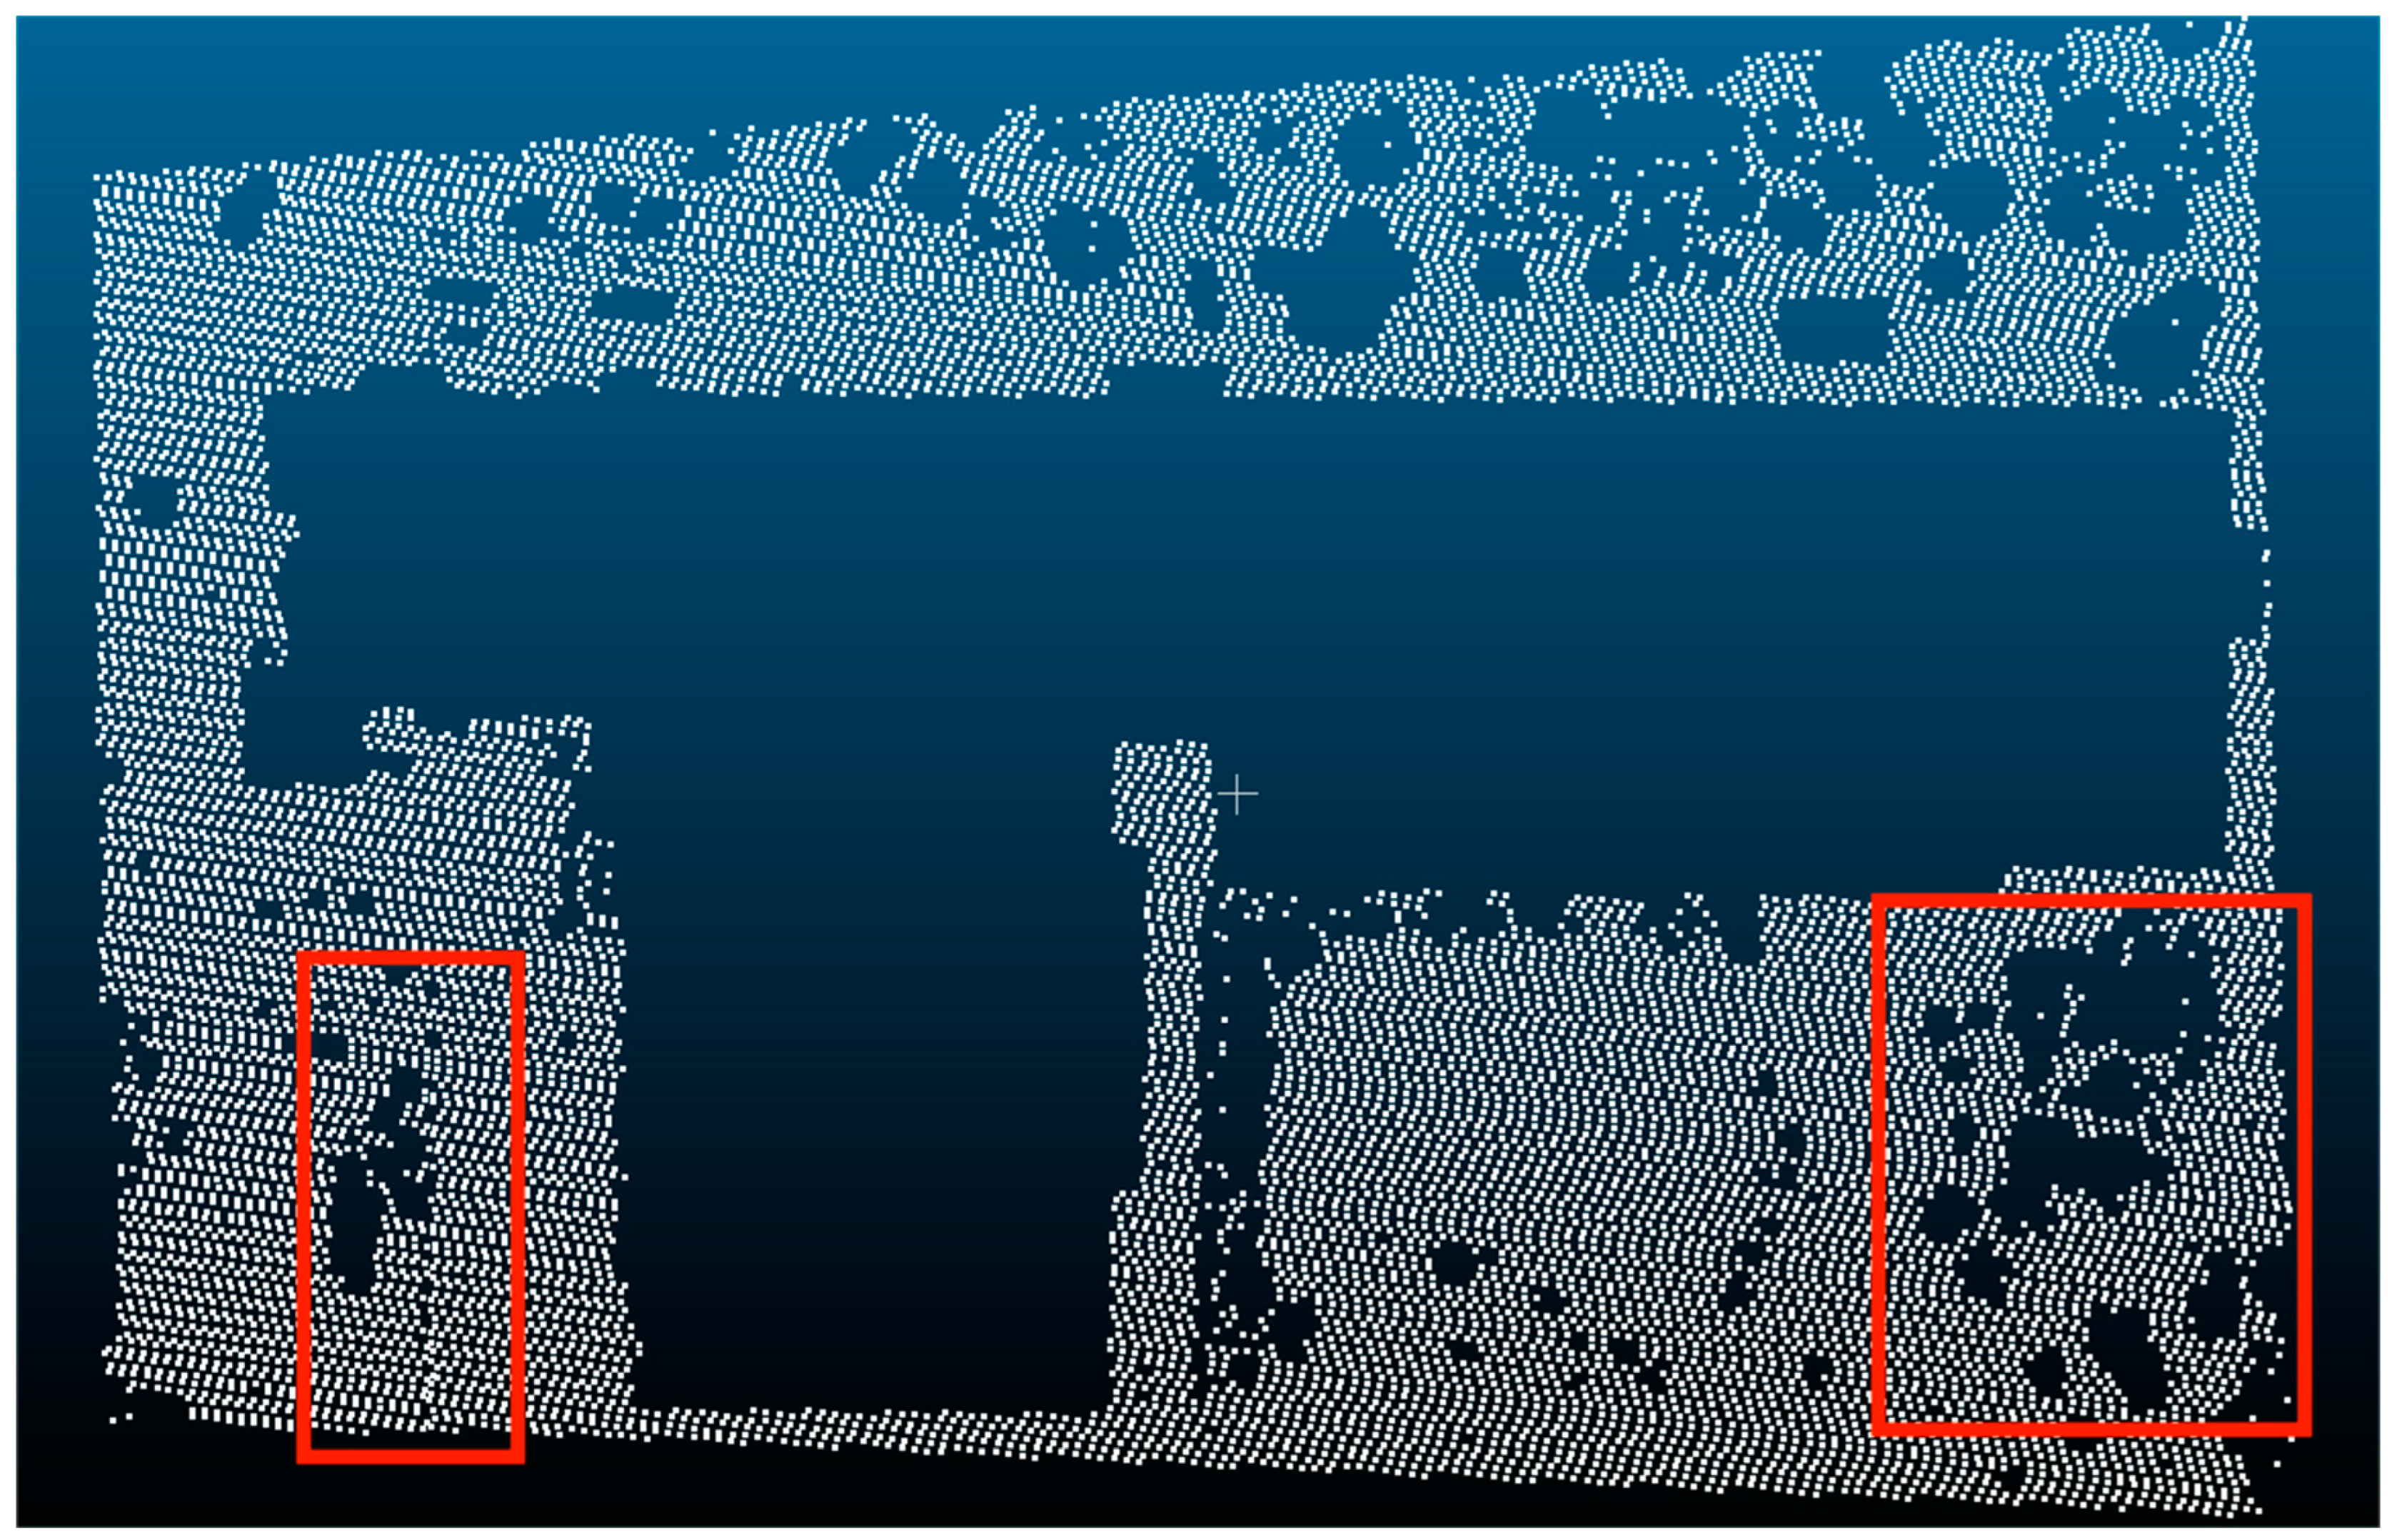
Figure 19.
The SMRF Filter (the red box selection area indicates that the non-ground point is used as the ground point retention area).
Figure 19.
The SMRF Filter (the red box selection area indicates that the non-ground point is used as the ground point retention area).
Figure 20.
The Progressive Triangular Mesh Filter (the red box selection area indicates that the non-ground point is used as the ground point retention area).
Figure 20.
The Progressive Triangular Mesh Filter (the red box selection area indicates that the non-ground point is used as the ground point retention area).
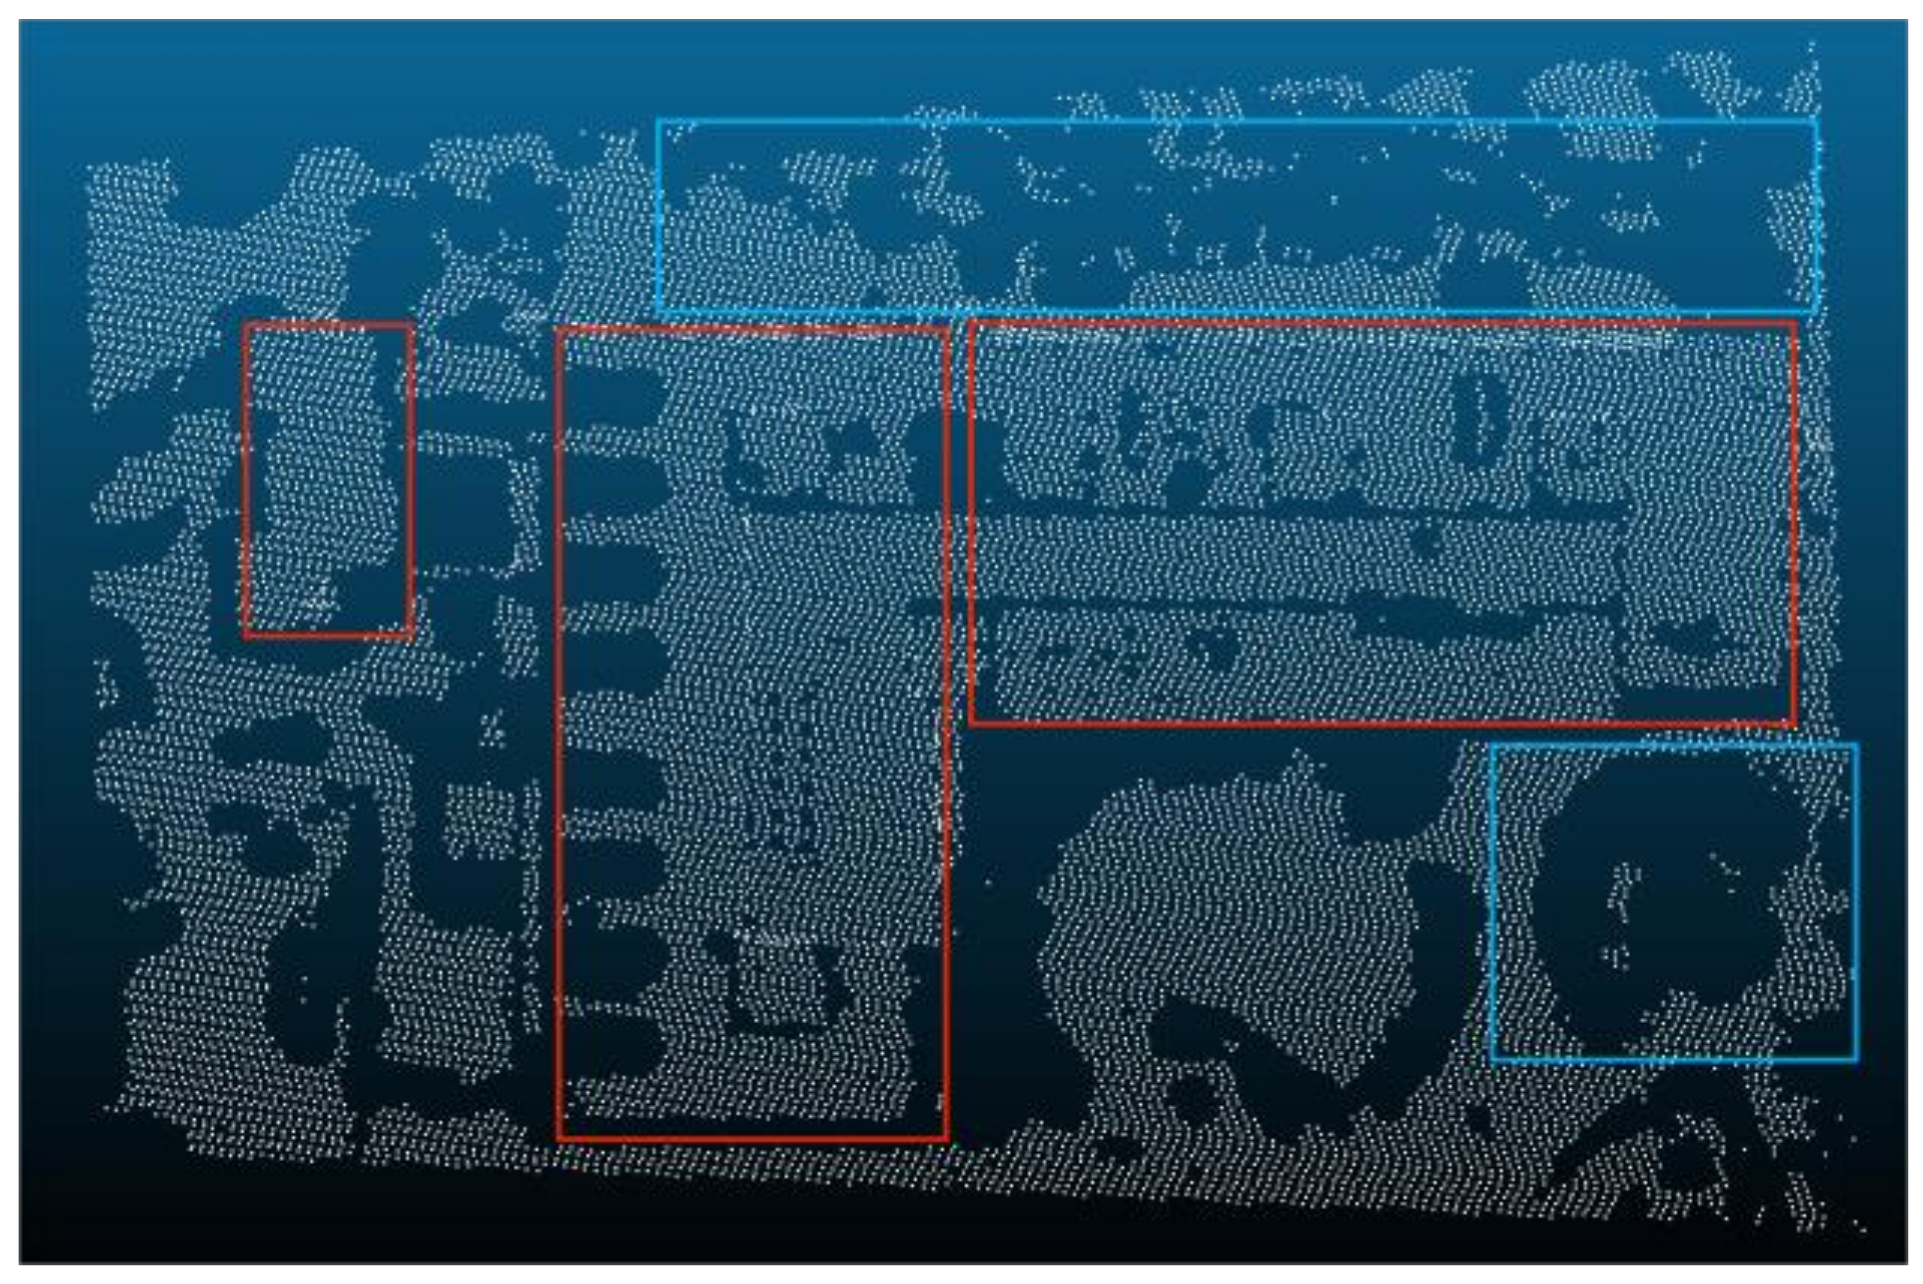
Figure 21.
Slope Filter (the red box selection area indicates that the non-ground point is used as the ground point retention area; the blue box selection area indicates that the ground point is used as the non-ground point removal area).
Figure 21.
Slope Filter (the red box selection area indicates that the non-ground point is used as the ground point retention area; the blue box selection area indicates that the ground point is used as the non-ground point removal area).
Figure 22.
Cloth Simulation Filter (the red box selection area indicates that the non-ground point is used as the ground point retention area; the blue box selection area indicates that the ground point is used as the non-ground point removal area).
Figure 22.
Cloth Simulation Filter (the red box selection area indicates that the non-ground point is used as the ground point retention area; the blue box selection area indicates that the ground point is used as the non-ground point removal area).
Figure 23.
Combining the Slope Filter and triangular grid filter (the red box selected area indicates that the filtering effect is improved).
Figure 23.
Combining the Slope Filter and triangular grid filter (the red box selected area indicates that the filtering effect is improved).
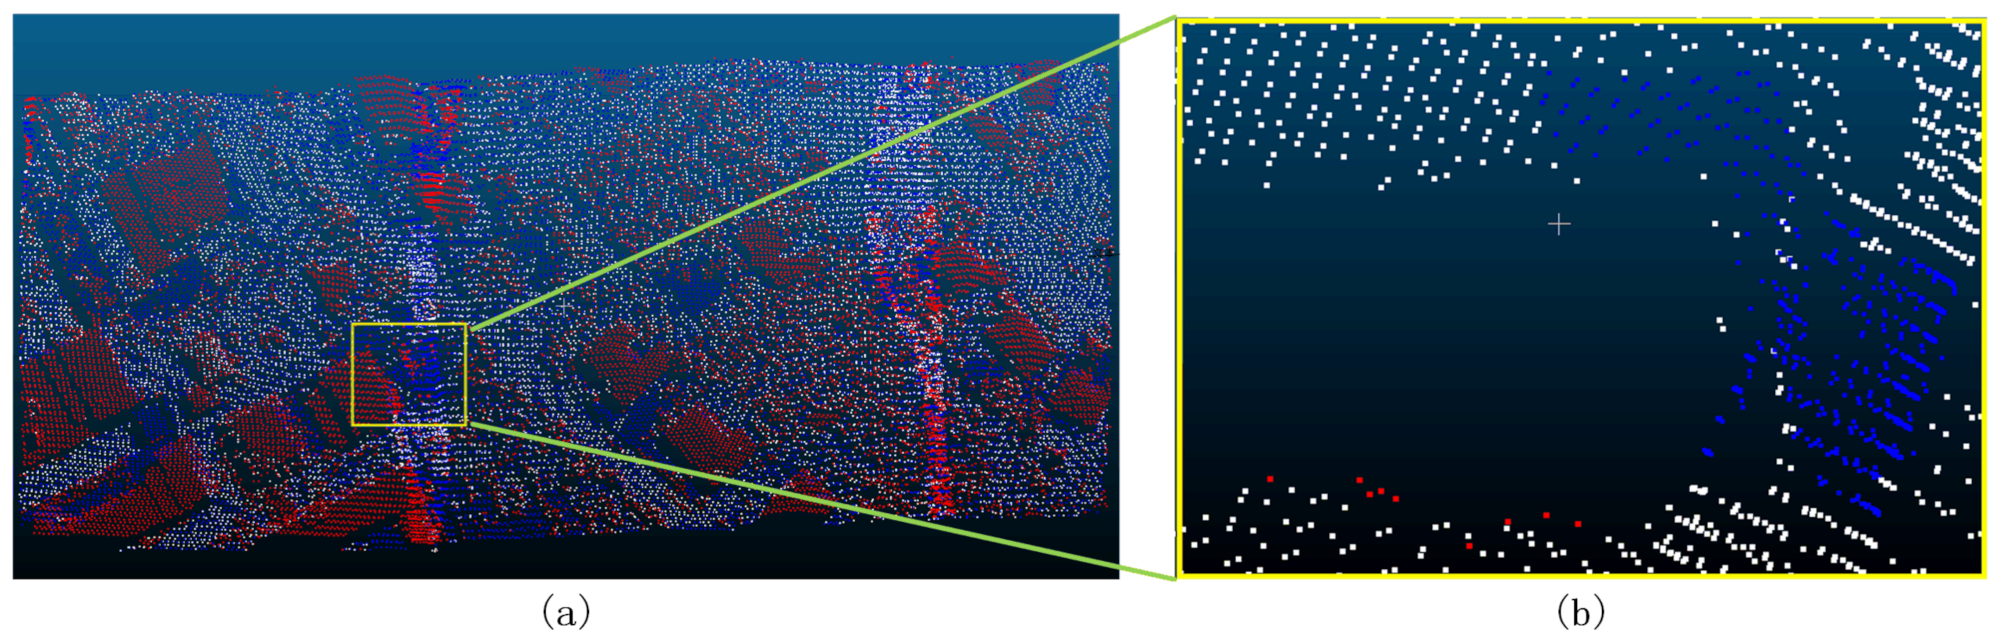
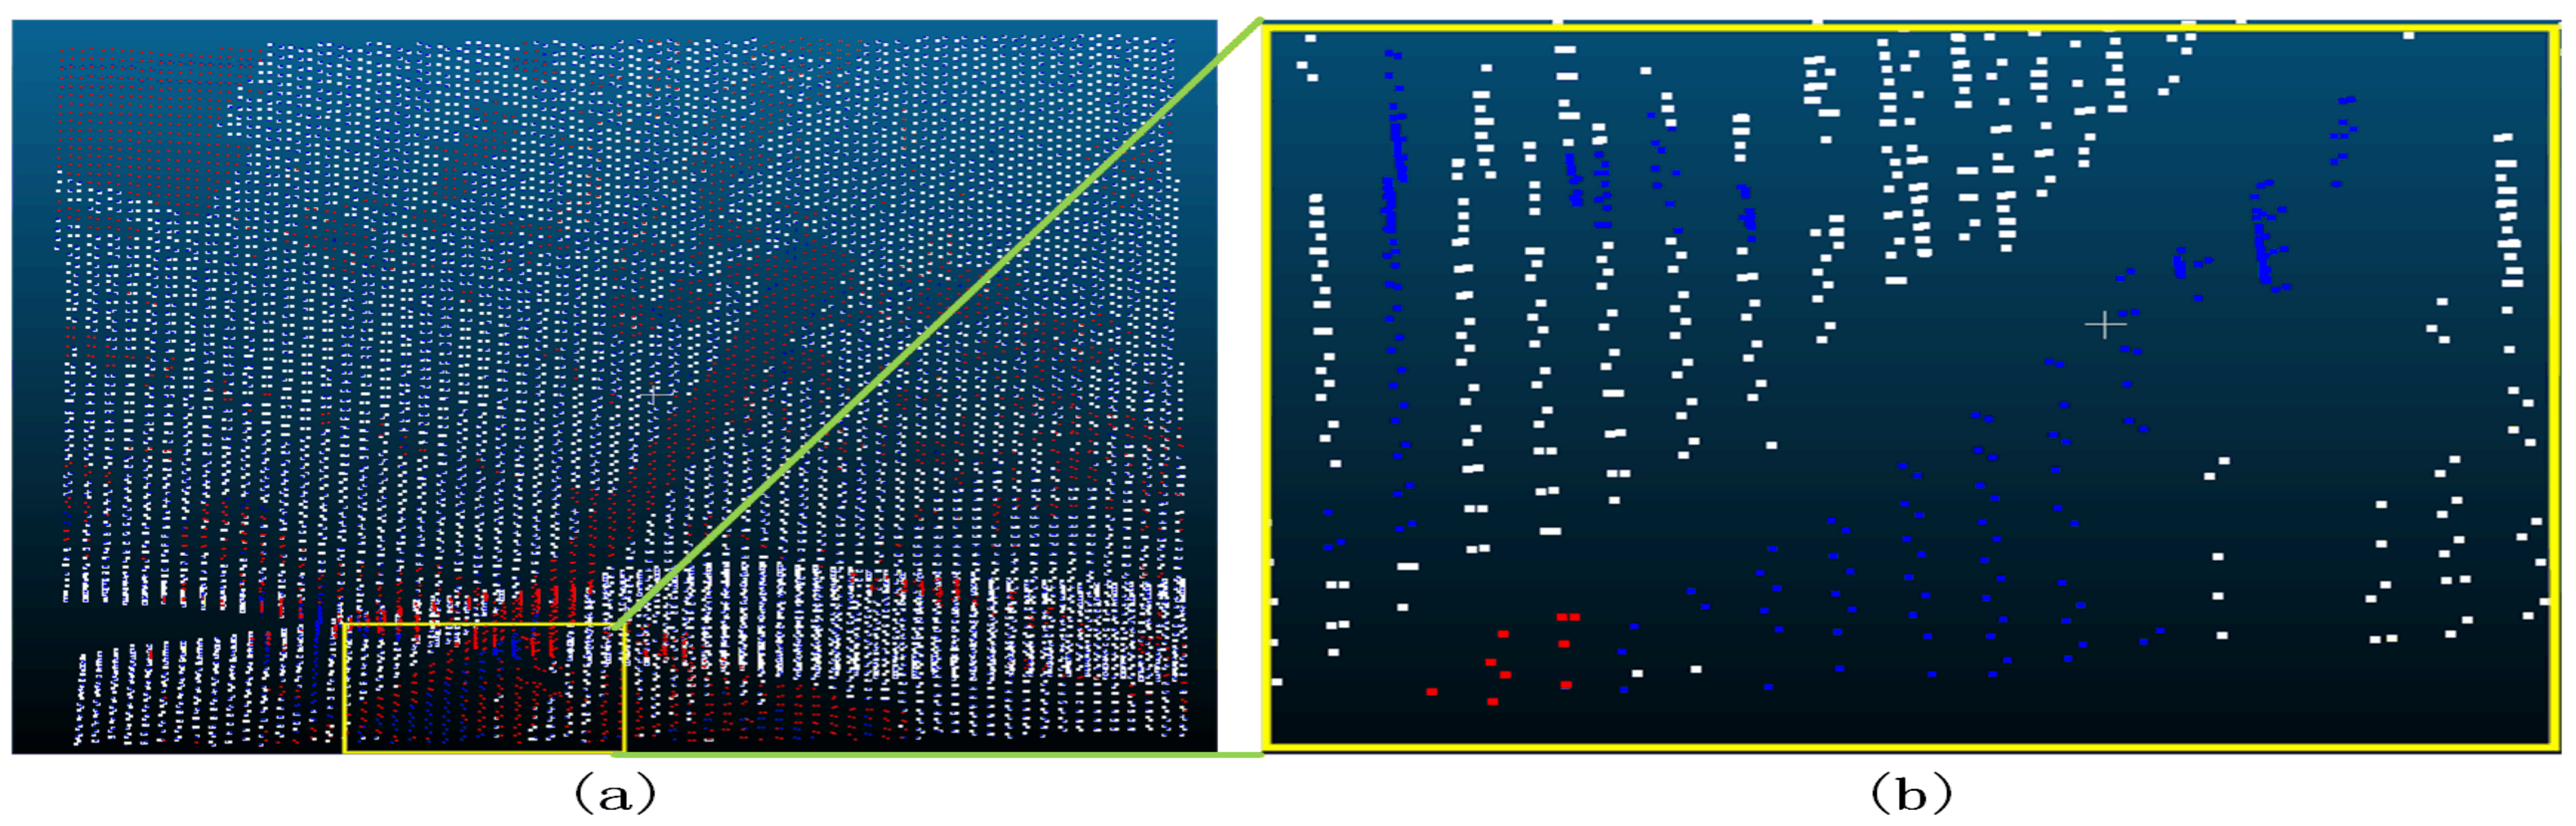
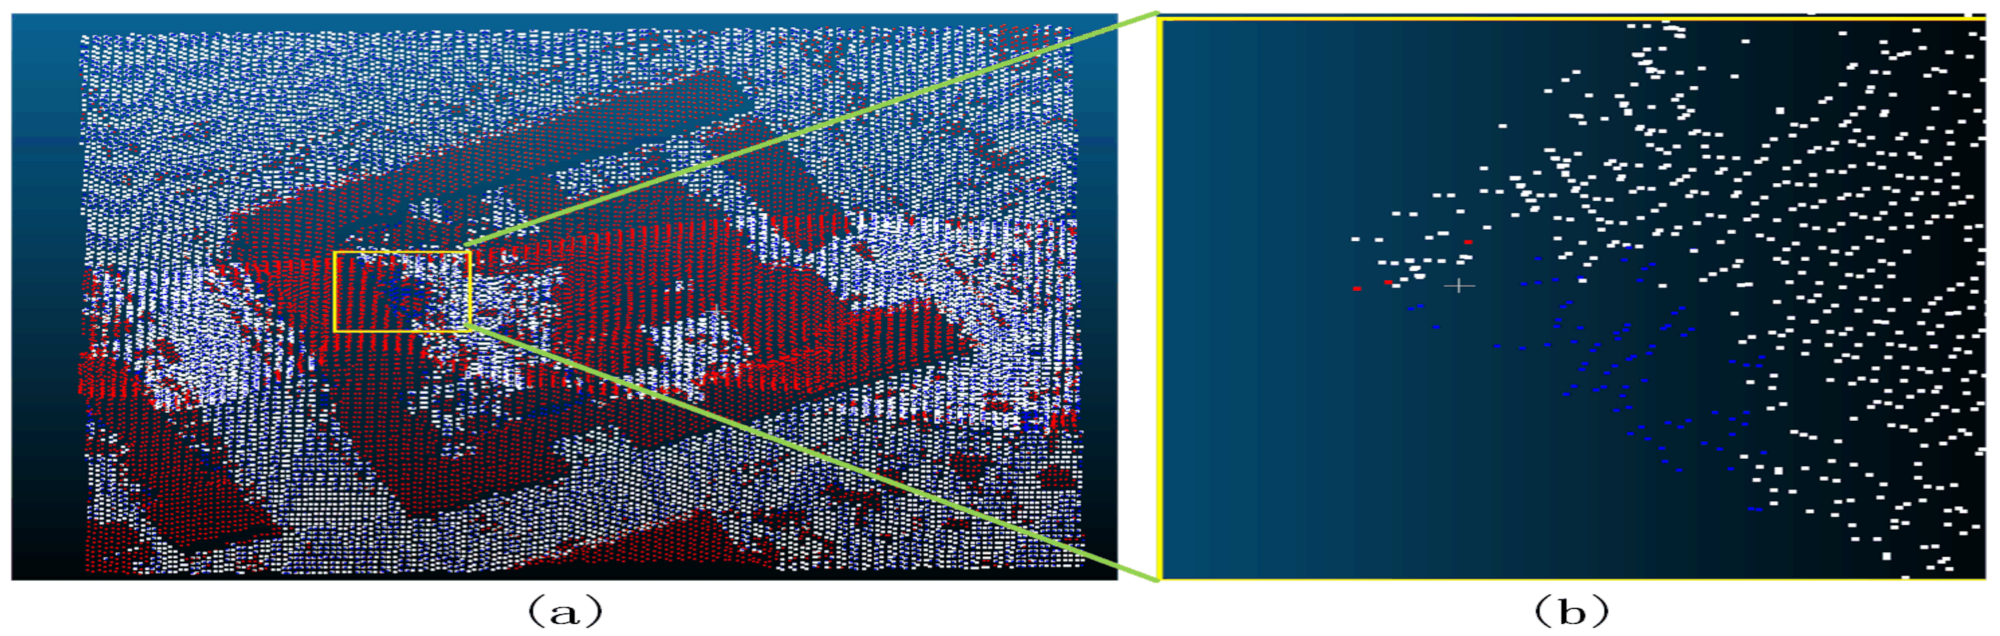
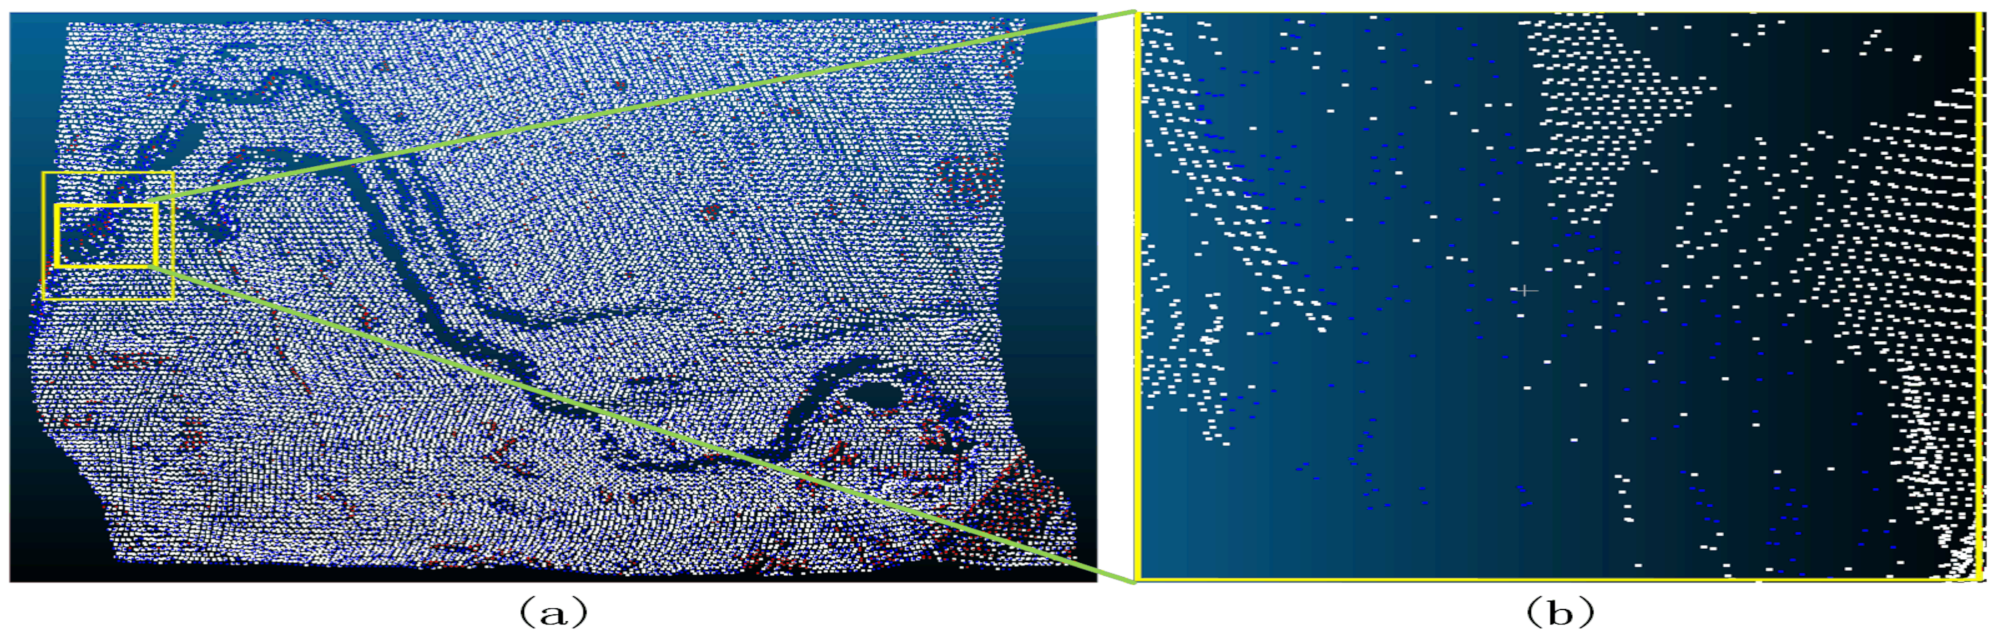
Figure 24.
Sample 1-1 after the filter ((a) represents the overview of the filtering effect; the red dot in a indicates that the original data is not ground point; the blue dot indicates ground point; and the white dot indicates the remaining point after filtering as ground point; (b) represents the poor filtering effect; the red dot indicates Type II error; the blue dot indicates Type I error; and the white dot indicates the correct point).
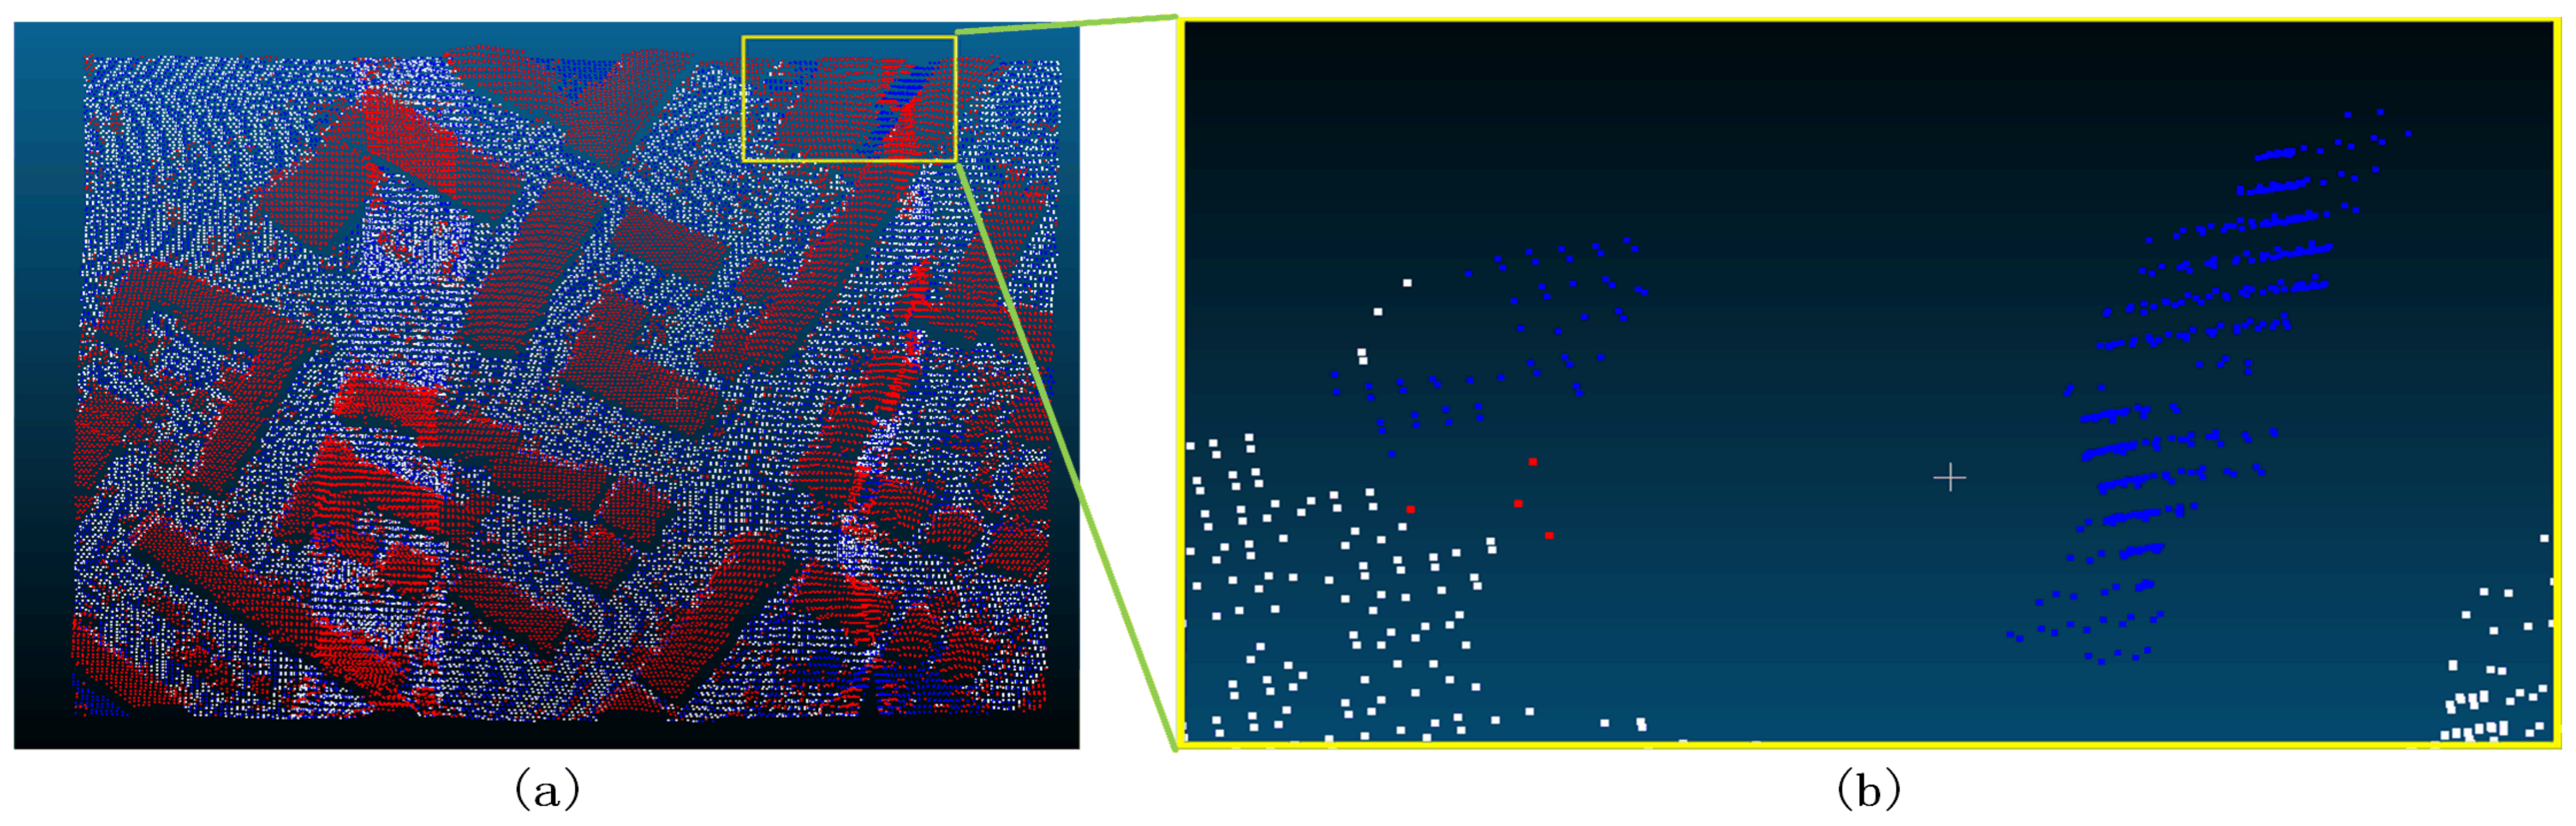
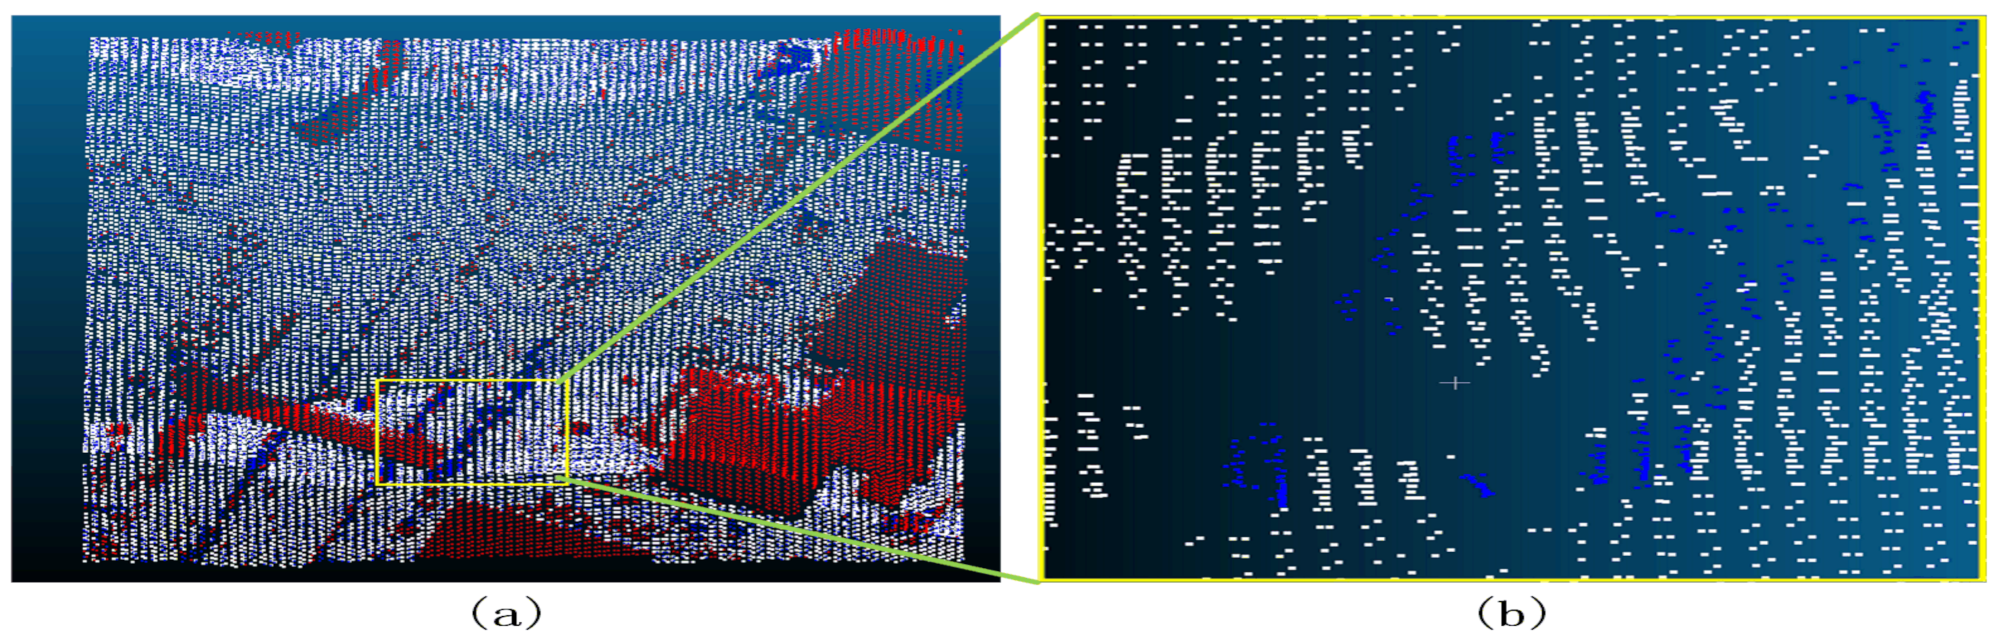
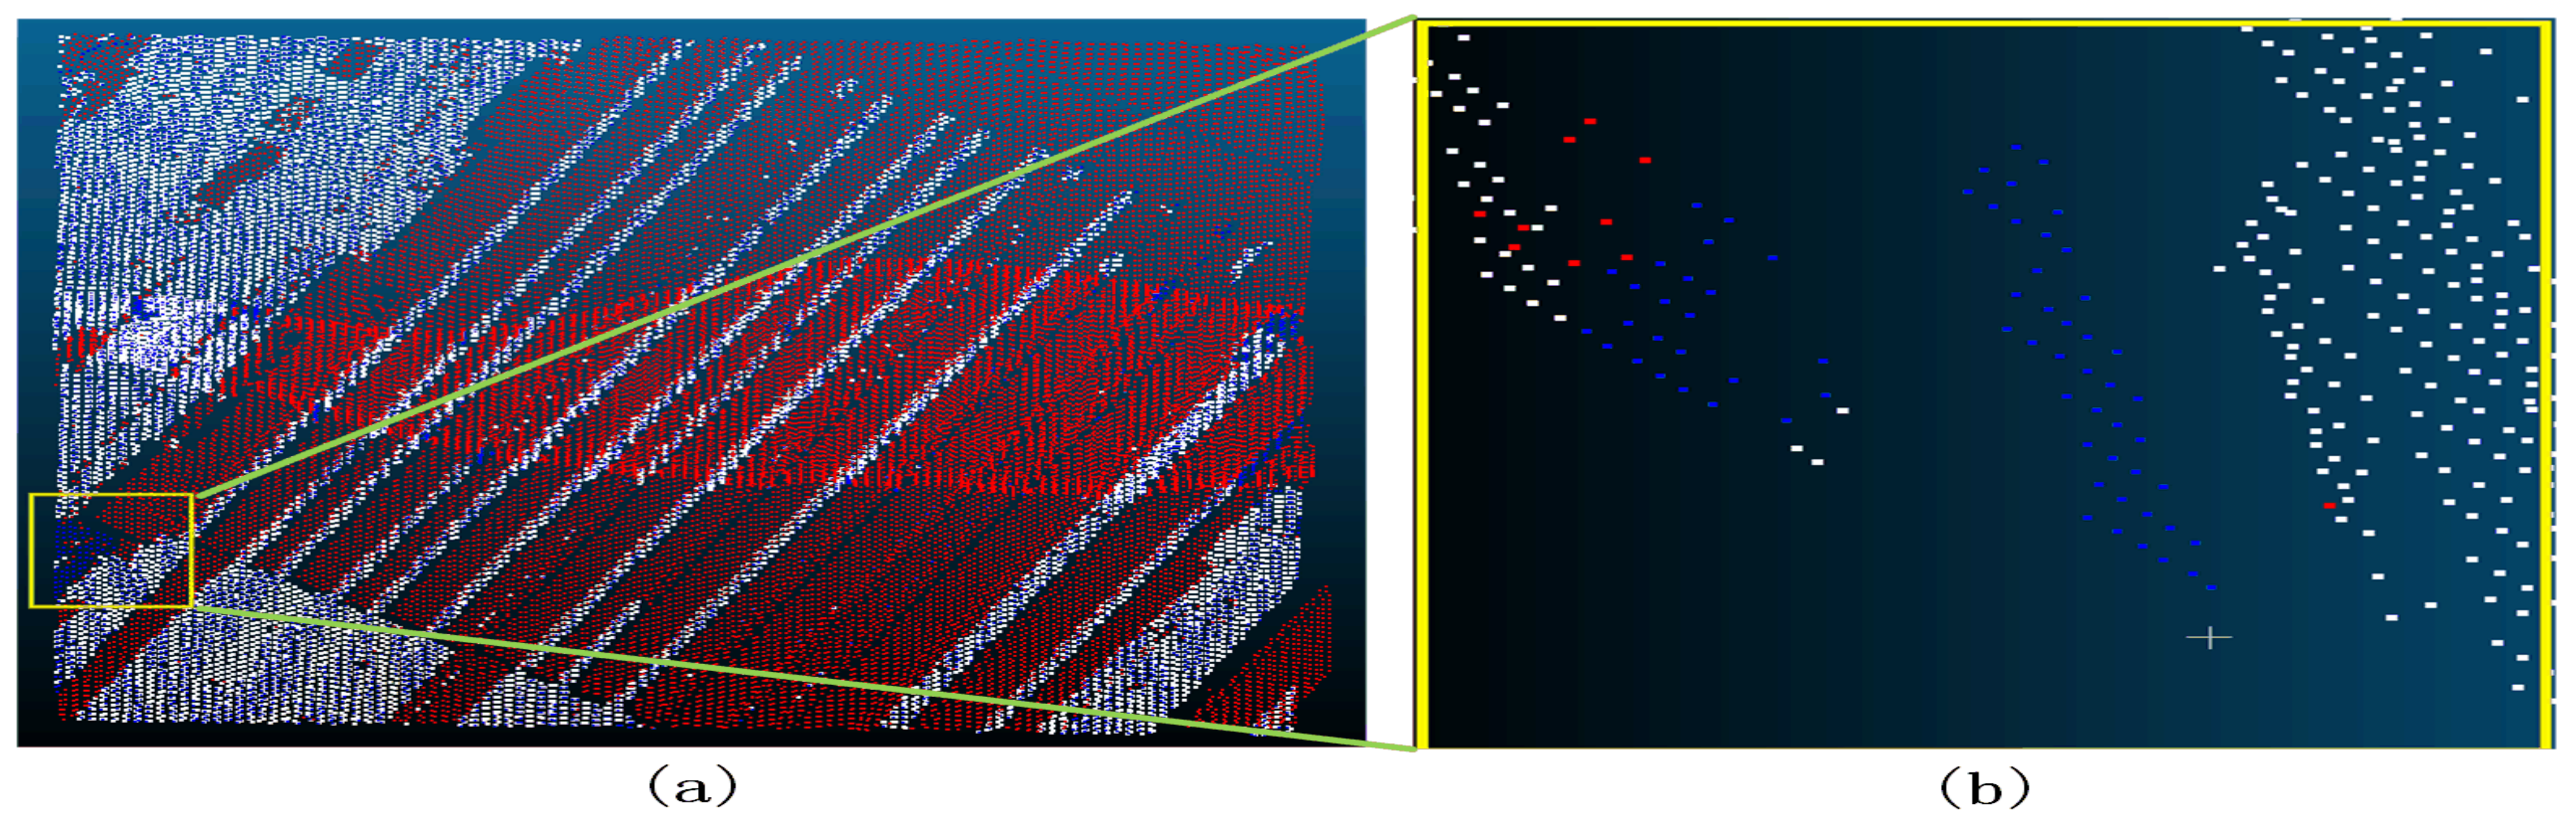
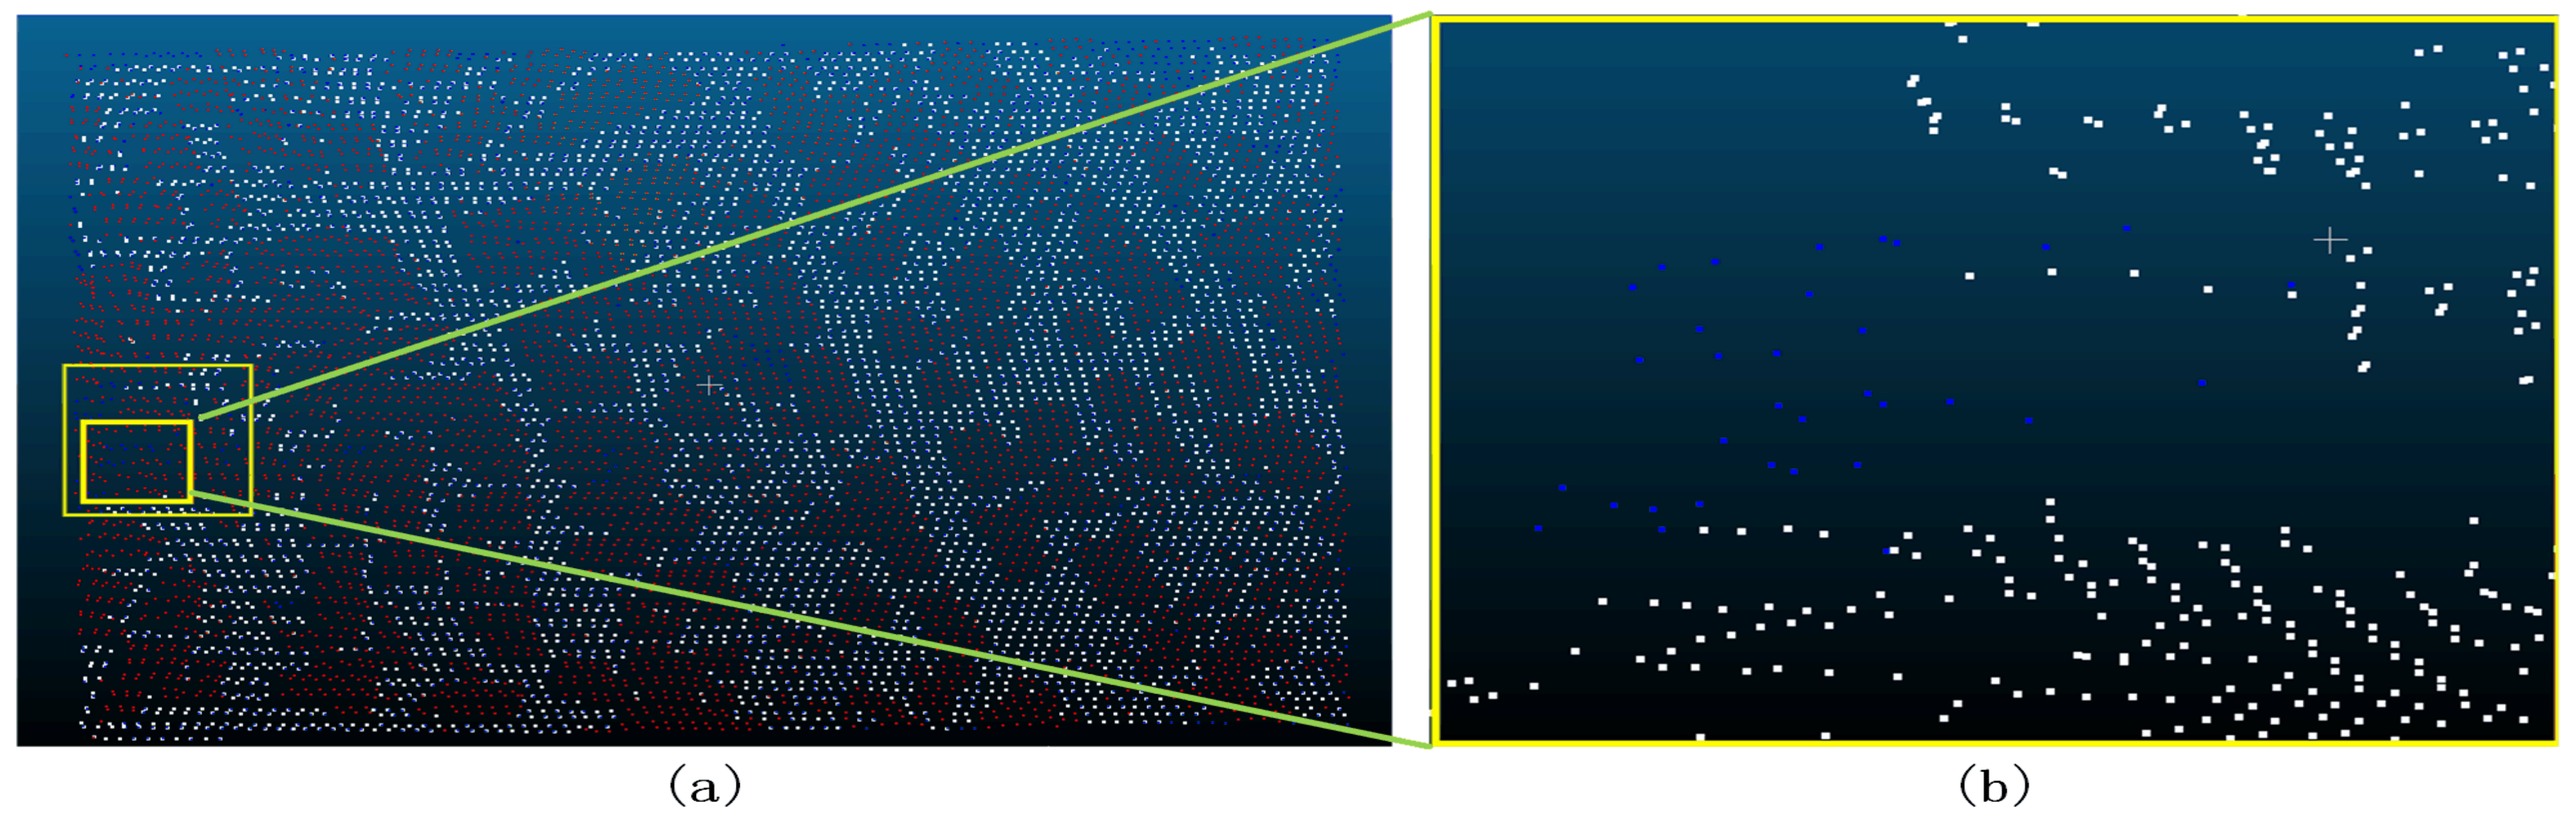
Figure 25.
Sample 1-2 after the filter ((a) represents the overview of the filtering effect; the red dot in a indicates that the original data is not ground point; the blue dot indicates ground point; and the white dot indicates the remaining point after filtering as ground point; (b) represents the poor filtering effect; the red dot indicates Type II error; the blue dot indicates Type I error; and the white dot indicates the correct point).
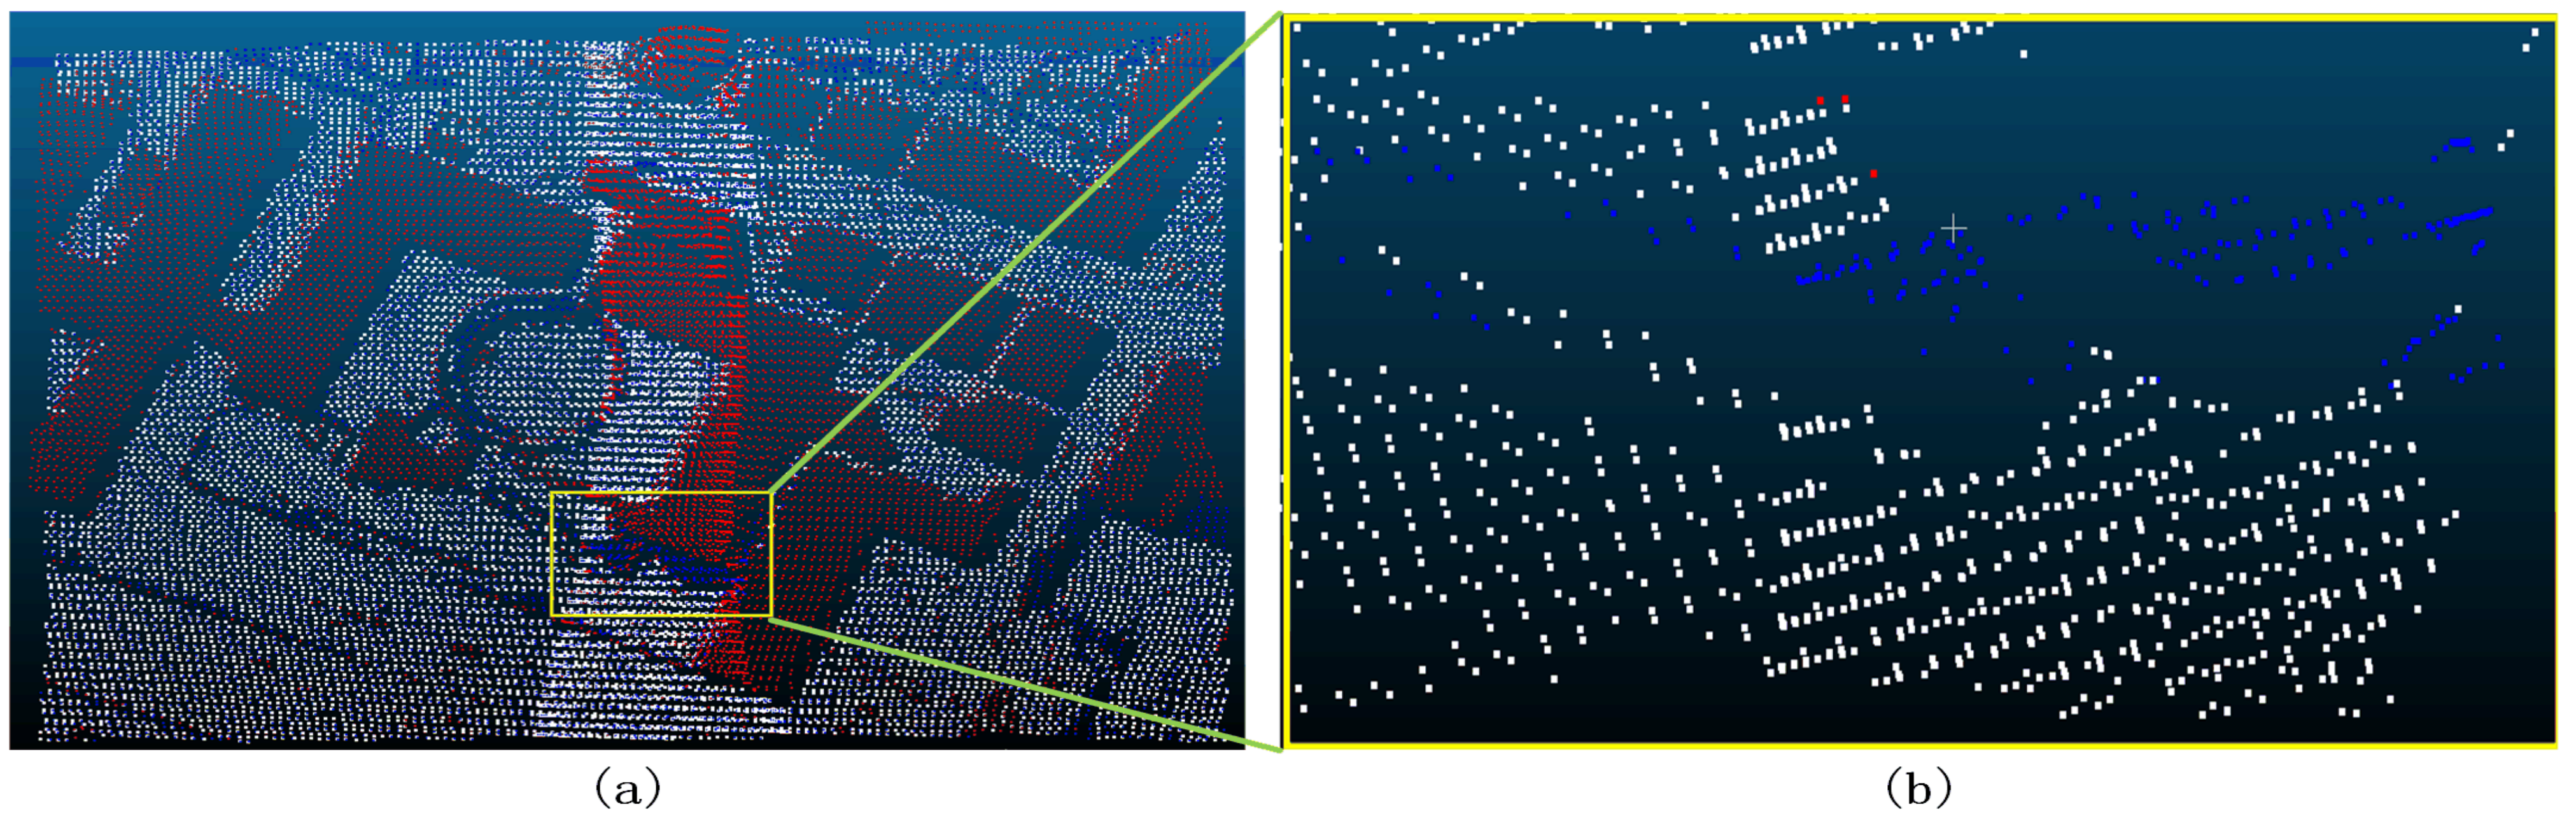
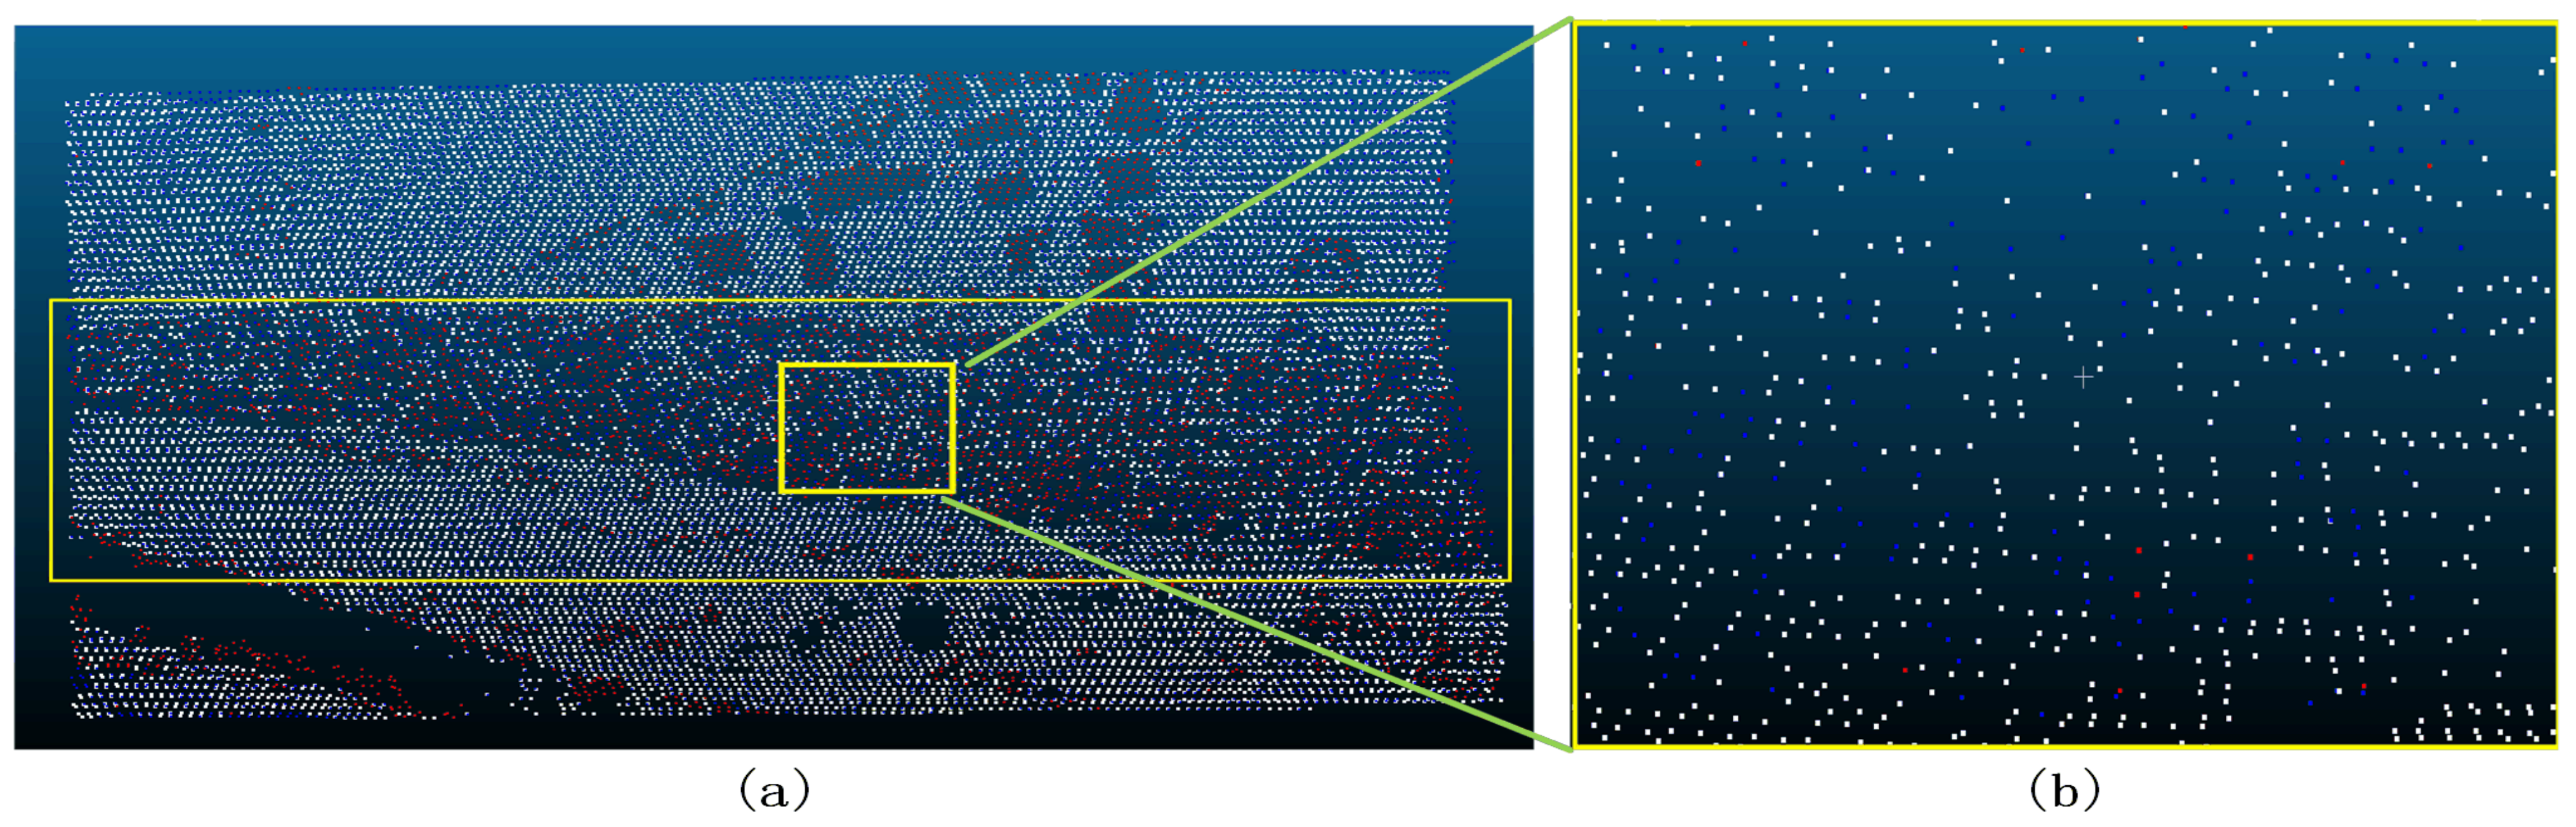
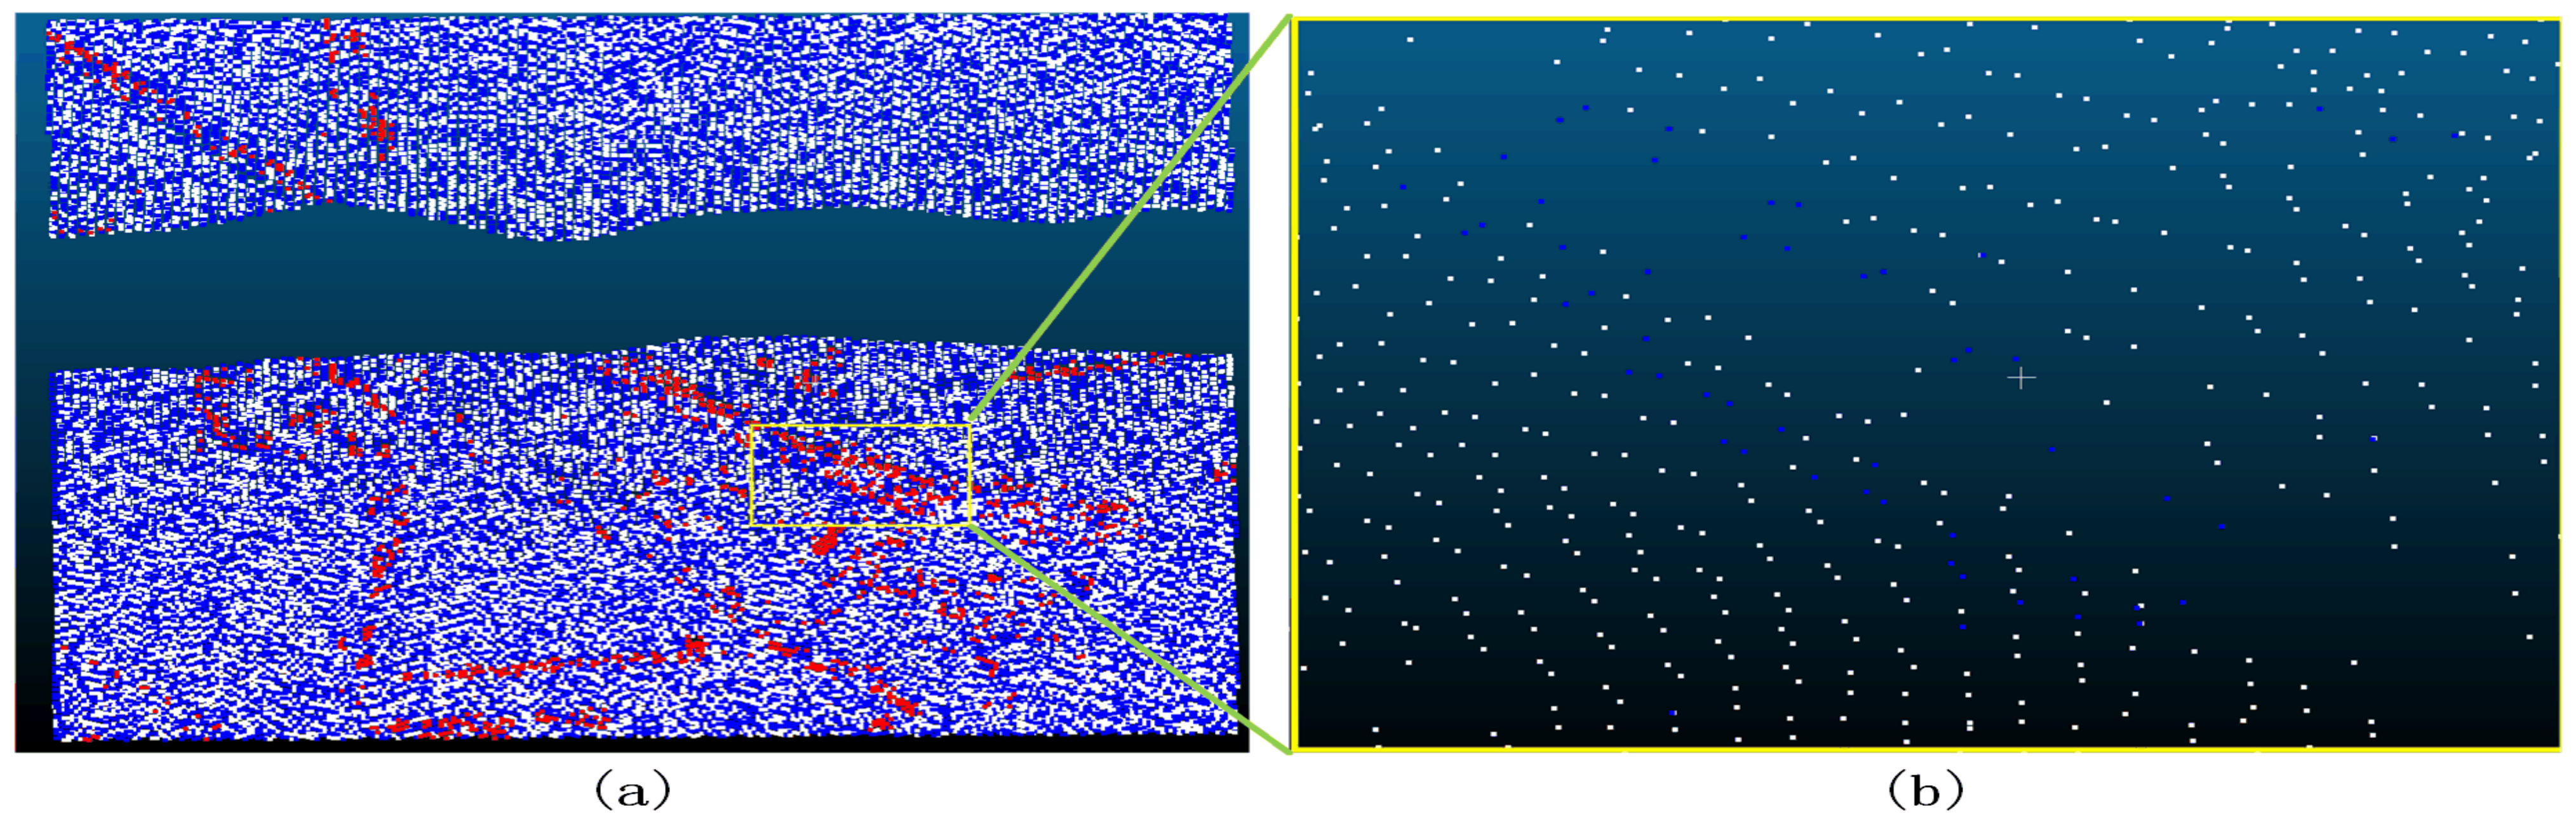
Figure 26.
Sample 2-1 after the filter ((a) represents the overview of the filtering effect; the red dot in a indicates that the original data is not ground point, the blue dot indicates ground point, and the white dot indicates the remaining point after filtering as ground point; (b) represents the poor filtering effect; the red dot indicates Type II error, the blue dot indicates Type I error, and the white dot indicates the correct point).
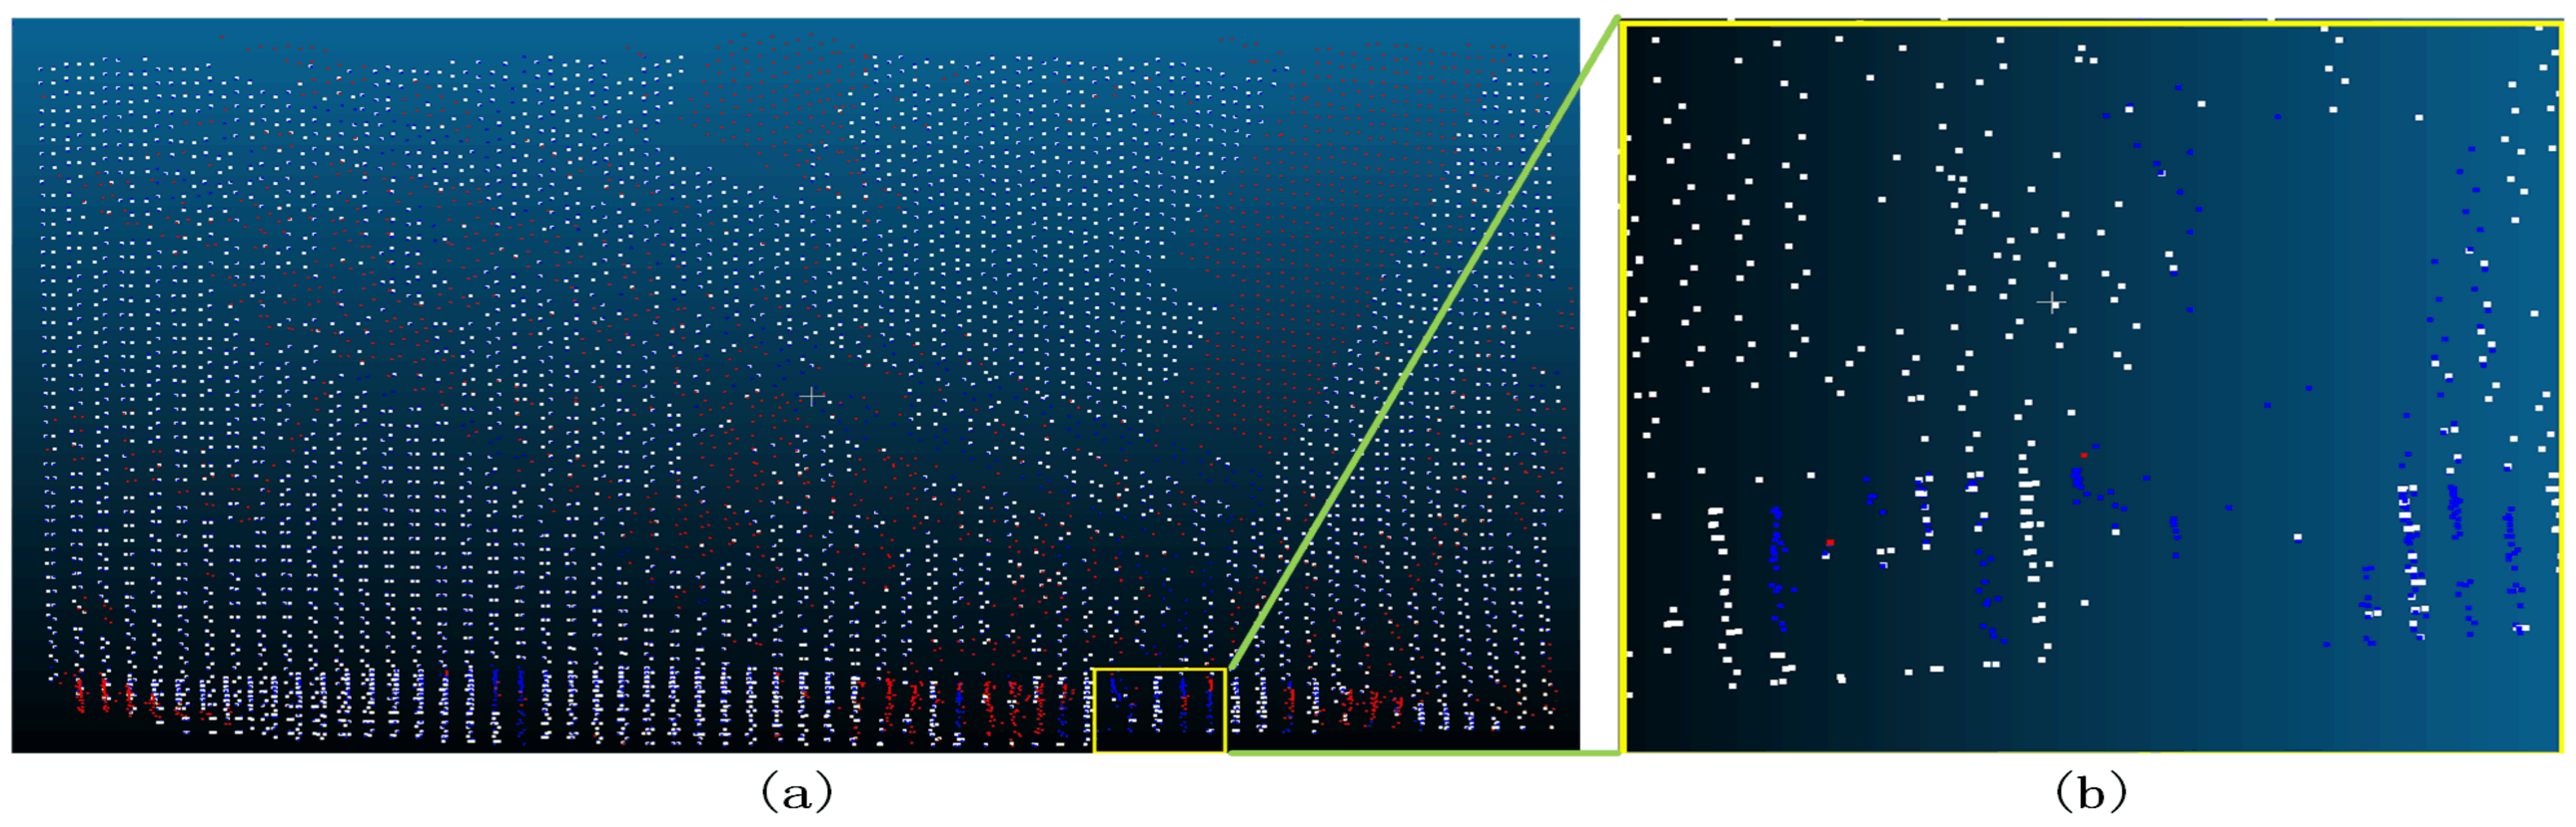
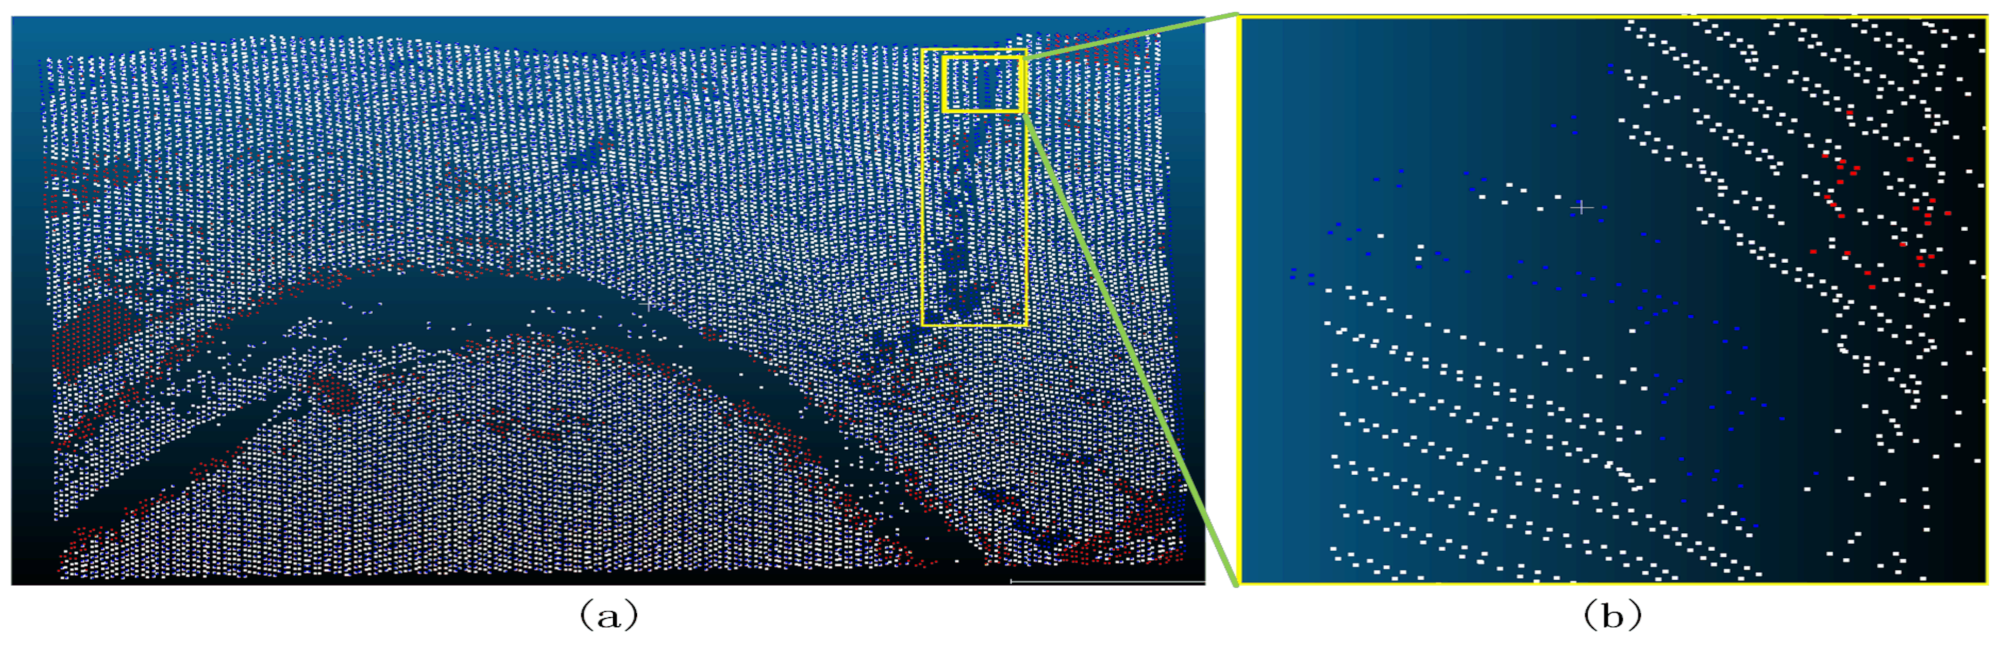
Figure 27.
Sample 2-2 after the filter ((a) represents the overview of the filtering effect; the red dot in a indicates that the original data is not ground point; the blue dot indicates ground point; and the white dot indicates the remaining point after filtering as ground point; (b) represents the poor filtering effect; the red dot indicates Type II error; the blue dot indicates Type I error; and the white dot indicates the correct point).
Figure 28.
Sample 2-3 after the filter ((a) represents the overview of the filtering effect; the red dot in a indicates that the original data is not ground point; the blue dot indicates ground point; and the white dot indicates the remaining point after filtering as ground point; (b) represents the poor filtering effect; the red dot indicates Type II error; the blue dot indicates Type I error; and the white dot indicates the correct point).
Figure 29.
Sample 2-4 after the filter ((a) represents the overview of the filtering effect; the red dot in a indicates that the original data is not ground point; the blue dot indicates ground point; and the white dot indicates the remaining point after filtering as ground point; (b) represents the poor filtering effect; the red dot indicates Type II error; the blue dot indicates Type I error; and the white dot indicates the correct point).
Figure 30.
Sample 3-1 after the filter ((a) represents the overview of the filtering effect; the red dot in a indicates that the original data is not ground point; the blue dot indicates ground point; and the white dot indicates the remaining point after filtering as ground point; (b) represents the poor filtering effect; the red dot indicates Type II error; the blue dot indicates Type I error; and the white dot indicates the correct point).
Figure 31.
Sample 4-1 after the filter ((a) represents the overview of the filtering effect; the red dot in a indicates that the original data is not ground point; the blue dot indicates ground point; and the white dot indicates the remaining point after filtering as ground point; (b) represents the poor filtering effect; the red dot indicates Type II error; the blue dot indicates Type I error; and the white dot indicates the correct point).
Figure 32.
Sample 4-2 after the filter ((a) represents the overview of the filtering effect; the red dot in a indicates that the original data is not ground point; the blue dot indicates ground point; and the white dot indicates the remaining point after filtering as ground point; (b) represents the poor filtering effect; the red dot indicates Type II error; the blue dot indicates Type I error; and the white dot indicates the correct point).
Figure 33.
Sample 5-1 after the filter ((a) represents the overview of the filtering effect; the red dot in a indicates that the original data is not ground point; the blue dot indicates ground point; and the white dot indicates the remaining point after filtering as ground point; (b) represents the poor filtering effect; the red dot indicates Type II error; the blue dot indicates Type I error; and the white dot indicates the correct point).
Figure 34.
Sample 5-2 after filtering ((a) represents the overview of the filtering effect; the red dot in a indicates that the original data is not ground point; the blue dot indicates ground point; and the white dot indicates the remaining point after filtering as ground point; (b) represents the poor filtering effect; the red dot indicates Type II error; the blue dot indicates Type I error; and the white dot indicates the correct point).
Figure 35.
Sample 5-3 after the filter ((a) represents the overview of the filtering effect; the red dot in a indicates that the original data is not ground point; the blue dot indicates ground point; and the white dot indicates the remaining point after filtering as ground point; (b) represents the poor filtering effect; the red dot indicates Type II error; the blue dot indicates Type I error; and the white dot indicates the correct point).
Figure 36.
Sample 5-4 after the filter ((a) represents the overview of the filtering effect; the red dot in a indicates that the original data is not ground point; the blue dot indicates ground point; and the white dot indicates the remaining point after filtering as ground point; (b) represents the poor filtering effect; the red dot indicates Type II error; the blue dot indicates Type I error; and the white dot indicates the correct point).
Figure 37.
Sample 6-1 after the filter ((a) represents the overview of the filtering effect; the red dot in a indicates that the original data is not ground point; the blue dot indicates ground point; and the white dot indicates the remaining point after filtering as ground point; (b) represents the poor filtering effect; the red dot indicates Type II error; the blue dot indicates Type I error; and the white dot indicates the correct point).
Figure 38.
Sample 7-1 after the filter ((a) represents the overview of the filtering effect; the red dot in a indicates that the original data is not ground point; the blue dot indicates ground point; and the white dot indicates the remaining point after filtering as ground point; (b) represents the poor filtering effect; the red dot indicates Type II error; the blue dot indicates Type I error; and the white dot indicates the correct point).
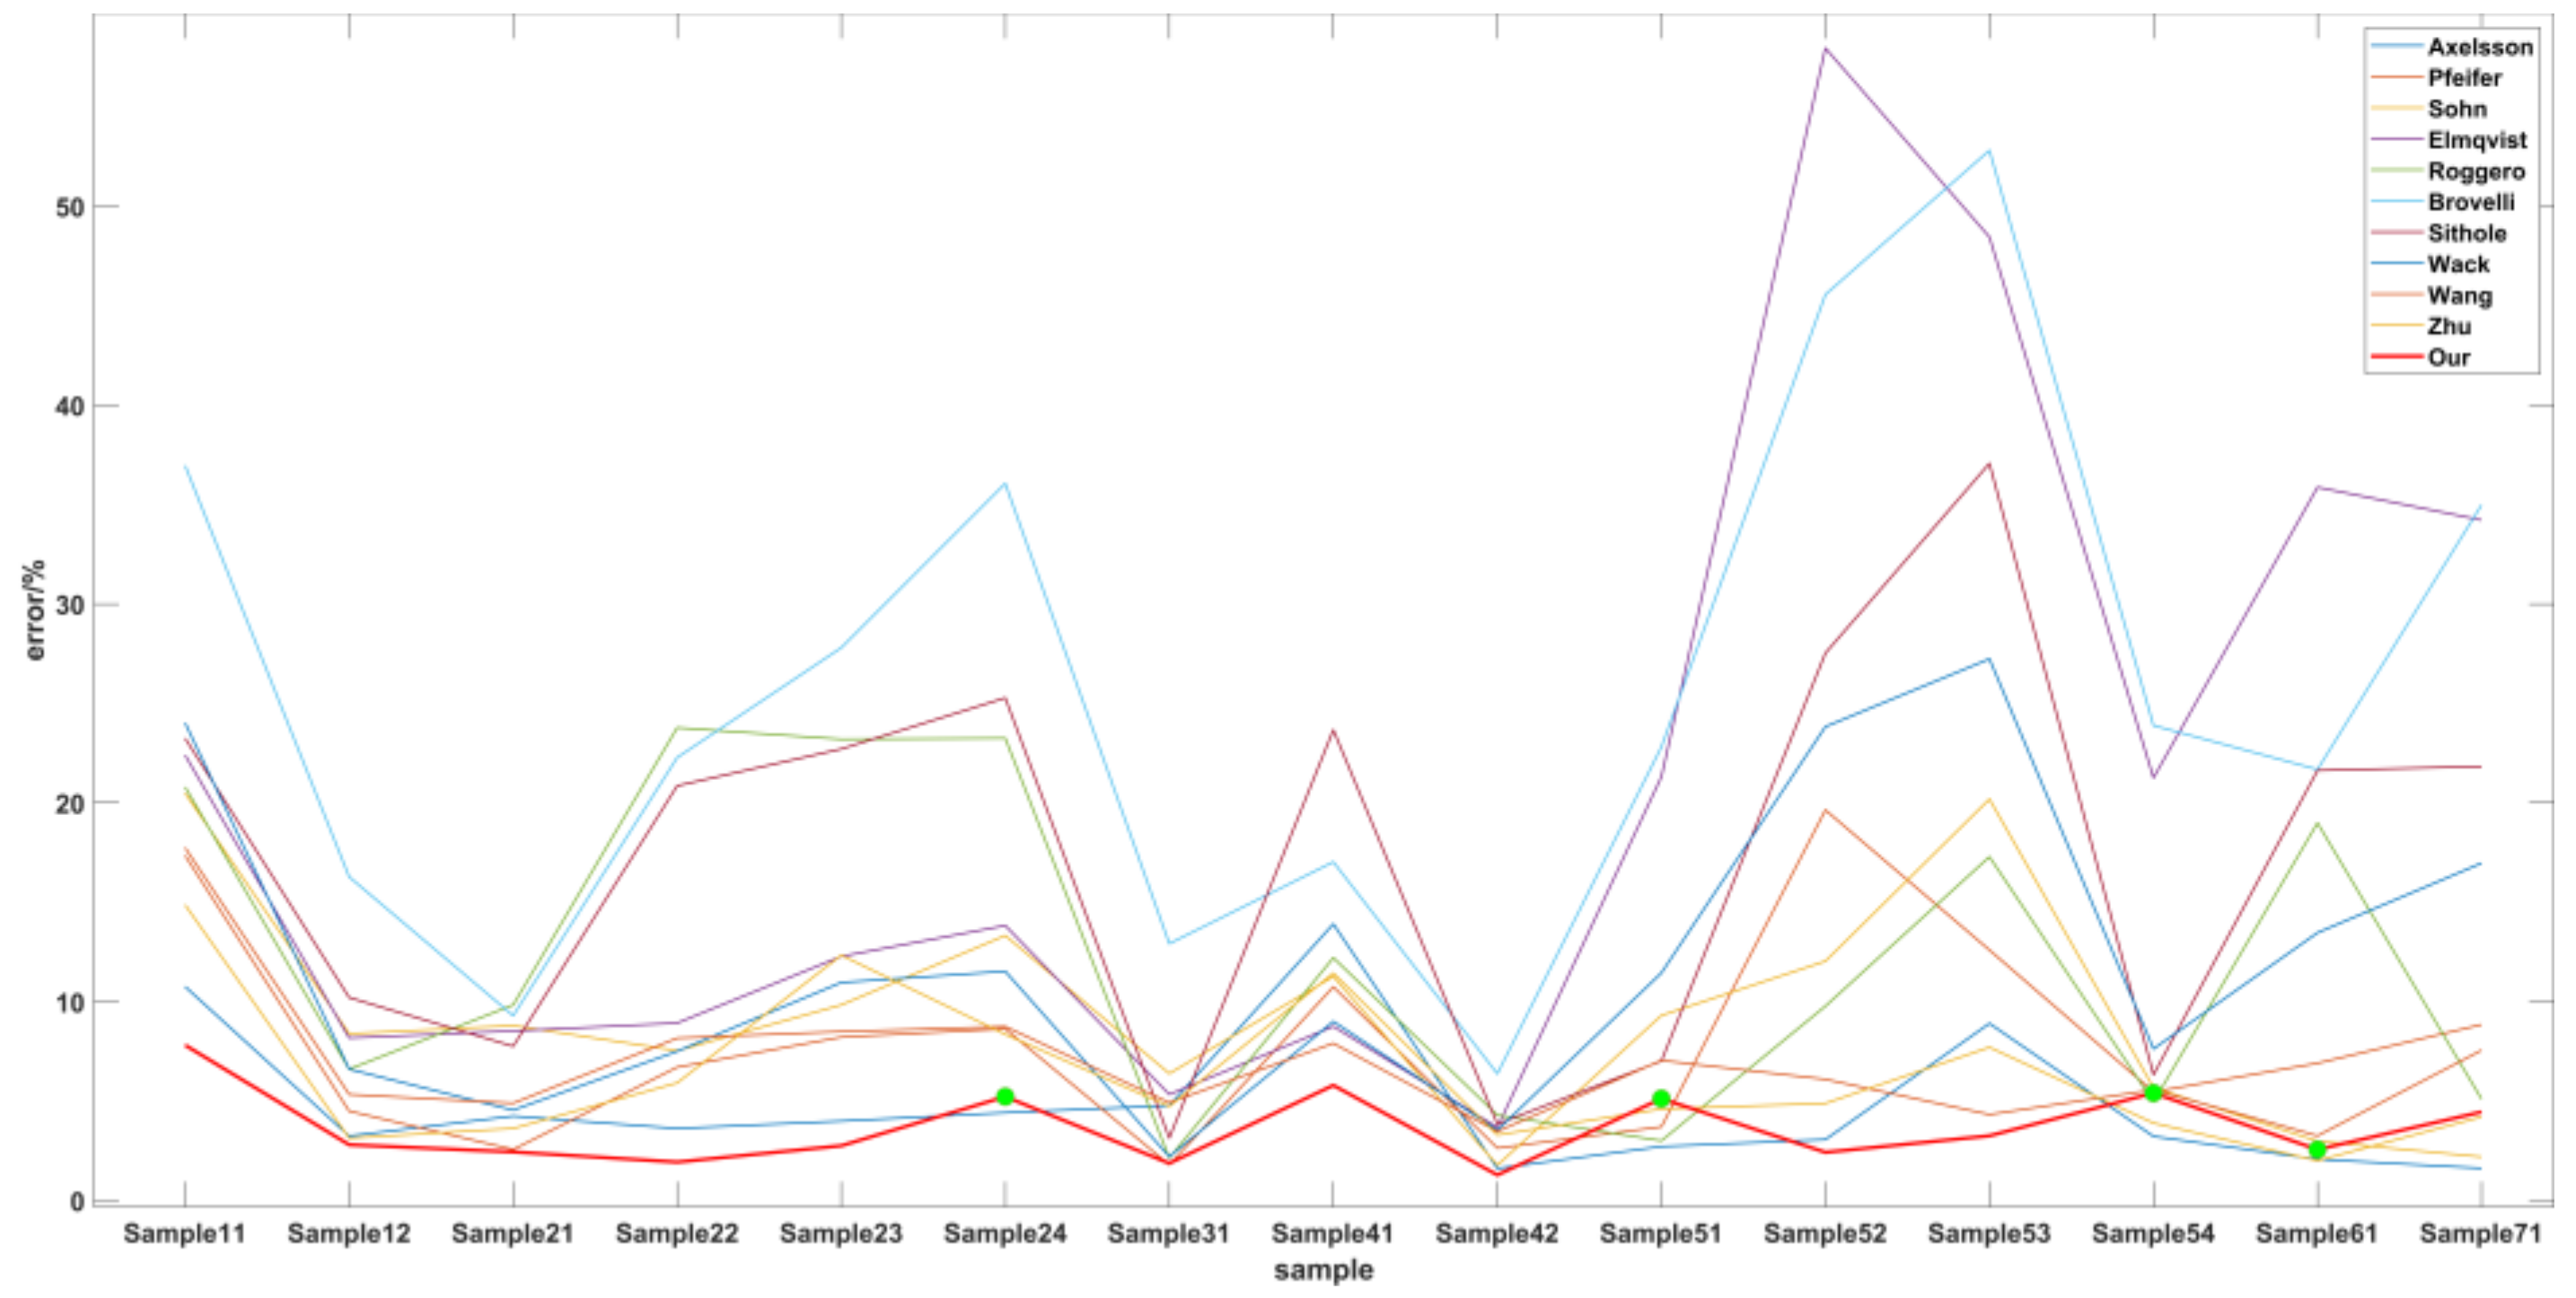
Figure 39.
The error of different methods in each sample.
Figure 39.
The error of different methods in each sample.
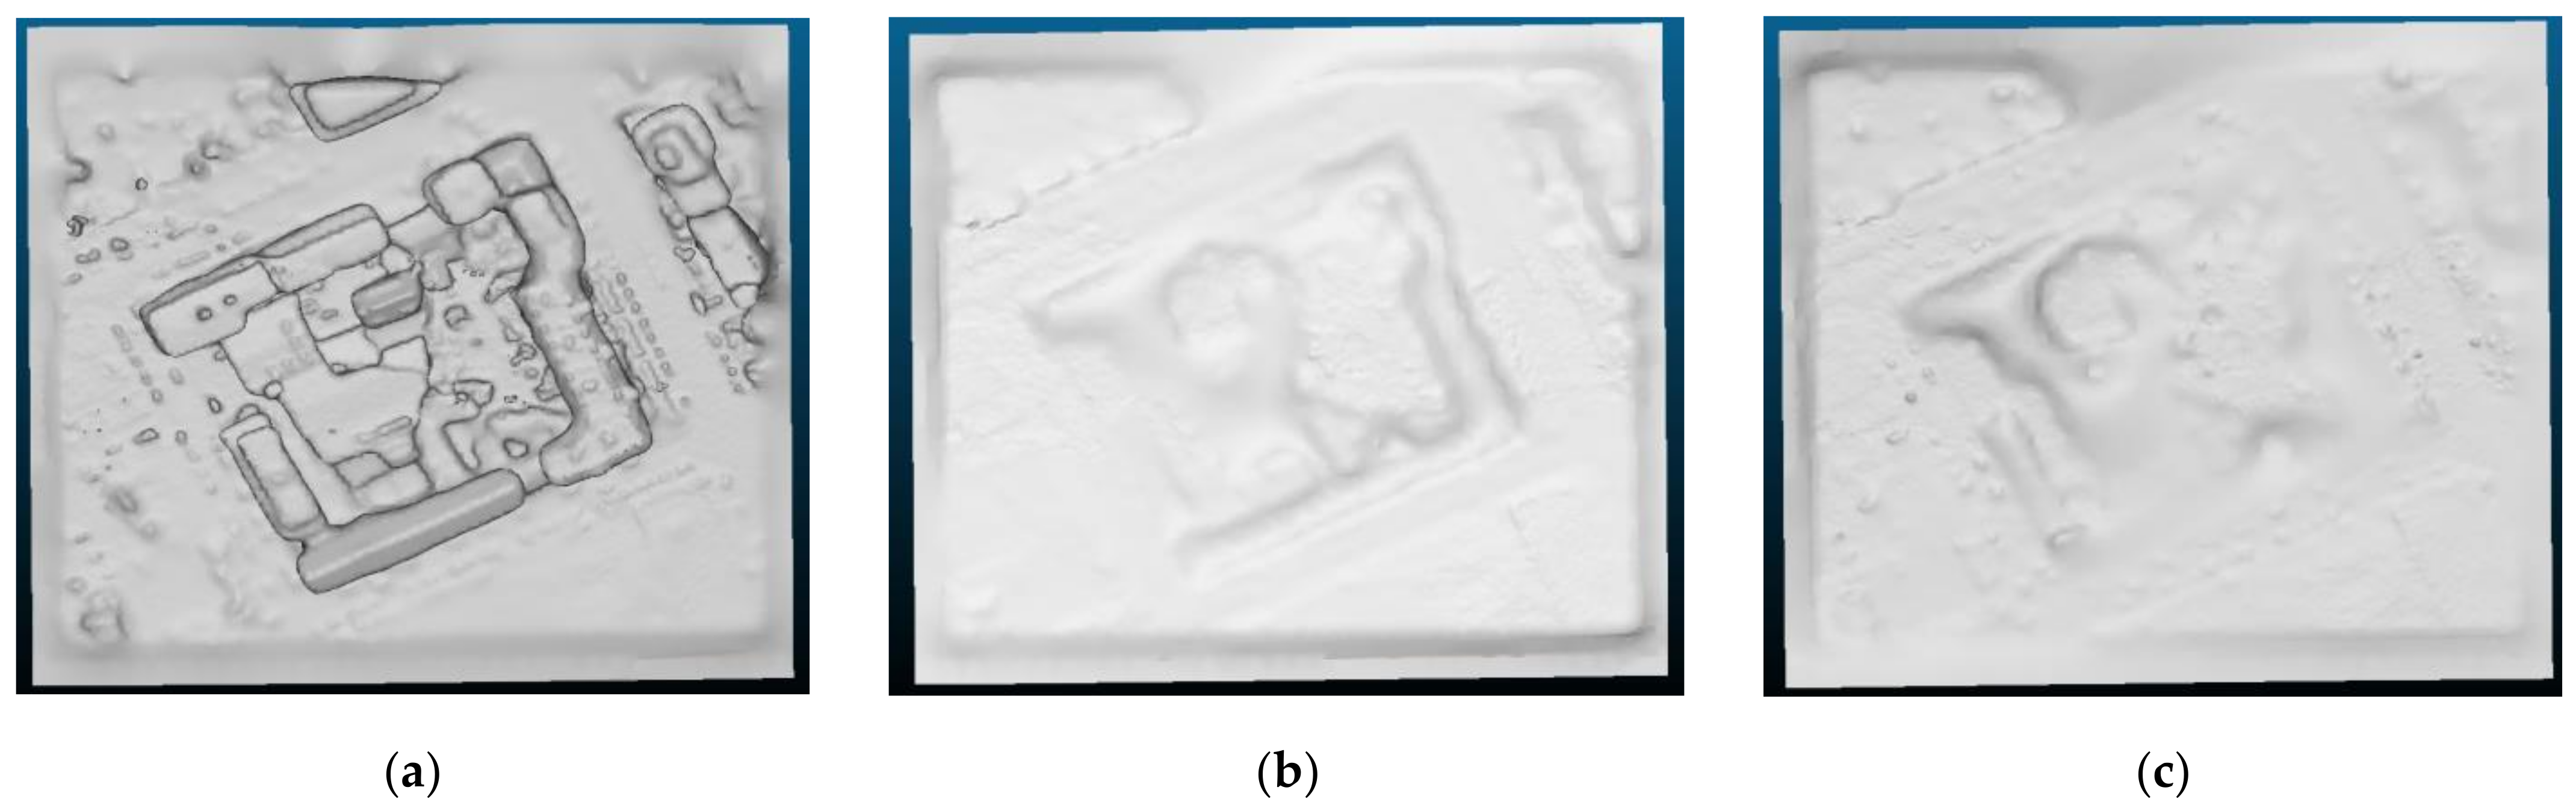
Figure 40.
Sample 3-1 surface reconstruction ((a) represents the original point cloud to construct the surface model; (b) represents the original ground point cloud to construct the surface model; (c) represents the filtered ground point to construct the surface model).
Figure 40.
Sample 3-1 surface reconstruction ((a) represents the original point cloud to construct the surface model; (b) represents the original ground point cloud to construct the surface model; (c) represents the filtered ground point to construct the surface model).
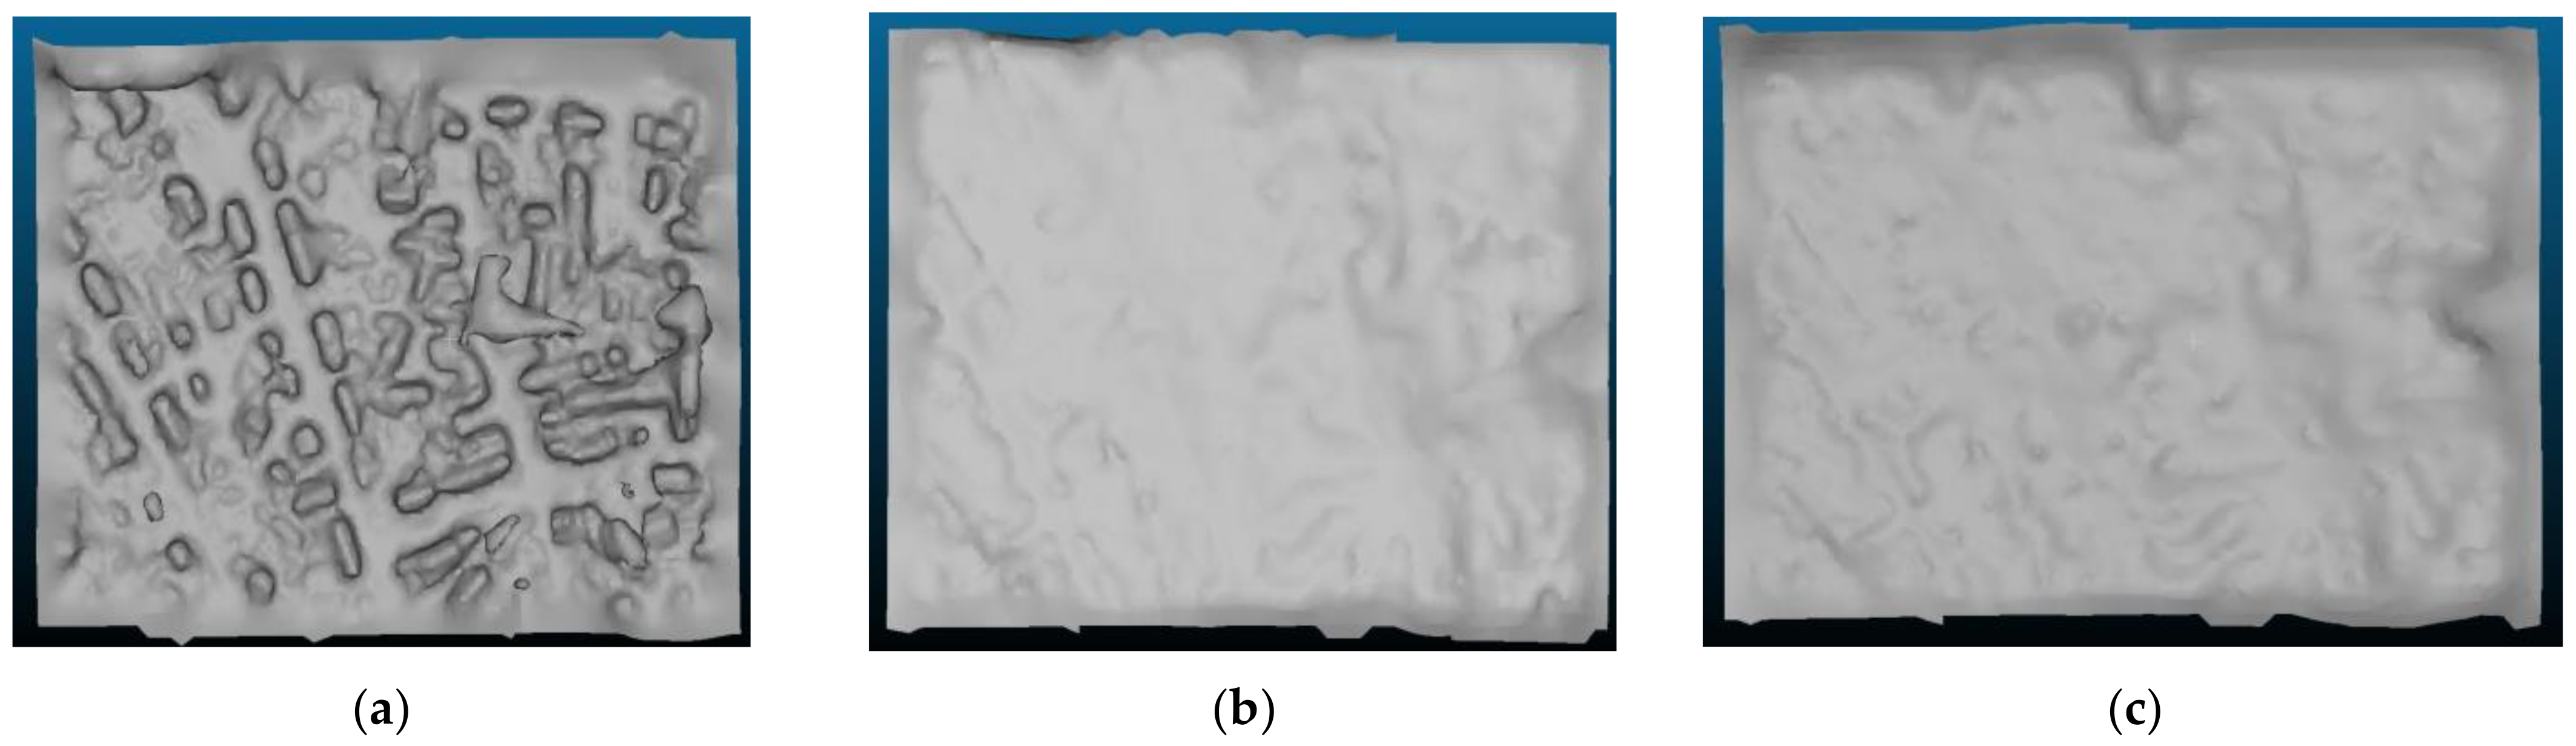
Figure 41.
Sample 5-4 surface reconstruction ((a) represents the original point cloud to construct the surface model; (b) represents the original ground point cloud to construct the surface model; (c) represents the filtered ground point to construct the surface model).
Figure 41.
Sample 5-4 surface reconstruction ((a) represents the original point cloud to construct the surface model; (b) represents the original ground point cloud to construct the surface model; (c) represents the filtered ground point to construct the surface model).
Table 1.
Filter Error Definition.
Table 1.
Filter Error Definition.
| Reference Data | Filtered Data | Reference Data |
|---|
| The Point of Ground | The Point of Non-Ground |
|---|
| The point of ground | a | b | e = a + b |
| The point of non-ground | c | d | f = c + d |
| The point after filter | g = a + c | h = b + d | n = a + b + c + d |
Table 2.
Three error types within the different methods (%).
Table 2.
Three error types within the different methods (%).
| Filter Approach | Type I Error | Type II Error | Total Error |
|---|
| EMD Filter [22] | 3.5 | 33.2 | 15.4 |
| SMRF Filter [23] | 2.4 | 35.4 | 15.8 |
| Segmentation-Based Filtering [5] | 1.66 | 1.64 | 1.65 |
| Slope Filter [7] | 8.5 | 23.8 | 14.7 |
| Cloth Simulation Filter [6] | 4.57 | 2.61 | 3.77 |
| Our | 0.76 | 0.39 | 0.55 |
Table 3.
Three error types within the different samples (%).
Table 3.
Three error types within the different samples (%).
| Sample | Type I Error | Type II Error | Total Error |
|---|
| 1-1 | 10.76 | 3.86 | 7.82 |
| 1-2 | 4.68 | 2.32 | 2.81 |
| 2-1 | 2.70 | 1.57 | 2.45 |
| 2-2 | 2.10 | 0.72 | 1.94 |
| 2-3 | 3.32 | 2.14 | 2.76 |
| 2-4 | 5.26 | 5.15 | 5.23 |
| 3-1 | 1.90 | 1.87 | 1.88 |
| 4-1 | 10.64 | 0.98 | 5.80 |
| 4-2 | 3.76 | 0.26 | 1.29 |
| 5-1 | 5.74 | 2.93 | 5.13 |
| 5-2 | 2.14 | 4.91 | 2.43 |
| 5-3 | 2.41 | 23.47 | 3.26 |
| 5-4 | 5.72 | 5.15 | 5.41 |
| 6-1 | 1.05 | 31.76 | 2.57 |
| 7-1 | 1.77 | 25.59 | 4.46 |
| average | 4.26 | 7.51 | 3.68 |
Table 4.
The total error of the different methods (%).
Table 4.
The total error of the different methods (%).
| Site | Sample | Axelsson
[5] | Pfeifer
[24] | Sohn
[25] | Elmqvist
[26] | Roggero
[27] | Brovelli
[28] | Sithole
[2] | Wack
[29] | Wang
[9] | Zhu
[8] | Our |
|---|
| Urban | 1-1 | 10.76 | 17.35 | 20.49 | 22.40 | 20.80 | 36.96 | 23.25 | 24.02 | 17.74 | 14.87 | 7.82 |
| 1-2 | 3.25 | 4.50 | 8.39 | 8.18 | 6.61 | 16.28 | 10.21 | 6.61 | 5.34 | 3.14 | 2.81 |
| 2-1 | 4.25 | 2.57 | 8.8 | 8.53 | 9.84 | 9.30 | 7.76 | 4.55 | 4.90 | 3.63 | 2.45 |
| 2-2 | 3.63 | 6.71 | 7.54 | 8.93 | 23.78 | 22.28 | 20.86 | 7.51 | 8.17 | 5.92 | 1.94 |
| 2-3 | 4.00 | 8.22 | 9.84 | 12.28 | 23.20 | 27.80 | 22.71 | 10.97 | 8.50 | 12.34 | 2.76 |
| 2-4 | 4.42 | 8.64 | 13.33 | 13.83 | 23.25 | 36.06 | 25.28 | 11.53 | 8.75 | 8.36 | 5.23 |
| 3-1 | 4.78 | 1.80 | 6.39 | 5.34 | 2.14 | 12.92 | 3.15 | 2.21 | 4.93 | 4.74 | 1.88 |
| 4-1 | 13.91 | 10.75 | 11.27 | 8.76 | 12.21 | 17.03 | 23.67 | 9.01 | 7.91 | 11.44 | 5.80 |
| 4-2 | 1.62 | 2.64 | 1.78 | 3.68 | 4.30 | 6.38 | 3.85 | 3.54 | 3.48 | 3.30 | 1.29 |
| Rural | 5-1 | 2.72 | 3.71 | 9.31 | 21.31 | 3.01 | 22.81 | 7.02 | 11.45 | 7.05 | 4.61 | 5.13 |
| 5-2 | 3.07 | 19.64 | 12.04 | 57.95 | 9.78 | 45.56 | 27.53 | 23.83 | 6.10 | 4.89 | 2.43 |
| 5-3 | 8.91 | 12.60 | 20.19 | 48.45 | 17.29 | 52.81 | 37.07 | 27.24 | 4.33 | 7.71 | 3.26 |
| 5-4 | 3.23 | 5.47 | 5.68 | 21.26 | 4.96 | 23.89 | 6.33 | 7.63 | 5.57 | 3.90 | 5.41 |
| 6-1 | 2.08 | 6.91 | 2.99 | 35.87 | 18.99 | 21.68 | 21.63 | 13.47 | 3.26 | 2.01 | 2.57 |
| 7-1 | 1.63 | 8.85 | 2.20 | 34.22 | 5.11 | 34.98 | 21.83 | 16.97 | 7.56 | 4.21 | 4.46 |
| average | 4.82 | 8.02 | 9.35 | 20.73 | 12.34 | 25.78 | 17.48 | 12.04 | 6.91 | 6.34 | 3.68 |


