Communication

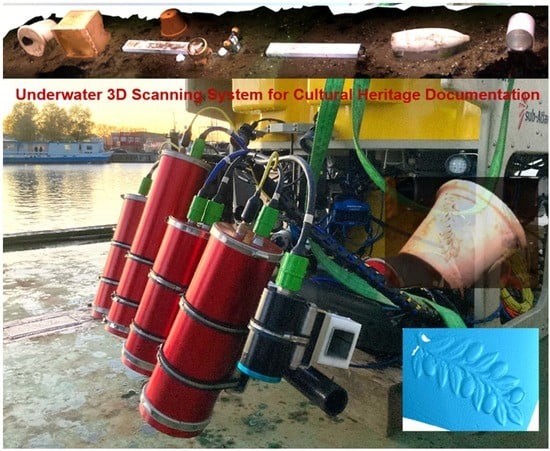
Underwater 3D Scanning System for Cultural Heritage Documentation

1
Fraunhofer Institute for Applied Optics and Precision Engineering, Albert-Einstein-Str. 7, 07745 Jena, Germany
2
Robotics and Telematics Department of Computer Science, Julius-Maximilian University Würzburg, Sanderring 2, 97070 Würzburg, Germany
3
Machine Engineering Faculty, Technical University Ilmenau, Ehrenbergstraße 29, 98693 Ilmenau, Germany
*
Author to whom correspondence should be addressed.
Remote Sens. 2023, 15(7), 1864; https://doi.org/10.3390/rs15071864
Submission received: 6 March 2023 / Revised: 28 March 2023 / Accepted: 30 March 2023 / Published: 31 March 2023

Abstract

:
Three-dimensional capturing of underwater archeological sites or sunken shipwrecks can support important documentation purposes. In this study, a novel 3D scanning system based on structured illumination is introduced, which supports cultural heritage documentation and measurement tasks in underwater environments. The newly developed system consists of two monochrome measurement cameras, a projection unit that produces aperiodic sinusoidal fringe patterns, two flashlights, a color camera, an inertial measurement unit (IMU), and an electronic control box. The opportunities and limitations of the measurement principles of the 3D scanning system are discussed and compared to other 3D recording methods such as laser scanning, ultrasound, and photogrammetry, in the context of underwater applications. Some possible operational scenarios concerning cultural heritage documentation are introduced and discussed. A report on application activities in water basins and offshore environments including measurement examples and results of the accuracy measurements is given. The study shows that the new 3D scanning system can be used for both the topographic documentation of underwater sites and to generate detailed true-scale 3D models including the texture and color information of objects that must remain under water.

Graphical Abstract

1. Introduction

Cultural heritage documentation and the monitoring of underwater objects and sites is increasingly a task of archeologists and researchers. Recent technical developments have expanded the available tools and measurement principles for the three-dimensional capture of certain objects and scenes.
Highly resolved 3D data significantly expand the information of the objects obtained only through photographs and make possible the accurate determinations of sizes, measurements, and distances.
Examples of underwater sites of historical or cultural interest with the goal of documentation and collection of geometric information are sunken shipwrecks, submerged human settlements, and caves.
An extensive overview of applications, reconstruction methods, sensing technologies, and geomatic techniques for underwater cultural heritage documentation and archeological site reconnaissance is given by Menna et al. [1]. In this paper, the authors provide a framework for planning reconnaissance campaigns for underwater cultural heritage recording and documentation such as the reconstruction of submerged structures, seafloor map**, wreck exploration, or the 3D view generation of archeological sites.
One of the standard tasks of underwater archeology is the reconnaissance of submerged sites in shallow water [2]. Typically, map** of the site is the main goal of such reconnaissance processes. Georgopoulos and Agrafiotis [3] introduced a photogrammetric technique for the documentation of a submerged monument leading to metric information in two dimensions.
Roman et al. [4] presented structured light imaging using laser imaging in comparison to the multibeam sonar technique and passive stereo reconstruction for map** tasks of underwater archeological sites including shipwrecks and objects such as amphoras.
Eric et al. [5] compared different techniques, namely, photogrammetry and the structured light technique for the documentation of underwater heritage sites.
Drap [6] introduced underwater photogrammetry for archeology and provided examples of the 3D reconstruction of wrecks and the documentation of sites. The 3D reconstruction of amphoras is supported by geometrical primitives. Canciani et al. [7] documented the use of low-cost digital photogrammetry for the documentation of archeological sites including object fragments.
Bathymetric techniques for the 3D reconstruction of archeological sites were introduced by Passaro et al. [8], Giordano et al. [9], and Roman et al. [4].
Campbell [10] introduced archeology in underwater caves with the focus on the description of several types of caves, the history of exploration, and significance for human culture.
Argyropulos and Stratigea [11] reported on many legacies of World Wars I and II such as shipwrecks, submerged aircraft, and war artifacts in the Mediterranean, which are considered as underwater cultural heritage. Their first projects, with the goal of 3D reconstruction of sunken shipwrecks, used photogrammetry for metric reconstruction [12]. Other shipwreck documentations have been provided by Balletti et al. [13], Zhukovsky et al. [14], and Grzadziel [15].
When underwater objects have been completely captured by 2D imaging and 3D surface reconstruction, representation and dissemination is an important task. Cejka et al. [16] introduced an augmented reality guide for underwater cultural heritage sites. Gambin et al. [17] generated an interesting virtual museum based on the 3D reconstruction data of Maltese shipwrecks.
The documentation of submerged cultural heritage objects often requires three-dimensional capturing of the surface of these objects. The goal of solving such tasks is to be fast, accurate, effective, and robust. According to the specific task and environmental conditions, the most suitable and effective scanning system should be chosen.
Recently, the progress of technical developments has led to the construction of new scanning systems based on diverse sensing principles.
Several techniques and measurement principles exist that allow for the acquisition of the 3D data of sites and objects in underwater environments, for example, techniques using sonar systems, laser scanning, time-of-flight (ToF) cameras, and photogrammetry.
Sonar systems [18,19,20,21] can provide fast measurements of large areas over long distances, providing a relatively low measurement accuracy. A similar accuracy can be obtained by ToF-based systems. Here, the company 3D at Depth [22] offers a commercially available system. Synthetic aperture sonar (SAS), as an extension of sonar imaging, provides improved spatial resolution [23,24,25]. If underwater SAS images are used for 3D reconstruction, this technique seems to be suitable for cultural heritage documentation and 3D measurements. Underwater gas pipeline leaks have been successfully detected using the SAS technique [25].
Fast acquisition, long ranges, high measurement accuracy, and robustness against water turbidity can be obtained using laser scanning systems [26,27,28,29], which allow for data recording in motion. A big challenge of laser systems is the precise 3D registration and merging of individual consecutive 3D scans. The potential accuracy of photogrammetric measurements cannot be obtained by laser systems. However, newly developed commercial sensor systems (e.g., by CathXOcean [30] and Voyis [31]) can achieve an increased accuracy of the generated 3D models.
High-accuracy photogrammetry requires either well-textured objects, support for structured illumination, or a preparation effort comprising the placement of markers. Appropriate systems have been published by several authors [6,7,32,33,34,35,36]. New developments have provided systems based on video streams that allow for data to be captured for 3D reconstruction in motion (e.g., by Beall [37]). A plenoptic camera solution was provided by Skinner [38]. A novel commercial photogrammetric underwater scanner was offered by Vaarst [39] that also processes video streams.
The suitability of 3D scanners based on structured extensive illumination for underwater applications has been examined in several research projects. As a result, it can be stated that the principle of structured illumination is suitable for a detailed 3D reconstruction of small objects at short distances. Experimental setup systems have been introduced by Bruno et al. [40], Bianco et al. [41], and Bräuer-Burchardt et al. [42].

2. Materials and Methods

2.1. Underwater Cultural Heritage Documentation

The documentation of submerged cultural sites and objects has two main requirements. The first demand is the generation of a map of the site and the second task is the production of detailed models of certain objects or parts of objects. The balance between these two aspects may be even or not, depending on the conditions of the specific site. Our new scanning system, for example, provides the possibility of 3D reconstruction of the whole area where the color camera, as part of the system, records images with sufficient object structure for 3D reconstruction using visual odometry [43]. As the result of the process of simultaneous localization and map** (SLAM), a map of a certain seafloor region will be generated and stored [44]. Additionally, certain objects of particular interest can be scanned three-dimensionally with high detail resolution and measurement accuracy.

2.2. Hardware Setup

For the production of a 3D model, a 3D sensor system can be used that was initially developed to perform inspection tasks at industrial underwater facilities such as pipelines, offshore wind turbine foundations and other structures, or to detect damage to anchor chains [45]. However, because of the properties of this system, it is also suitable to produce maps of the scanned underwater environment.
The 3D scanning system must be mounted on a work-class ROV (remotely operating vehicle) and can be used up to 1000 m in depth. The main part of the system is an optical 3D stereo scanner based on structured illumination, consisting of two monochrome cameras and a projection unit producing aperiodic sinusoidal fringe patterns using a GoBo [46] wheel. This part is the main component tasked with generating a detailed 3D model of the object’s surface. Additionally, two flashlights, a color camera, an inertial measurement unit (IMU), and an electronic control unit complete the underwater sensor system UWS (see Figure 1). The color camera is used for navigation, gives detailed information of the surface of the scanned object, and provides the input data for the rough photogrammetric reconstruction of the site. The dimensions of the system are approximately 1.2 m × 0.7 m × 0.5 m with a weight of 65 kg.
The system was realized in two arrangements of the same hardware components to have different measurement distances and different sizes of the measurement volume. The first system design (S1) had a standard measurement distance of 2 m ± 0.5 m and the second one (S2) of 1.3 m ± 0.5 m. Sensor S1 had a field of view of approximately 0.9 m × 0.8 m (at 2.0 m distance) and S2 of 0.7 m × 0.6 m (at 1.3 m distance). The standard spatial resolution was between 0.8 and 1.0 mm, but this can be changed to 0.4 to 0.5 mm.

2.3. Scanning and Measurement Principles

The sensor system consisted of several components providing different single sensors. The first sensor unit was the optical stereo sensor based on structured illumination. Two monochrome measurement cameras, together with the projection unit, deliver 3D point clouds as a representation of the captured object surface. The second sensor unit is the color camera, which can also produce 3D point data by connecting consecutive images and estimated camera poses. The inertial measurement unit (IMU) can support these 3D data and make the calculation faster and the results more accurate. This principle is also known as visual odometry [43].

2.3.1. Stereo Camera and Structured Illumination

Structured illumination is a common technique for achieving accurate photogrammetric stereo 3D reconstruction using a stereo camera setup, particularly for large homogeneous surfaces of the object being measured.
The measurement scene is observed by a calibrated stereo camera. Corresponding points are found by searching the corresponding grey value profiles in short temporal sequences. In order to minimize the effort of correspondence search, epipolar geometry [47] is commonly used. However, in the underwater case, epipolar lines are typically deformed to curves due to refraction effects. However, the approximation by straight lines is possible if the expected error is small. This can be predicted by preliminary calculations using certain parameters (such as port glass material and thickness, distance of the camera to the port glass, intrinsic camera parameters) of the system (see [48]).
In some cases, pinhole modeling can be used for 3D reconstruction using the common triangulation principle [47]. The general case of 3D reconstruction using vision ray intersection has been thoroughly studied [48,49].

2.3.2. Visual Odometry and IMU

The principle of visual odometry [43] is applied to obtain a fast estimation of the trajectory of the sensor system using the IMU. This happens independently from the 3D data calculation. The technique is based on VINS-Mono [50] using Harris-feature-detection (also known as the Shi–Tomasi method) for the automatic extraction of image features for visual odometry.
In the beginning, the pose estimation must be initialized, which requires at least three seconds of motion before the method can be used. The sensor must be moved to generate enough parallax for an initial, unscaled, structure-from-motion reconstruction (SfM) of the feature points. Scaling is realized using the recorded IMU data. Once the initialization process is complete, measurement can begin.
The relative orientation between the color camera and IMU is determined in air. The parameters of the camera-IMU-transformation are fixed for underwater use. Typically, no rotations around all sensor axes are produced under water because of the characteristic ROV movements. Hence, the translation between the camera and IMU is inaccurately estimated. A fast initialization of the visual odometry is also possible for approximately linear trajectories if the camera-IMU-transformation is considered as known. The stochastic error parameters can be determined using the function graph of the Allan variance (see [51]) of the IMU data stream over several hours. However, this is not used for a complete model of noise behavior and measurement uncertainty, but for the estimation of the weights of the camera vs. the IMU-based motion estimation.
The time delay between the camera recordings and IMU data is constantly estimated because no common time trigger process is implemented. The relative motion is calculated by equalization of the visual and the IMU data in a local environment. Optimization is performed over a consecutive group of keyframes, which are selected according to a threshold onto the average parallax of the feature points. It should be noted that this step does not contain re-localization or the closing of loops according to visual features. The goal is to obtain a continual trajectory without jumps because visual odometry should also be used for local motion compensation. A possible drift caused by remaining errors will be corrected later within the 3D registration process.

2.3.3. Color Map** onto 3D Data

Whereas color information is already included in the 3D model in case of model production by the color camera, it must be added to the 3D model obtained from the stereo data. To realize this, the color camera position and orientation was calibrated according to the stereo camera.
This was realized within the calibration procedure of the stereo camera (see Section 2.4).
For inclusion of the color information into the 3D model, every 3D model point is mapped onto one point in a corresponding color image. Finding this correspondence means the back projection of a 3D model point onto the image plane of the color camera using the time-closest color image recording according to the time stamp of the 3D point.

2.4. Calibration and Error Estimation

2.4.1. Camera Calibration

Camera calibration for underwater 3D reconstruction tasks is a challenging assignment because of the necessity of considering the refraction and camera model adjustment. Consequently, much work has been performed on this matter (e.g., by Shortis [52]).
Stereo camera calibration was performed using extended pinhole modeling (see [49]) with ArUco [53] marker and circle pattern boards (see Figure 1) as the calibration patterns. Initially, it had a priori air calibration according to the applied extended camera model. Hence, the complete system was initially calibrated in air using the same calibration patterns. Considering the refraction effects, the air focus was set to three quarters of the underwater focus distance. The air calibration parameters were transformed to an underwater calibration parameter set according to the technique described in [48]. For evaluation and comparison, the calibration parameter set obtained by this procedure was used for the measurements as well as the parameters obtained by the underwater calibration procedure described in the next paragraph.
The underwater calibration procedure was developed specifically for the application of our 3D scanning system. The sensor system was moved slowly along the marker boards and recorded images in a water environment. Cameras made between ten and twelve recordings of the calibration patterns from different positions and varying viewing angles. Certain common calibration points were automatically selected and provided as input to the commercially available BINGO software [54].
The first evaluation measurements showed that a priori calibration in air is only possible under certain preconditions (see [49]). In particular, the perpendicular alignment between the optical axis of the lens and the port glass surface is necessary for the exact knowledge of the tilt angle. As we previously reported, deviation from orthogonality of less than half a degree already disturbs the calculated set of calibration parameters significantly. If orthogonality cannot be guaranteed, calibration in water seems necessary.
Color camera calibration was performed in relation to the stereo camera simultaneously by also using the same calibration patterns and BINGO software.

2.4.2. Estimation of Systematic Measurement Errors

Deviations in the actual physical arrangement from the selected model (i.e., pinhole model) lead to systematic measurement errors during 3D point calculation. These errors can be estimated a priori using information concerning the actual deviations from pinhole modeling at certain measurement distances and, additionally, should be determined by experiments.
The theoretical calculation of these systematic errors is described in [48,49]. In principle, vision ray modeling is performed considering the complete refraction effects on the one hand, and approximation by the selected (pinhole) model on the other hand, for both cameras of the stereo rig. A raster is put over the whole measurement volume. At each raster point, the expected difference in 3D point reconstruction between the two models is simulated, which yields the expected value of the systematic 3D measurement error. The simulated error values can be used for the generation of a discrete error function that can also be used for the approximation of a polynomial error function (see [55]), which can be used for compensation of the systematic 3D measurement error.
Experimental determination of the error function can also be performed. However, an effortful experimental design is necessary to obtain a good 3D database for error function estimation from the experimentally obtained 3D error values. A possible procedure using ball-bar measurements in different positions and distances is described in [55].

2.5. Underwater Test Scenarios

After building up the sensor system in the laboratory and performing the first functional tests in air, the system was tested in several water basins and finally offshore in the Baltic Sea. The first tests in water basins with clear freshwater should be regarding the complete functionality (i.e., concerning the water permeability of the underwater housings, power supply, data transfer, and control of the hardware components). After the function tests, calibration was performed, and measurements were conducted on specific test specimens to evaluate the calibration quality and performance of 3D reconstruction in terms of measurement accuracy. Subsequently, the quality of the measurement data was analyzed.
After successful tests in the water basins, the sensor system was applied in an offshore test in the Baltic Sea. The sensor was mounted on a work-class ROV (see Figure 2) with a size of approximately 2.1 × 1.3 × 1.25 m³ (length × width × height) with a weight of 1.130 kg. The ROV was controlled from a vessel. Specific test objects were placed on the seabed at a depth of approximately twelve meters.

3. Results

The scanning system was tested in several different experiments to evaluate its features and strength and to assess its suitability for cultural heritage documentation.

3.1. Measurement Accuracy of the Structured Light Scanner

The measurement accuracy has certain aspects that need to be accurately described. When we describe the accuracy of one 3D point, we can distinguish between the systematic and the random component of the measurement error. The systematic part can be divided into a known and an unknown part. The known part can be estimated or determined experimentally and can be compensated using an appropriate correction function. The unknown systematic part cannot be eliminated or corrected. One can assume that this part of the measurement error has no considerable influence on the local results.
Random errors always occur depending on the properties of the hardware components and the environmental conditions. These should be estimated experimentally to provide information about the reliability of a single measurement value.
To estimate the systematic and random measurement errors of the scanner system, several experiments were performed in both clear freshwater in a water basin as well as offshore in seawater. The results of the experiments in the water basin have previously been published [45]. Due to the more difficult conditions concerning the handling of the sensor system under offshore conditions, not all experiments could be equivalently repeated in seawater.
The following experiments were performed:
  • Determination of the length of a calibrated ball-bar, defined as the distance between the sphere center points, depending on the measurement distance in repeated measurements;
  • Determination of the standard deviation of the sphere surface points;
  • Determination of the surface points of a plane normal (1000 mm × 200 mm), evaluation of the flatness of the measured plane surface and the local standard deviation of the sphere surface points.
The results of these measurements were used to estimate systematic and random components of the measurement error occurring under different conditions. Certain selected values of the ball-bar measurements are documented in Table 1.
Error analysis led to the following statements concerning measurement accuracy:
  • Measurements in clear freshwater provide very good accuracy results, comparable to those of 3D scanners for air applications;
  • Measurements in seawater yielded acceptable results (errors obtained were approximately a factor two larger than those obtained from water basin measurements).
The average standard deviation value of the measured 3D points representing the measurement noise was 0.086 mm (n = 20) on the sphere surfaces and 0.080 (average local value) on the normal plane (n = 10). Certain selected values of the ball-bar length measurements representing the distance dependent systematic error and the error of repeated measurements are documented in Table 1. Flatness deviation was below 0.5 mm at the focused measurement distance and below 1.5 mm at the maximum distance. More measurement values are reported in [45].

3.2. Color Camera Reconstruction

Data from the color camera were used for 3D reconstruction in two ways. First, certain parts of the 3D model obtained by the stereo camera were mapped to color camera image points to obtain detailed 3D object information (see examples in Section 3.5). Second, together with the IMU data, a simultaneous localization and map** (SLAM) procedure was applied to generate a map of the complete observed area using visual odometry. Here, good completeness of the scene capturing was obtained, but the metric accuracy could not exactly be determined. However, measurements of four ball-bars of the same length of about 2 m in an area of approximately 10 m × 3 m yielded a standard deviation with the length values of 11 mm, which means a coefficient of variation of about 0.5%.

3.3. Merging of Single Scans

The merging of single scans to a complete 3D model was performed using the IMU data and the single 3D scans obtained by the stereo camera. The quality of the results varies depending on the sensor velocity and the properties of the object surface. Complete 3D models of several objects (e.g., long pipe segments, bomb dummy) were successfully produced using 3D measurement data and color camera images in both the water basin and offshore.

3.4. System Performance

In order to describe the system performance, the main features of the 3D scanning system are given. The system was realized in two arrangements of the same hardware components to have different measurement distances and different sizes of the measurement volume. The first system design (S1) had a standard measurement distance of 2 m ± 0.5 m and the second one (S2) of 1.3 m ± 0.5 m. S1 had a field of view of approximately 0.9 m × 0.8 m (at 2.0 m distance) and S2 of 0.7 m × 0.6 m (at 1.3 m distance). The standard spatial resolution lay between 0.8 and 1.0 mm, but this could be changed to 0.4 to 0.5 mm.
For both systems, three different use-cases were defined with different exposure times for the cameras. The three use cases were designed for ROV velocities of up to 0.2 m/s, 0.5 m/s, and 1.0 m/s. The different use cases provided 3D frame rates of 12.5, 25, and 50 Hz and used exposure times of 2.67, 1.56, and 1.1 milliseconds. The frame rate of the color camera was set uniquely to 25 Hz.
The slowest case provided the best measurement accuracy because motion strongly influences the quality of the recorded images. In order to correct the image interference effects due to sensor motion, an image correction algorithm was developed. It reduced the errors due to motion and provided the best results when the object distance as well as velocity were constant.
The time delay between the image recording and display of the 3D single scan was very short (<0.2 s). The display of the current complete merged 3D model needs a small amount of additional time depending on the 3D data quality.

3.5. Examples of Object Reconstruction

Regarding the tasks of map** the scanned location and capturing details of the scanned objects, examples taken from the offshore dataset are presented in the following.

3.5.1. Site Map**

Site map** was performed offline using the color camera images and the IMU data. The 3D model was generated according to the principle described in Section 2.3.2. Figure 3 shows an example of the reconstructed test area with different test objects. The reconstructed region had a size of approximately 10 m × 1.5 m. The image recording time was about 90 s and the reconstruction time was about five minutes.
Site map** using the sensor data obtained from the stereo cameras was not successful because of the limited field of view and the restricted range of the illumination source. However, high measurement accuracy of the stereo sensor is not necessary to generate the seabed topography and the rough determination of the positions of the object.

3.5.2. Object Reconstruction

Object reconstruction was performed in real-time using the stereo camera images and additionally offline using the color camera images. Figure 4 shows an example of two pottery vessels. Figure 5 shows a reconstructed detail of one of the vessels. Whereas the color camera reconstruction provided a rough surface representation of the obtained 3D data, the structured light sensor achieved good detail resolution.

4. Discussion and Conclusions

In this section, the advantages and disadvantages of the new underwater 3D scanning system, specifically regarding the possibilities of cultural heritage documentation will be discussed.
The system’s required short measurement distance of a maximal 2.5 m is a significant restriction for several applications, as ensuring an approximately constant distance between the sensor and the measurement object is a very challenging task for the ROV pilot. This is no real problem for the homogeneous scanning of objects such as pipeline systems, walls, the hulls of shipwrecks, or a flat seabed. More complex measurement objects must be inspected very carefully and slowly to avoid collisions and equipment damage.
A larger field of view and a longer measurement distance of up to five meters would greatly facilitate the task of the ROV pilot and considerably improve the performance of the system. However, this is difficult to achieve using the proposed technique of structured illumination in the near future.

4.1. Evaluation of the Structured Light Scanner for Cultural Heritage Applications

Structured light-based scanners are widely used in applications in air but rarely in underwater environments. This is mainly due to the restricted sizes of the covered measurement volume, the relatively short object distance required, and the high technical effort for the realization of such systems. However, such scanners may provide very accurate and detailed 3D measurements of certain objects of interest. When an exact 3D measurement is necessary, the structured light principle has considerable advantages over sonar systems, laser scanners, and even passive photogrammetric sensors. Hence, for a very detailed capture of object parts in high resolution, the structured light system is a very powerful tool.

4.2. Potential Application Scenarios

After evaluating the features of the scanners, different scenarios are possible for their application in cultural heritage documentation. The first scenario is the map** of submerged sites on the seafloor, which are not suitable for rescue. Here, a rough 3D model of the complete site can be produced using visual odometry in a short time. The strength of the scanning system allows for map** speeds of approximately 1 m² per second. When necessary, details, for example, at the walls or statues, can be captured simultaneously with high spatial resolution and quality.
The second scenario is in the exploration of underwater caves. Here, the system would allow for a complete 3D reconstruction of the cave. However, it needs to be possible to safely navigate the ROV inside such a cave. Narrow passages of less than 1.5 m width or height prevent the use of the scanner system in caves. The large dimensions of the system considerably limit its potential use in underwater cave exploration and makes a miniaturization of the system desirable. Miniaturization would also enable the use of smaller inspection-class ROVs as the carrier system.
Another application scenario is the documentation of sunken shipwrecks. Here, the requirements regarding accuracy and attention to detail determine the usage of the structured light sensor or data from visual odometry. Both principles may be applied at the same time. Certainly, instead of shipwrecks, other objects of interest such as sunken flying objects can be documented.
The system could be also used for touristic purposes (e.g., for the generation of data for augmented reality systems). Here, 3D data can be collected both underwater and above the water surface, and subsequently combined.

4.3. Suitability of the 3D Scanning System for Cultural Heritage Documentation Tasks

The first offshore application of the system showed the possibilities as well as the limitations for practical use. First, we reiterate the main advantages. The system provides a map** (SLAM) of the observed underwater region in medium quality and simultaneously a very detailed 3D reconstruction of certain objects of interest with high spatial resolution and measurement accuracy. Whereas SLAM can be performed quickly with approximately one square meter per second, an accurate 3D reconstruction of the details of interest requires a greater time effort because a precise navigation of the carrying ROV is necessary. Additionally, a theoretically possible ROV velocity of up to 1 m/s for an accurate 3D reconstruction of the details is only possible under ideal conditions (clear water, constant measurement distance, constant ROV motion in direction and velocity). Hence, further experiences obtained by intensive test measurements are necessary to better assess the possibilities of the system.

4.4. Future Work

The goal for future activities is to generate experimental environments for realistic test scenarios regarding applications in cultural heritage documentation. Such scenarios could more effectively demonstrate the possibilities and limitations of the current scanning system. Additionally, further tests concerning the measurement accuracy, image quality enhancement, 3D model generation, and flooded site reconstruction should be the focus of future work.
The reliability of the sensor system should be examined in muddy water, depending on the level of turbidity. Experiments should also be conducted to evaluate the stability of the ROV (e.g., in underwater currents). Finally, comparisons of our experimental 3D measurement results with other 3D techniques such as photogrammetry, the laser technique, and SAS should be carried out. However, extensive experimental offshore tests using the 3D sensor system are very expensive and require generous funding.
Because of the rare availability and high-operating costs of work-class ROV, which is a requirement to handle our 3D scanning system, a solution regarding a reduction in the size and weight of our system would be desirable. Hence, further development of our system will focus on minimization without a loss in performance. An advanced system ready for mounting on an inspection-class ROV or a diver-held system would be a meaningful challenge for further improvements.
A system with a reduced size and weight would also be better suited for cave exploration or environments with narrow passages such as in shipwrecks.
The effort to bring the system to commercial use would also require another funded project and should include a reduction in the dimensions and weight of the system by a factor of about two.

Author Contributions

Conceptualization: C.B.-B.; Methodology: C.B.-B., C.M. and M.B.; Software: M.H., C.M. and M.B.; Validation: C.B.-B.; Formal analysis: C.B.-B.; Investigation: C.B.-B. and I.G.; Resources: I.G. and M.H.; Data curation: C.B.-B. and M.H.; Writing—original draft preparation: C.B.-B.; Writing—review and editing: C.B.-B., C.M. and M.B.; Visualization: C.B.-B. and C.M.; Supervision: P.K. and G.N.; Project administration: C.B.-B. and P.K. All authors have read and agreed to the published version of the manuscript.

Funding

This research was funded by the German Federal Ministry for Economic Affairs and Energy, grant number 03SX482C.

Institutional Review Board Statement

Not applicable.

Informed Consent Statement

Not applicable.

Data Availability Statement

The data presented in this study are available on request from the corresponding author. The data are not publicly available due to a confidentiality agreement.

Acknowledgments

The authors would like to thank the enterprises SeaRenergy Offshore Holding GmbH and Cie. KG, Oktopus GmbH, and 3++ GmbH, who were involved in the research project and took part in conception, construction, and software development.

Conflicts of Interest

The authors declare no conflict of interest.

References

  1. Menna, F.; Agrafiotis, P.; Georopoulos, A. State of the art and applications in archaeological underwater 3D recording and map**. J. Cult. Herit. 2018, 33, 231–248. [Google Scholar] [CrossRef]
  2. Collin, C.A.; Archambault, P.; Long, B. Map** the shallow water seabed habitat with the SHOALS. IEEE Transa. Geosci. Remote Sens. 2008, 46, 2947–2955. [Google Scholar] [CrossRef]
  3. Georgopoulos, A.; Agrafiotis, P. Documentation of submerged monument using improved two media techniques. In Proceedings of the 2012 18th International Conference on Virtual Systems and Multimedia, Milan, Italy, 2–5 September 2012; pp. 173–180, IEEE 978-1-4673-2565-3/12/. [Google Scholar]
  4. Roman, C.; Inglis, G.; Rutter, J. Application of structured light imaging for high resolution map** of underwater archaeological sites. In Proceedings of the Oceans’10 IEEE Sydney, Sydney, NSW, Australia, 24–27 May 2010; pp. 1–9. [Google Scholar]
  5. Eric, M.; Kovacic, R.; Berginc, G.; Pugelj, M.; Stopinsek, Z.; Solina, F. The impact of the latest 3D technologies on the documentation of underwater heritage sites. In Proceedings of the IEEE Digital Heritage International Congress 2013, Marseille, France, 28 October–1 November 2013; Volume 2, pp. 281–288. [Google Scholar]
  6. Drap, P. Underwater photogrammetry for archaeology. In Special Applications of Photogrammetry; Da Silva, D.C., Ed.; InTech: London, UK, 2012; pp. 111–136. ISBN 978-953-51-0548-0. [Google Scholar]
  7. Canciani, M.; Gambogi, P.; Romano, F.G.; Cannata, G.; Drap, P. Low-cost digital photogrammetry for underwater archaeological site survey and artifact insertion. The case study of the Dolia wreck in secche della Meloria-Livorno-Italia. Int. Arch. Photogramm. Remote Sens. Spat. Inf. Sci. 2003, 34, 95–100. [Google Scholar]
  8. Passaro, S.; Barra, M.; Saggiomo, R.; Di Giacomo, S.; Leotta, A.; Uhlen, H.; Mazzola, S. Multi-resolution morpho-bathymetric survey results at the Pozzuoli–Baiaunderwater archaeological site (Naples, Italy). J. Archaeol. Sci. 2013, 40, 1268–1278. [Google Scholar] [CrossRef]
  9. Giordano, F.; Mattei, G.; Parente, C.; Peluso, F.; Santamaria, R. Integrating sensorsinto a marine drone for bathymetric 3D surveys in shallow waters. Sensors 2015, 16, 41. [Google Scholar] [CrossRef] [PubMed] [Green Version]
  10. Campbell, P.B. An Introduction to Archaeology in Underwater Caves; Highfield Press: Scotland, UK, 2018; pp. 5–26. [Google Scholar]
  11. Argyropoulos, V.; Stratigea, A. Sustainable Management of Underwater Cultural Heritage: The Route from Discovery to Engagement—Open Issues in the Mediterranean. Heritage 2019, 2, 1588–1613. [Google Scholar] [CrossRef] [Green Version]
  12. Korduan, P.; Förster, T.; Obst, R. Unterwasser-Photogrammetrie zur 3D-Rekonstruktion des Schiffswracks “Darßer Kogge”. Photogramm. Fernerkund. Geoinf. 2003, 5, 373–381. [Google Scholar]
  13. Balletti, C.; Beltrane, C.; Costa, E.; Guerr, F.; Vernier, P. Underwater photogrammetry and 3D reconstruction of marble cargos shipwrecks. Int. Arch. Photogramm. Remote Sens. Spat. Inf. Sci. 2015, XL-5/W5, 7–13. [Google Scholar] [CrossRef] [Green Version]
  14. Zhukovsky, M.O.; Kuznetsov, V.D.; Olkhovsky, S.V. Photogrammetric techniques for 3-D underwater record of the antique time ship from from Phangoria. Int. Arch. Photogramm. Remote Sens. Spat. Inf. Sci. 2013, XL-5/W2, 717–721. [Google Scholar] [CrossRef] [Green Version]
  15. Grzadziel, A. Using Remote Sensing Techniques to Document and Identify the Largest Underwater Object of the Baltic Sea: Case Study of the Only German Aircraft Carrier, Graf Zeppelin. Remote Sens. 2020, 12, 4076. [Google Scholar] [CrossRef]
  16. Cejka, J.; Zsiros, A.; Liarokapis, F. A hybrid augmented reality guide for underwater cultural heritage sites. Pers. Ubiquitous Comput. 2020, 24, 815–828. [Google Scholar] [CrossRef]
  17. Gambin, T.; Hyttinen, K.; Sausmekat, M.; Wood, J. Making the Invisible Visible: Underwater Malta—A Virtual Museum for Submerged Cultural Heritage. Remote Sens. 2021, 13, 1558. [Google Scholar] [CrossRef]
  18. Galceran, E.; Campos, R.; Palomeras, N.; Carreras, M.; Ridao, P. Coverage path planning with realtime replanning for inspection of 3D underwater structures. In Proceedings of the IEEE International Conference on Robotics and Automation, Hong Kong, China, 31 May–7 June 2014; pp. 6585–6590. [Google Scholar]
  19. Davis, A.; Lugsdin, A. Highspeed underwater inspection for port and harbour security using Coda Echoscope 3D sonar. In Proceedings of the Oceans 2005 MTS/IEEE, Washington, DC, USA, 17–23 September 2005. [Google Scholar] [CrossRef]
  20. Guerneve, T.; Pettilot, Y. Underwater 3D Reconstruction Using BlueView Imaging Sonar. In Proceedings of the OCEANS 2015, Genova, Italy, 18–21 May 2015; IEEE: New York, NY, USA, 2015. [Google Scholar] [CrossRef]
  21. ARIS-Sonars. 2022. Available online: http://soundmetrics.com/Products/ARIS-Sonars (accessed on 2 March 2023).
  22. 3DatDepth. 2022. Available online: http://www.3datdepth.com/ (accessed on 2 March 2023).
  23. Yang, P.; Liu, J. Effect of non-unifrom sampling on sonar focusing. In Proceedings of the 14th International Conference on Communication Software and Networks (ICCSN), Chongqing, China, 10–12 June 2021; pp. 109–113. [Google Scholar] [CrossRef]
  24. Reed, A.; Blanford, T.; Brown, D.C.; Jayasuriya, S. Implicit Neural Representations for Deconvolving SAS Images. In Proceedings of the OCEANS 2021: San Diego—Porto, San Diego, CA, USA, 20–23 September 2021. [Google Scholar] [CrossRef]
  25. Nadimi, N.; Javidan, R.; Layeghi, K. Efficient detection of underwater natural gas pipeline leak based on synthetic aperture sonar (SAS) systems. J. Mar. Sci. Eng. 2021, 9, 1273. [Google Scholar] [CrossRef]
  26. Tetlow, S.; Allwood, R.L. The use of a laser stripe illuminator for enhanced underwater viewing. In Proceedings of the Ocean Optics XII, Bergen, Norway, 26 October 1994; Volume 2258, pp. 547–555. [Google Scholar]
  27. McLeod, D.; Jacobson, J.; Hardy, M.; Embry, C. Autonomous inspection using an underwater 3D LiDAR. In An Ocean in Common, Proceedings of the 2013 OCEANS, San Diego, CA, USA, 23–27 September 2013; IEEE: New York, NY, USA, 2014. [Google Scholar]
  28. Moore, K.D. Intercalibration method for underwater three-dimensional map** laser line scan systems. Appl. Opt. 2001, 40, 5991–6004. [Google Scholar] [CrossRef]
  29. Tan, C.S.; Seet, G.; Sluzek, A.; He, D.M. A novel application of range-gated underwater laser imaging system (ULIS) in near-target turbid medium. Opt. Lasers Eng. 2005, 43, 995–1009. [Google Scholar] [CrossRef]
  30. CathXOcean. 2022. Available online: https://cathxocean.com/ (accessed on 2 March 2023).
  31. Voyis. 2022. Available online: https://voyis.com/ (accessed on 2 March 2023).
  32. Kwon, Y.H.; Casebolt, J. Effects of light refraction on the accuracy of camera calibration and reconstruction in underwater motion analysis. Sports Biomech. 2006, 5, 315–340. [Google Scholar] [CrossRef]
  33. Telem, G.; Filin, S. Photogrammetric modeling of underwater environments. ISPRS J. Photogramm. Remote Sens. 2010, 65, 433–444. [Google Scholar] [CrossRef]
  34. Sedlazeck, A.; Koch, R. Perspective and non-perspective camera models in underwater imaging—Overview and error analysis. In Theoretical Foundations of Computer Vision; Springer: Berlin/Heidelberg, Germany, 2011; Volume 7474, pp. 212–242. [Google Scholar]
  35. Li, R.; Tao, C.; Curran, T.; Smith, R. Digital underwater photogrammetric system for large scale underwater spatial information acquisition. Mar. Geod. 1996, 20, 163–173. [Google Scholar] [CrossRef]
  36. Maas, H.G. On the accuracy potential in underwater/multimedia photogrammetry. Sensors 2015, 15, 1814–1852. [Google Scholar] [CrossRef]
  37. Beall, C.; Lawrence, B.J.; Ila, V.; Dellaert, F. 3D reconstruction of underwater structures. In Proceedings of the 2010 IEEE/RSJ International Conference on Intelligent Robots and Systems, Taipei, Taiwan, 18–22 October 2010; pp. 4418–4423. [Google Scholar]
  38. Skinner, K.A.; Johnson-Roberson, M. Towards real-time underwater 3D reconstruction with plenoptic cameras. In Proceedings of the IEEE/RSJ International Conference on Intelligent Robots and Systems (IROS), Daejon, Republic of Korea, 1 October 2016; pp. 2014–2021. [Google Scholar]
  39. Vaarst. 2023. Available online: https://vaarst.com/subslam-3d-imaging-technology/ (accessed on 2 March 2023).
  40. Bruno, F.; Bianco, G.; Muzzupappa, M.; Barone, S.; Razionale, A.V. Experimentation of structured light and stereo vision for underwater 3D reconstruction. ISPRS J. Photogramm. Remote Sens. 2011, 66, 508–518. [Google Scholar] [CrossRef]
  41. Bianco, G.; Gallo, A.; Bruno, F.; Muzzupappa, M. A comparative analysis between active and passive techniques for underwater 3D reconstruction of close-range objects. Sensors 2013, 13, 11007–11031. [Google Scholar] [CrossRef] [PubMed]
  42. Bräuer-Burchardt, C.; Heinze, M.; Schmidt, I.; Kühmstedt, P.; Notni, G. Underwater 3D surface measurement using fringe projection based scanning devices. Sensors 2016, 16, 13. [Google Scholar] [CrossRef] [PubMed]
  43. Duda, A.; Schwendner, J.; Gaudig, C. SRSL: Monocular self-referenced line structured light. In Proceedings of the 2015 IEEE/RSJ International Conference on Intelligent Robots and Systems (IROS), Hamburg, Germany, 28 September–2 October 2015; pp. 717–722. [Google Scholar]
  44. Bleier, M.; van der Lucht, J.; Nüchter, A. Towards an underwater 3D laser scanning system for mobile map**. In Proceedings of the IEEE ICRA Workshop on Underwater Robotic Perception (ICRAURP’19), Montreal, QC, Canada, 20–24 May 2019. [Google Scholar]
  45. Bräuer-Burchardt, C.; Munkelt, C.; Bleier, M.; Heinze, M.; Gebhart, I.; Kühmstedt, P.; Notni, G. A New Sensor System for Accurate 3D Surface Measurements and Modeling of Underwater Objects. Appl. Sci. 2022, 12, 4139. [Google Scholar] [CrossRef]
  46. Heist, S.; Dietrich, P.; Landmann, M.; Kühmstedt, P.; Notni, G. High-speed 3D shape measurement by GOBO projection of aperiodic sinusoidal fringes: A performance analysis. In Proceedings of the SPIE Dimensional Optical Metrology and Inspection for Practical Applications VII, 106670A, Orlando, FL, USA, 14 May 2018; Volume 10667. [Google Scholar] [CrossRef]
  47. Luhmann, T.; Robson, S.; Kyle, S.; Harley, I. Close Range Photogrammetry; Wiley Whittles Publishing: Caithness, UK, 2006. [Google Scholar]
  48. Bräuer-Burchardt, C.; Munkelt, C.; Gebhart, I.; Heinze, M.; Heist, S.; Kühmstedt, P.; Notni, G. A-priori calibration of a structured light projection based underwater 3D scanner. J. Mar. Sci. Eng. 2020, 8, 635. [Google Scholar] [CrossRef]
  49. Bräuer-Burchardt, C.; Munkelt, C.; Gebhart, I.; Heinze, M.; Kühmstedt, P.; Notni, G. Underwater 3D Measurements with Advanced Camera Modelling. PFG-J. Photogramm. Remote Sens. Geoinf. Sci. 2022, 90, 55–67. [Google Scholar] [CrossRef]
  50. Qin, T.; Li, P.; Shen, S. VINS-Mono: A robust and versatile monocular visual-inertial state estimator. IEEE Trans. Robot. 2018, 34, 1004–1020. [Google Scholar] [CrossRef] [Green Version]
  51. Hou, H.; El-Sheimy, N. Inertial sensors errors modeling using Allan varianc. In Proceedings of the 16th International Technical Meeting of the Satellite Division of The Institute of Navigation (ION GPS/GNSS 2003), Portland, OR, USA, 9–12 September 2003; pp. 2860–2867. [Google Scholar]
  52. Shortis, M. Camera calibration techniques for accurate measurement underwater. In 3D Recording and Interpretation for Maritime Archaeology; Coastal Research Library; McCarthy, J., Benjamin, J., Winton, T., van Duivenvoorde, W., Eds.; Springer: Cham, Switzerland, 2019; Volume 31. [Google Scholar]
  53. Garrido-Jurado, S.; Muñoz-Salinas, R.; Madrid-Cuevas, F.J.; Marín-Jiménez, M.J. Automatic generation and detection of highly reliable fiducial markers under occlusion. Pattern Recognit. 2014, 47, 2280–2292. [Google Scholar] [CrossRef]
  54. Kruck, E. BINGO: Ein Bündelprogramm zur Simultanausgleichung für Ingenieuranwendungen—Möglichkeiten und praktische Ergebnisse. In Proceedings of the ISPRS, Rio de Janeiro, Brazil, 17–29 June 1984. International Archive for Photogrammetry and Remote Sensing. [Google Scholar]
  55. Bräuer-Burchardt, C.; Kühmstedt, P.; Notni, G. Improvement of measurement accuracy of optical 3D scanners by discrete systematic error estimation. In Combinatorial Image Analysis, Proceedings of the IWCIA 2018, Porto, Portugal, 22–24 November 2018; Barneva, R.P., Brimkov, V., Tavares, J., Eds.; Springer: Cham, Switzerland, 2018; Volume 11255, pp. 202–215. [Google Scholar]
Figure 1. Scanning system in the water basin and marker boards with ArUco markers and circle patterns on the ground of the basin at calibration.
Remotesensing 15 01864 g001
Figure 2. Underwater sensor system mounted on a ROV at immersion into water.
Remotesensing 15 01864 g002
Figure 3. Reconstructed areas with test objects using the color camera data (above) and approximately a ten-meter-long pipe segment (below).
Remotesensing 15 01864 g003
Figure 4. Reconstructed pottery vessels with color map** (left) and 3D representation (right), both obtained from visual odometry.
Remotesensing 15 01864 g004
Figure 5. Detail on the pottery vessel from the visual odometry data (left) and structured illumination without color map** (right).
Remotesensing 15 01864 g005
Table 1. Length error of repeated ball-bar measurements in the water basin and offshore. The calibrated length of ball-bar was 497.612 mm.
Sensor S1Water Basin Sensor S2Offshore
Distance [m]Length [mm]nDistance [m]Length [mm]n
1.54 ± 0.00497.602 ± 0.03061.16 ± 0.02499.655 ± 0.10510
1.94 ± 0.01497.873 ± 0.04061.28 ± 0.01500.067 ± 0.18610
2.24 ± 0.00498.144 ± 0.03751.57 ± 0.03501.716 ± 0.16710
Disclaimer/Publisher’s Note: The statements, opinions and data contained in all publications are solely those of the individual author(s) and contributor(s) and not of MDPI and/or the editor(s). MDPI and/or the editor(s) disclaim responsibility for any injury to people or property resulting from any ideas, methods, instructions or products referred to in the content.

