1. Introduction
The Qinghai–Tibet Plateau (QTP)’s higher altitude and harsh climatic conditions have developed frozen soil with the largest area, the highest altitude, and the widest distribution in the middle and low latitudes of the world [
1,
2]. Frozen soil on the Qinghai–Tibet Plateau refers to various rocks and soils containing ice below 0 °C. It generally can be divided into short-term frozen soil (several hours/days or even half a month), seasonally frozen soil (half a month to several months), and permafrost (a few years to tens of thousands of years). These frozen soils have relatively poor thermal stability due to their large ice content, increased temperature, and low thickness on the Qinghai–Tibet Plateau [
3,
4]. Due to the sensitivity of seasonally frozen soil to temperature, from June to September each year, the increase in temperature causes the ablation of frozen soil. As the global temperature continues to rise, the depth of ablation of seasonally frozen soil continues to increase on large scales, and the temperature and water content inside the frozen soil gradually increase. On small scales, especially in the Qinghai–Tibet Project Corridor, the degradation of frozen soil caused by human engineering activities is often greater than climate change [
5,
6]. With the deterioration of frozen soil and the increase of engineering activities, thermal-thawing disasters continue to occur along the Qinghai–Tibet Project Corridor. These thermal-thawing disasters mainly manifest as shallow frozen soil landslides, thaw-slum**, and thermal-thawing debris flow [
7]. As of 2015, field survey work and remote-sensing image data show that a total of 42 thaw-slum** and landslides have been found within 10 km (from Fenghuoshan section to Chumar River) along the sides of the Qinghai–Tibet Railway embankment. Among them, 12 are distributed within 52 km of Hoh ** is often distributed near railways, highways, and other construction projects, it poses a potential threat to the frozen soil environment and existing engineering facilities, and as the scale of engineering construction gradually increases, the frequency and scale of thermal melt disasters in the corridor will also gradually increase [
9]. Therefore, studying the permafrost thaw-slum** developed on both sides of the Qinghai–Tibet Plateau Engineering Corridor has good value for engineering safety and ecological restoration.
The thermal-thawing process refers to all the processes of ground collapse, subsidence, erosion, and instability caused by the melting of frozen soil [
10]. If the thermal melting process occurs in the slope area, slope instability phenomena such as thermal fusion slump and thermal sludge flow will be formed. At present, research on thaw-slum** disasters mainly includes the analysis of underground ice melting and ground surface morphological mechanics. For the measurement of these frozen soil elements, methods such as mechanical borehole detection, remote-sensing methods, and geophysical prospecting are mainly used [
11]. In the geophysical exploration method, since the ground-penetrating radar (GPR) has the characteristics of high precision, high efficiency, and being non-destructive, the change of the dielectric constant caused by the ablation of frozen soil can be well characterized in the radar electromagnetic wave waveform and attributes, the ground-penetrating radar method is widely used in the survey of frozen soil and thaw-slum** areas [
12]. Brown proposed to use the GPR data event axis to determine the depth of permafrost ablation [
13]. Hinkel et al. used GPR data to study the development characteristics of frozen soil in Alaska [
14]. Schwamborn et al. used GPR data to detect the geometry of the active layer under the ice in Maritime Antarctica [
15]. Sudakova et al. used the GPR detection method to monitor the changes in frozen soil for many years in the Pechora River Delta [
16]. Campbell et al. comprehensively used GPR antennas with center frequencies of 200 MHz and 400 MHz to detect engineering data such as shallow active underground layers, landfills, and filling thickness [
17]. Luo used GPR data to divide the layered structure of the frozen soil of thaw-slum** after ablation [
18]. These previous studies mainly focused on the following two aspects: (1) Morphological distribution and underground structure division of frozen soil and thaw-slum**; (2) the layered structure of the thawed state. Then, using GPR data to characterize and evaluate the two most critical elements including the relative water content of frozen soil and the degree of ice ablation are missing. In using GPR data to calculate the physical properties of frozen soil, including ice content and water content, scholars have proposed some empirical formulas and calculation methods. These formulas include the Alharathi formula, Roth formula, Malicki formula, and Topp formula [
19,
20]. Du and Sperl studied the method of calculating water content using GPR data with a common offset [
21]. Shen et al. combined the weighted average frequency, attenuation frequency, and relative wave impedance properties of GPR data into the Topp formula to calculate the moisture content of seasonally frozen soil on the Qinghai–Tibet Plateau after ablation [
22,
23].
Although various scholars have carried out a lot of research on using GPR data to mine frozen soil information, there are still some shortcomings. First, early research based on GPR data mainly focused on the ablation of naturally frozen soil, and rarely involved the disaster of thaw-slum**; second, even if thaw-slum** is involved, GPR data are only used to locate the ablation layer, and there is a lack of detailed hierarchical structure analysis; finally, due to the effects of surface cracking, melting water and slope mechanics on the surface of the landslide, the physical properties of the landslide have very strong anisotropy characteristics. Anisotropy leads to large accuracy errors in the calculation of relative wave impedance and attenuation attributes of GPR data, which results in deviations in the calculation of water content.
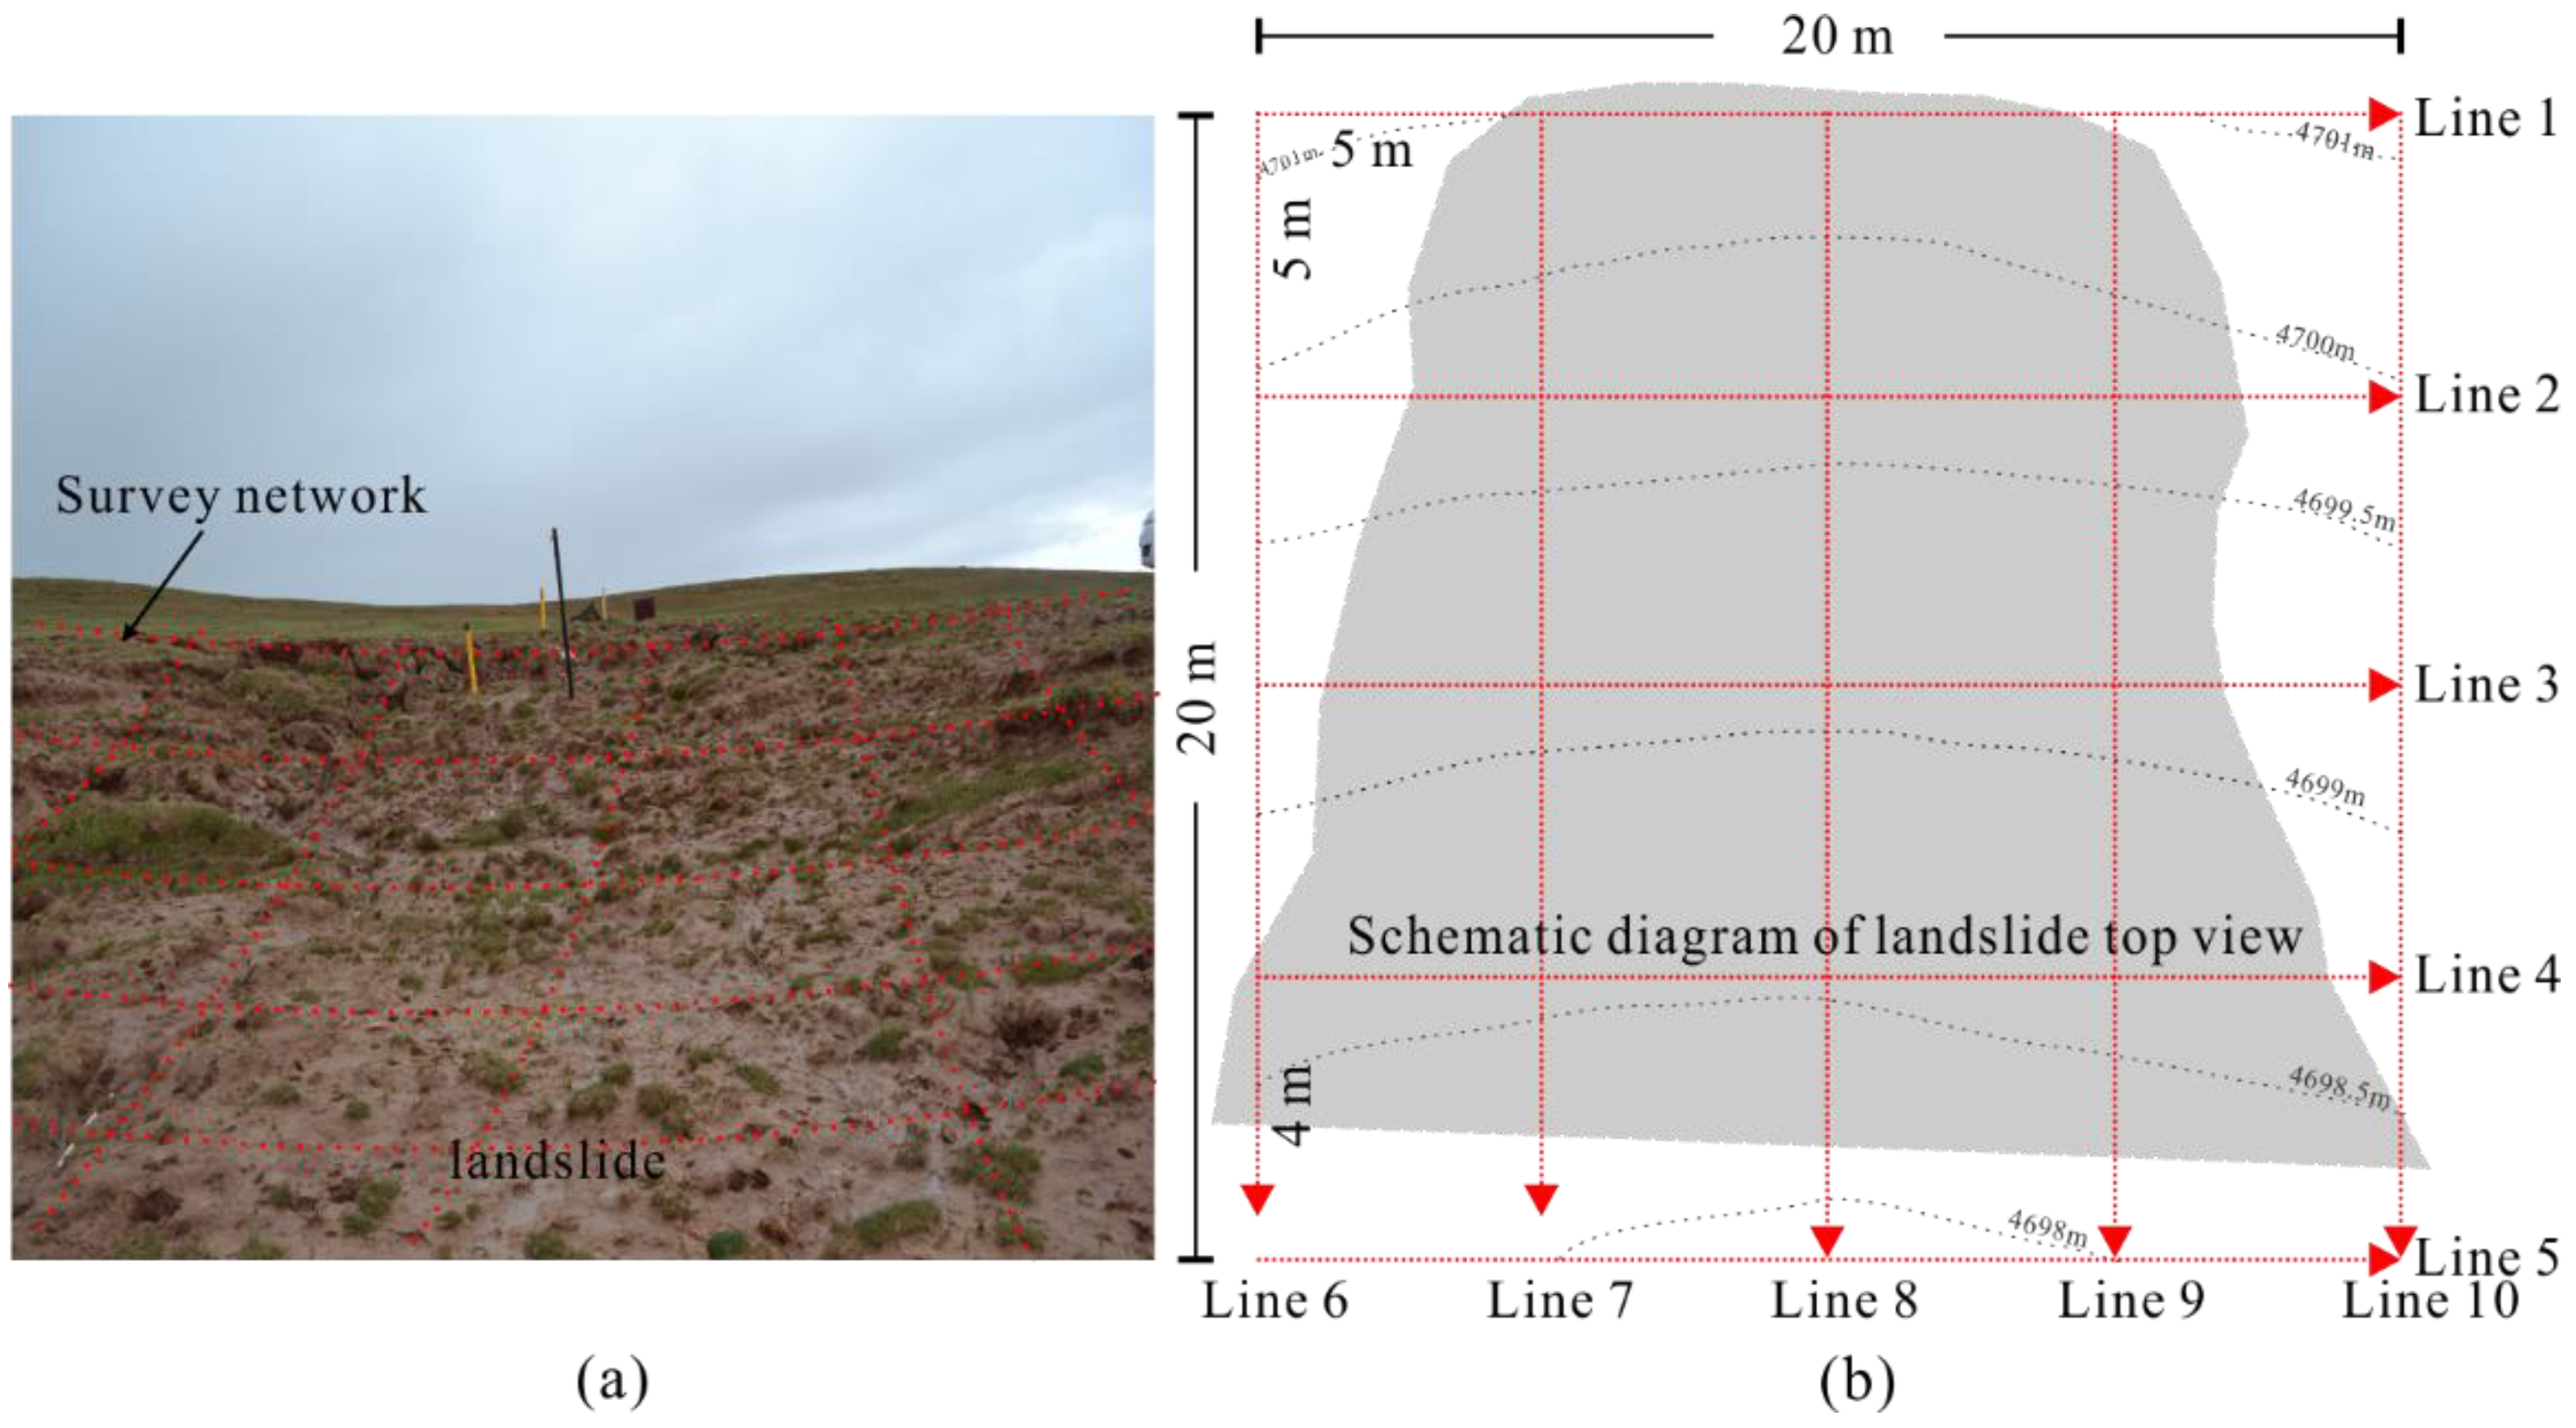
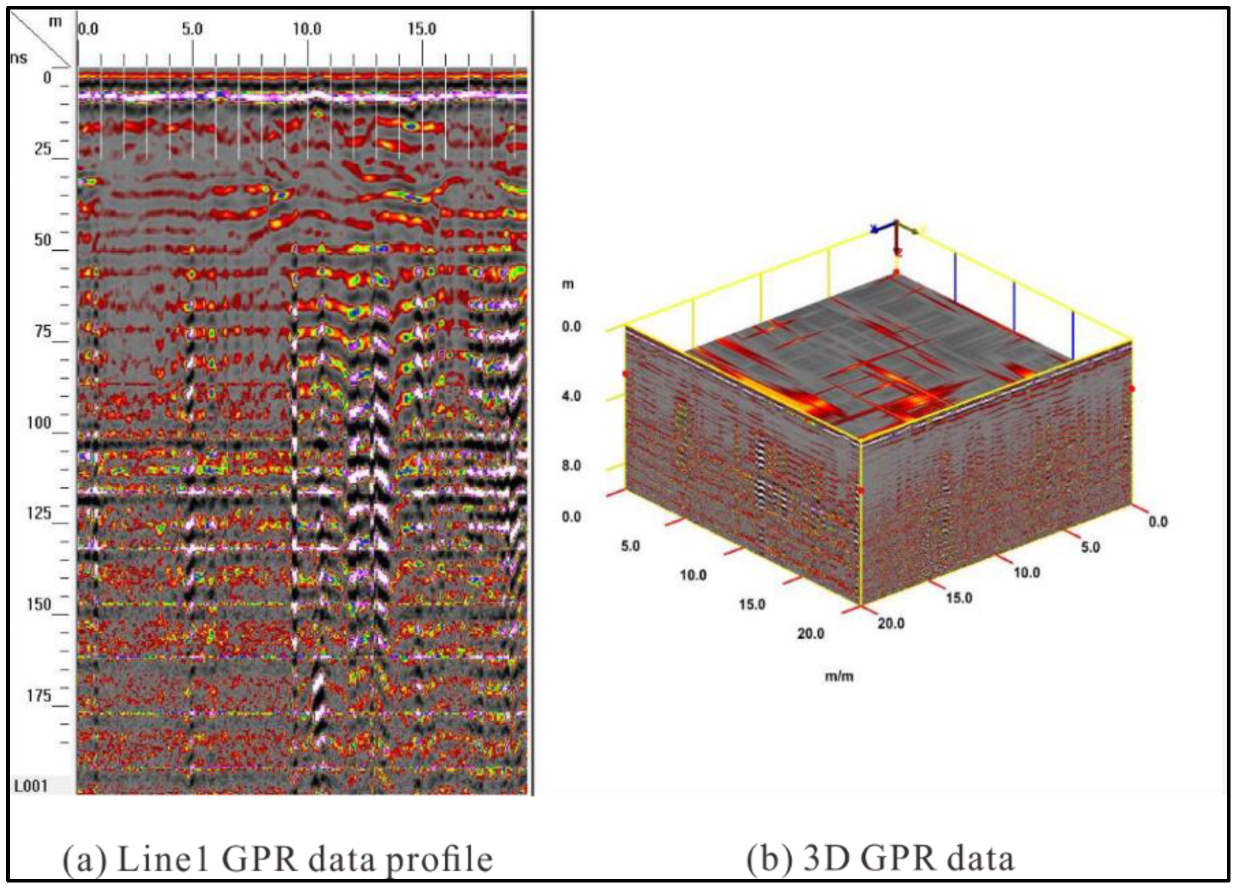
In response to the above problems, this study collected GPR data on the frozen soil of the Qinghai–Tibet Plateau thaw-slum** site using a 3D survey network. Analyzed the method of accurate imaging and division of the underground medium layer of thaw-slum** using the attributes of GPR data. In addition, the study puts forward a method to calculate the water content of the underground frozen soil of thaw-slum** comprehensively using the attributes of GPR data. Using stratum slices, the characteristics of the distribution of water content with depth are analyzed. These attributes can clearly distinguish the anisotropy of underground ablation, determine the ice-containing structure that is not completely ablated, divide the ablation water accumulation area, and calculate the distribution characteristics of the relative water content of thaw-slum**.
3. Results
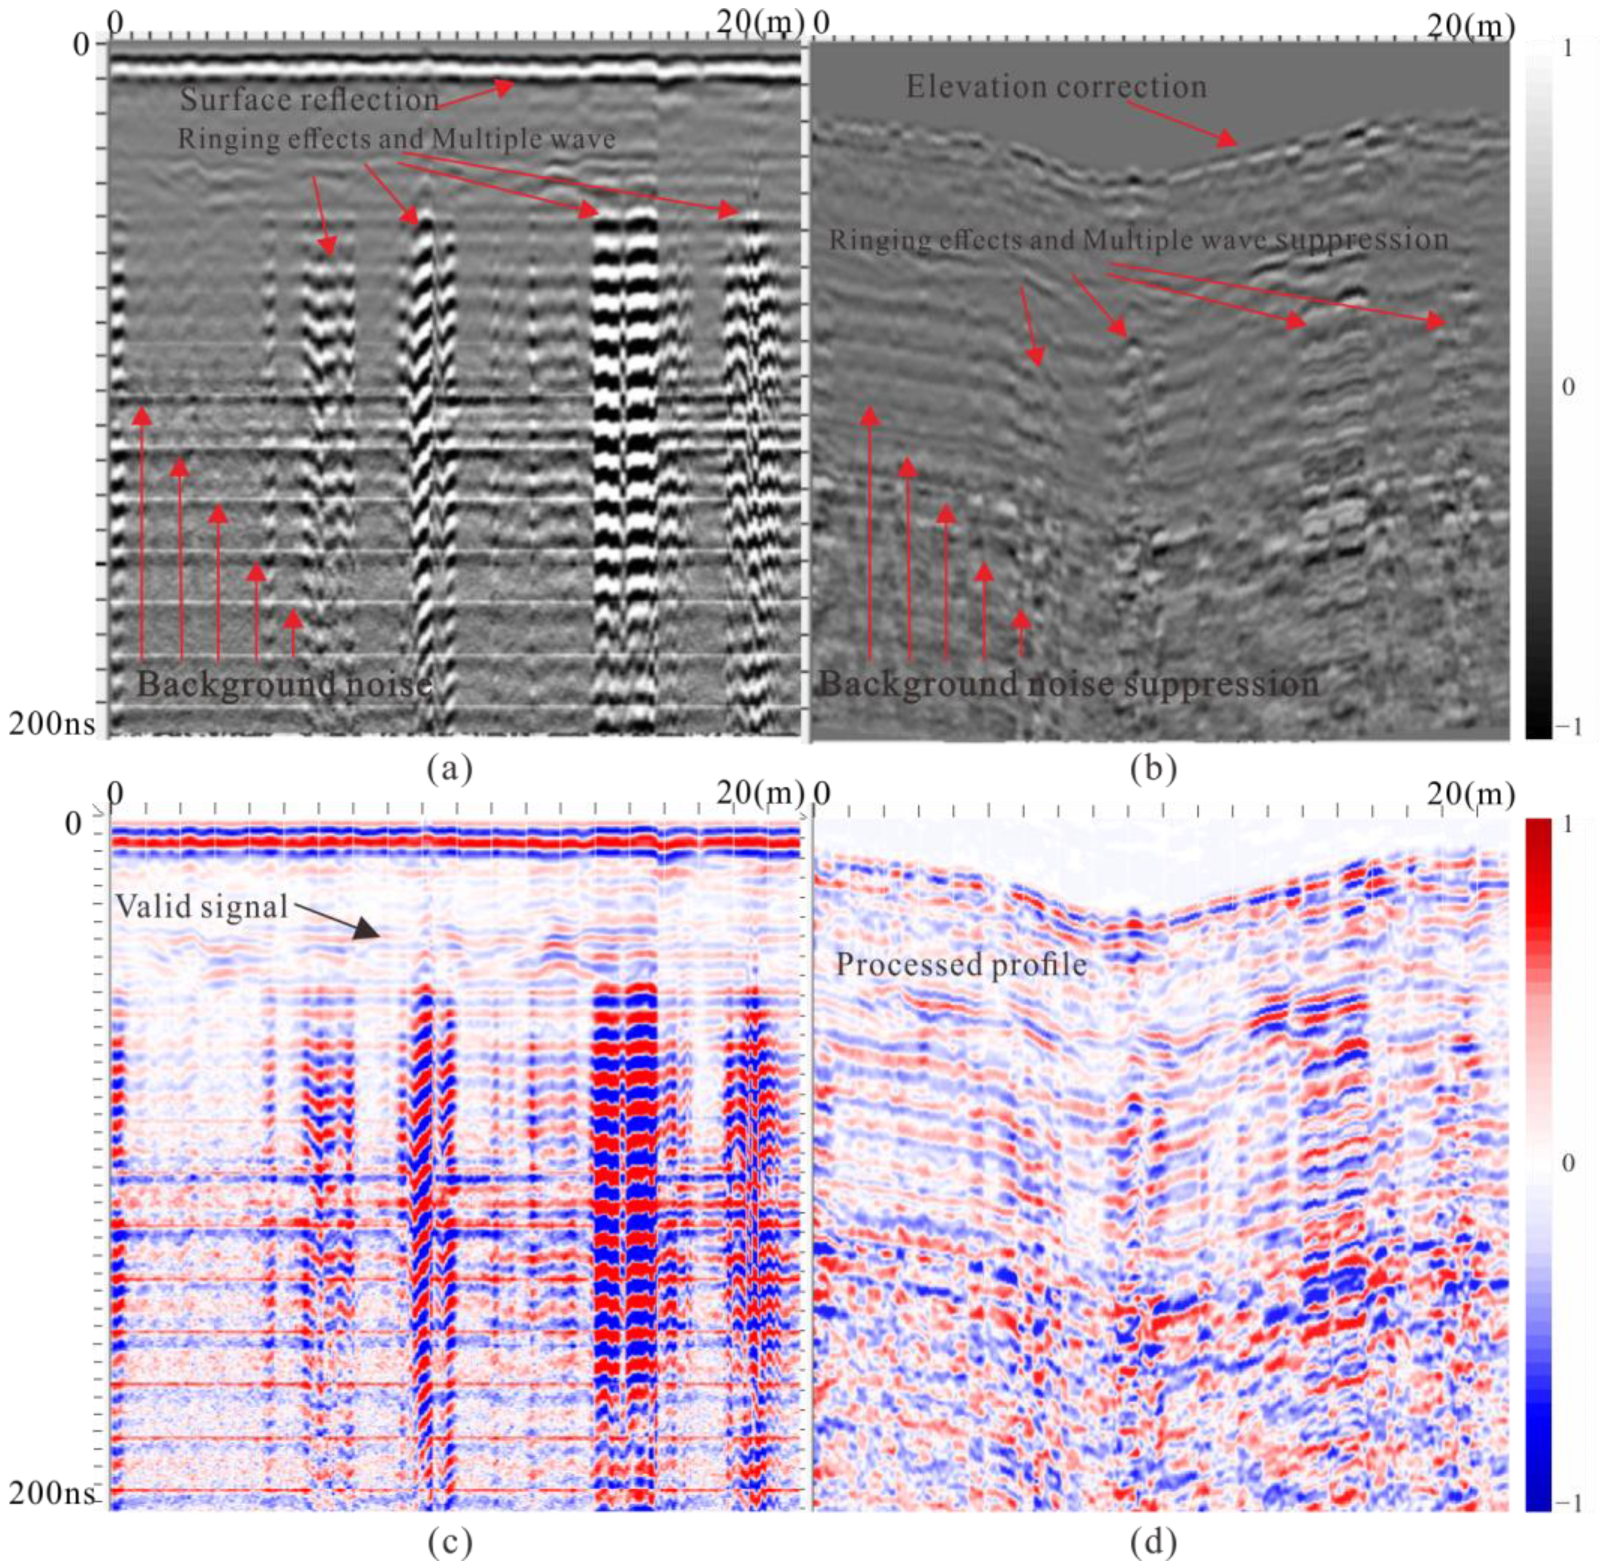
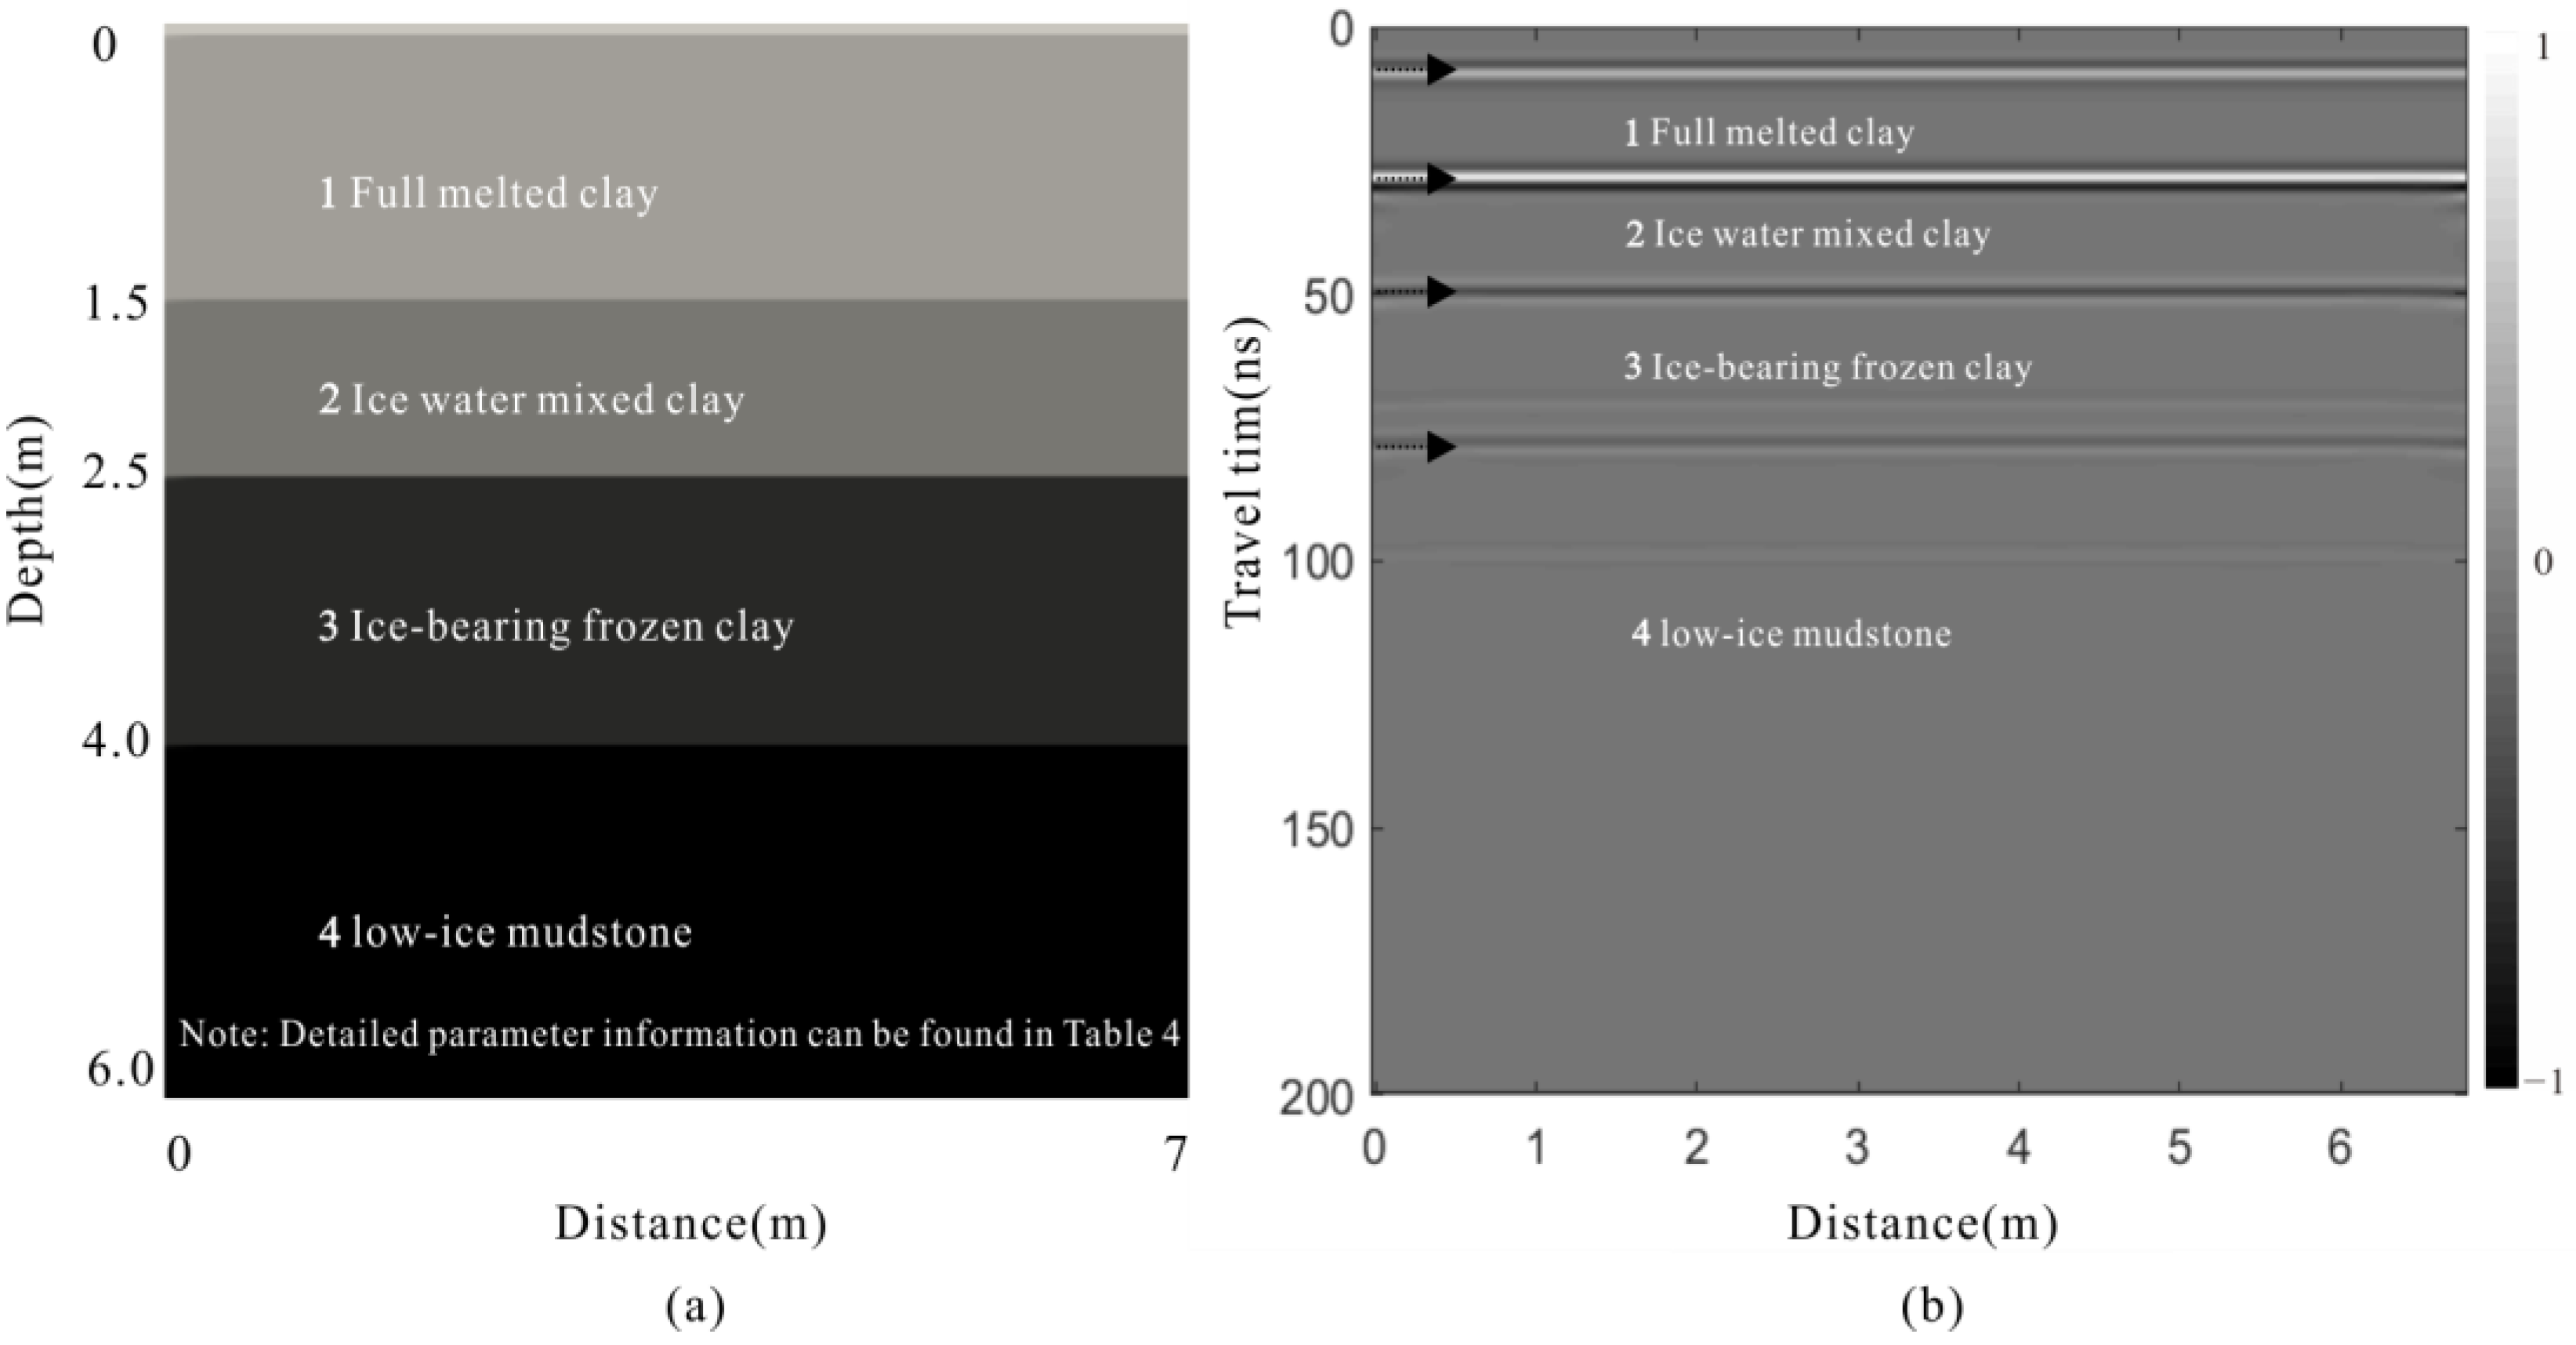
After the ground-penetrating radar data are processed, the signal-to-noise ratio is improved, the effective signal is enhanced, and the influence of noise on data analysis and calculation is reduced. Due to the difference in ablation degree, the underground medium of thaw-slum** has different water content and dielectric constant. Both the model’s analysis and the early research have proved the stratification phenomenon of frozen soil after thawing, and the GPR signal has the same phase axis of amplitude at the frozen soil stratification [
18,
22,
42]. In addition, due to the difference between the dielectric constant and absorption attenuation coefficient, the GPR signal’s Amplitude energy attenuation trend is also significantly different in different permafrost thawing layers. Combined with the actual frozen soil excavation data, it can well divide the horizon and demarcate the depth of the underground medium of thaw-slum**. Based on this stratigraphic framework, research the attributes of electromagnetic wave signals that can reflect changes in soil physical properties, ground temperature, and dielectric constant. Calculate the relative water content of the soil and provide the key elements of landslide development characteristics for disaster evaluation.
3.1. Stratification of Thaw-Slum**
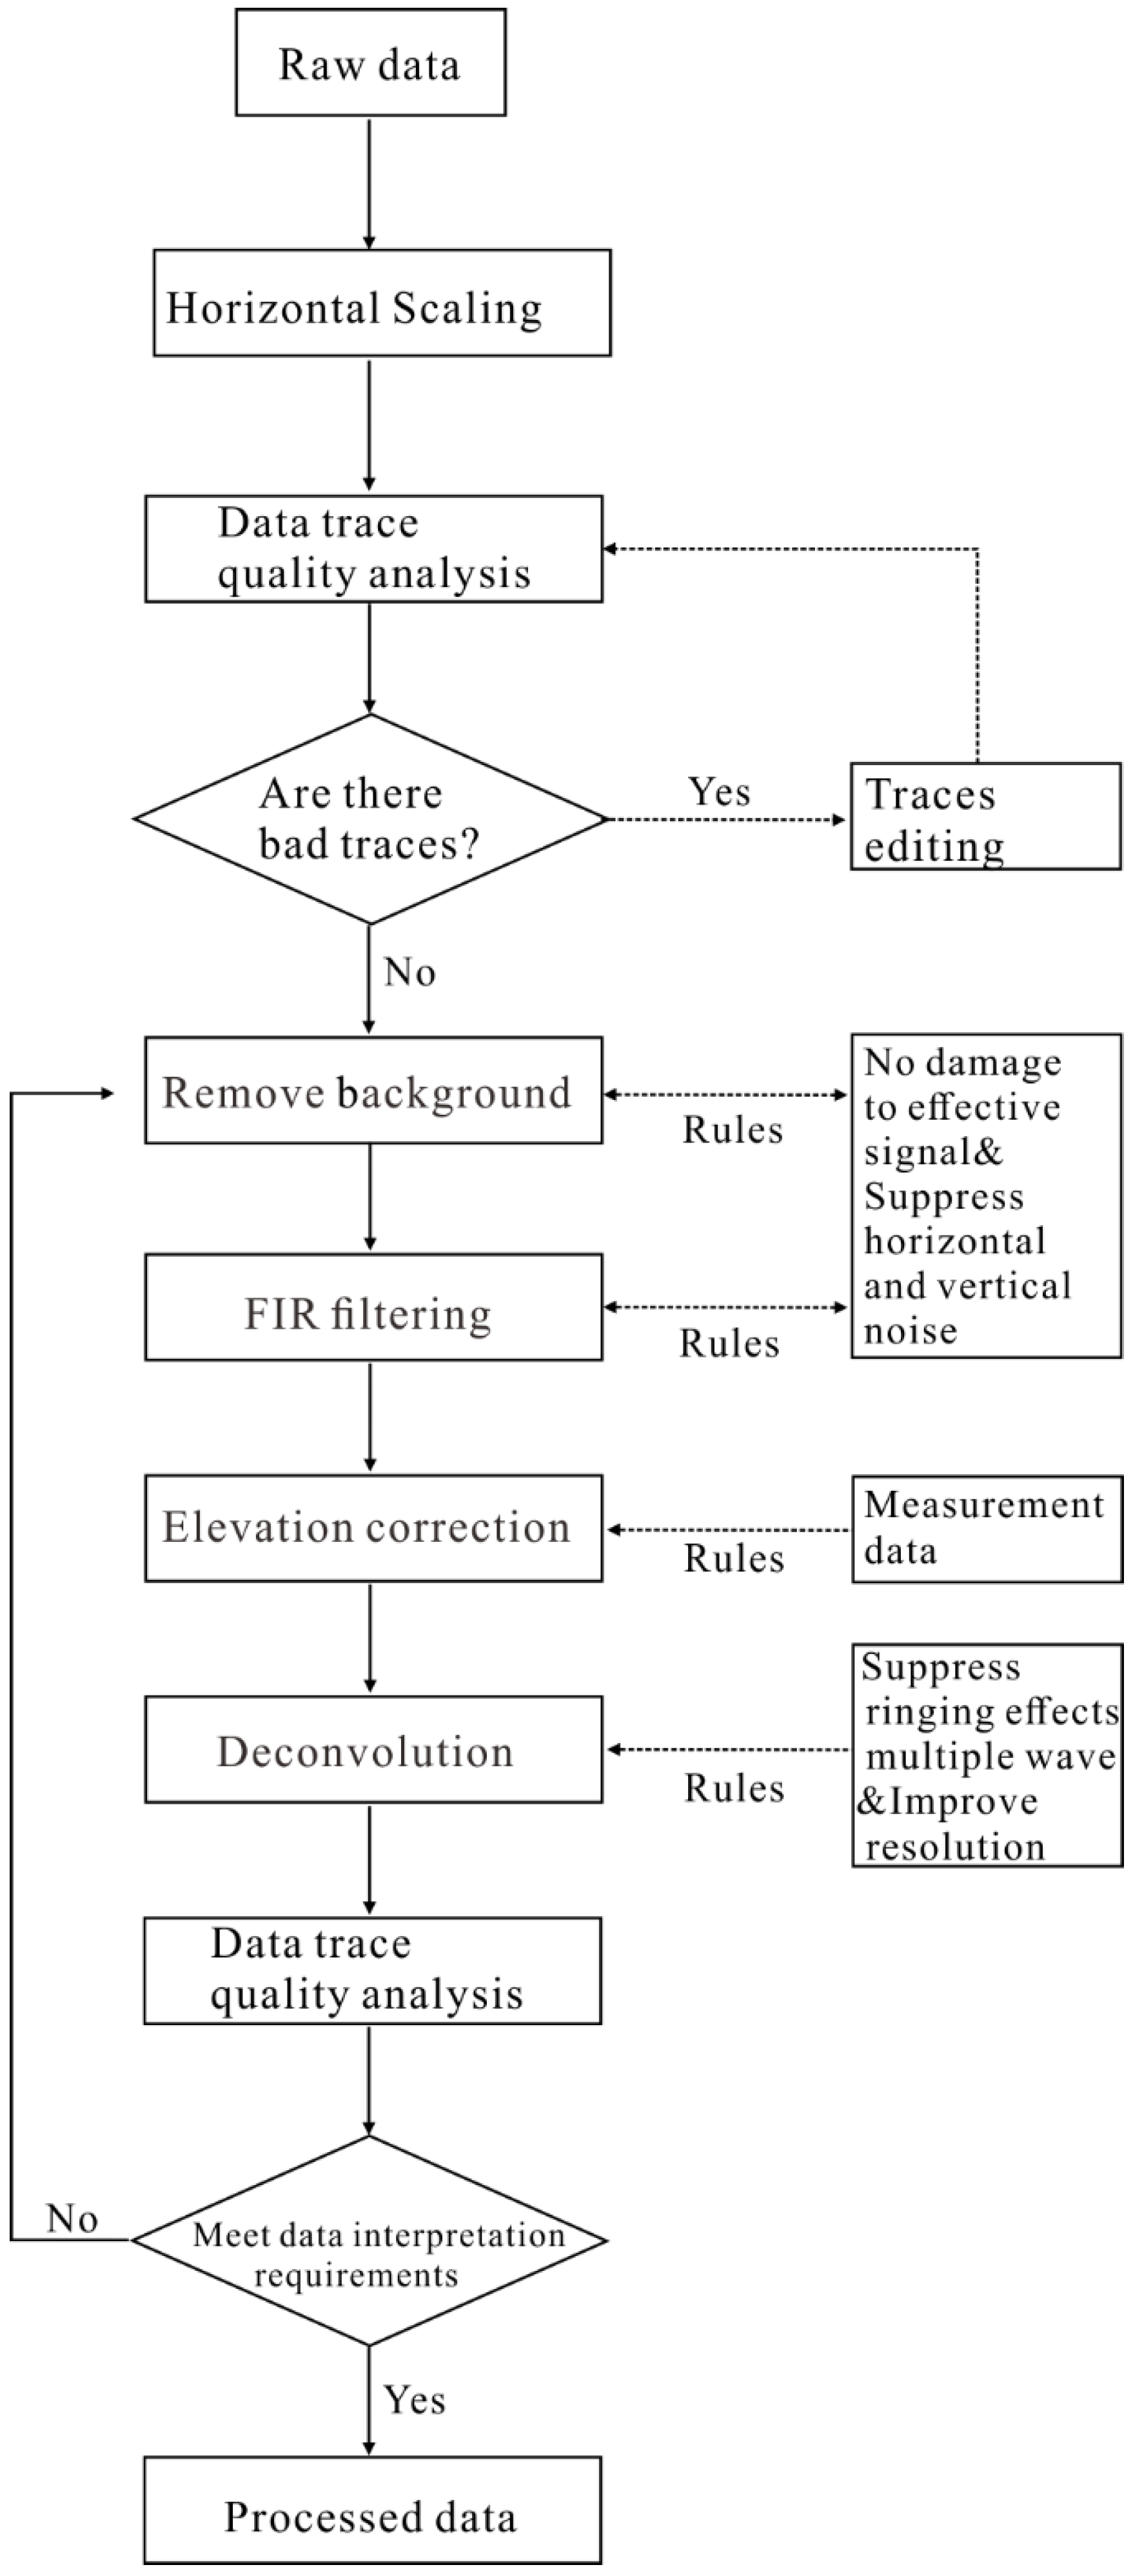
The internal landslide surface of thaw-slum** often occurs on the contact surface of completely ablated and unthawed frozen soil. The layer division of the underground medium is the basis for the study of thaw-slum**. The originally collected radar data requires complete signal processing. The same processing method is used for all data to carry out elevation correction, multiple suppression, noise suppression, and migration imaging.
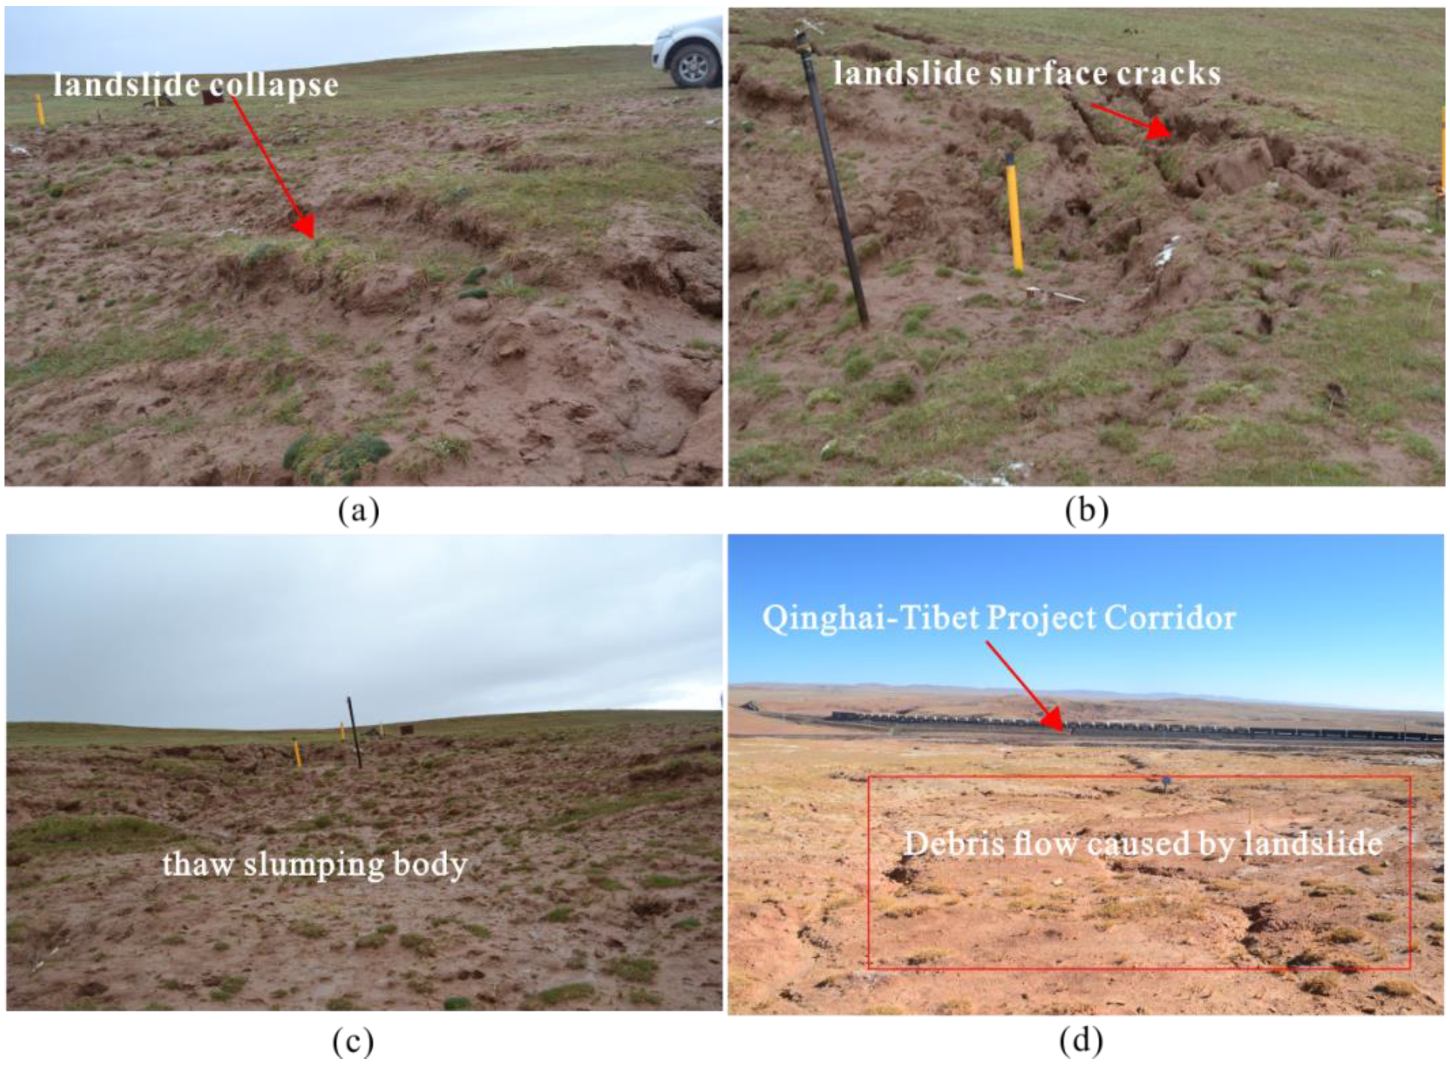
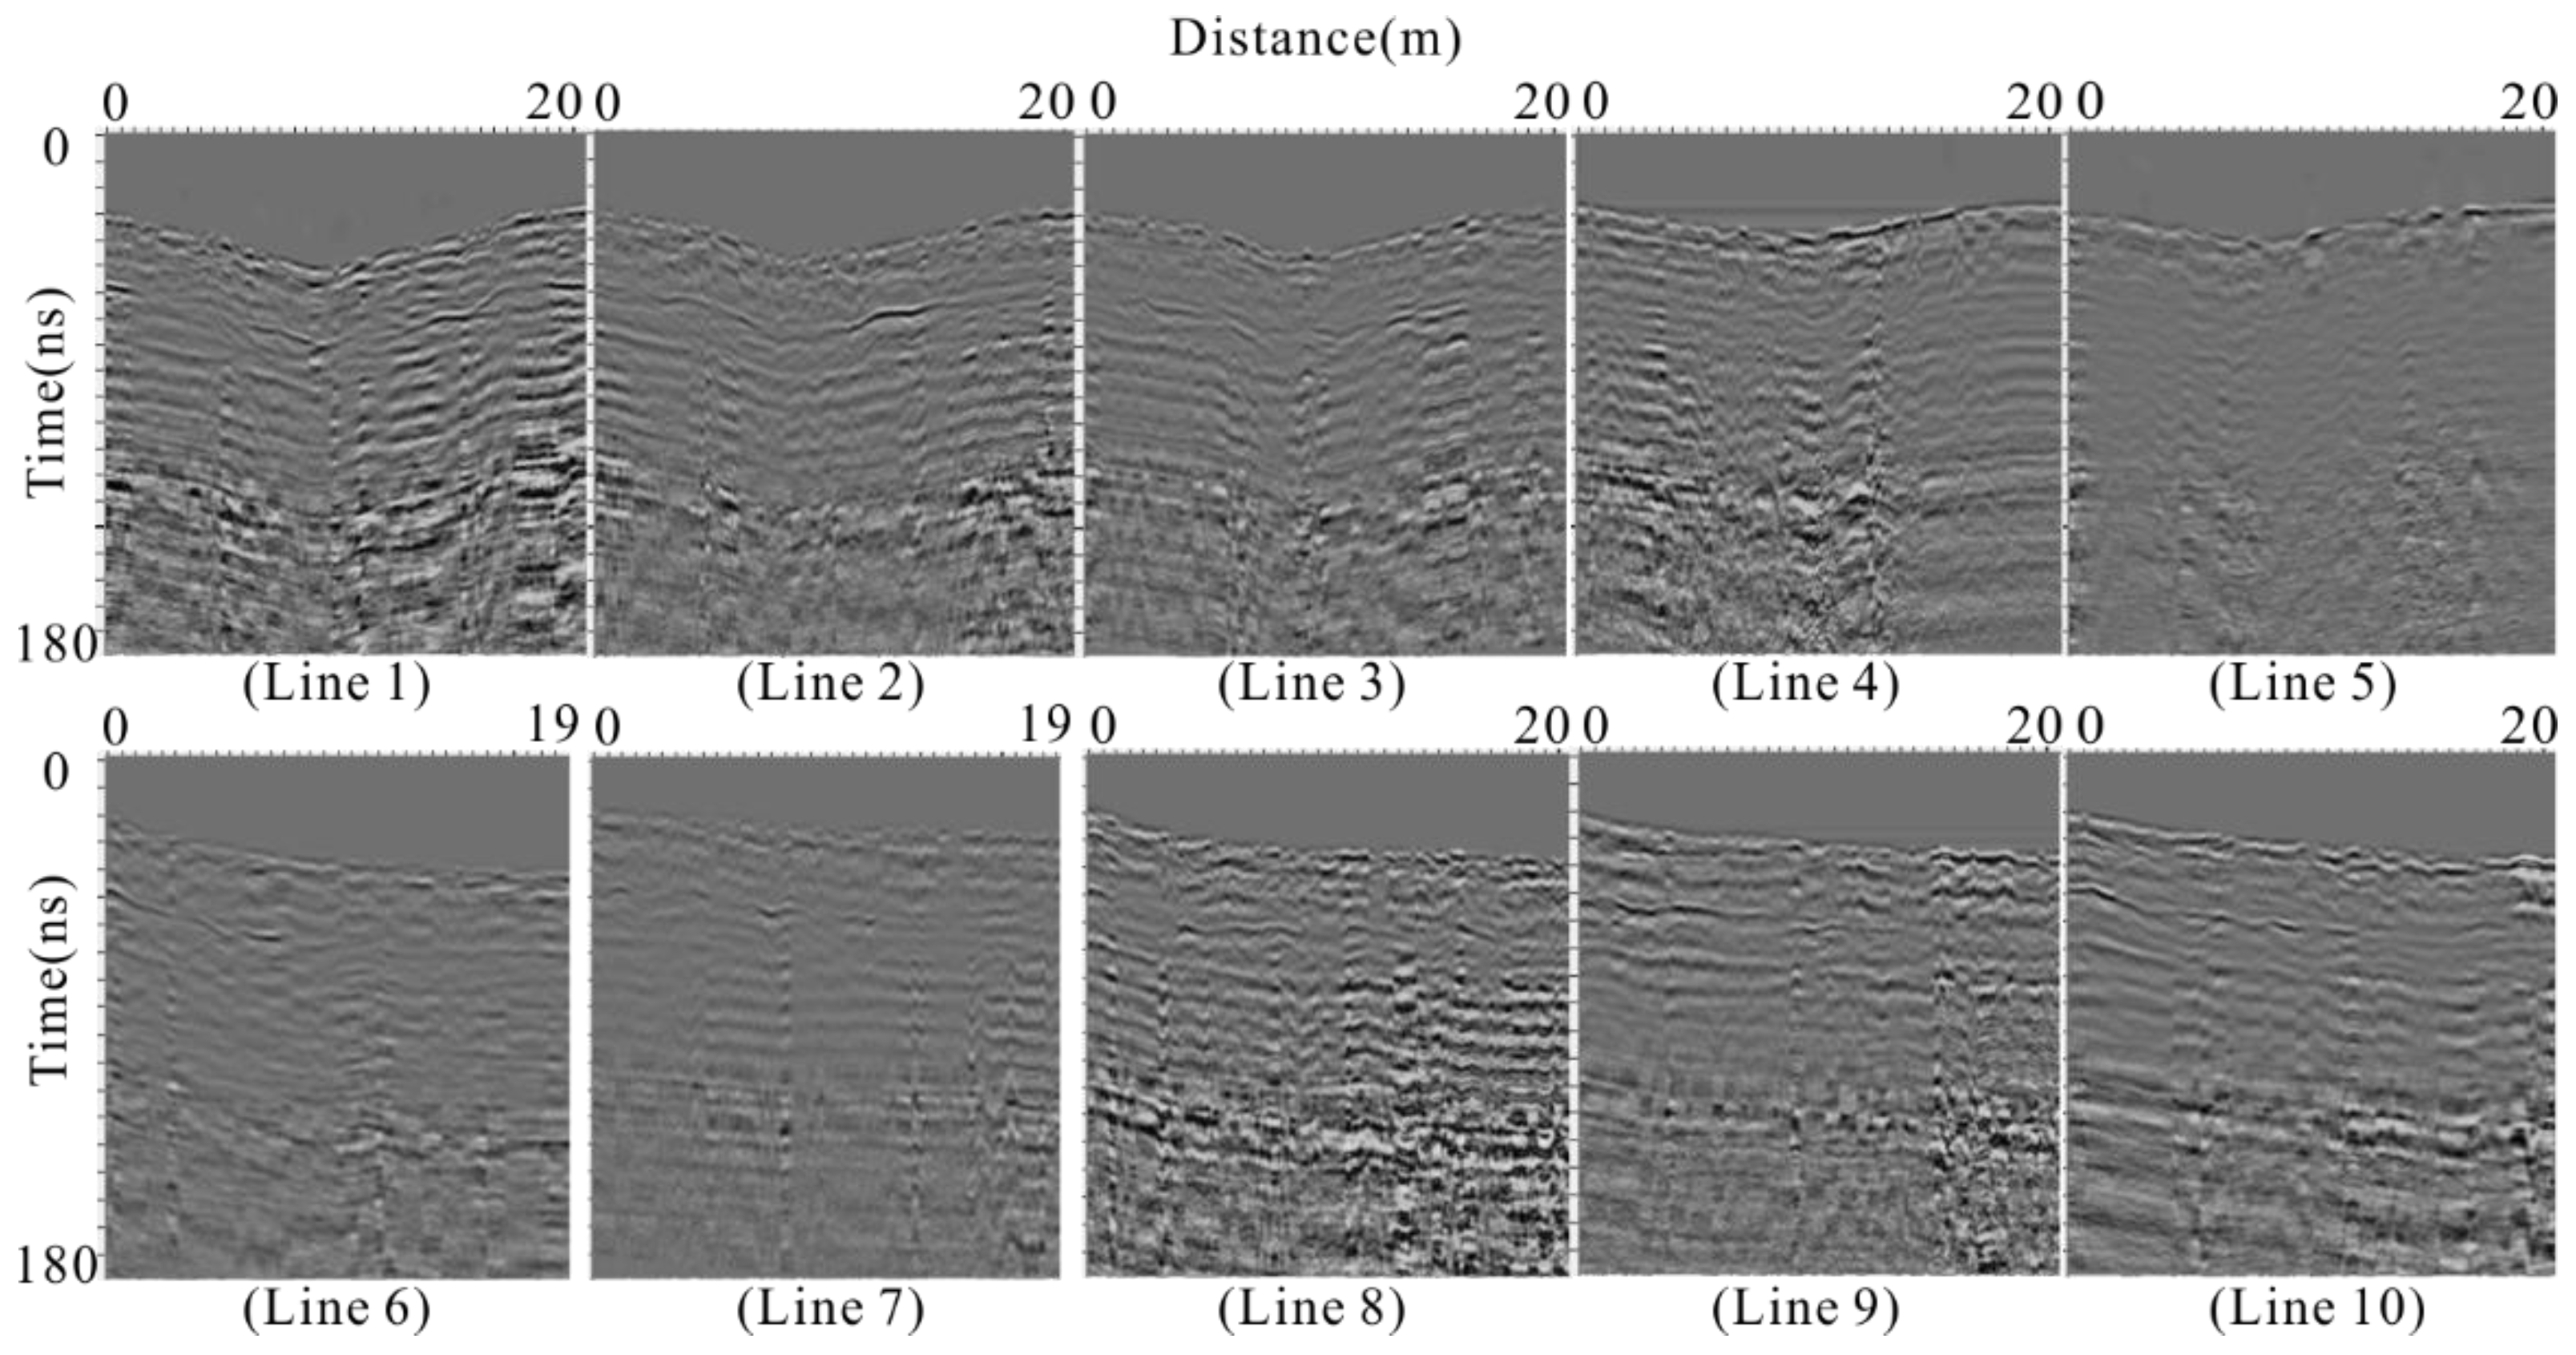
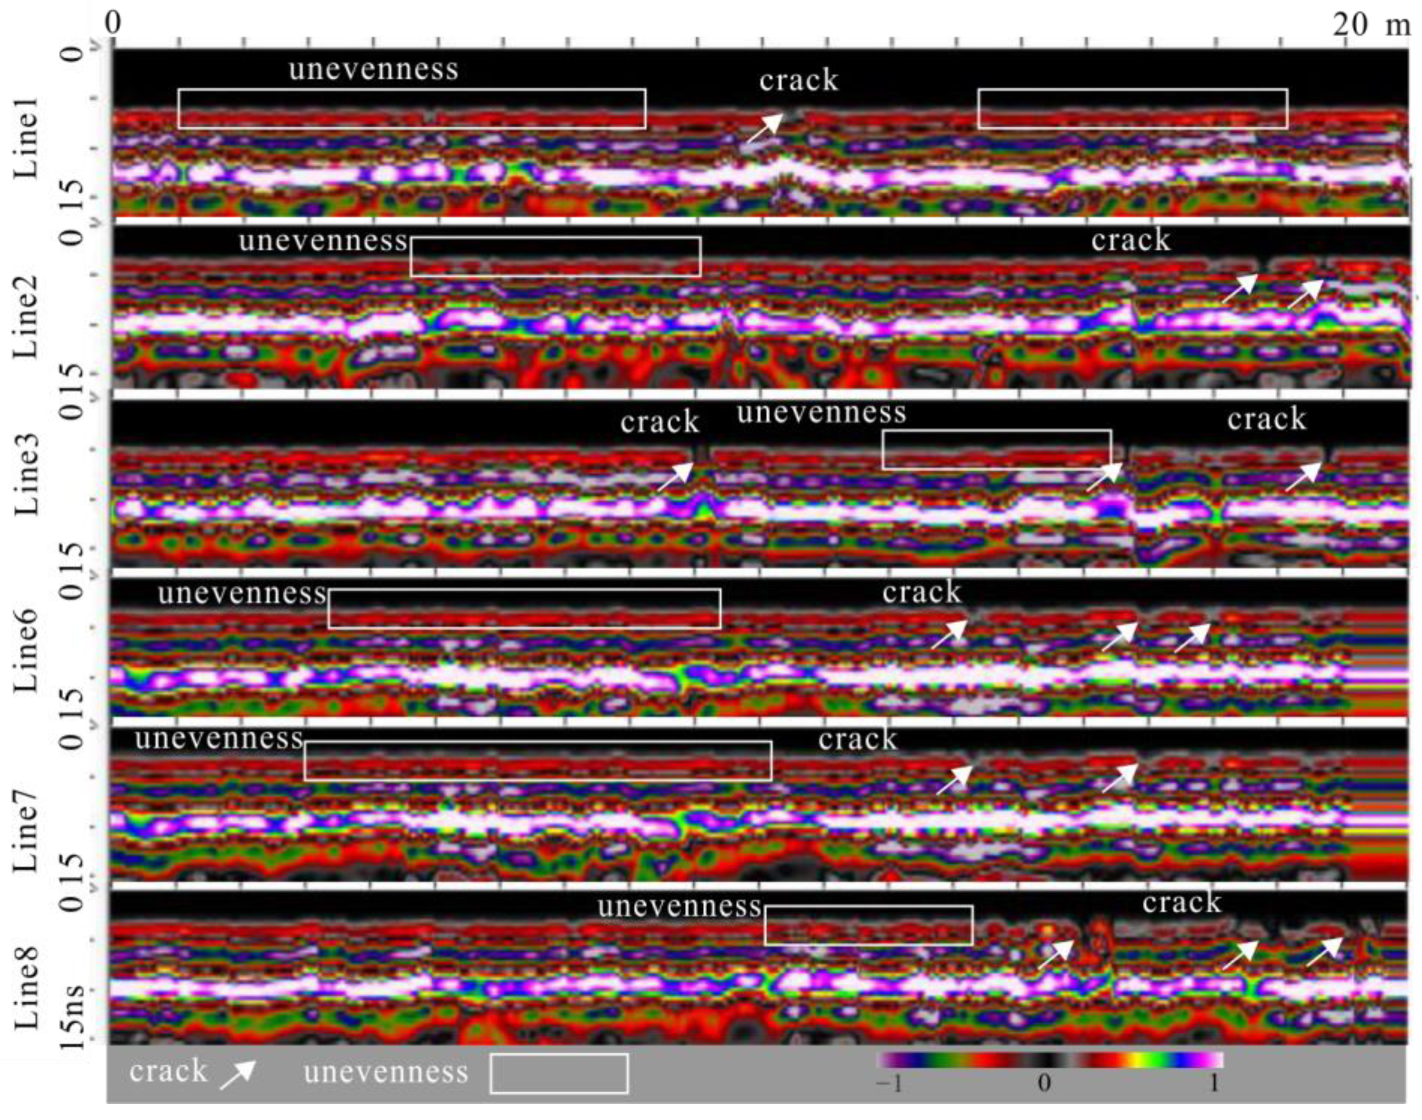
Figure 16 shows the GPR grayscale profile from Line 1 to Line 10. It can be seen from the grayscale image that the event axis of the ground reflection has jumped. This is due to the development of surface cracks and unevenness (
Figure 3 and
Figure 17). Although the amplitude events on B-scan can be used to divide horizons, the tracking is interrupted due to the discontinuity of some regional events in the B-scan. In this case, the amplitude energy attenuation trend can be used for supplementary analysis to determine the specific depth of the horizon.
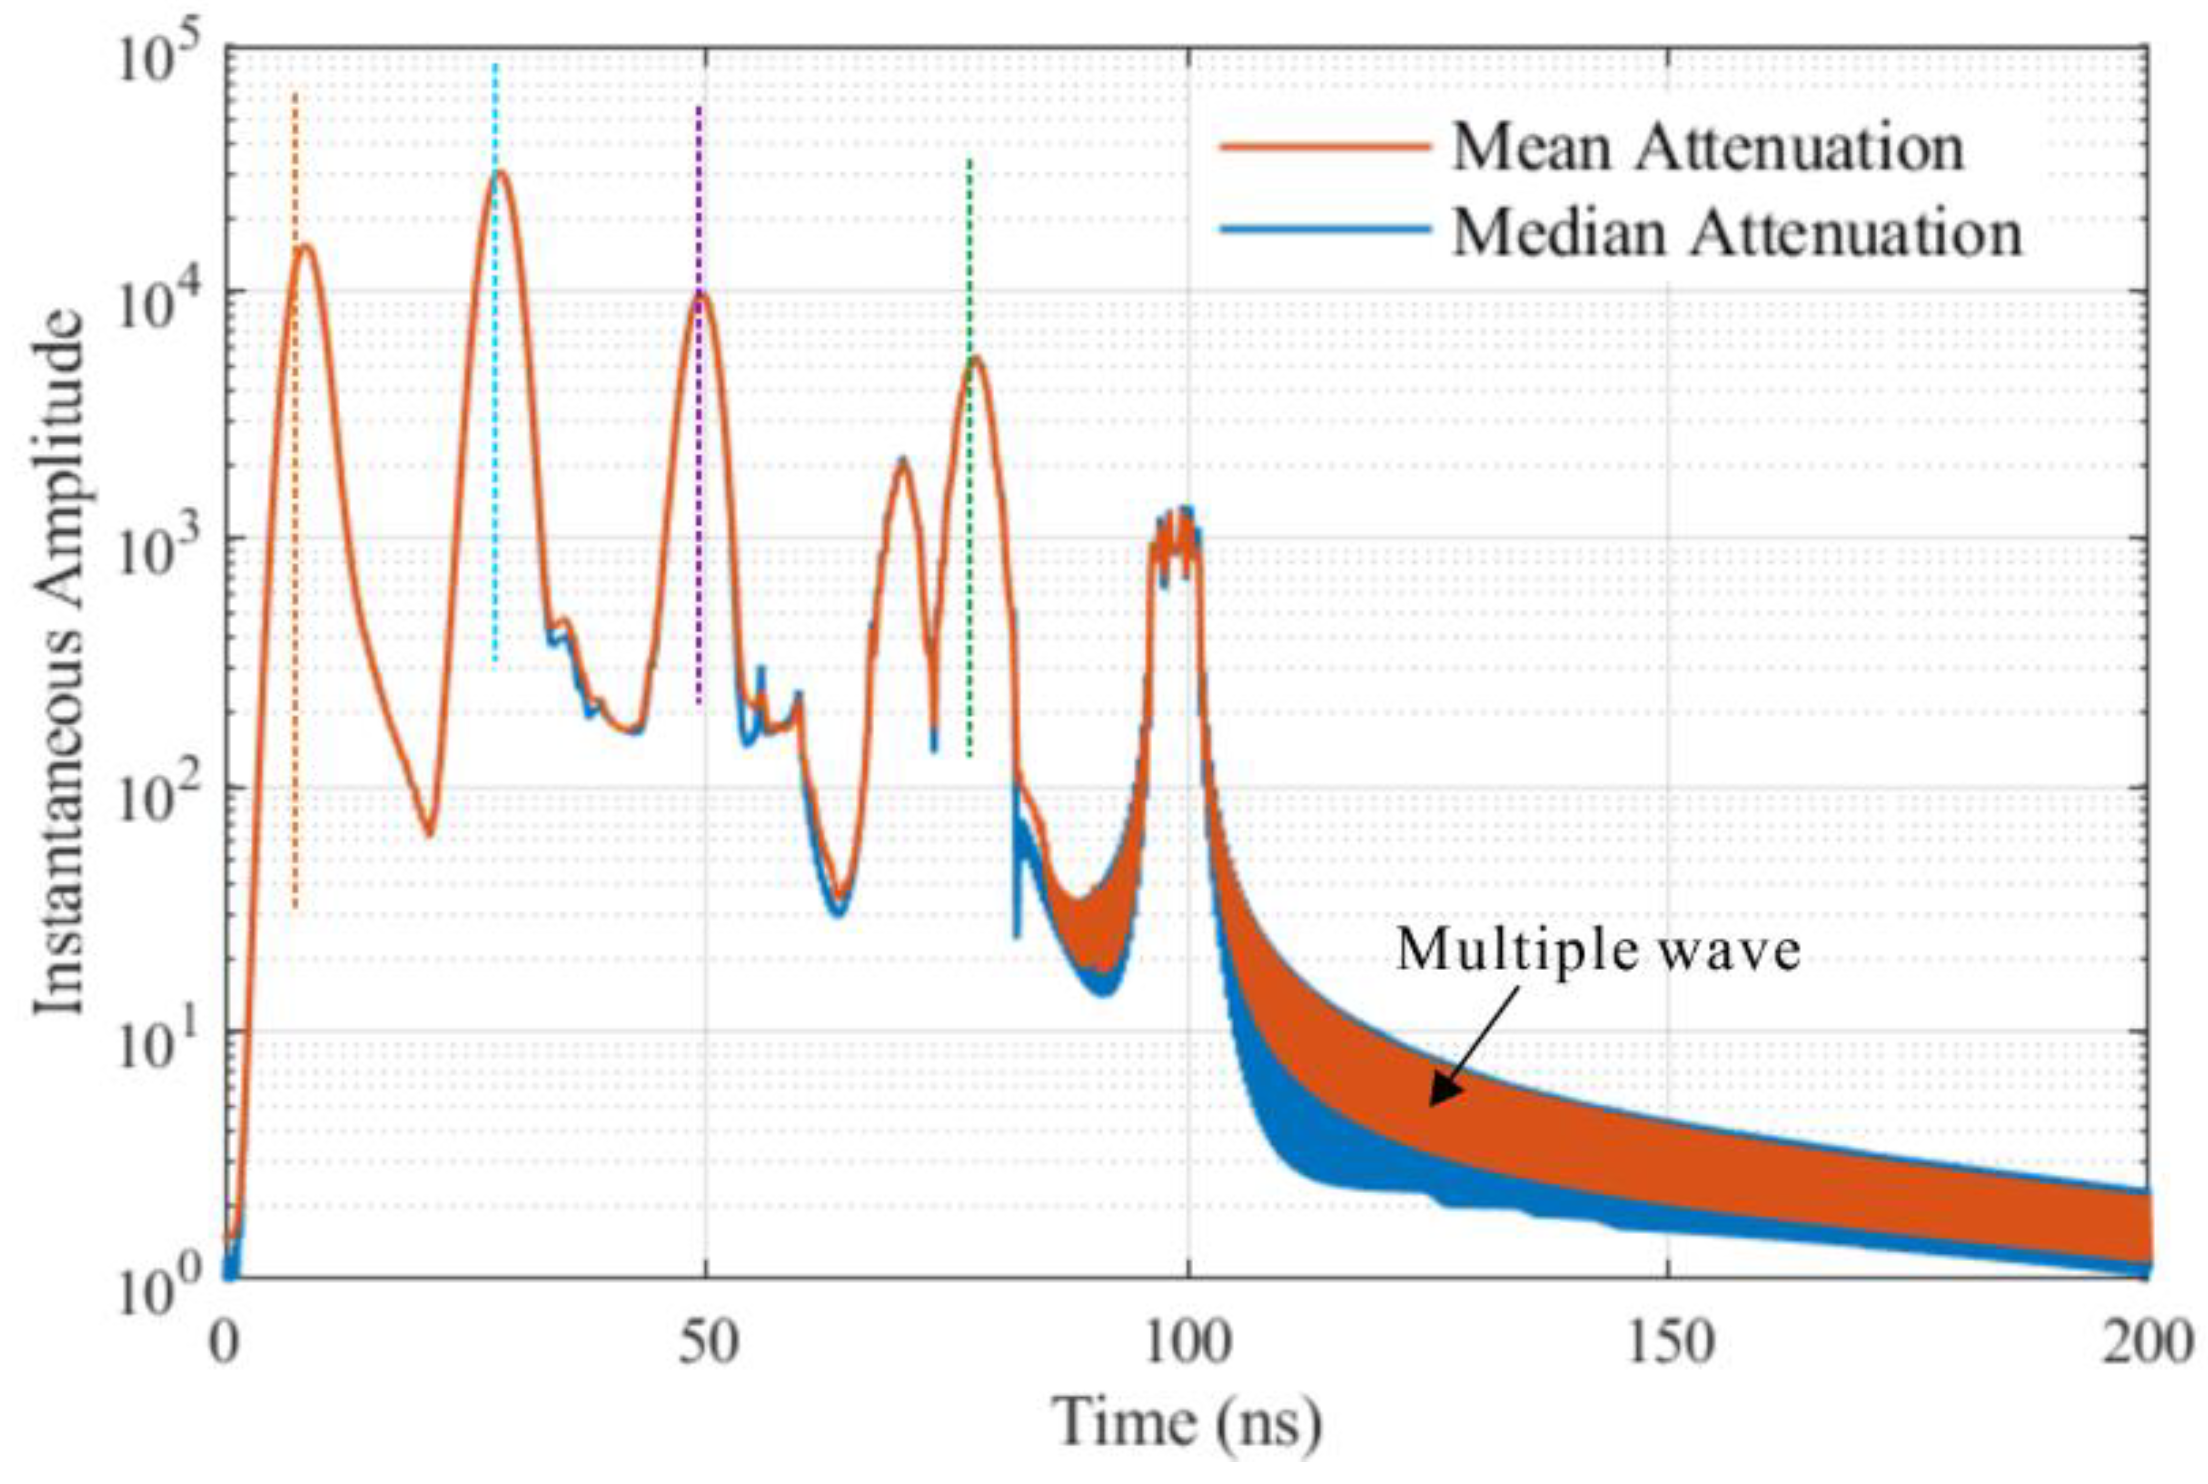
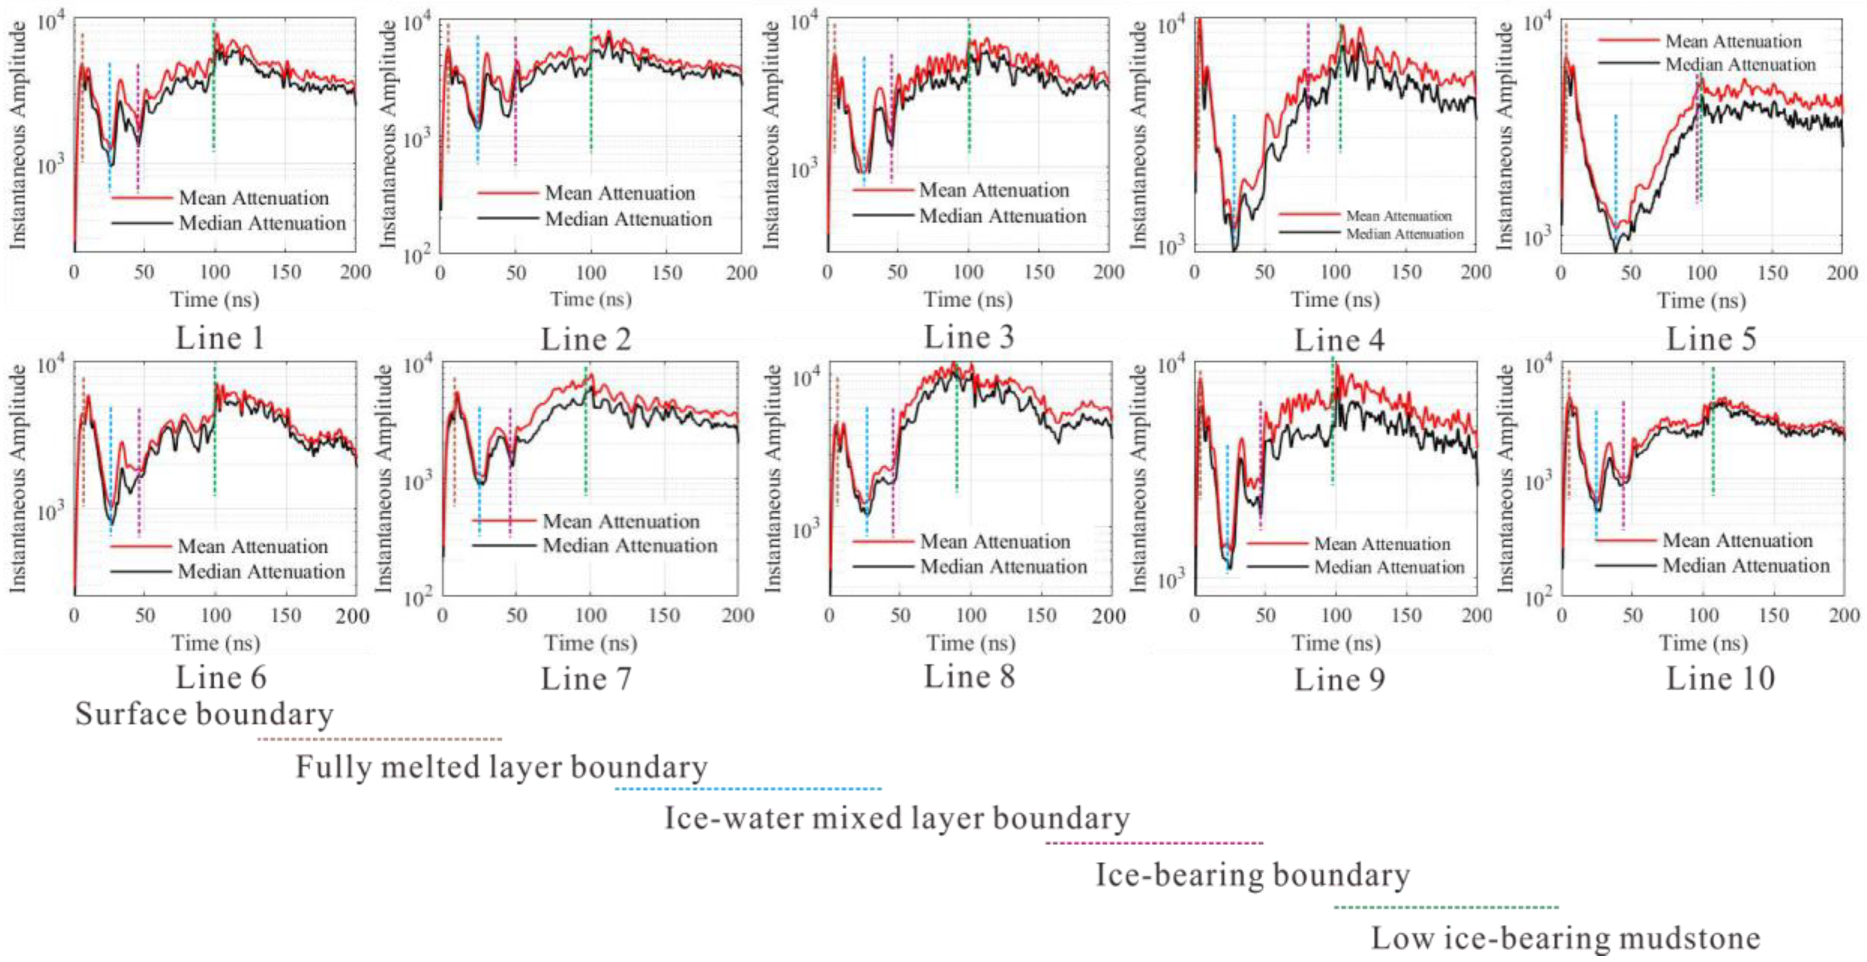
Due to the presence of unmelted frozen soil, there is a strong reflection amplitude in the ice-water mixed layer. However, this strong reflection amplitude event does not show good continuity and traceability, and cannot be used as a basis for layer division. The variation in amplitude energy attention trend can supplement the deficiency of using only strong amplitude for layer division. The amplitude energy attenuation calculation is performed on the processed data. The brown, blue, purple, and green dashed lines in
Figure 18, respectively, represent the turning points of the trend of amplitude energy attenuation.
The change in attenuation trend is directly related to electromagnetic wave parameters such as the dielectric constant of the soil medium. Because the amplitude event can divide the strata, the amplitude energy attention is a supplement and evidence to the division result of the amplitude event. In
Figure 18, it can be seen that the slope of the amplitude energy absorption trend in different layers is different, and some show significant positive and negative differences. Changes in this value reflect changes in soil water content, ice content, and soil composition. Combined with the actual soil excavation data, it is analyzed that the brown, blue, purple, and green dashed lines represent the boundary of the surface layer boundary, the fully melted layer boundary, the ice-water mixed layer boundary, and the ice-bearing boundary, respectively. Due to the large amount of water at the bottom of the thaw-slum** body and the accumulation of more melted soil, the depth of the ice-water mixed layer at the bottom of the landslide body measured by Line 4 and Line 5 continues to deepen and approach the boundary of the ice-bearing layer.
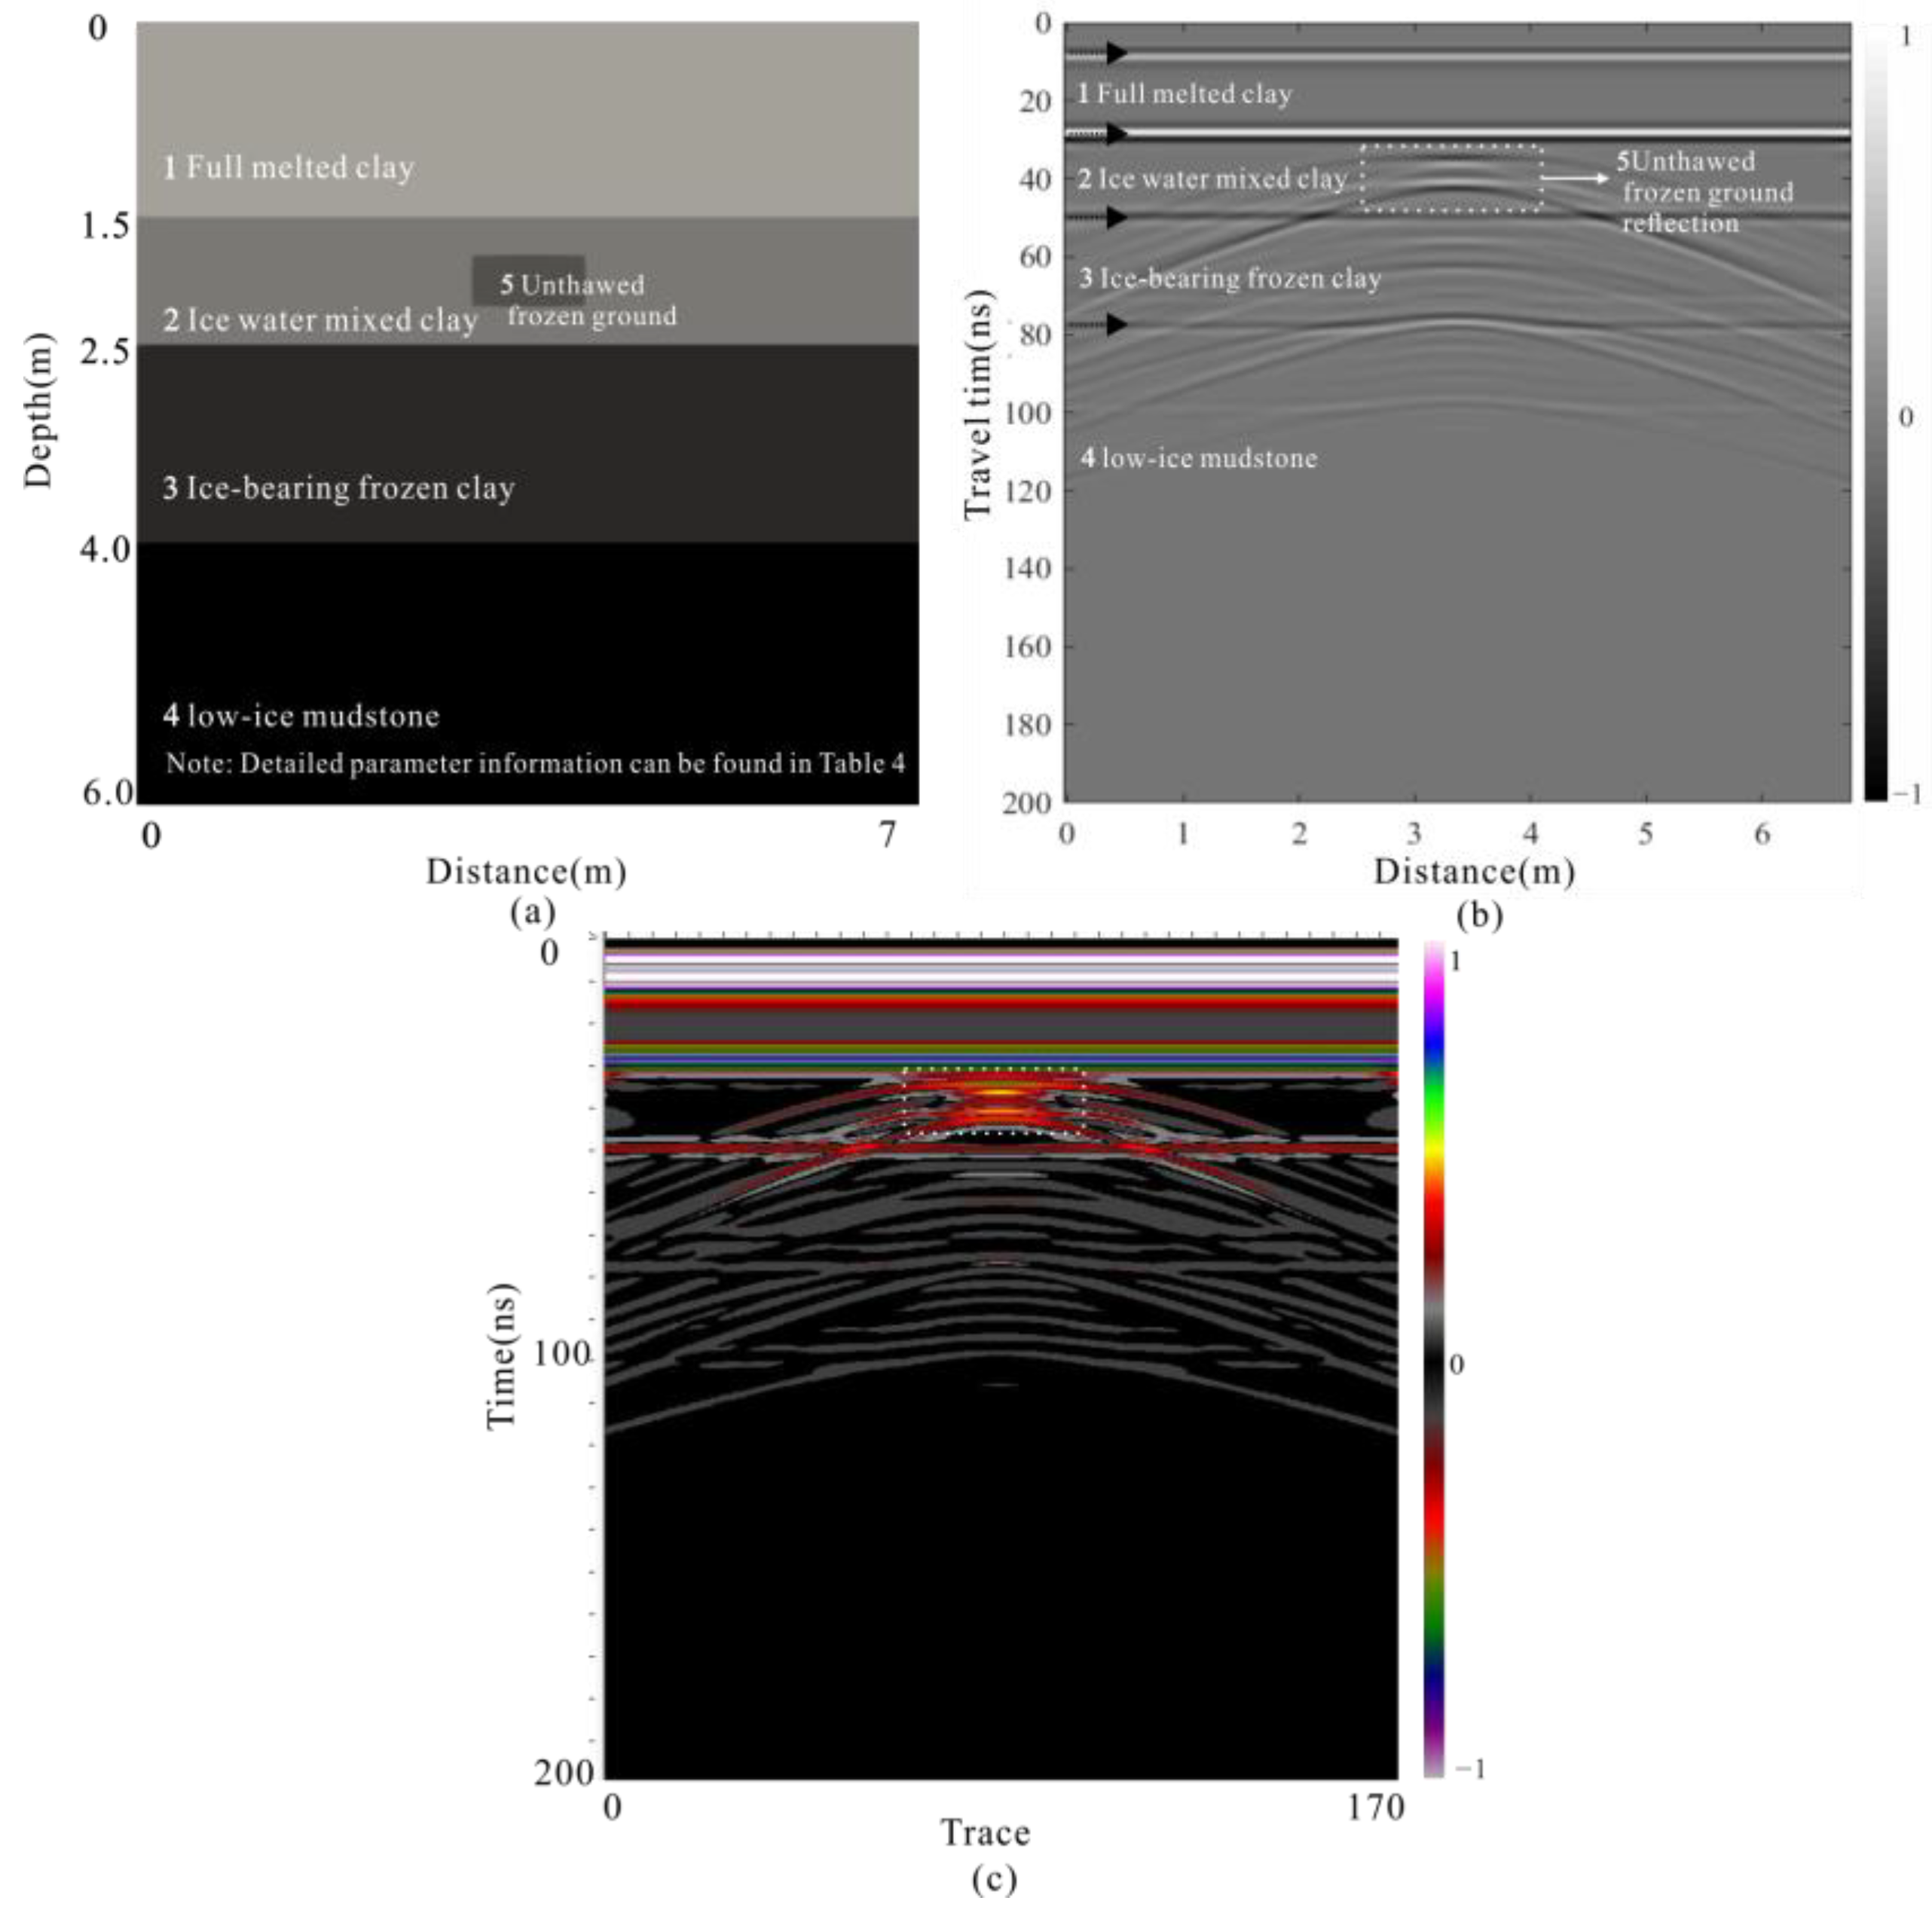
After completing the noise suppression of the data, we found that there are still strong reflection echoes in the complete ablation zone in the data. These strong reflections come from the unthawed frozen soil, and its dielectric constant is quite different from the physical properties of the surrounding medium.
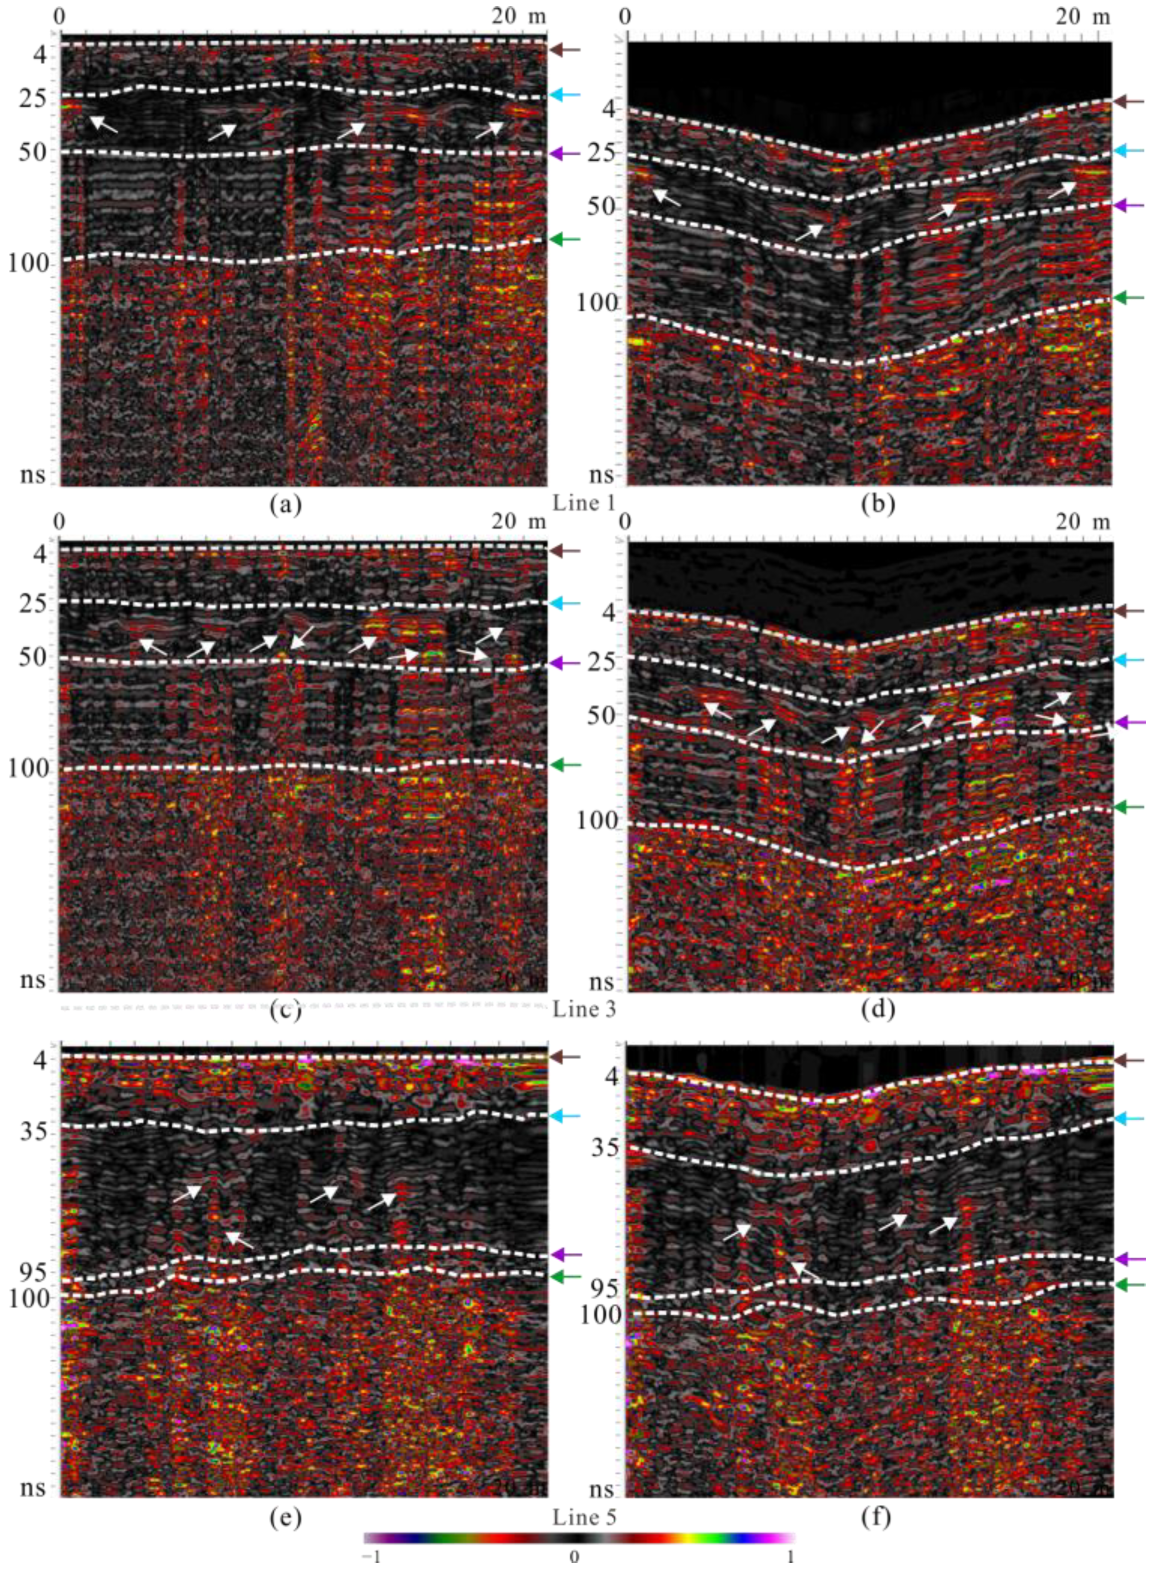
Figure 19 shows the amplitude profiles of Line 1, Line 3, and Line 5. Among them, (a), (c), (e) and (b), (d), (f) correspond to the data, respectively. The (a), (c), and (e), respectively, show the amplitude B-scans of Line 1, Line 3, and Line 5 without elevation correction, which are used to supplement the analysis of soil structure changes and layer division. The white dashed line shows the layered boundary of the soil. The colored arrow on the right side of the white dotted line represents the layered boundary in
Figure 18, and its color represents the same meaning as
Figure 10. Each white dashed line corresponds to a border represented by a color. It can be seen from the amplitude profile that the layer tracked by the amplitude event axis is completely consistent with the layer divided in
Figure 18. The white arrows in
Figure 19 indicate strong reflections in the overall weak reflection background of the ice-water mixed layer. These strong reflections are related to the ice content in the soil medium. Frozen soil that has not been melted shows strong amplitude reflections in electromagnetic wave imaging. In addition, cracks appeared in the soil on the surface of the thaw-slum** due to melting and collapse, and water flowed to the deep part of the soil and the bottom of the thaw-slum**. Strong reflections also appeared in the soil above the boundary of the completely melted layer indicated by the blue arrow. These reflections are related to the undulating and dry cracking characteristics of the topsoil.
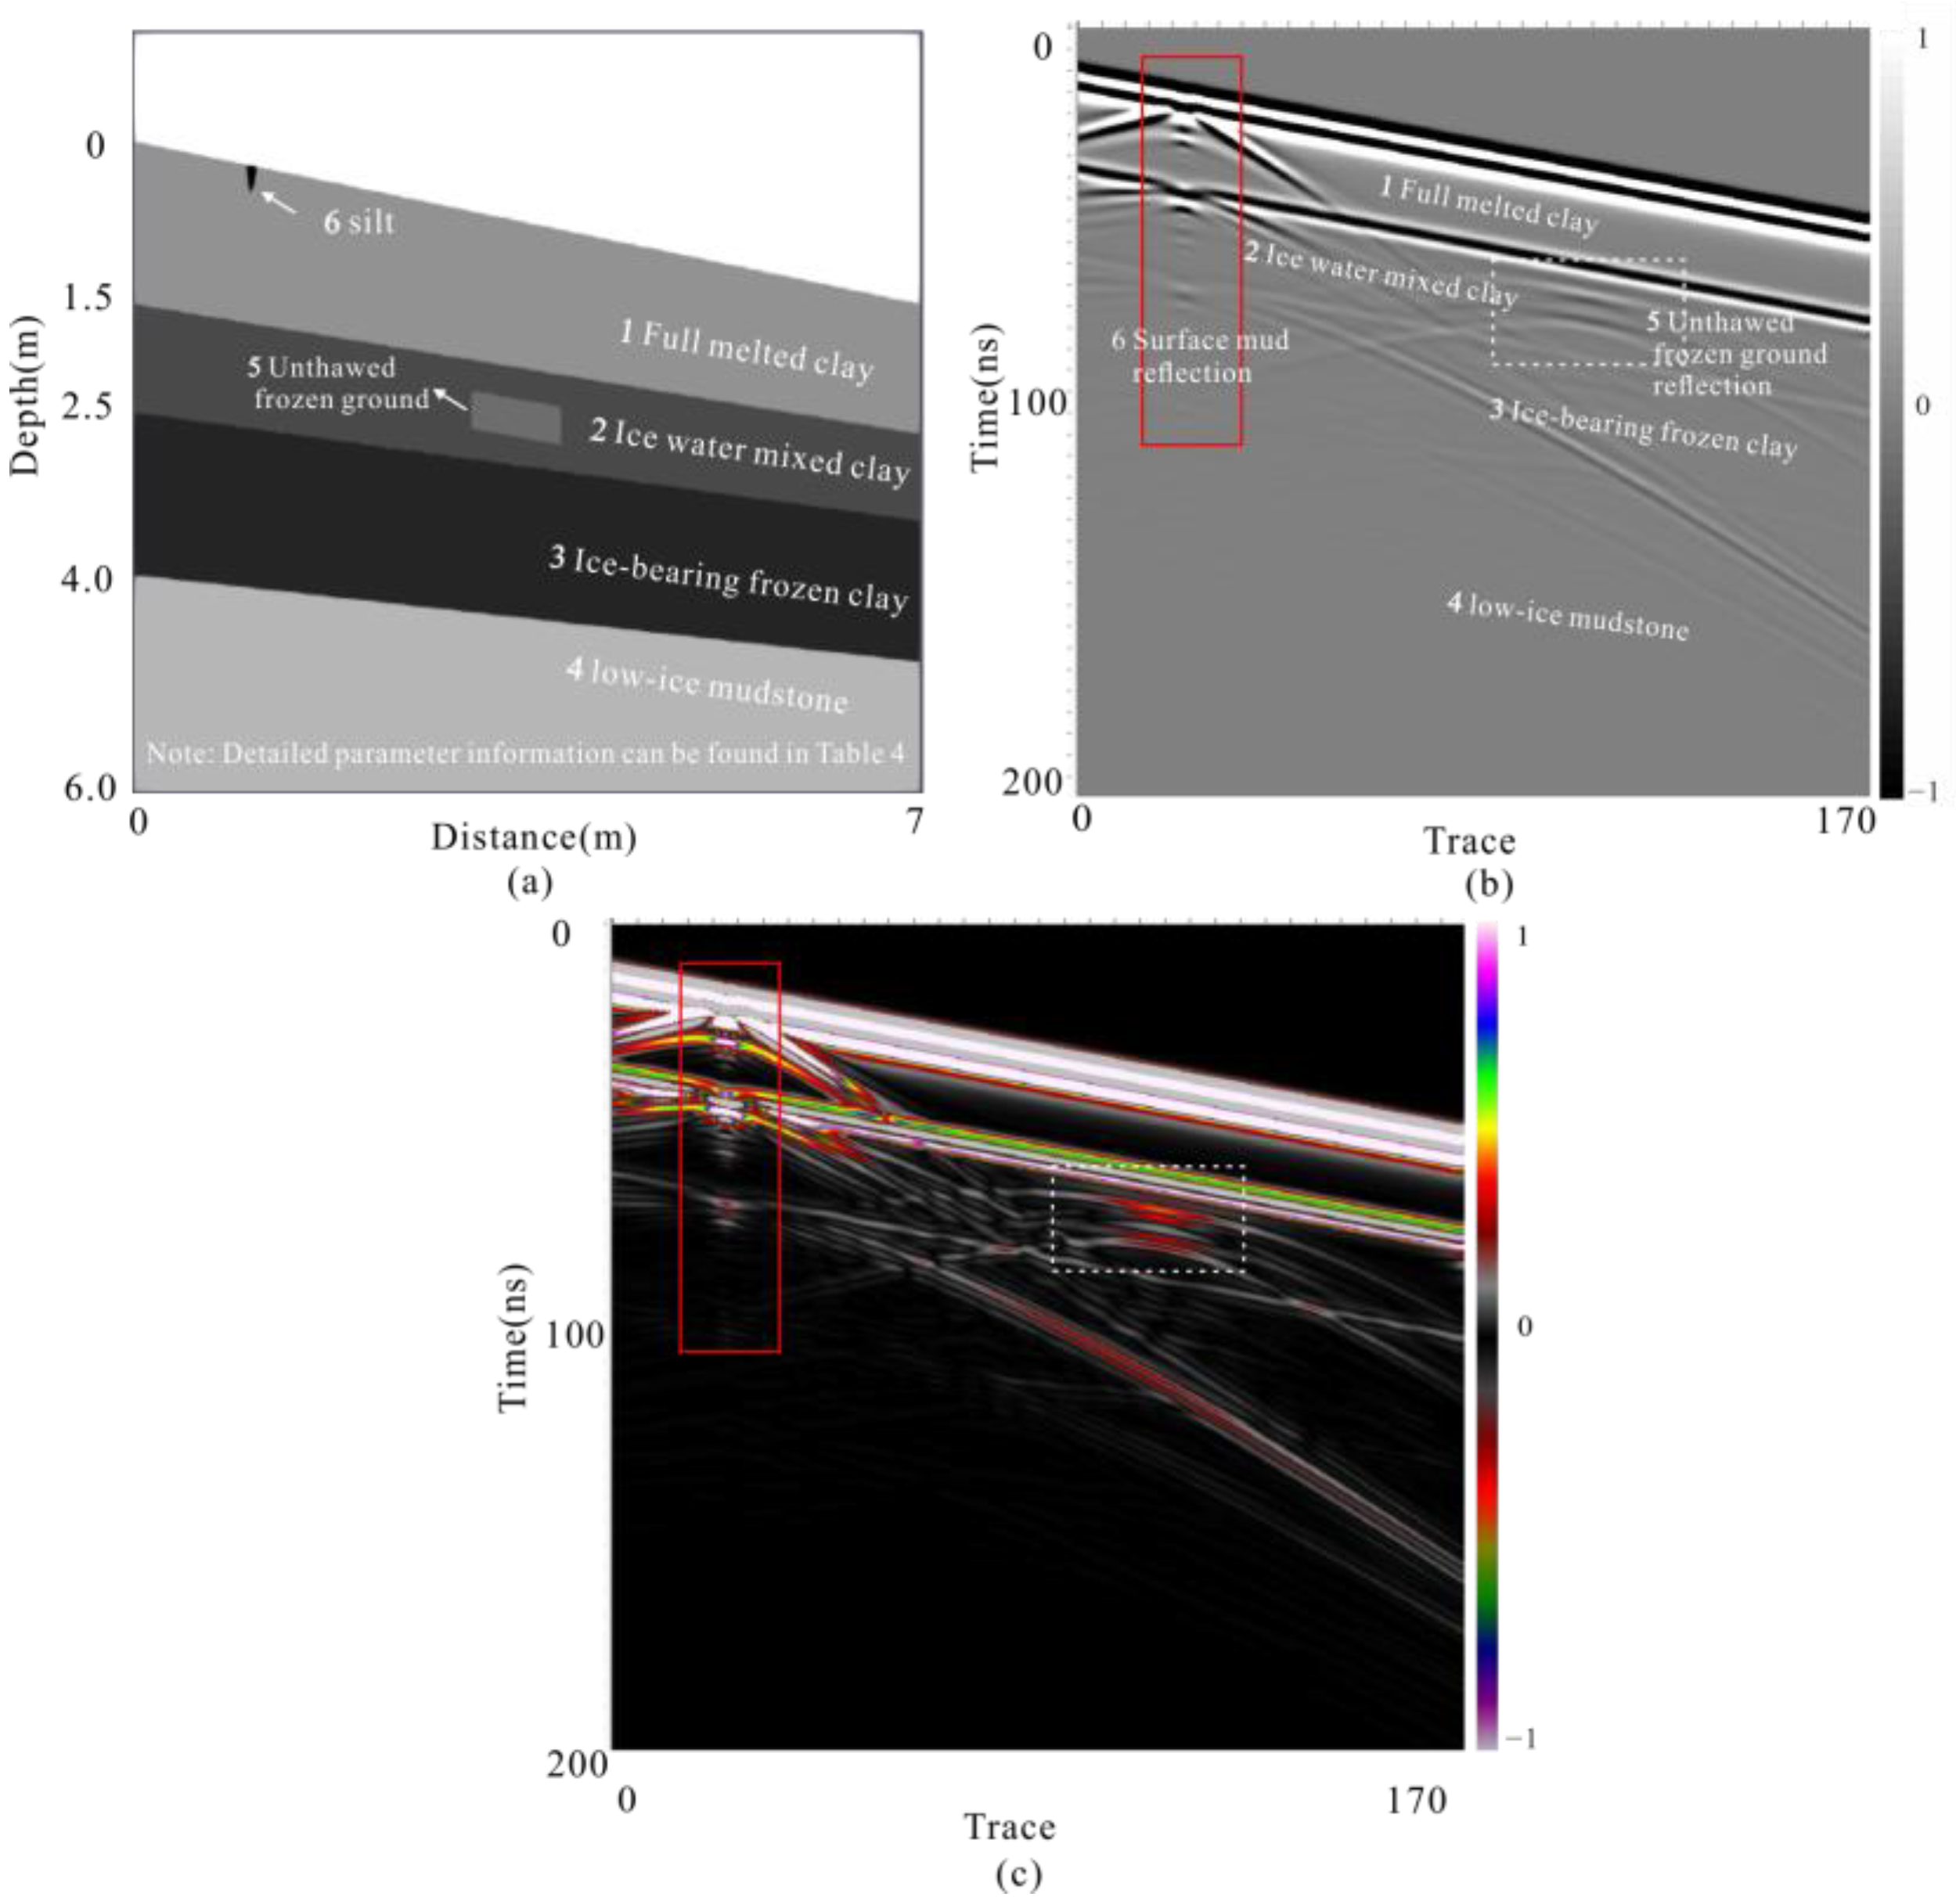
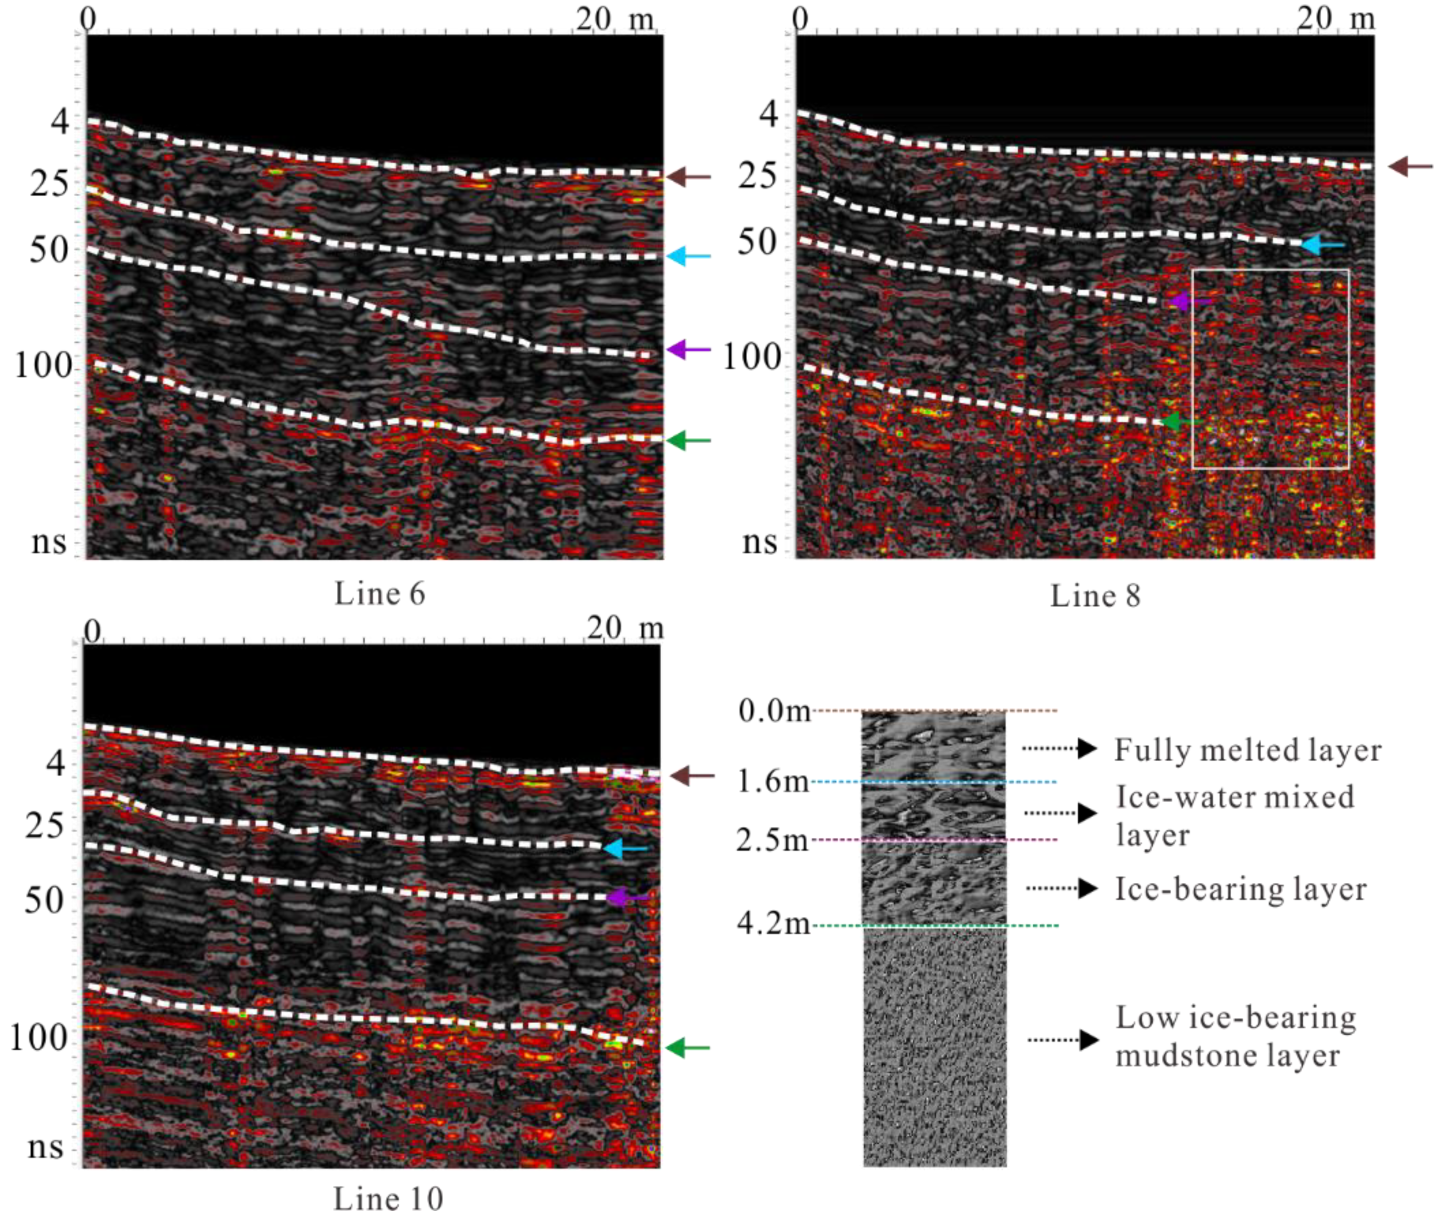
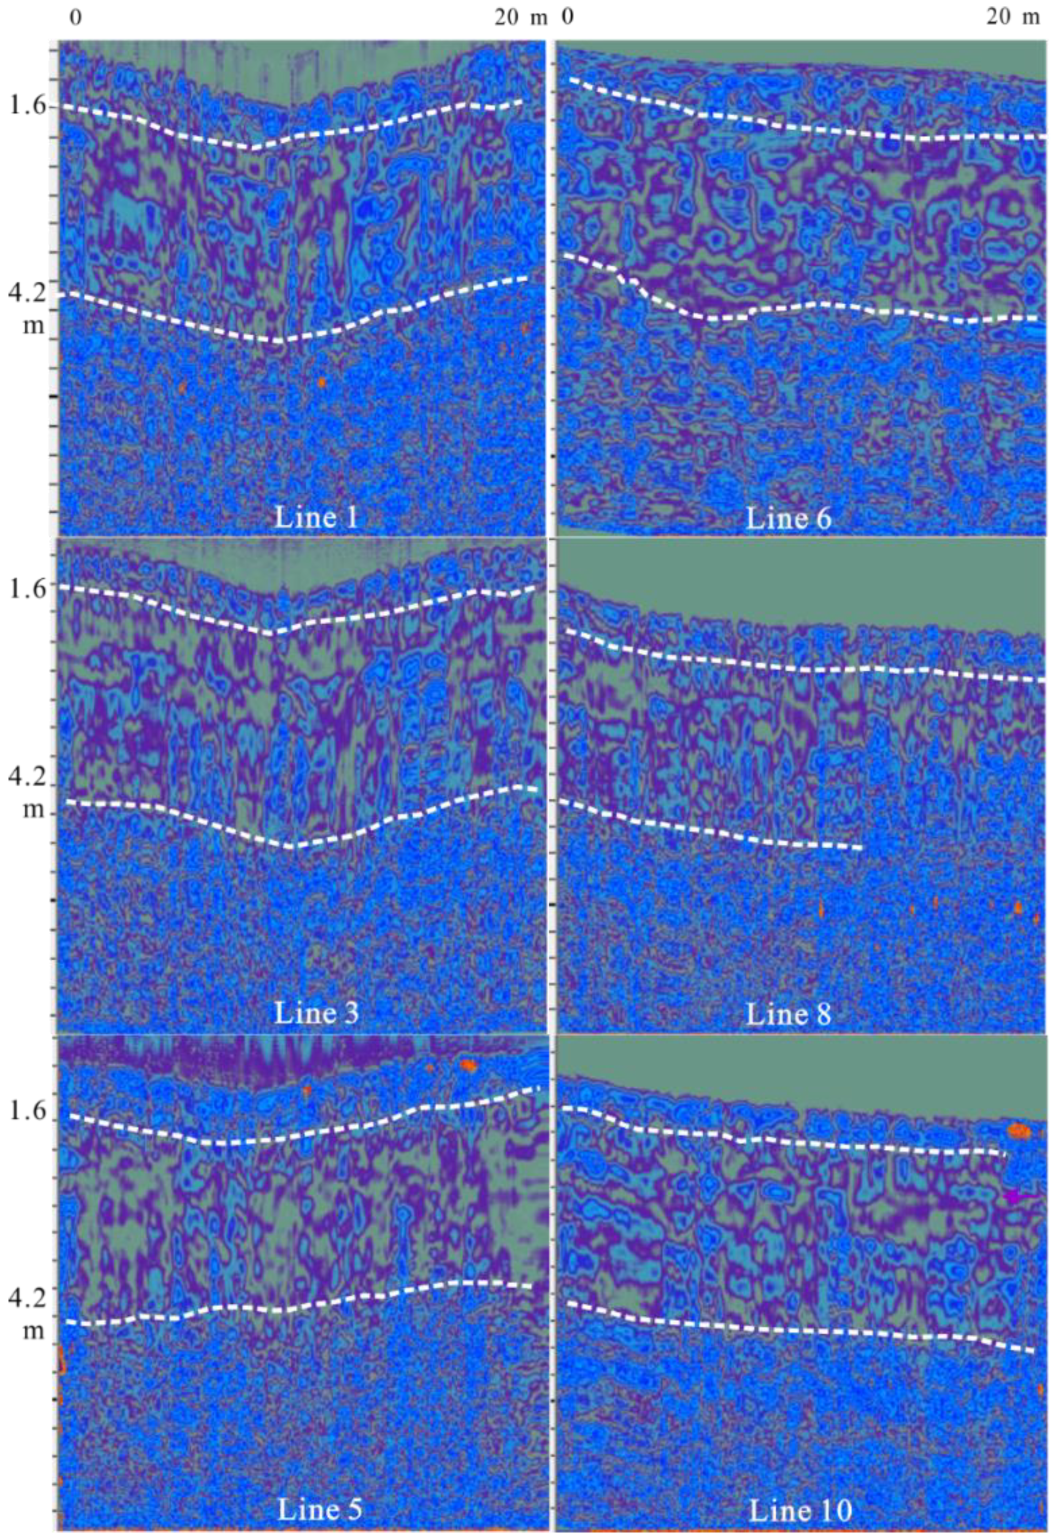
Figure 20 shows the amplitude B-scan of line 6, Line 8, and Line 10. The layer divided by the white dashed line in the figure is consistent with the layer represented by the colored arrows. Due to the accumulation of water at the bottom of the thaw-slum** and the melting and accumulation of soil, the layer divided by the white dashed line becomes deeper on the right side of each section (the bottom of the thaw-slum**), especially the boundary of the ice-water mixed layer. Survey Line 8 is at the position of the central axis of the thaw-slum**, and the Line 8 profile in
Figure 20 shows that the boundary of the ice-water mixed layer at the bottom of the landslide has become blurred (white box). Combined with the actual soil excavation data, we layered the soil of the thaw-slum**. The thaw-slum** can be divided into a fully melted layer, an ice-water mixed layer, an ice-bearing layer, and a low-ice mudstone layer.
3.2. Relative Water Content Analysis
The water content calculation of thaw-slum** is an important part of GPR. Temperature is the main factor affecting the water content of frozen soil.
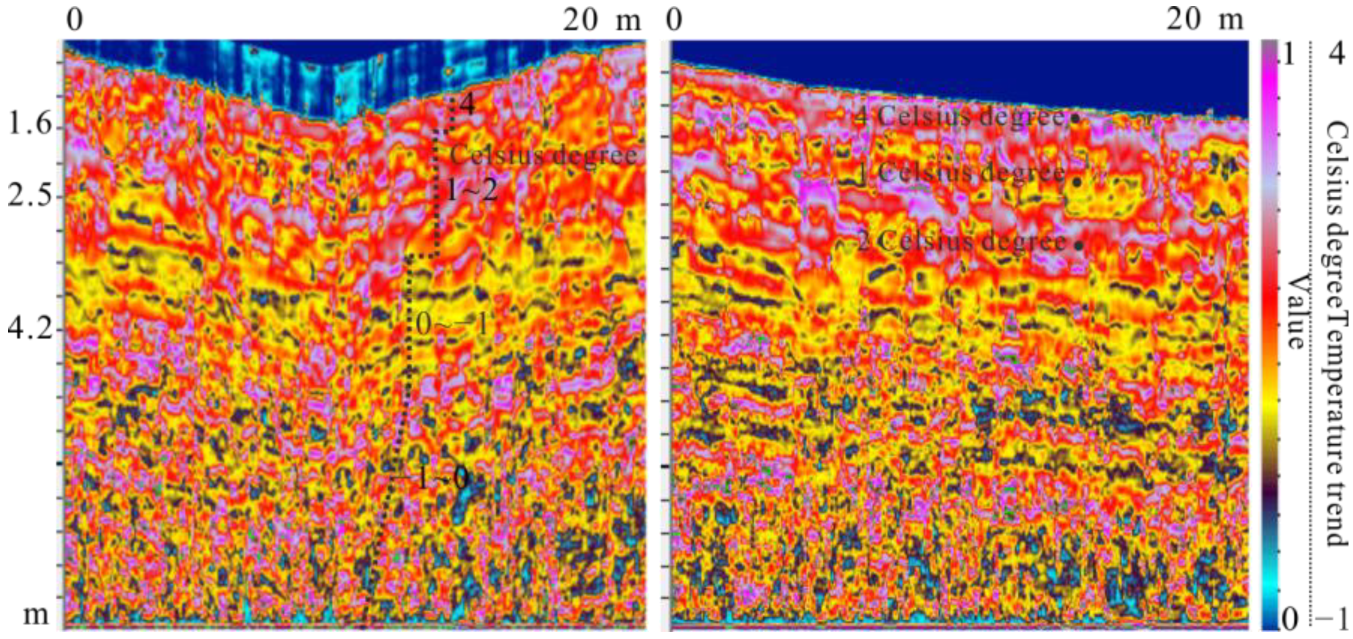
Figure 21 shows the soil temperature trend profile measured by the vertical and horizontal lines. The surface temperature of the soil is higher, and downward due to the presence of frozen soil, the temperature becomes lower. The black dashed line in
Figure 21 shows the trend of temperature change. The black dots display the actual measured temperature value (measured to a depth of 3 m). There is a good correlation between the value of the weighted average frequency attribute (0–1) and the temperature (−1–4 degrees Celsius).
Figure 22 shows the profiles of the sweetness attributes of different survey lines. Blue shows sandy mudstone soils with low water content. Due to the erosion of water, the dielectric constant of sandy mudstone soil with high water content tends to be close to that of wet mudstone. Purple to gray shows sandy mudstone soil with increasing water content.
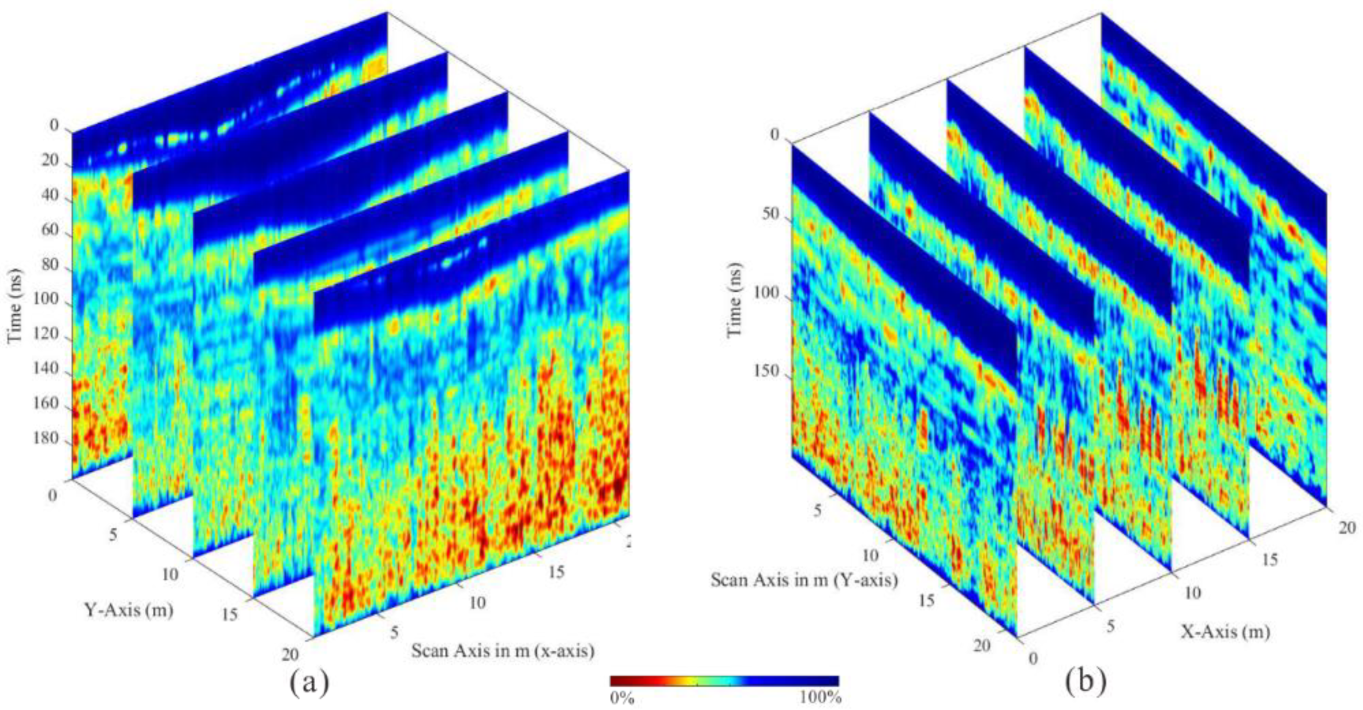
Figure 23 shows the relative water content 3D profile of different line data. Because in the research of thaw-slum** water content calculation, the main concern area is the fully melted layer, ice-water mixed layer, and ice-bearing layer between 10 and 110 ns. The changing trend of relative water content is consistent with the actual water content change characteristics of the thermal melt landslide. At present, in this landslide area, referring to the actual temperature data, it is found that the calculated relative water content is in line with the actual law in this region. To analyze the release and distribution of water content inside the thaw-slum** from a plane, we performed time slice processing on the data.
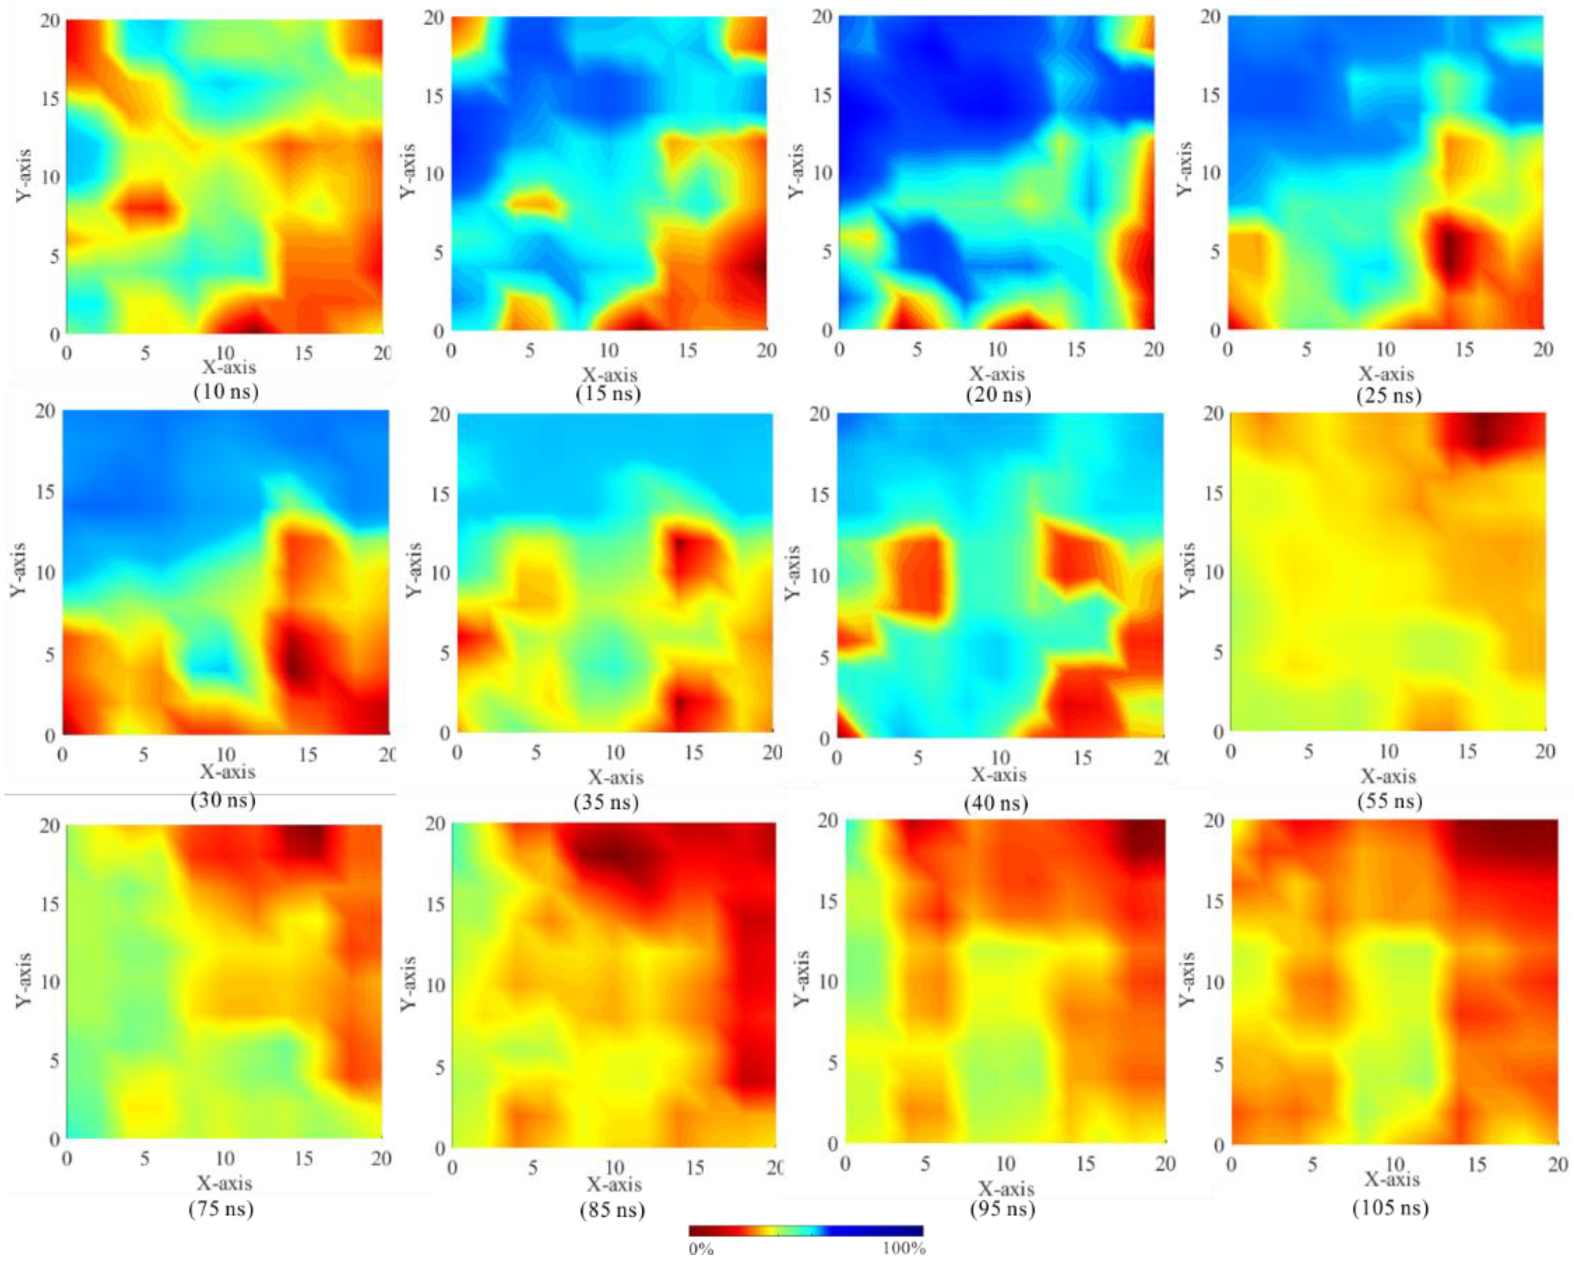
Figure 24 shows the time slice characteristics of relative water content at different depths of time. Blue represents high relative water content and red represents low relative water content. Based on the comparison with the actual sample moisture content data (0–1.5 m, six moisture probes), the changing trend of relative water content is consistent with the actual water content change characteristics of the thermal melt landslide. The calculated relative water content can truly reflect the relative size of the soil water of the landslide body.
Before 10 ns, surface soil water loss and crack development, its relative water content is low, and there is local water accumulation. As the depth increases (10–25 ns), the relative water content in the fully melted layer continues to increase, and there are local soil cracks and water loss. In the time depth between 25 and 55 ns, due to the continuous increase of unmelted frozen soil, the relative water content in the ice-water mixed layer gradually decreases with the increase in depth. As the time depth increases (75–105 ns), the relative water content in the ice-bearing layer gradually weakens to a minimum. The profile and plane data of the relative water content show that due to the presence of a large amount of water, the thaw-slum** is most prone to the movement of the landslide body at 15–40 ns. The treatment of thaw-slum** can be accurate to the depth and the plane position with higher relative content.
4. Discussion
Thaw-slum** is widely developed along the Qinghai–Tibet Project. How to manage and repair its development in a targeted manner is the key to ensuring engineering safety and ecological safety. The division of the medium layer inside the landslide is the framework basis for the study of thaw-slum**. Because geological stratification mainly depends on geotechnical analysis and is limited to single-point analysis. GPR data stratigraphic division interpretation not only depends on geological information but also can reflect the change in the dielectric constant of the formation. The division of the media with the same lithology but a different dielectric constant is more detailed. The comprehensive use of GPR data and geological data can more accurately classify the underground media layer of thaw-slum**. Research shows that amplitude and amplitude attenuation can layer the medium well. However, stratification requires the combination of geological and engineering theoretical foundations in frozen soil areas, and the internal structure of a thaw-slum** cannot be judged solely from the electrical properties of electromagnetic waves. In addition, due to the extensive development of water and cracks on the surface of the landslide, ensuring the accuracy and signal-to-noise ratio of radar data collection is also a key guarantee for data analysis. The results of this study show that there is a mixture of ice and water in the internal structure of the landslide. This phenomenon is caused by the cracks on the surface of the landslide and the inhomogeneity of the ablation of frozen soil. The resulting anisotropic characteristics are more likely to cause mechanical instability at the bottom of the thaw-slum**.
Water content calculation and water distribution characteristics are one of the key parameters in the engineering research of thaw-slum**. Although GPR data cannot provide an absolute value of water content. Fortunately, changes in the water content of the soil lead to changes in the electrical properties of the medium, which affects the propagation characteristics of electromagnetic waves. These characteristics can be well reflected in the GPR radar data. Through mathematical analysis and statistics, the electromagnetic wave attribute parameters that are sensitive to water content can be screened. These attribute parameters have certain applicability in a region. In other areas, it is not fully applicable.
In addition, to obtain absolute and accurate water content values, multi-point borehole soil analysis and model-based inversion technology should be combined. By obtaining the structural frame, water content, temperature, and other parameters of the landslide body, a geotechnical numerical model of the landslide body can be constructed. By simulating the mechanical distribution characteristics, the instability research of thaw-slum** bodies will be more in-depth. The GPR should monitor the landslide body for a long time in the same month of each year. Due to the study of the change in the thaw-slum**, the formation of 4D data will have more academic and practical application value.
5. Conclusions
We provide a layer-division method for using the GPR data to carry out thaw-slum** on the Tibetan Plateau. Amplitude analysis and electromagnetic wave amplitude attenuation attributes are used to make a more detailed imaging division of the thaw-slum**. The medium in the thaw-slum** is divided into a finer four-layer structure. They are a fully melted layer, an ice-water mixed layer, an ice-bearing layer, and a low-ice-bearing sand mudstone layer.
To maximize the reduction of the expansion error caused by the participation of noise in the data calculation, the amplitude attribute of the reflection intensity change caused by the change in the dielectric constant of the reaction medium is selected as a parameter for calculating the relative water content. Noise and short-wavelength issues can interfere with the instantaneous frequency analysis, therefore affecting the interpretation of the data. Using weighted average frequency can weaken this effect. The weighted average frequency attribute can reflect temperature change trends, which can be used as another parameter to calculate the relative water content.
Due to the change in soil water content, the soil’s physical properties change. The sweetness attribute can be used to distinguish the changes in soil physical properties caused by changes in water content. The relative water content calculated by combining these attributes is in good agreement with the actual measured value. These methods and results data are valuable for the characterization, evaluation, and treatment of thaw-slum**.


