1. Introduction
Above-ground biomass (AGB) [
1] reflects the status of crop growth and is related to solar energy utilization, yield and grain quality [
2,
3]. Therefore, AGB is considered one of the most important biochemical crop parameters [
4,
5,
6], and correct estimation of AGB can help improve crop monitoring and yield prediction [
7]. Estimation of AGB is also important for ecological research at regional and global scales [
8] and has been employed in global carbon cycle [
9,
10,
11] and climate change [
12,
13,
14] studies.
Manual methods for measuring AGB are time consuming and destructive. Prior to the emergence of remote sensing technology, large AGB surveys were limited by labor and resources [
4,
5,
6]. Hyperspectral technology has shown great potential for monitoring of crop parameters [
15,
16]. Hyperspectral sensors can obtain spectral features based on radiation from visible to near-infrared wavelengths, and advancements in technology have increased the number of features that can be collected [
17,
18,
19]. Spectral features and indices are important variables for estimating hyperspectral crop parameters [
20,
21,
22,
23,
24,
25,
26], and many studies have estimated AGB using a combination of narrow spectral bands and vegetation indices [
27,
28,
29].
The development and application of unmanned aerial vehicles (UAVs) as remote sensing platforms [
15,
30,
31,
32] have increased rapidly over the past decade. Additionally, UAVs can obtain remote sensing images with higher temporal, spatial and ground resolution than satellites. Small-sized remote sensing sensors can be mounted on UAVs, making UAV platforms increasingly popular in agricultural applications [
15,
31]. Use of UAVs in agricultural and environmental applications has numerous advantages compared with conventional aerial vehicles, including lower cost, weight, flight speed and flight altitude [
15].
Previous studies have proposed various methods and sensors for agricultural monitoring based on UAV remote sensing. The results of Ribeiro et al. [
33] (geometric products), Bendig et al. [
34,
35] (plant height, biomass) and Jannoura et al. [
36] (LAI) indicated that digital cameras with visible and infrared spectra are efficient and flexible for monitoring agricultural crop parameters. Berni et al. [
37] suggested that thermal infrared cameras mounted on UAVs show potential for environmental and agricultural applications (map** canopy conductance and crop water stress). The results of Vonbueren et al. [
38], Vega et al. [
39] and Honkavaara et al. [
40] indicated that data from UAV-based spectral cameras can be used to monitor parameters (e.g., crop height, yield, aboveground biomass and nitrogen content) of various plants, such as grass, wheat and sunflowers. However, the use of UAVs for agricultural monitoring is limited by the weight of hyperspectral imaging systems, the complexity of image processing and the cost of sensors [
41,
42].
Many powerful techniques/methods had been employed by previous researchers to make full use of the hyperspectral information, such as partial least squares regression (PLSR), support vector machine regression (SVR), artificial neural network (ANN) and random forest regression (RF). The results of ** et al. [
25] (leaf water content), Fu et al. [
43] (biomass) and Nguyen et al. [
44] (rice leaf growth and nitrogen status) indicated that PLSR is efficient and flexible for hyperspectral monitoring of agricultural crop parameters. Yang et al. [
45] (LAI) and Atzberger et al. [
46] (LAI, leaf chlorophyll content, equivalent leaf water thickness) suggested that ANN has great potential for biophysical canopy variables’ estimation. Yang et al. [
47] suggested that SVM shows great potential for rice leaf area index estimation. Han et al. [
48] suggested that RF is more efficient than SVM in apple tree canopy LAI estimation. The results of Yuan et al. [
49] indicated that RF can be used to monitor the soybean leaf area index over the whole growth period.
The objective of this study was to evaluate the performance of AGB estimations based on hyperspectral data (canopy surface information) and crop height (vertical information about crop growth). A snapshot hyperspectral sensor mounted on a UAV was used to obtain hyperspectral and high-resolution panchromatic images. Using image fusion and photogrammetry, we obtained the canopy hyperspectral reflectance and crop height of winter wheat. Hyperspectral data and crop height were used to construct AGB estimation models, and model accuracy was validated with field data.
2. Materials and Methods
Winter wheat was grown on 48 plots with different amounts of nitrogen fertilizer and irrigation levels. We measured spectral features of the crops and analyzed the relationships between crop height, UHD 185 (UHD 185 firefly, Cubert GmbH, Ulm, Baden-Württemberg, Germany) spectrometer hyperspectral data, ASD Field Spec 3 spectrometer hyperspectral data and winter wheat AGB.
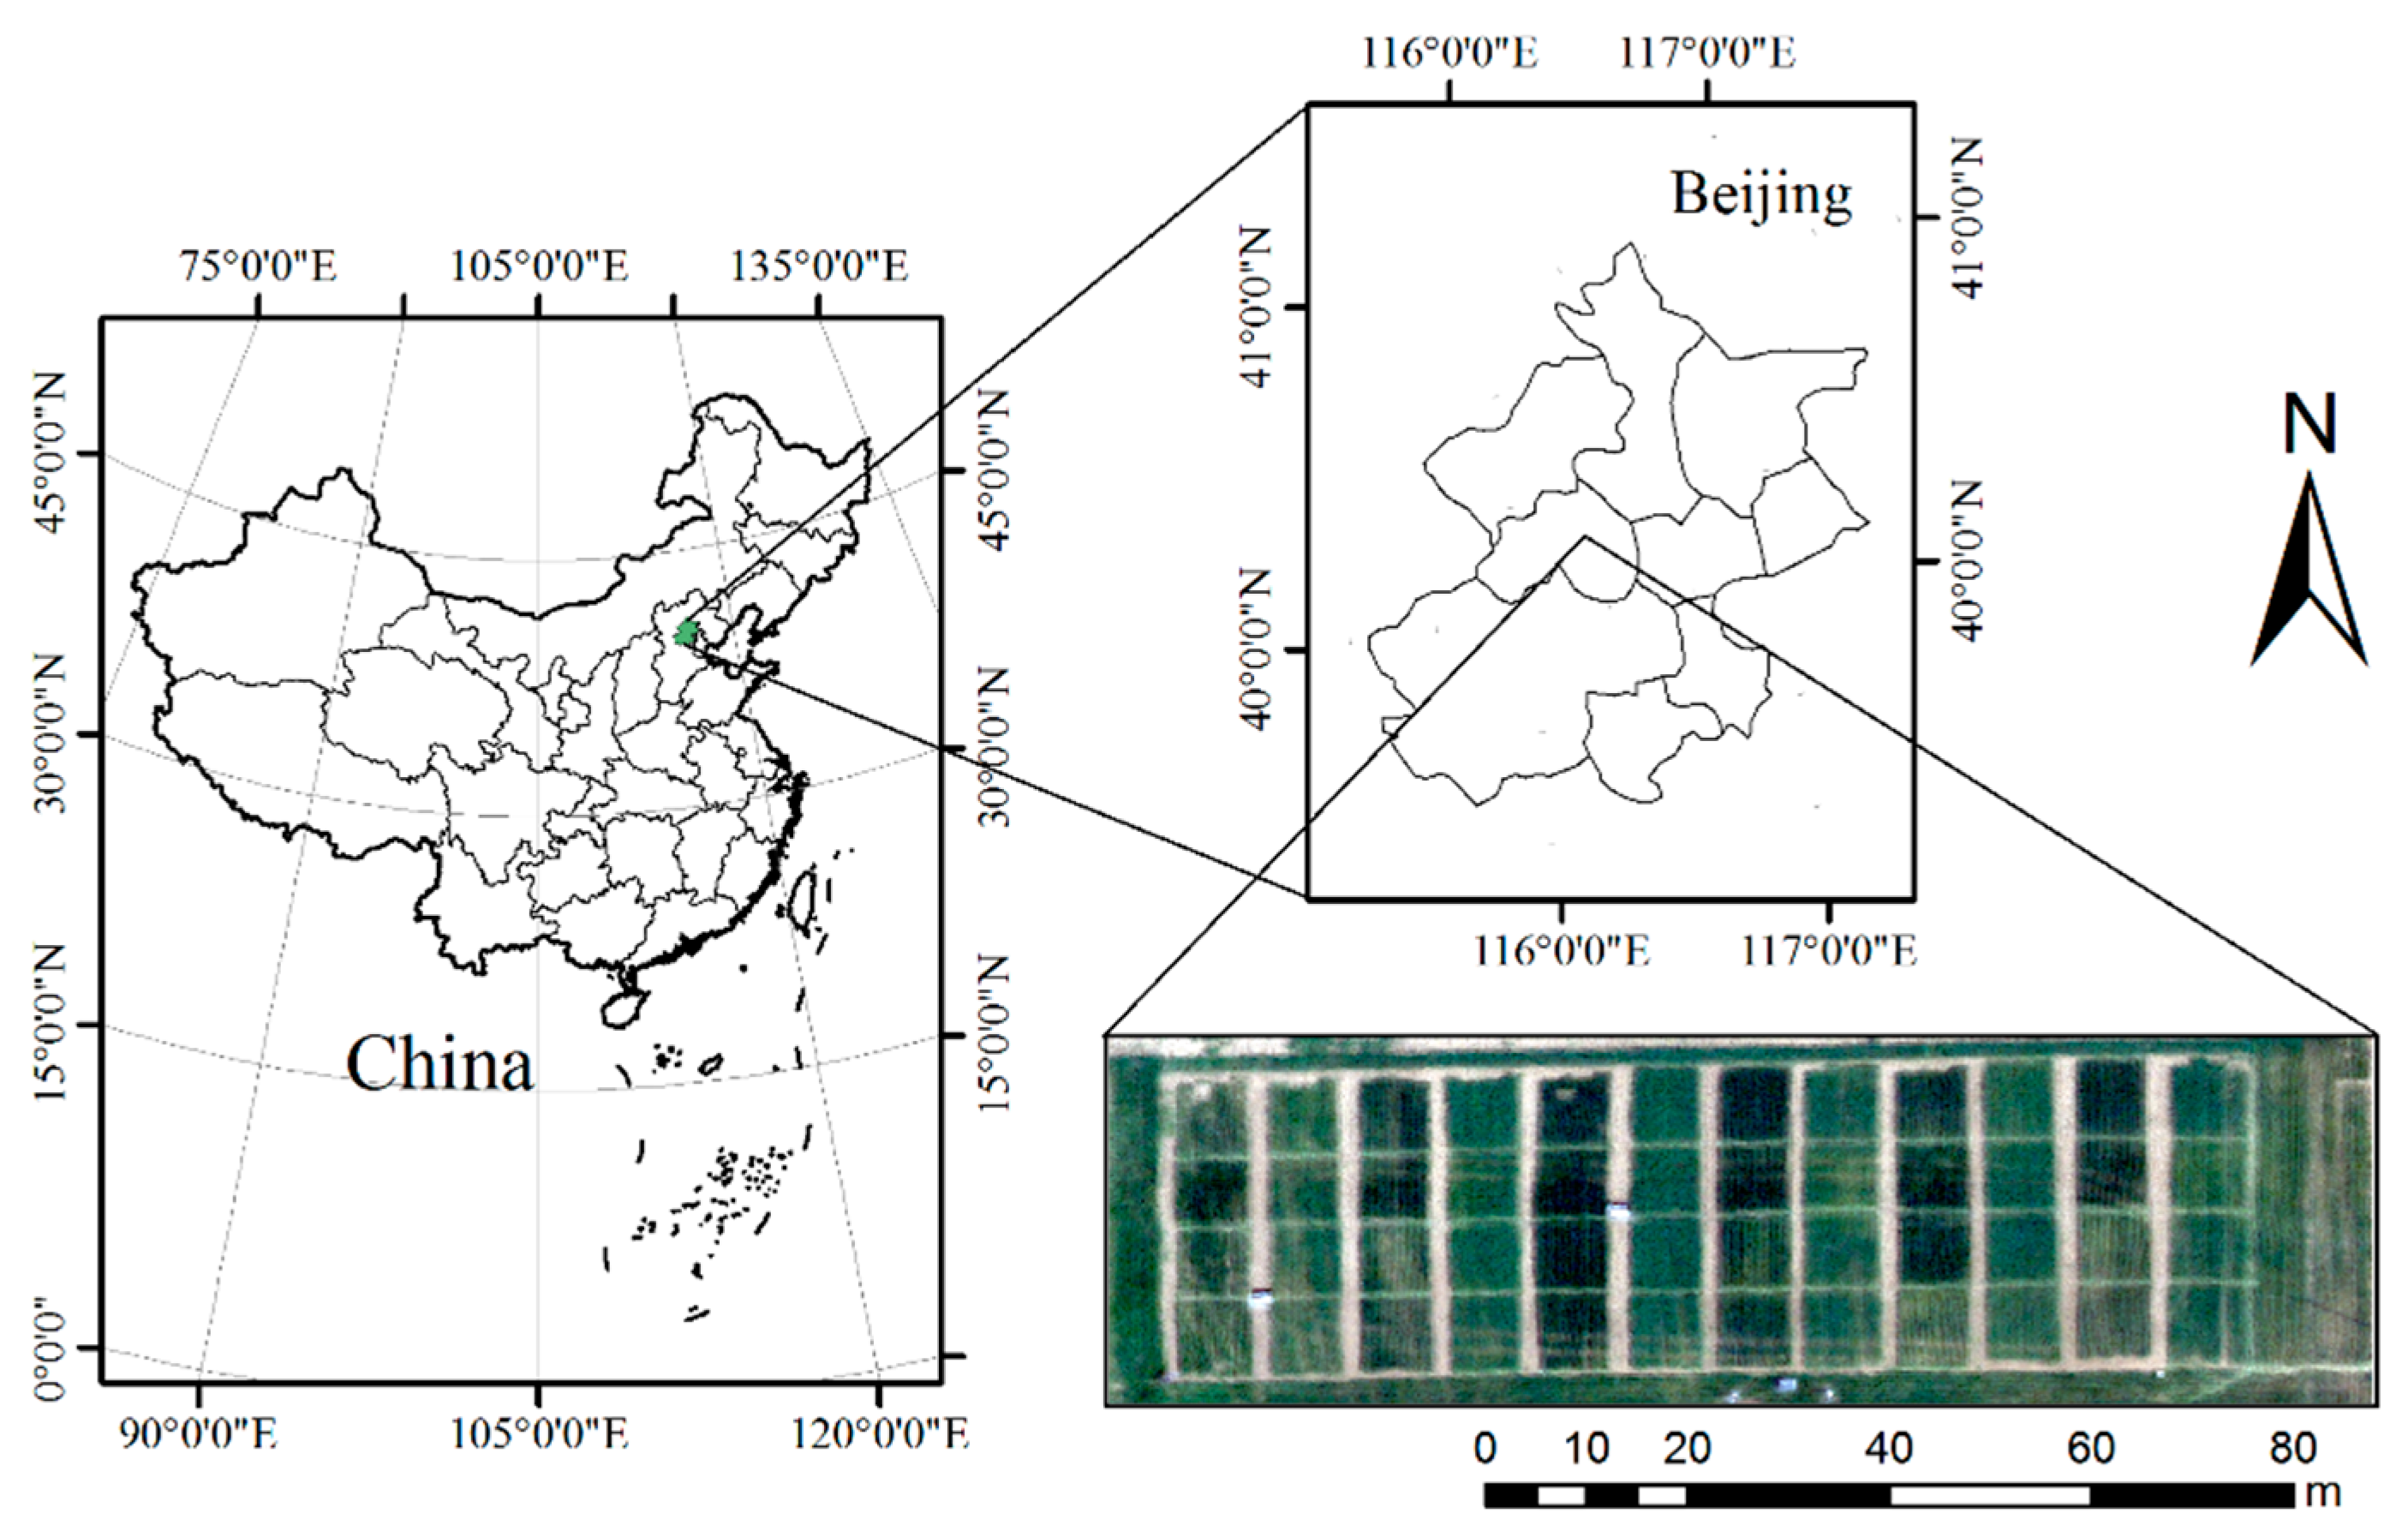
2.1. Study Area
Experiments were conducted at the ** District (115°50′17″~116°29′49″E, 40°2′18″~40°23′13″N) of Bei**g City, China (
Figure 1). Chang** District has an average altitude of 36 m, a warm temperate semi-humid continental monsoon climate, average rainfall of 450 mm, average low temperature of −10 °C–7.5 °C and an average high temperature of 35 °C–40 °C. Meteorological data were acquired from the China Meteorological Data Service [
50].
2.2. Data
2.2.1. AGB and Crop Height Measurement
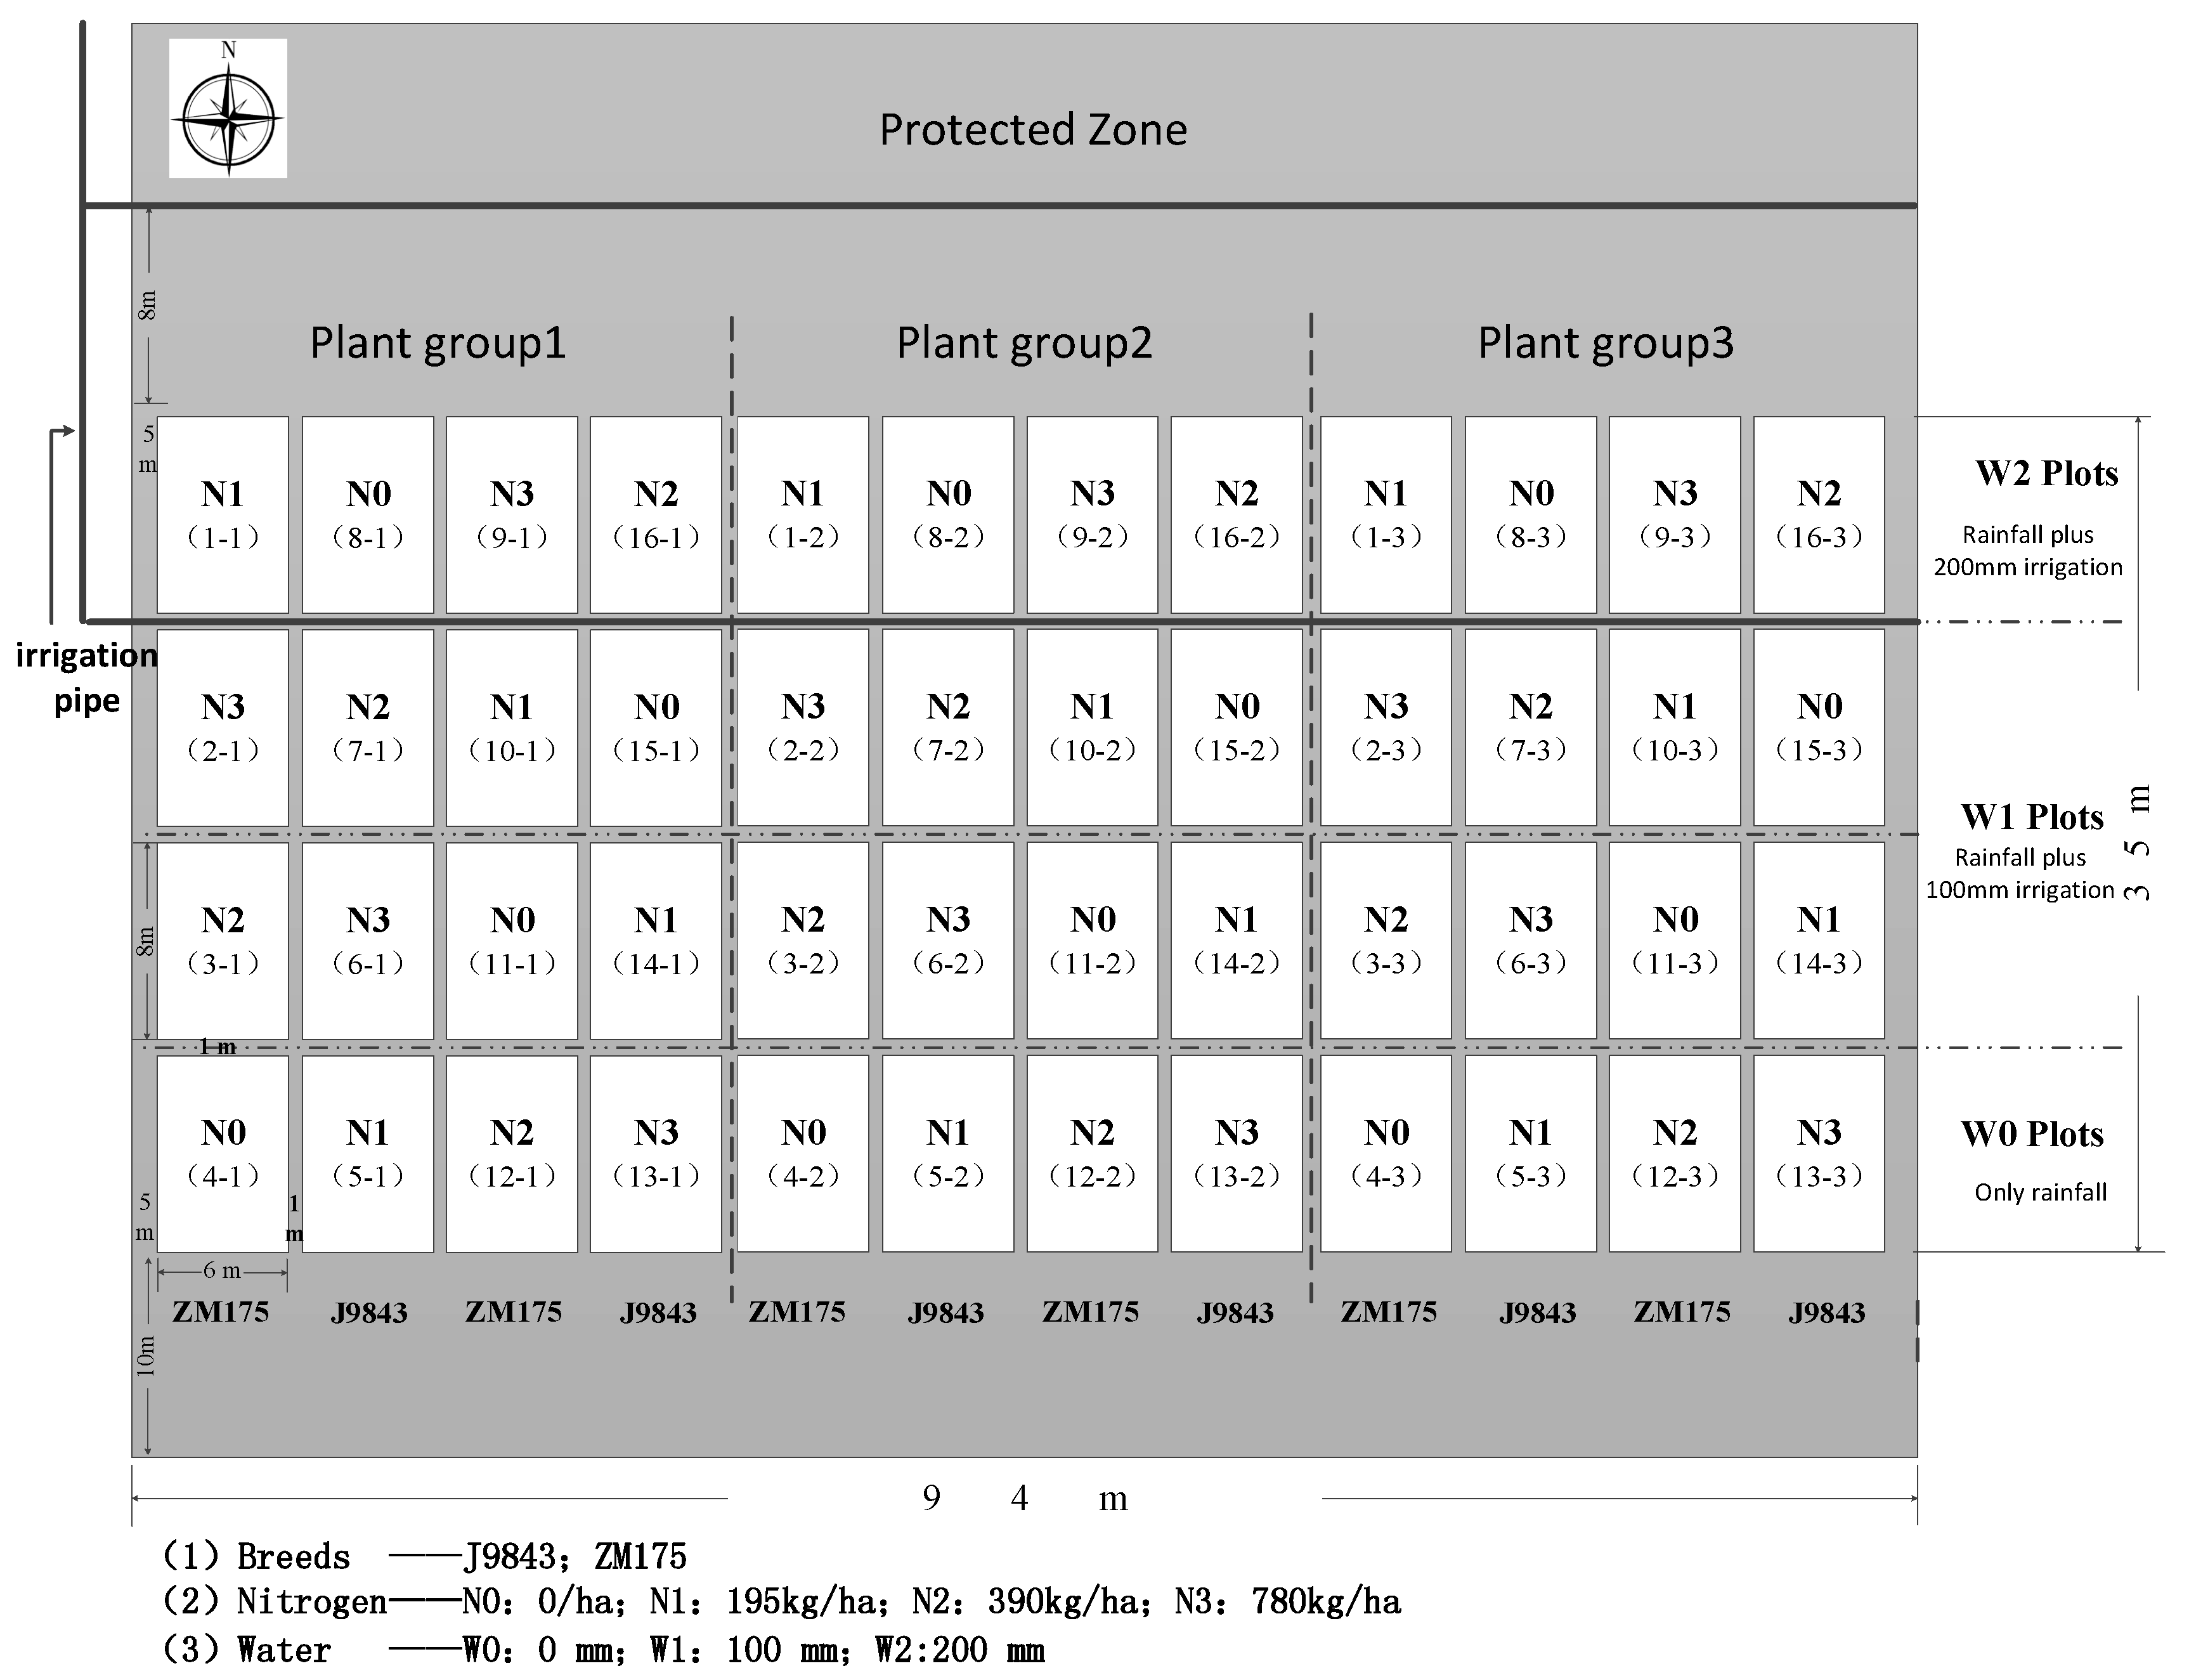
The sampling plan is shown in
Figure 2. Crops were divided into three groups, and each group included a total of 16 winter wheat samples. Samples received different levels of irrigation and nitrogen fertilizer. The irrigation levels included rainfall only (W0), rainfall plus the normal irrigation level (W1, 100 mm) and rainfall plus twice the normal irrigation level (W2, 200 mm). The nitrogen fertilizer levels included no fertilizer (N0), one-half the normal fertilization level (N1, 195 kg/ha), the normal fertilization level (N2, 390 kg/ha) and twice the normal fertilization level (N3, 780 kg/ha).
During sampling, 20 stems were collected near the center of each plot. Crop height was measured using a straightedge. Samples were taken to the laboratory for processing and stored in paper bags. Leaves and stems were dried at 80 °C to remove moisture. Until the samples became constant weight (about 24 h), the dry weight of each sample was recorded. Winter wheat AGB was calculated using Equation (1)
where
m is the dry weight of the sample,
n is the number of winter wheat ears per unit area and
l is the row spacing.
2.2.2. Snapshot Hyperspectral Sensor
The UHD 185 Firefly (UHD 185) is a new type of snapshot hyperspectral sensor, characterized by short exposure and integration time. The sensor weighs 0.47 kg, and its dimensions are 195 × 67 × 60 mm. It can obtain reflected radiation from the visible to near-infrared spectra. The sensor can capture 450–950-nm wavelengths, while maintaining a reasonable balance of image and good spectral resolution (4 nm). Radiation is recorded and processed as a 1000 × 1000 (1 band) panchromatic image and a 50 × 50 (125 bands) hyperspectral image. The acquired panchromatic images are rich in texture information, and stitching is relatively simple; however, images lack spectral information. The 50 × 50 (125 bands) hyperspectral images are characterized by rich spectral information, but lack texture information. Hyperspectral image fusion [
19] was used to splice the UHD 185 hyperspectral image. After fusion, all images were stitched together using an image stitching process.
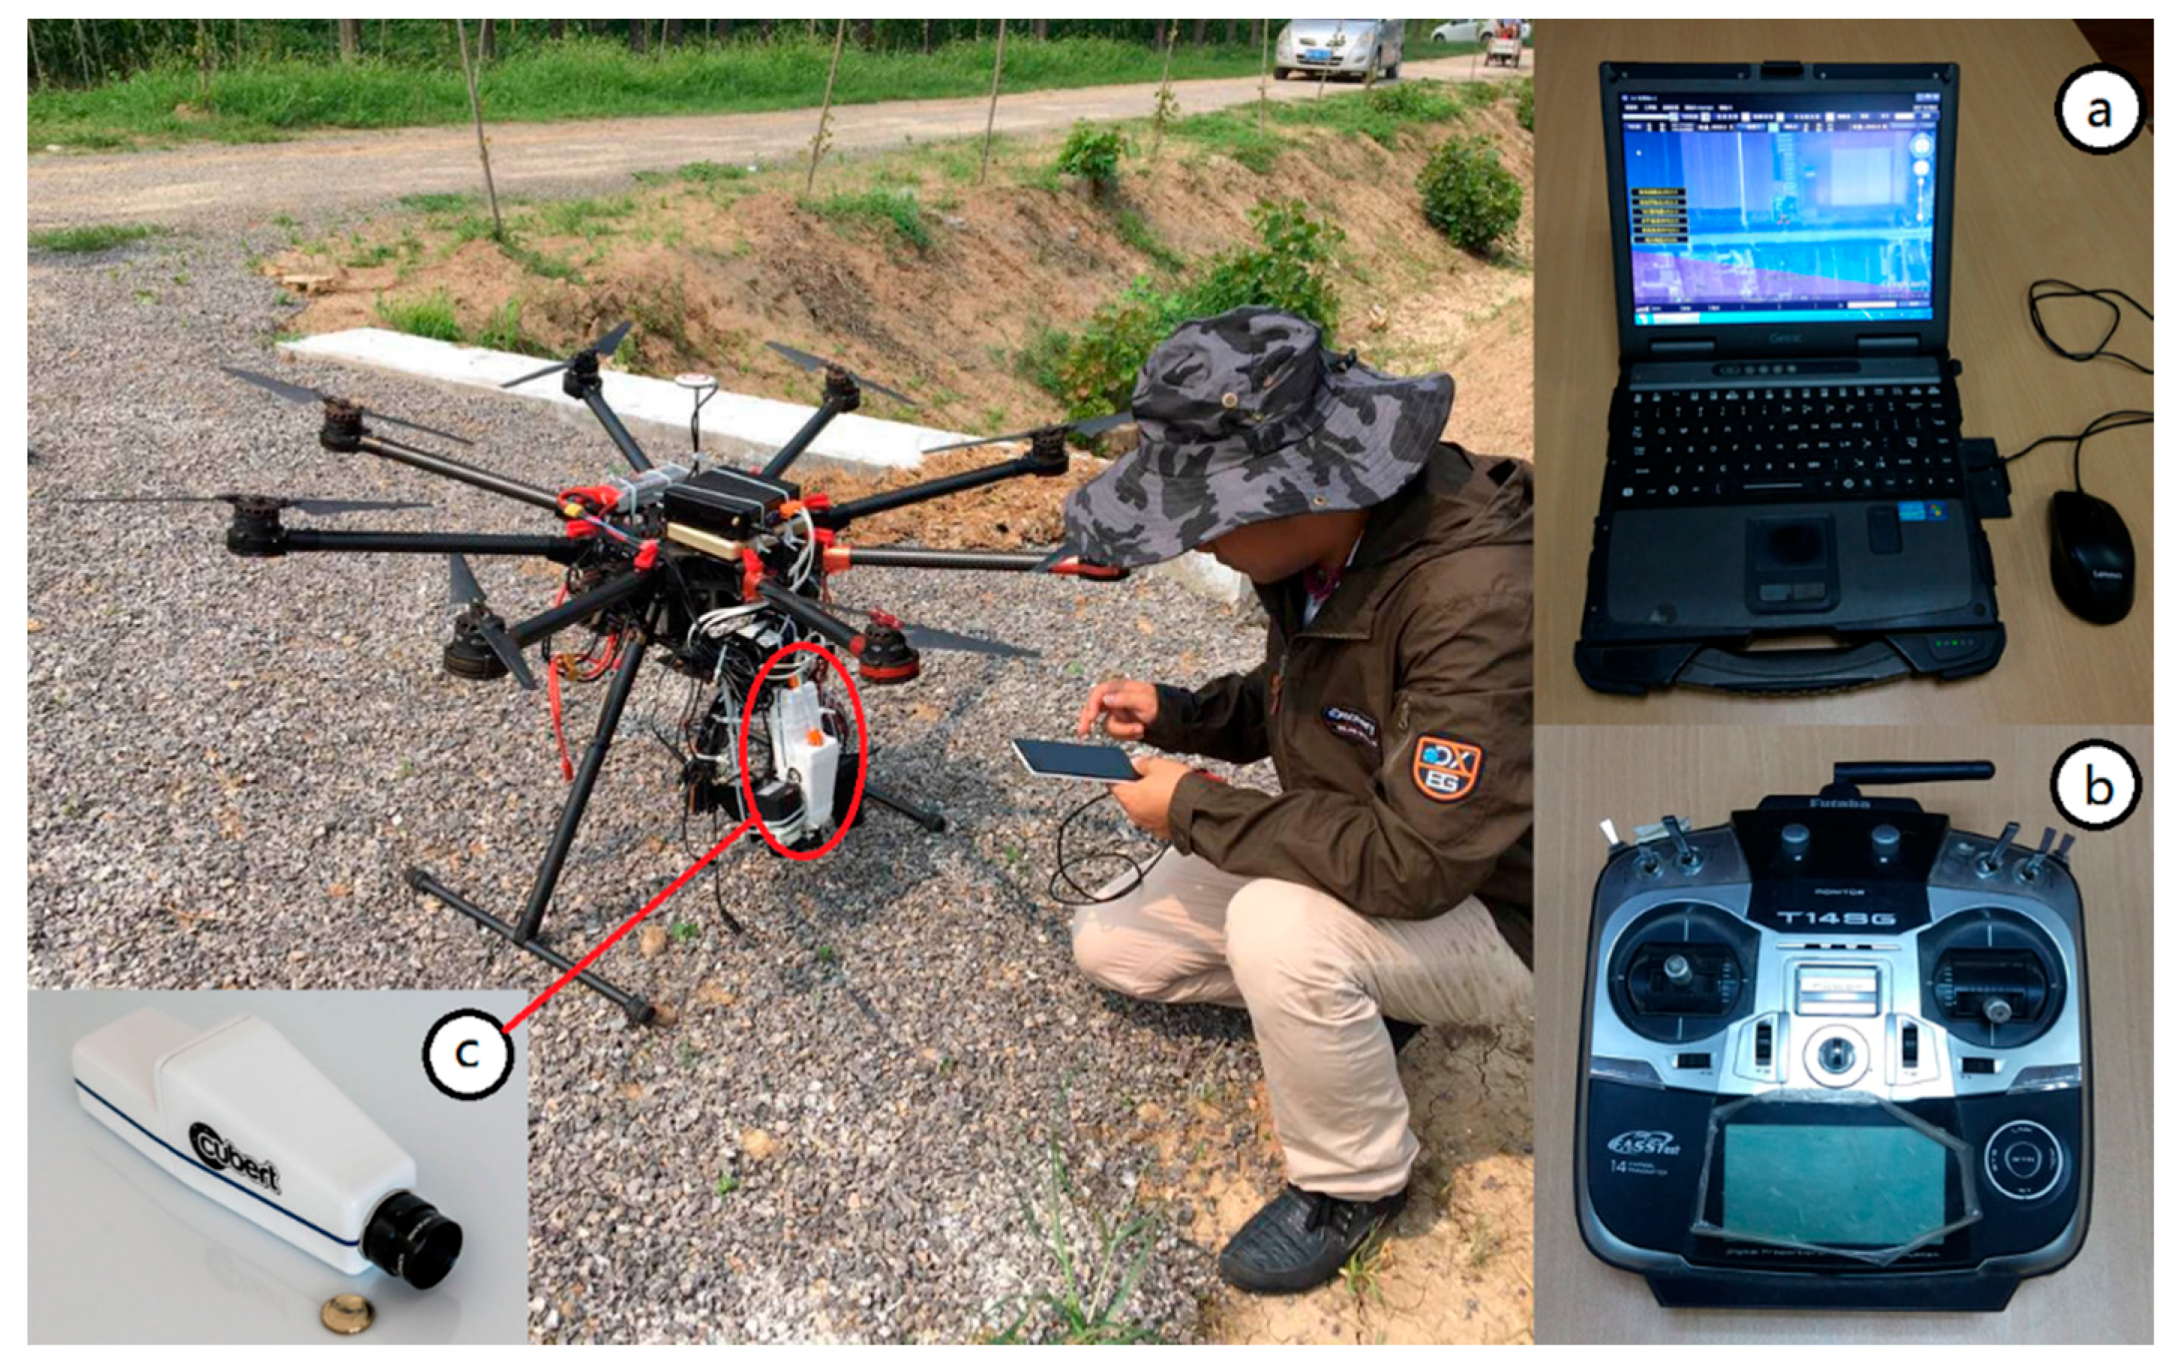
2.2.3. Platform
The UAV UHD 185 hyperspectral system was designed by the National Engineering Research Center for Information Technology in Agriculture (NERCITA) of China [
51]. The system was composed of three parts, including a ground control system, UAV and UHD 185 hyperspectral system and post-processing software. As shown in
Figure 3, the ground control system included a DJI S1000 UAV (SZ DJI Technology Co., Ltd., Sham Chun, Guangdong Province, China) [
52] (
Figure 3), the DJI ground-control station (software,
Figure 3a), reinforcement notebook computer (hardware,
Figure 3a) and remote controller (
Figure 3b). The UHD 185 hyperspectral system consisted of a cloud platform and the UHD 185 hyperspectral sensor (
Figure 3c). The post-processing software consisted of software for stitching, as well as radiation and geometry correction (e.g., as Cubert [
19], Agisoft PhotoScan [
53] and ENVI 5.1 [
54]).
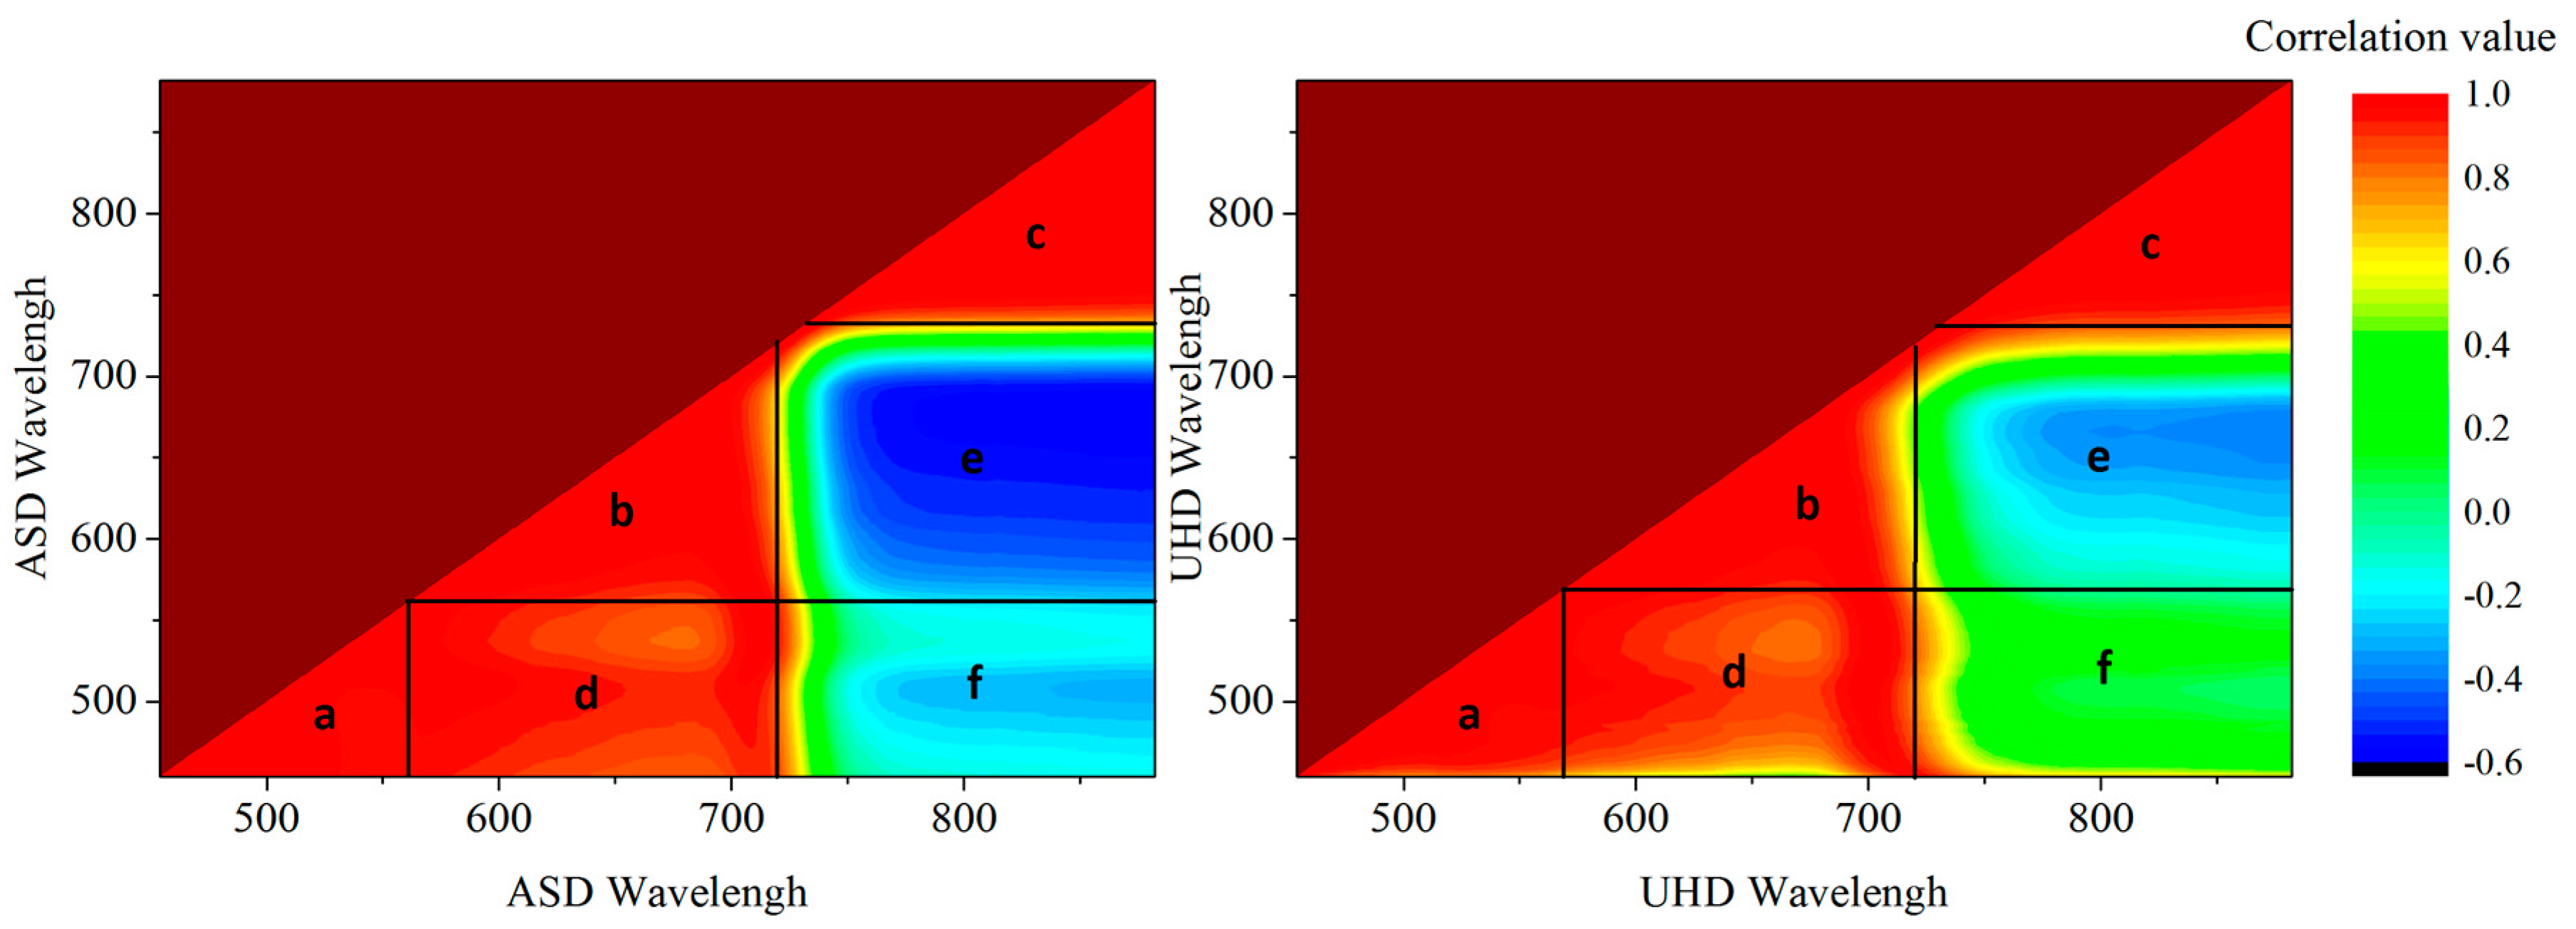
The DJI S1000 UAV is a UAV platform with eight propellers and a multirotor, which improve stability at slow flight speeds and low altitude. When equipped with two 18,000-mAh (25 V) batteries, the UAV can run for 30 min with a take-off weight of 6 kg, flying altitude of 50 m and flight speed of 8 m/s. Flights were conducted during the flagging (26 April 2015) and flowering (13 May 2015) stages of winter wheat with ground winter wheat ASD measurement. Each flight covered a field area of 6000 square meters and lasted ~20 min. Remote sensing images acquired from high-altitude platforms typically require atmospheric correction; conversely, the UHD 185 images were obtained under stable light conditions in this study, and atmospheric correction was not required. We compared hyperspectral data acquired with the UHD 185 and ground ASD.
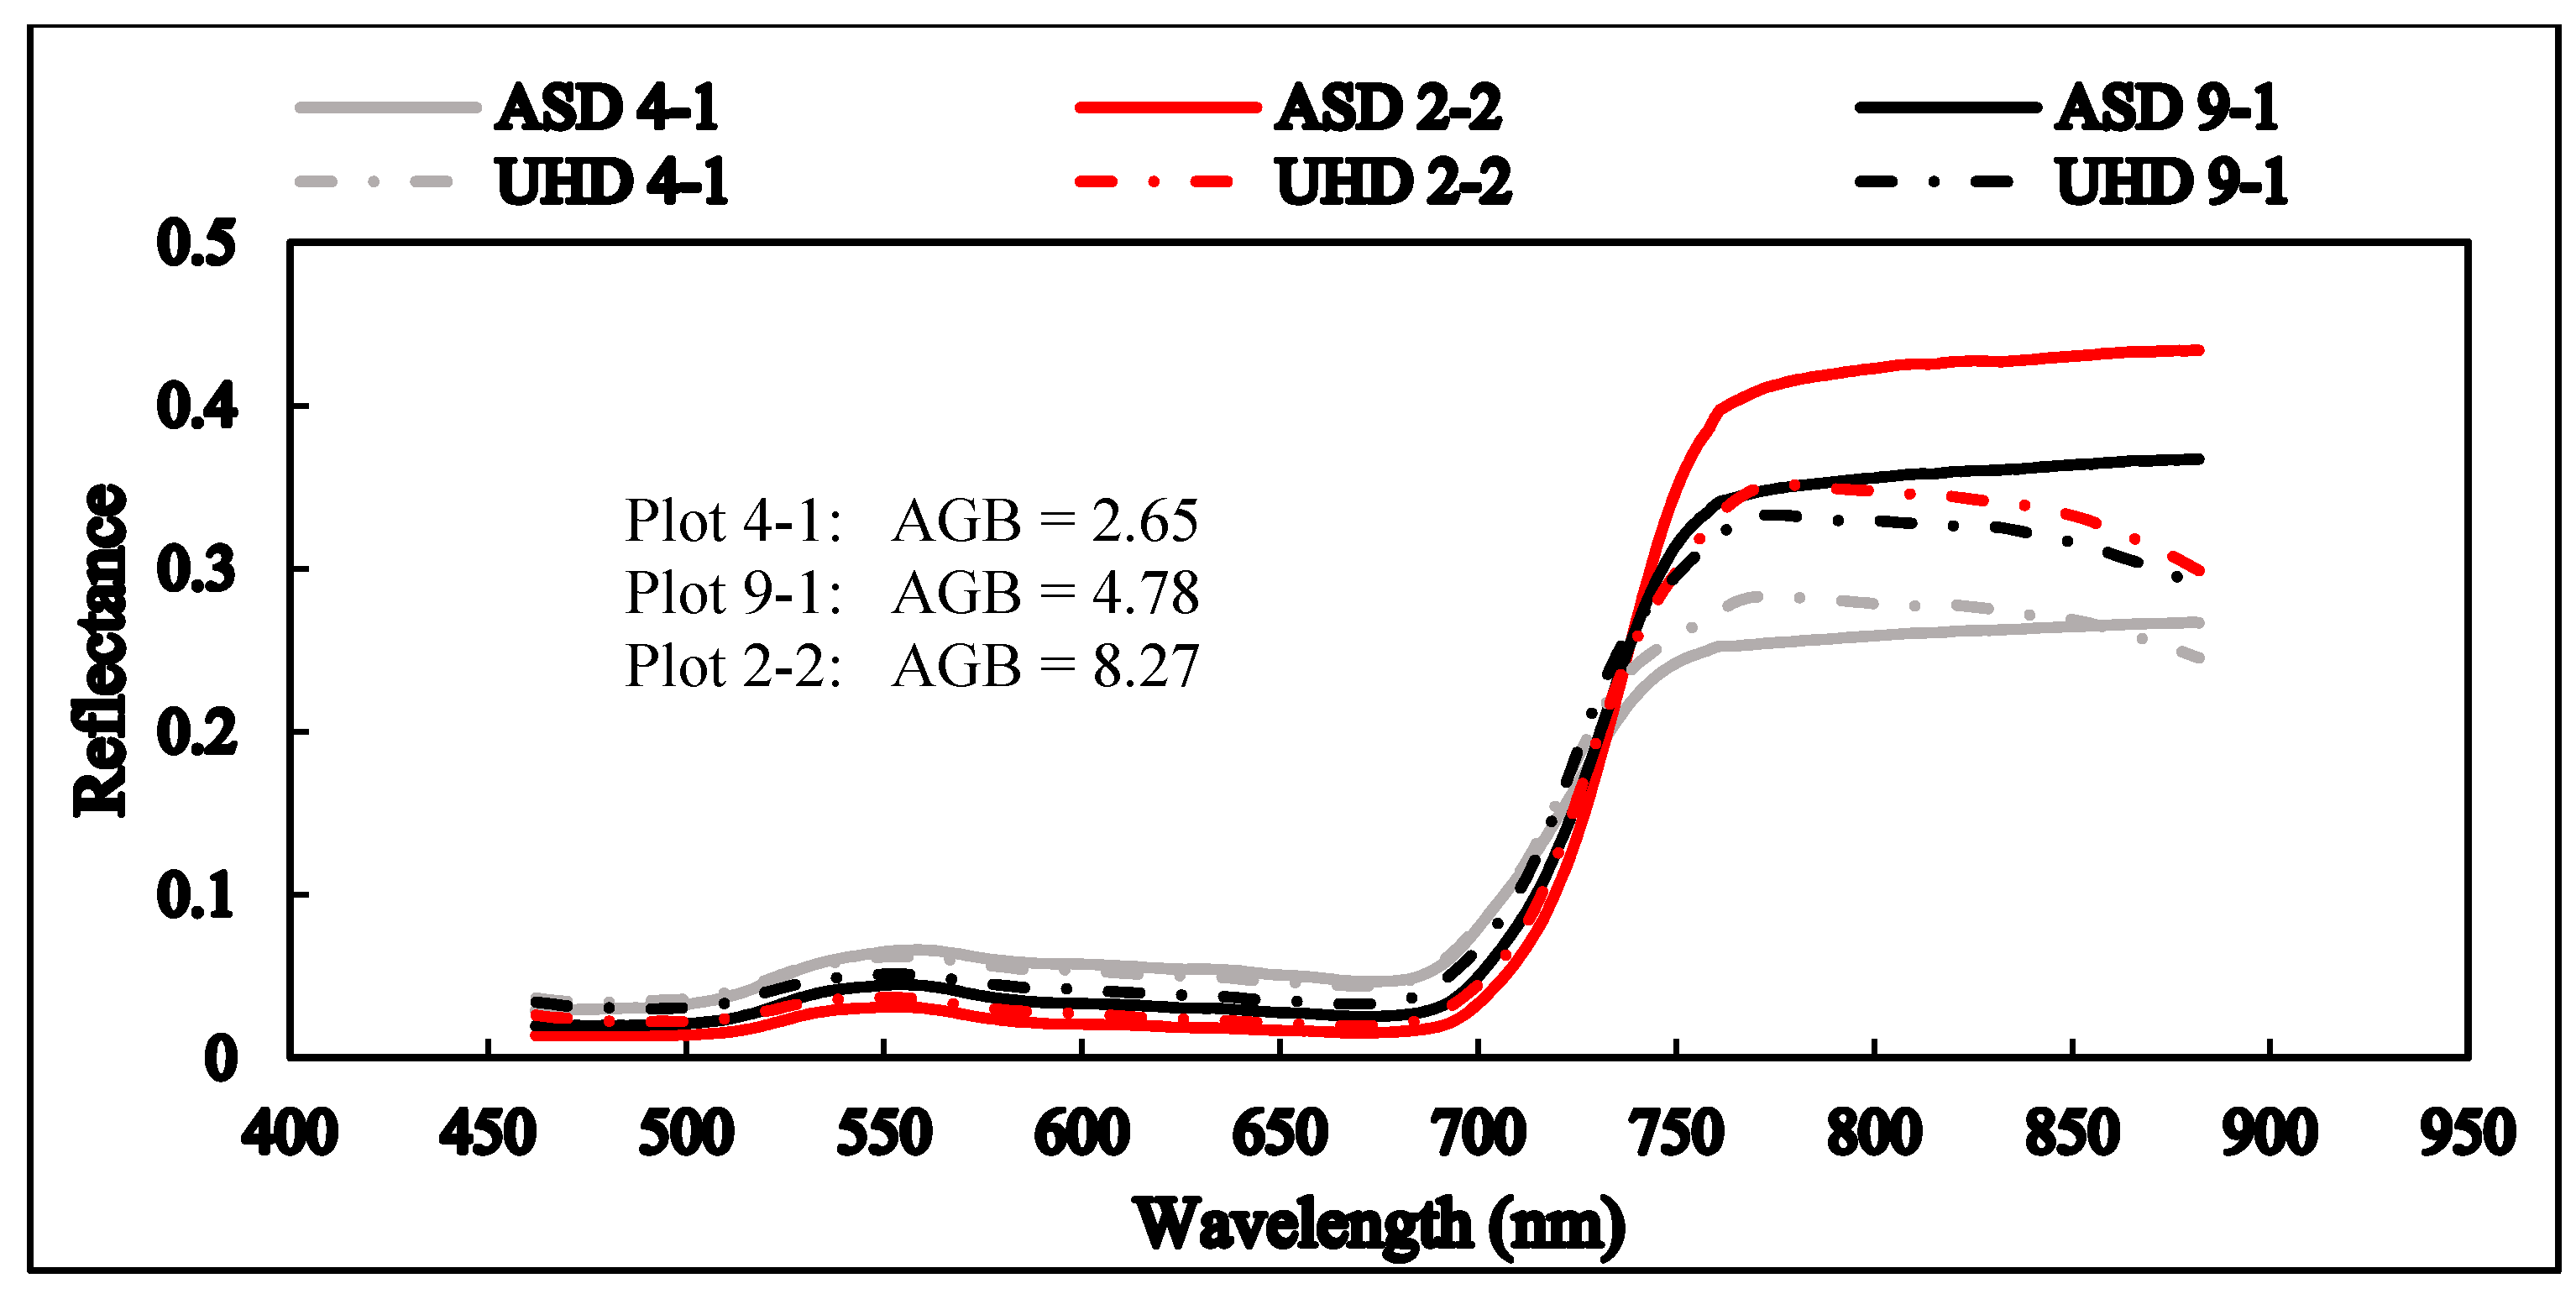
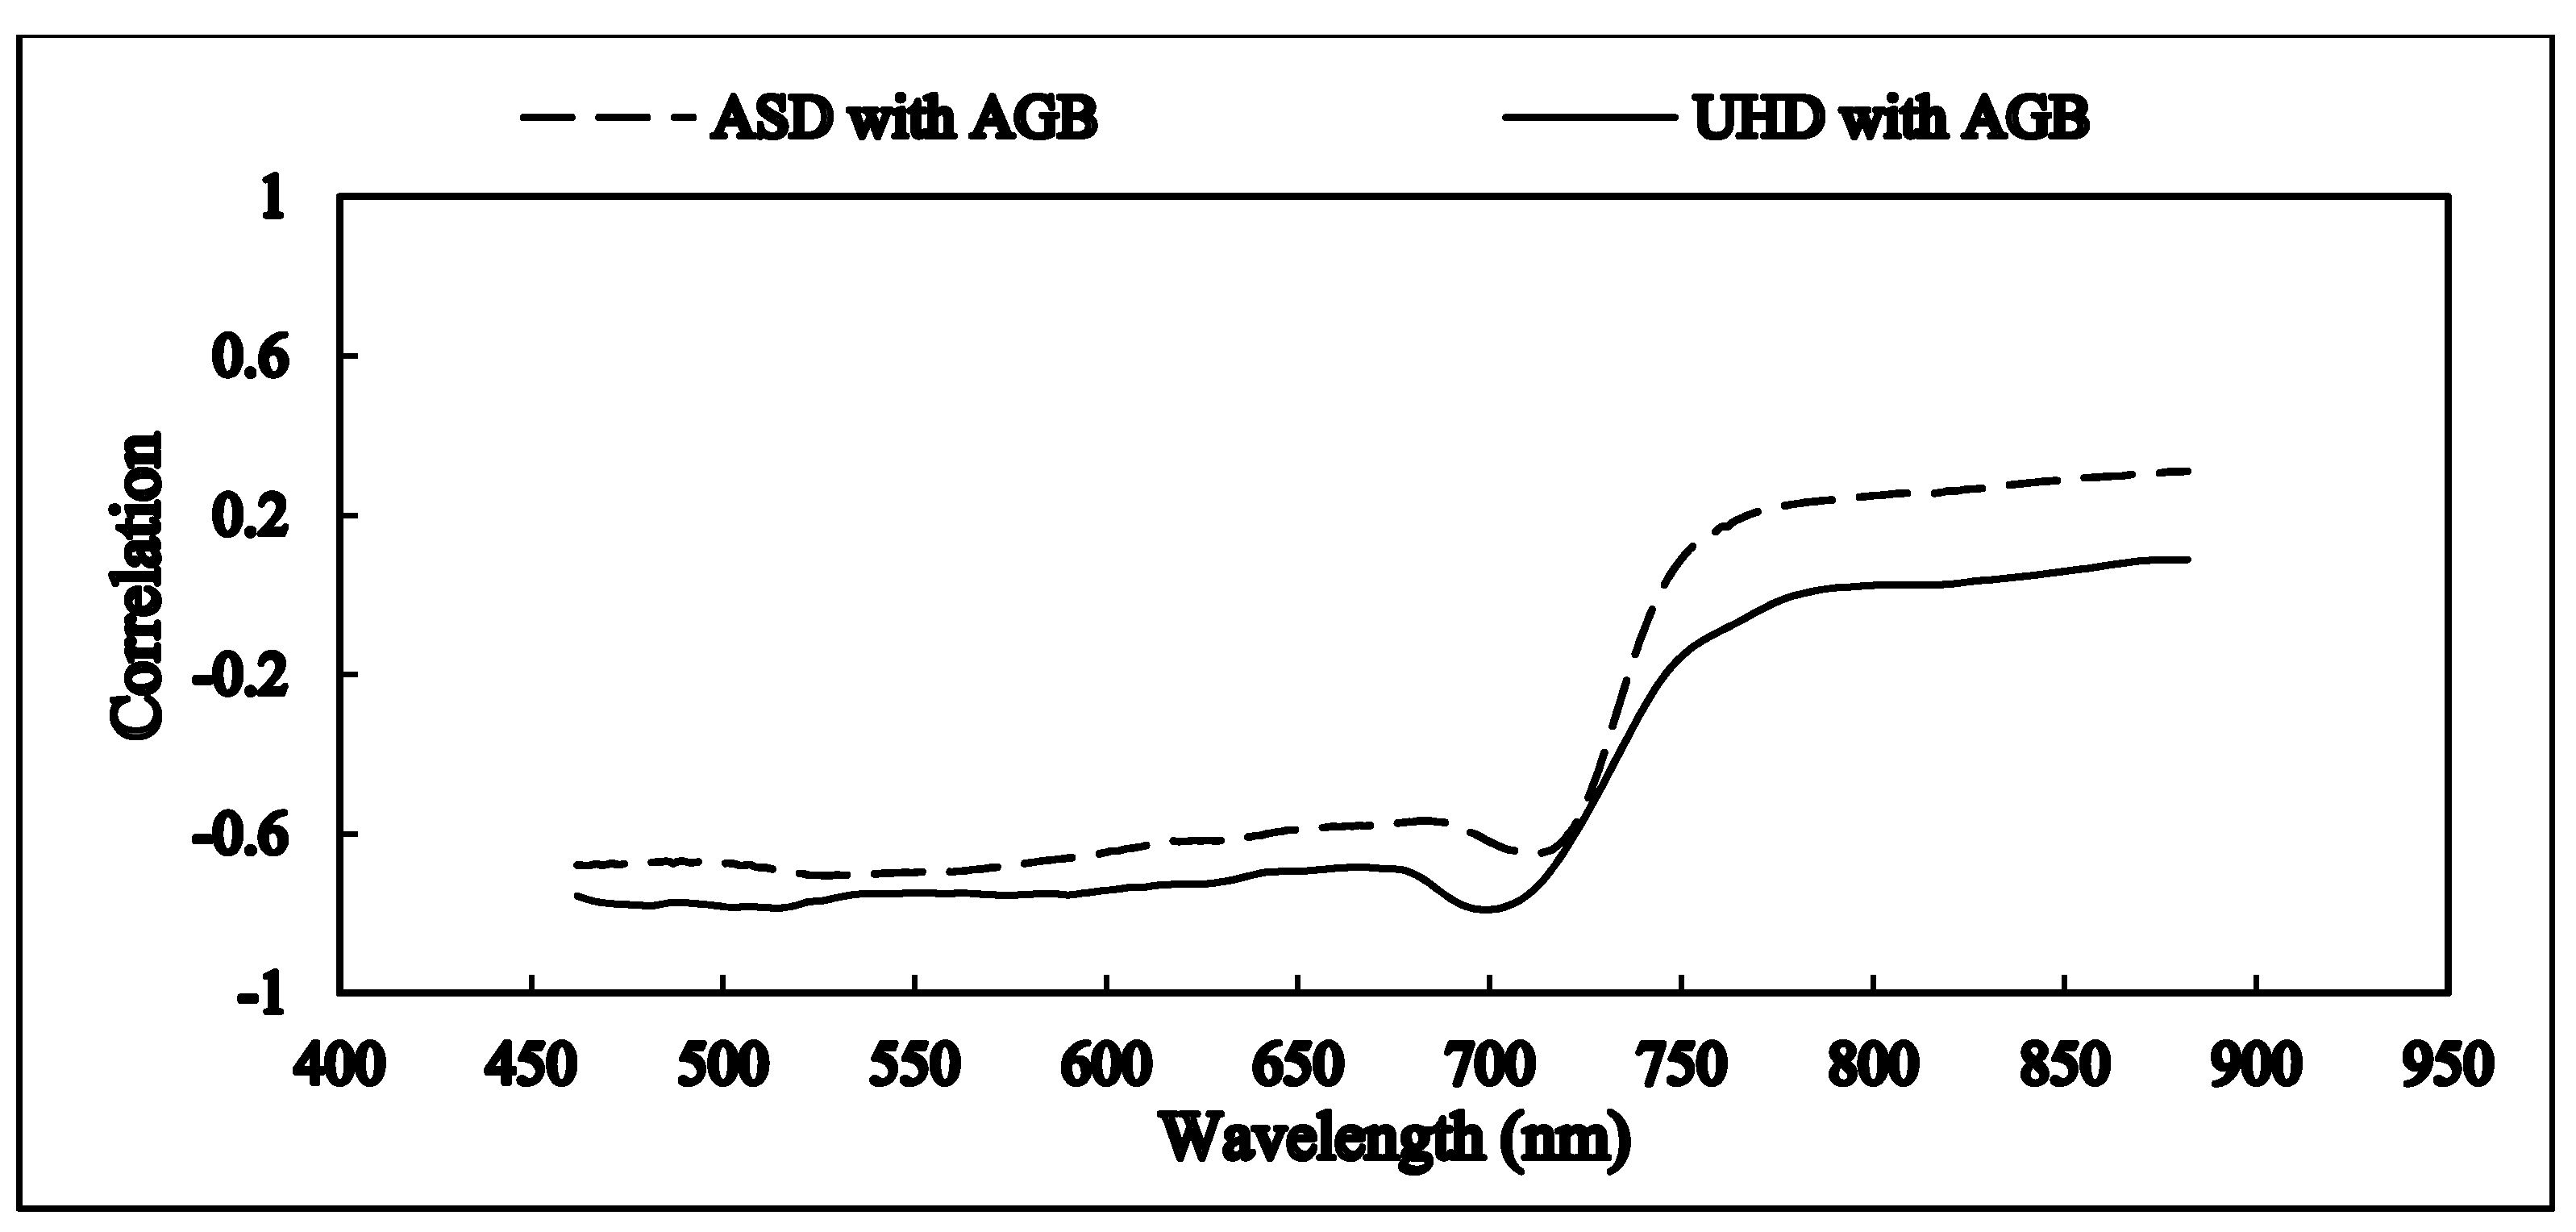
2.2.4. ASD Measurement
Ground winter wheat canopy reflectance was measured using an ASD Field Spec 3 spectrometer (Analytical Spectral Devices, Boulder, Colorado, CO, USA; abbreviated as ASD). Measurements were collected during the flagging (26 April 2015) and flowering (13 May 2015) stages of winter wheat growth. After the UAV flight (from 11 a.m.–2 p.m.), ground measurements were carried out under windless conditions and stable light levels. Winter wheat canopy reflectance was measured 10 times at the center of each plot, and the average reflectance was recorded. The reflectance obtained by ground-based ASD and UAV-mounted UHD spectrometers was compared.
2.3. Methods
After the UHD 185 images were stitched together, a ground resolution of 1 cm was obtained for the hyperspectral images. We used ENVI ROI (ENVI image processing and analysis software, from ITT Visual Information Solutions, Boulder, CO, USA) tools to calculate the average canopy spectral reflectance of each plot and selected bands of 462 nm–882 nm to avoid unstable spectra; this band range should also be selected for this study to obtain the best combination of spectral bands and indices. The first two groups of crops were used to build the AGB models, and the remaining group was used as the validation set. With two UAV flights and ground measurements, we have 64 sets of data for AGB model building and 32 sets of data for AGB model validating.
2.3.1. Selection of Spectral Bands and Indices
To construct linear AGB estimation models, five spectral specific bands and fourteen spectral vegetation indices were selected from the literature [
55,
56,
57,
58,
59,
60,
61,
62], including: B
470, G
550, R
670, R
680, Nir
750, Nir
800, the Ratio Vegetation Index (RVI) [
55], the Normalized Difference Vegetation Index (NDVI) [
20], Enhanced VI (EVI) [
56], Two-band Enhanced VI (EVI2) [
57], the Greenness Index (GI) [
58], the Modified Soil-Adjusted Vegetation Index (MSAVI) [
59], the Optimized Soil Adjusted Vegetation Index (OSAVI) [
60], Wide Dynamic Range VI (WDRVI) [
26], Triangular VI (TVI) [
61,
62], Difference Vegetation Index (DVI1, DVI2, DVI3) [
55], Modified Triangular VI (MTVI1) [
61] and Modified Triangular VI (MTVI2) [
61] (
Table 1).
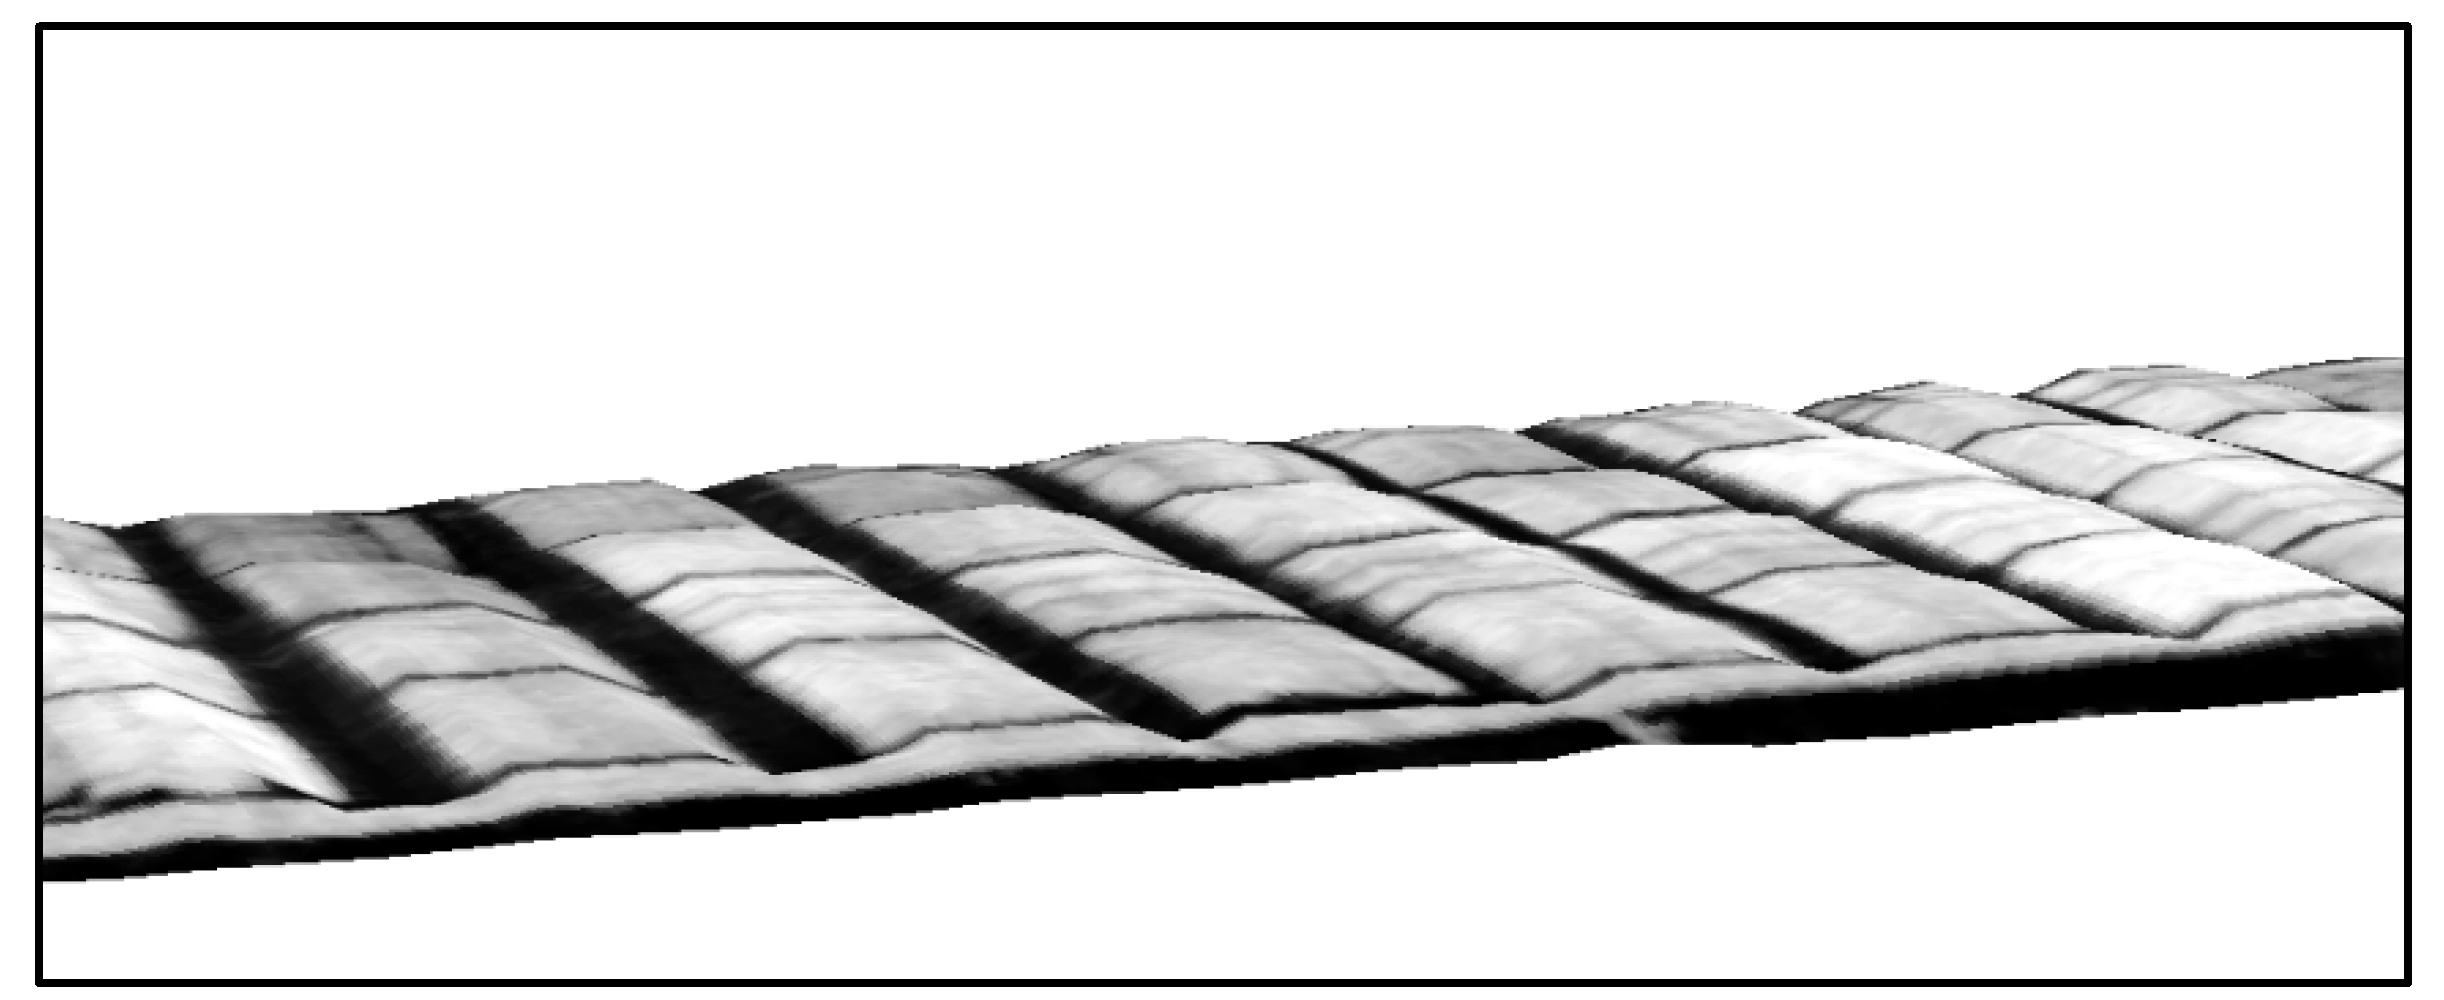
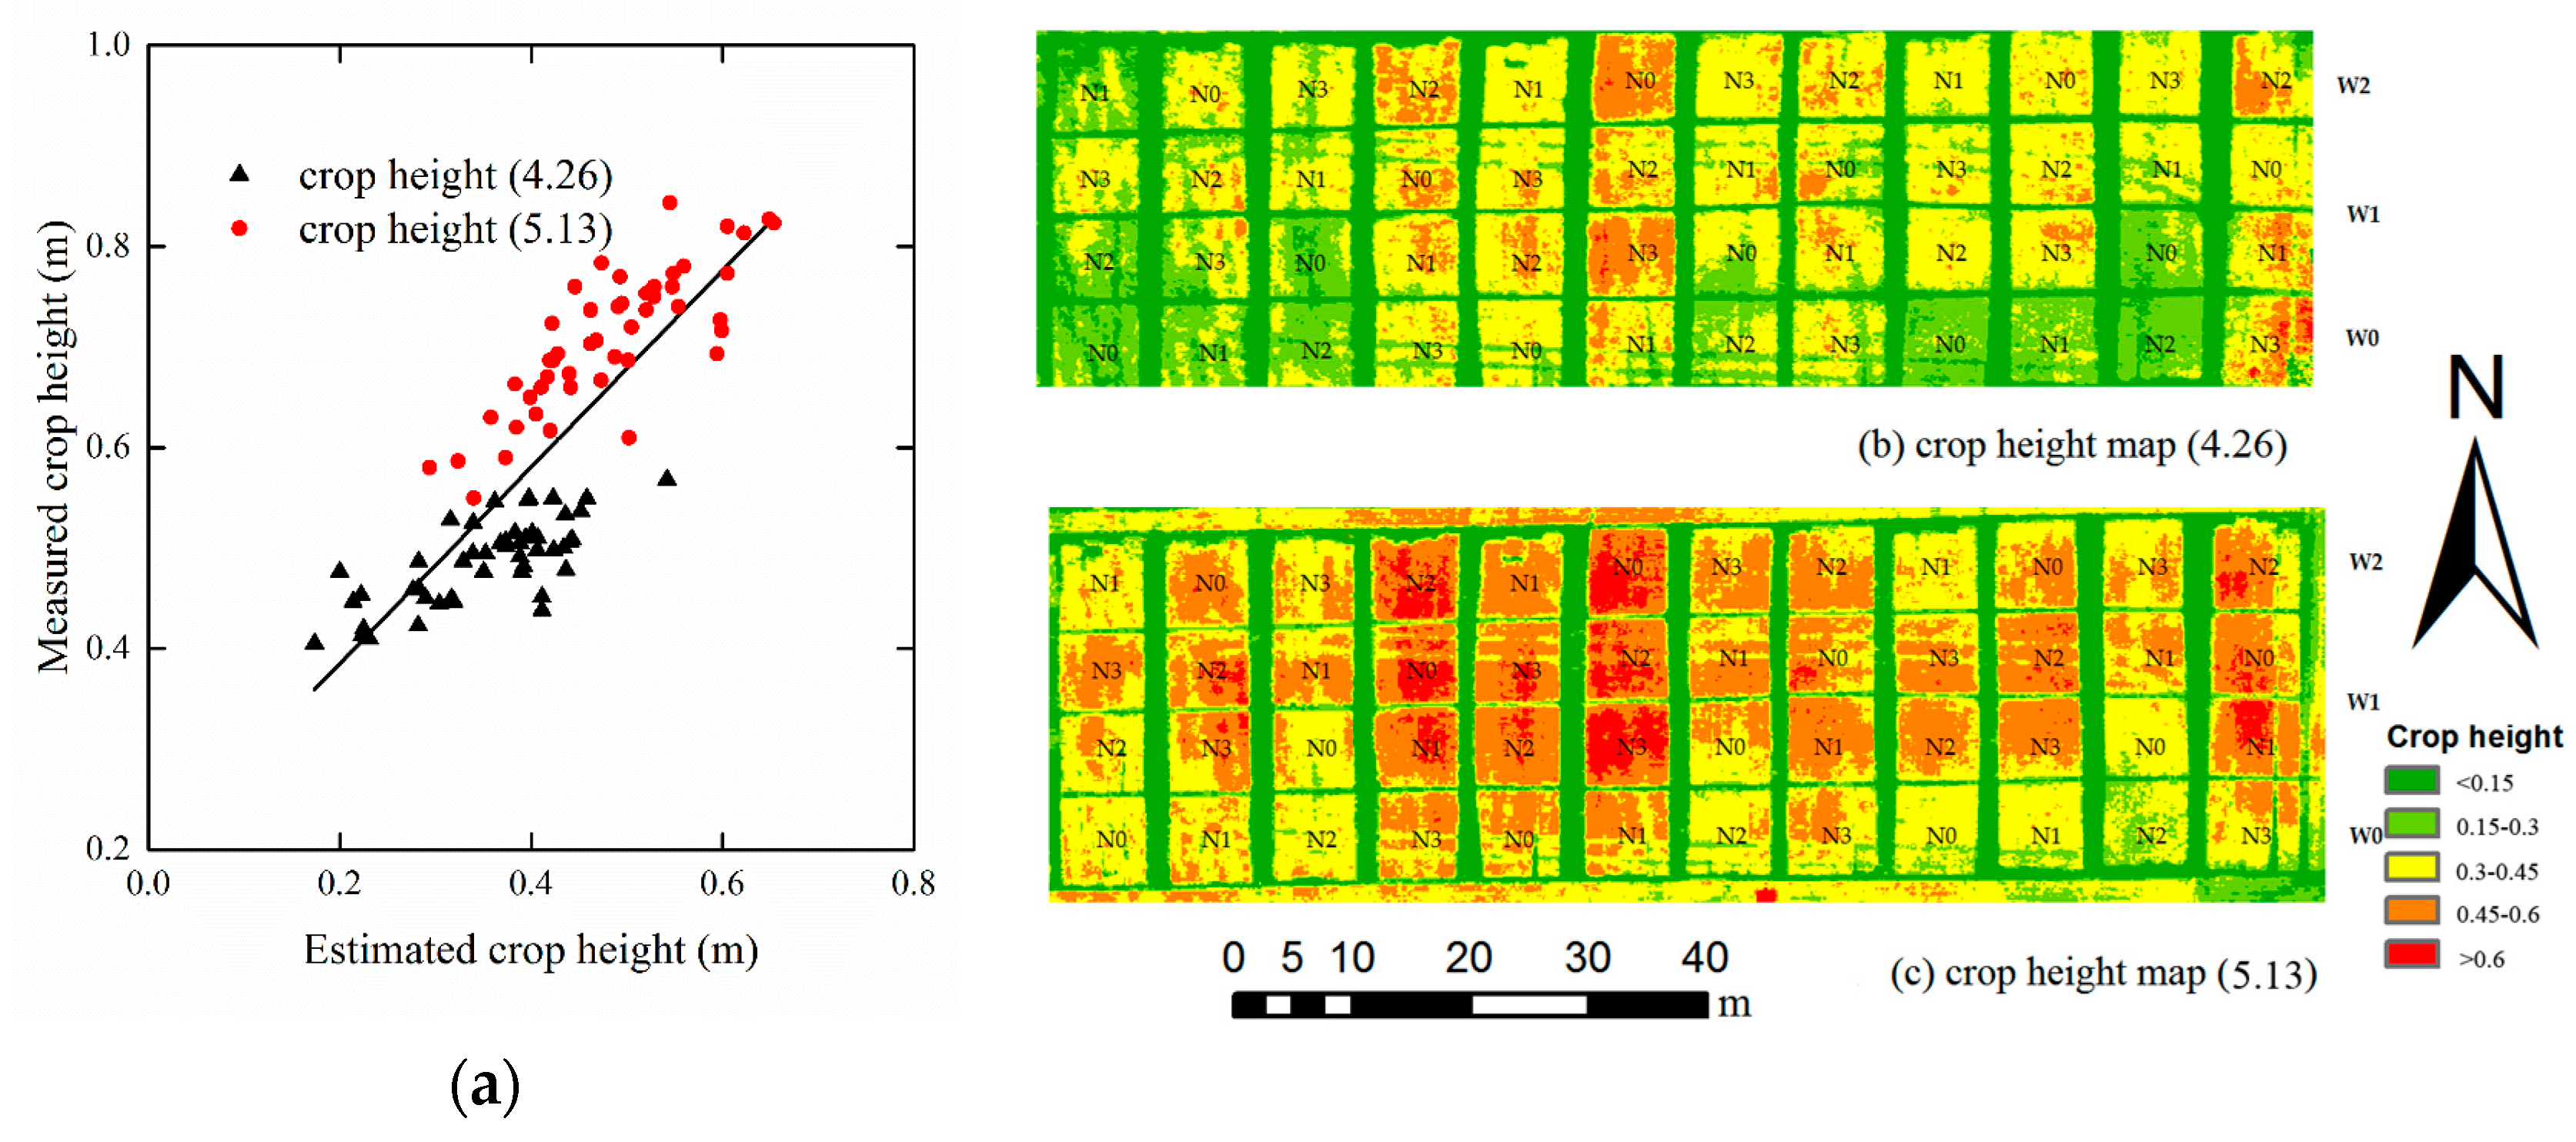
2.3.2. Winter Wheat Height
It was impossible to set up stable ground elevation control points in the field due to the irrigation system used at our experimental site. Therefore, we calculated the relative crop height using digital elevation model (DEM) and digital surface model (DSM). DEM and DSM are two types of surface simulations used in surveying. A DEM conveys ground surface elevation, and a DSM is the sum of the DEM and vegetation surface. Thus, crop height can be obtained by subtracting the DEM from the DSM (
Figure 4 and Equation (2)).
In this paper, the DSM was obtained using photogrammetric technology software (Agisoft PhotoScan, Agisoft, St. Petersburg, Russia), panchromatic images and the positioning and orientation system (POS) information, all acquired by the UAV. Some soil points’ coordinate information was recorded using ARCGIS software (ARCGIS, Environmental Systems Research Institute, Inc., Redlands, CA, USA), then using ARCGIS extract tools to obtain all soil points’ elevation. The DEM was obtained by interpolating the surface elevation using ARCGIS kriging tools. After DEM and DSM were calculated, we use ARCGIS raster calculator tools to calculate the crop height map. After the above calculation, the soil part in the crop height map is about 0 m (black area in
Figure 4), and the crop zone will show the crop height value (gray area in
Figure 4).
2.3.3. Partial Least Squares Regression
Partial least squares regression is a statistical method introduced by Herman Wold [
63] in the 1960s as an economic technique. PLSR provides an efficient way to make full use of the hyperspectral information and was also widely used in remote sensing for vegetation studying. Previous studies [
64,
65] indicated that PLSR has excellent capability in making use of the full spectral information. In this paper, we employed the partial least squares regression using MATLAB (MATLAB 2014a, MathWorks, Inc., Natick, MA, USA) software on Microsoft Windows.
2.3.4. Precision Evaluation
Spectral data collected from two plan groups were used for model construction, and data collected from the third group were used for validation. We used the coefficient of determination (
R2), root mean square error (RMSE) and mean absolute error (MAE) to evaluate the performance of each model. Higher
R2 values correspond to smaller RMSE and MAE values and higher model precision. Equations (3)–(5) were used to calculate
R2, RMSE and MAE.
where
xi and
yi are the estimated and measured values (AGB),
and
are the average estimated and measured values and
n is the sample number.
5. Conclusions
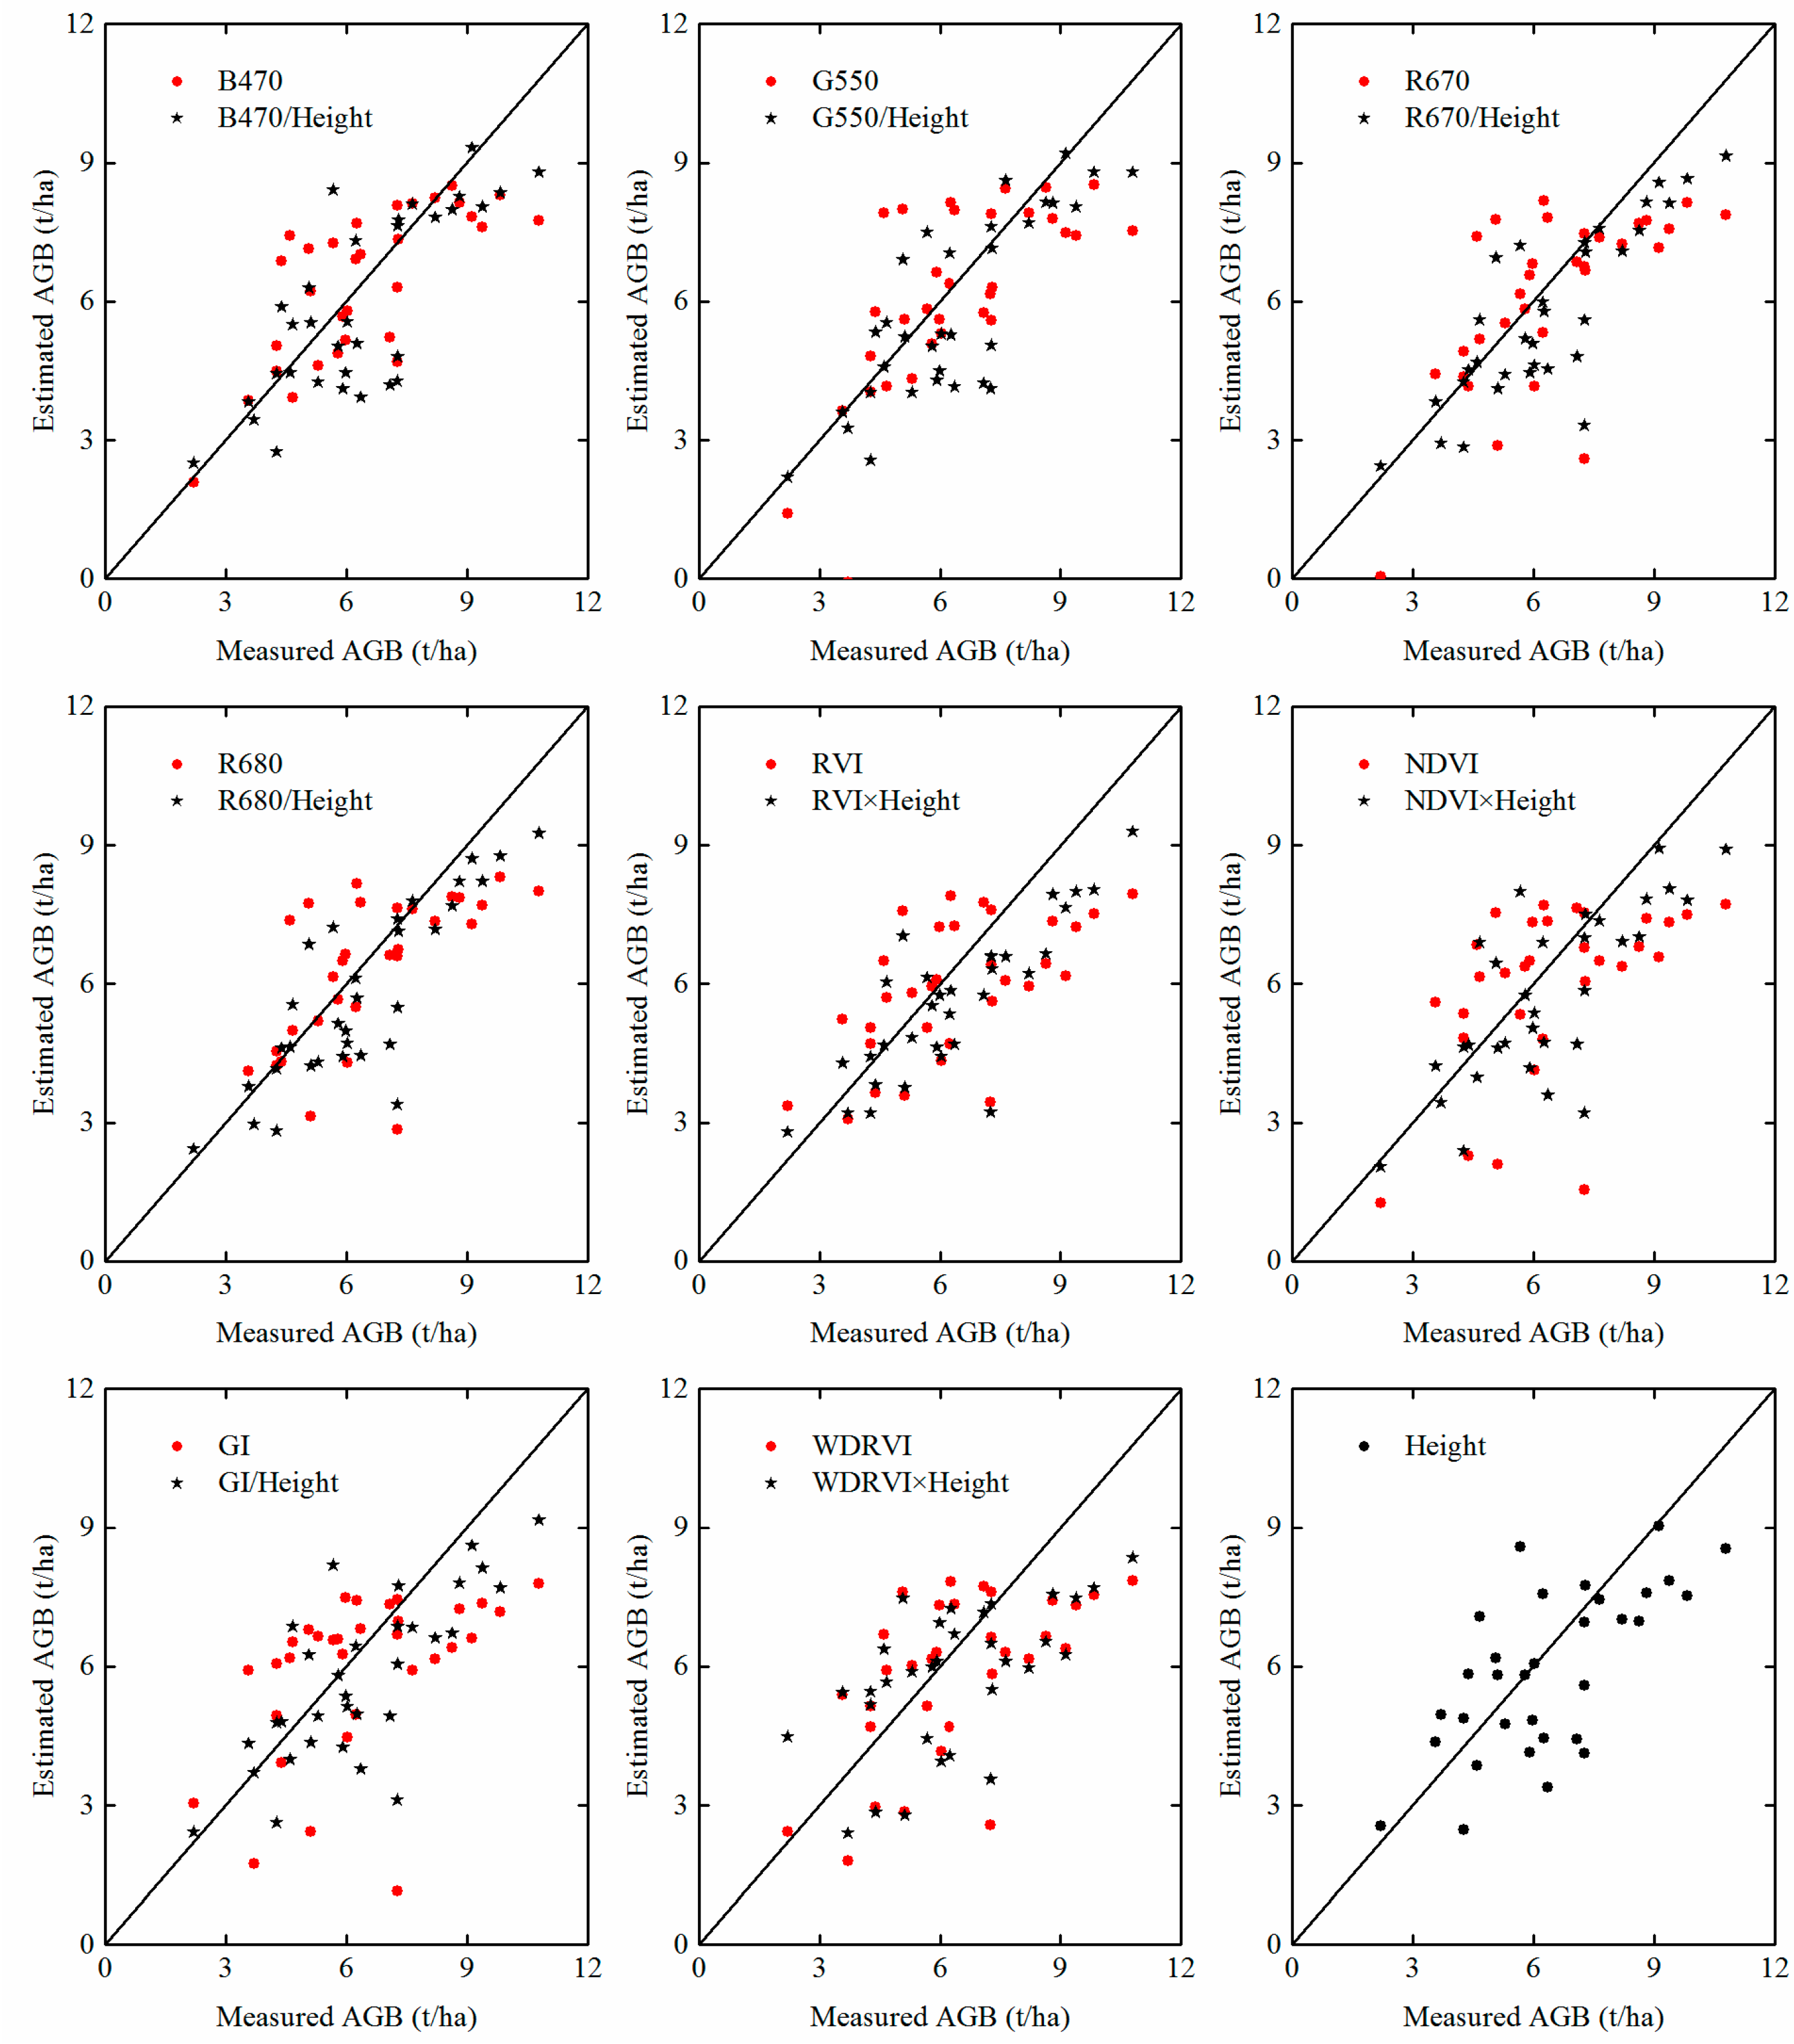
Images from the UHD 185 hyperspectral sensor combined imagery and hyperspectral information. We constructed AGB estimation models based on crop height, specific bands and spectral vegetation indices, which are extremely sensitive to winter wheat growth. Eight models based on specific bands and vegetation indices were established (
Table 3), as well as eight models based on crop height combined with specific bands and vegetation indices (
Table 4). The results show that the combination of hyperspectral canopy reflectance data and crop height can be used to improve the estimation accuracy of winter wheat AGB (
Table 6,
Figure 8).
To make full use of hyperspectral data, suitable methods have to be used. In this study, concerning the two-band spectral vegetation indices (maybe three-band) making use only of small parts of the hyperspectral information, the existence of PLSR is particularly necessary to achieve higher accuracy.
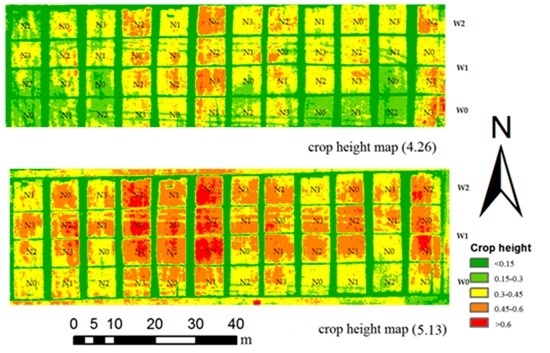
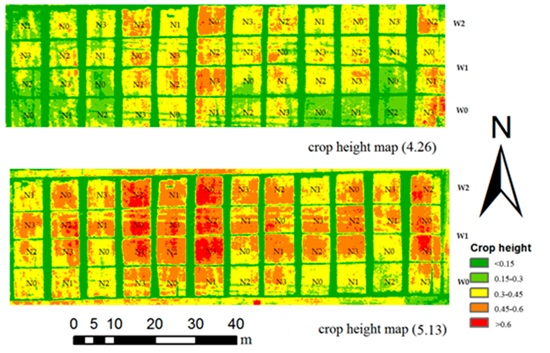
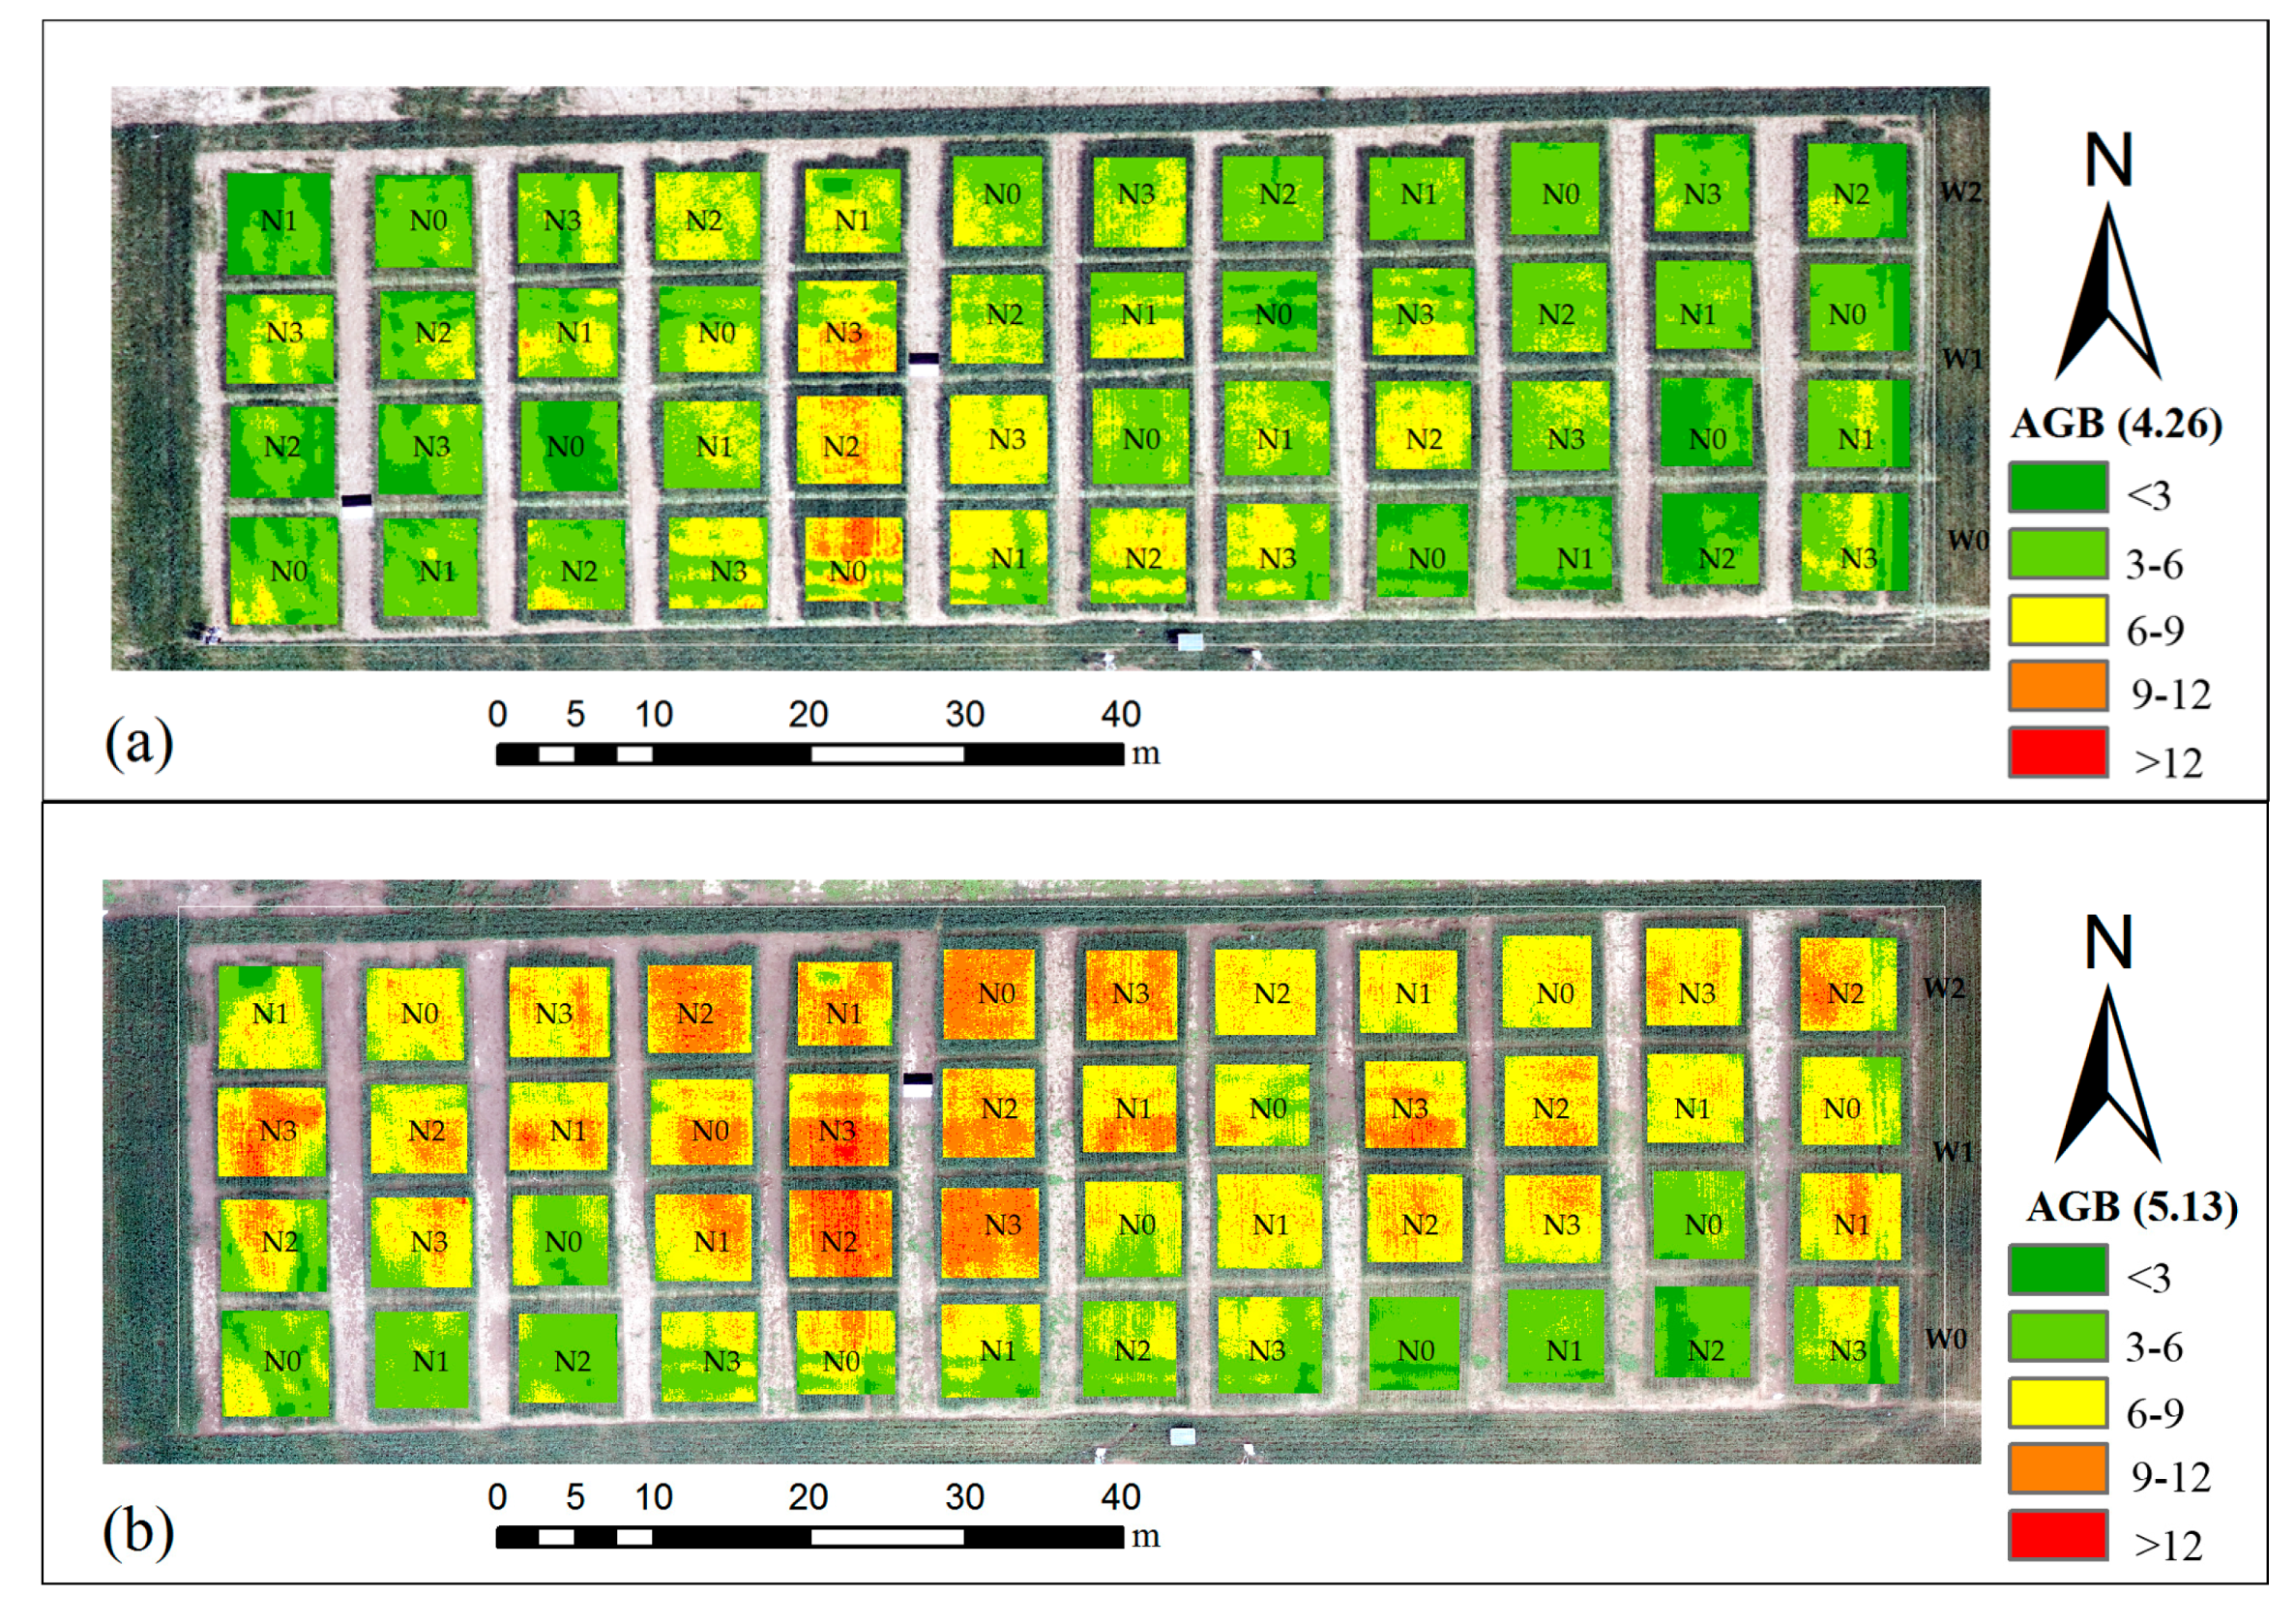
The UHD 185 sensor can improve AGB monitoring performance by providing hyperspectral and stereo imagery. Crop height obtained from this new spectrometer can greatly improve biomass estimation accuracy and map** applications (
Figure 9), which are critical for guiding agricultural management.


 ,
, 


