A Scientometric Visualization Analysis for Night-Time Light Remote Sensing Research from 1991 to 2016

 ,
, 

Abstract
:
1. Introduction
2. Data and Materials
3. Methodology and Software
4. Results Analysis and Discussion
4.1. Basic Bibliometric Analysis
4.1.1. Yearly Publication Output
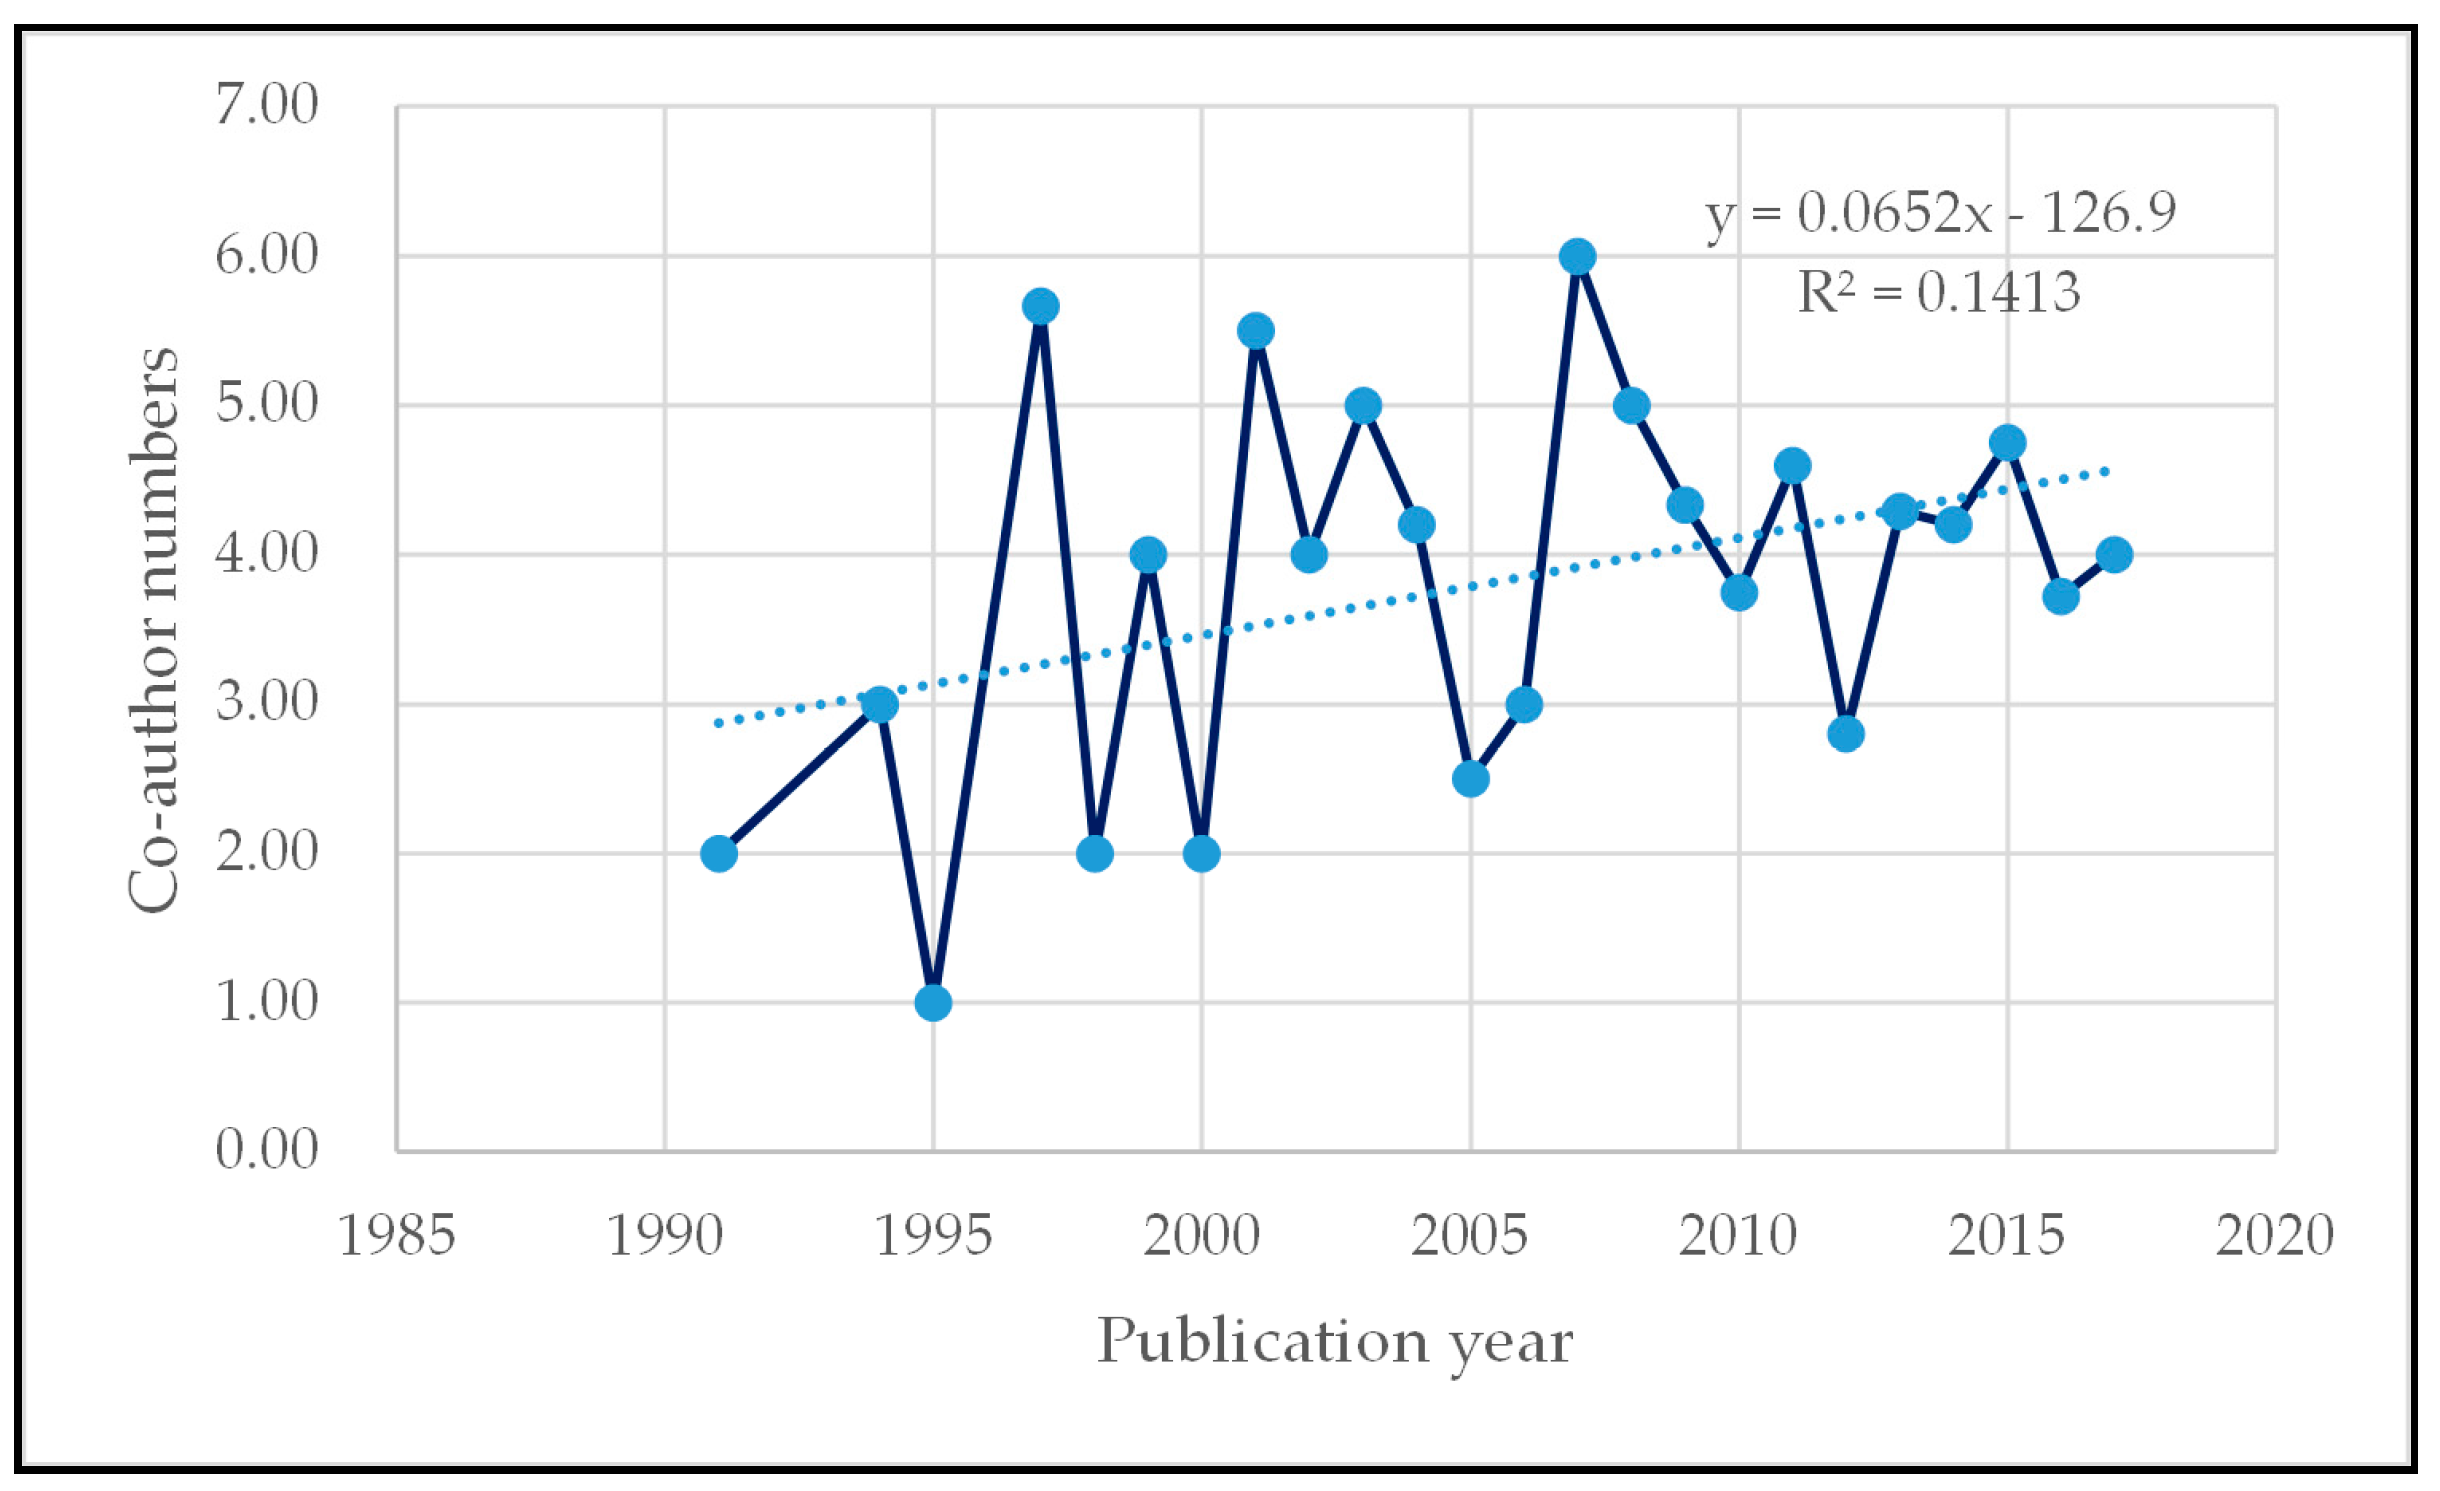
4.1.2. Average Number of Co-Authors
4.1.3. The Distribution of Journals
4.1.4. Main Research Countries
4.2. Core Research Communities
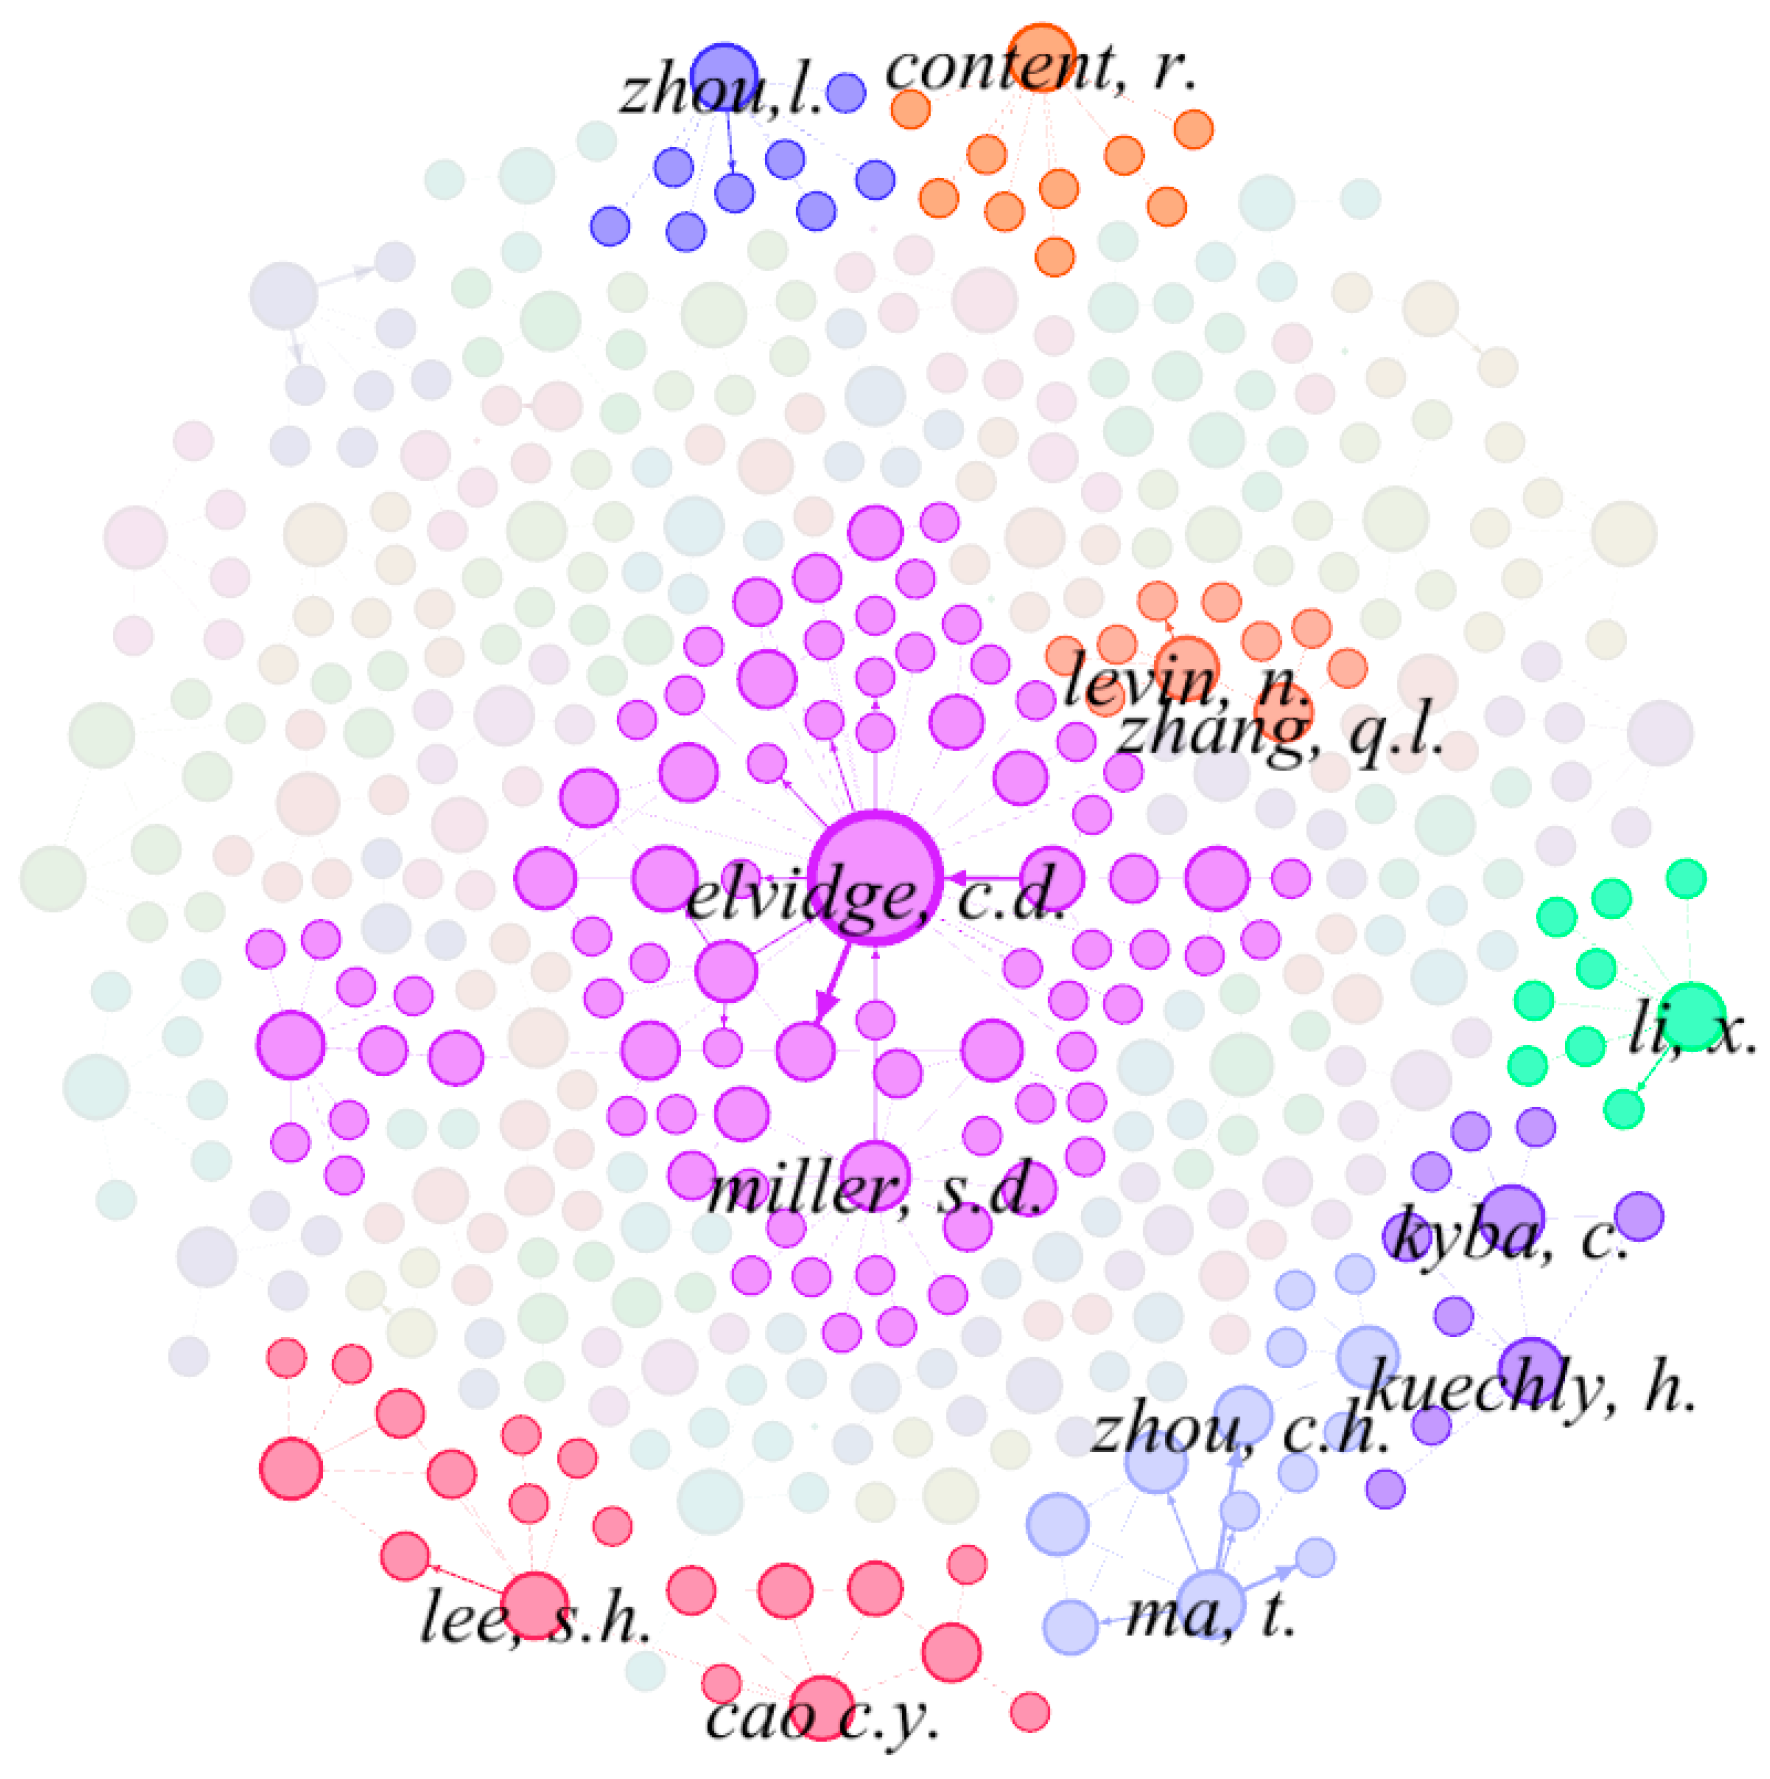
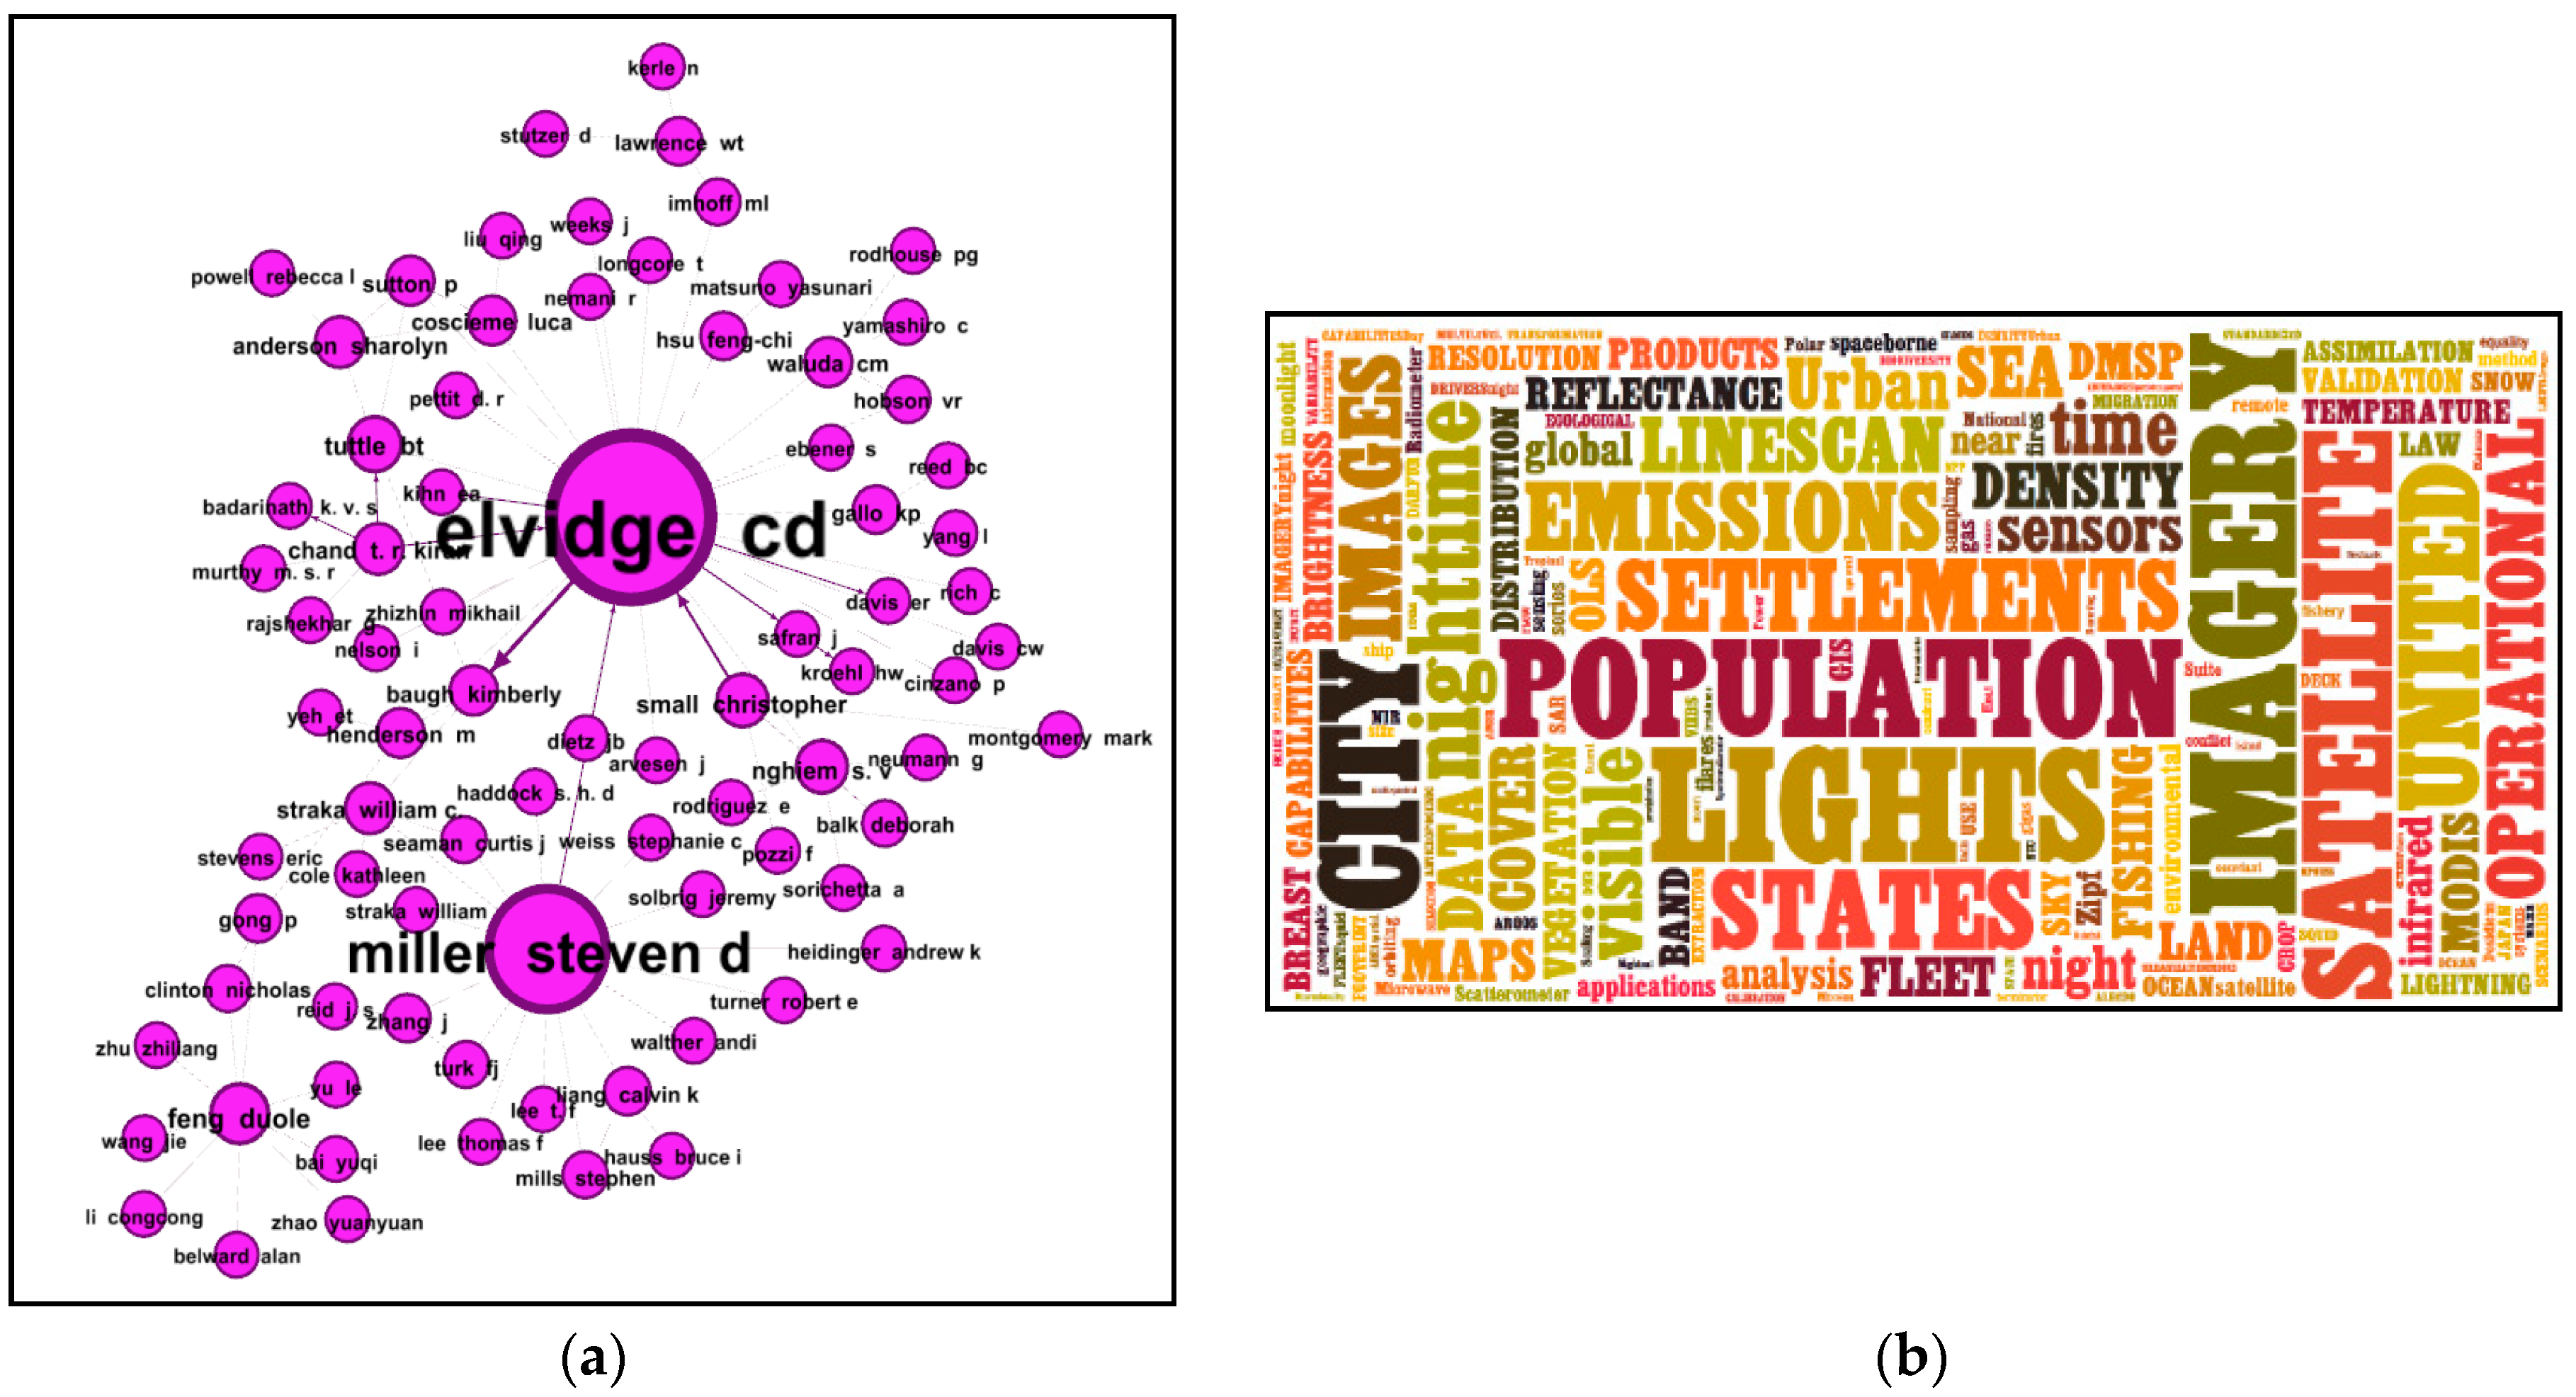
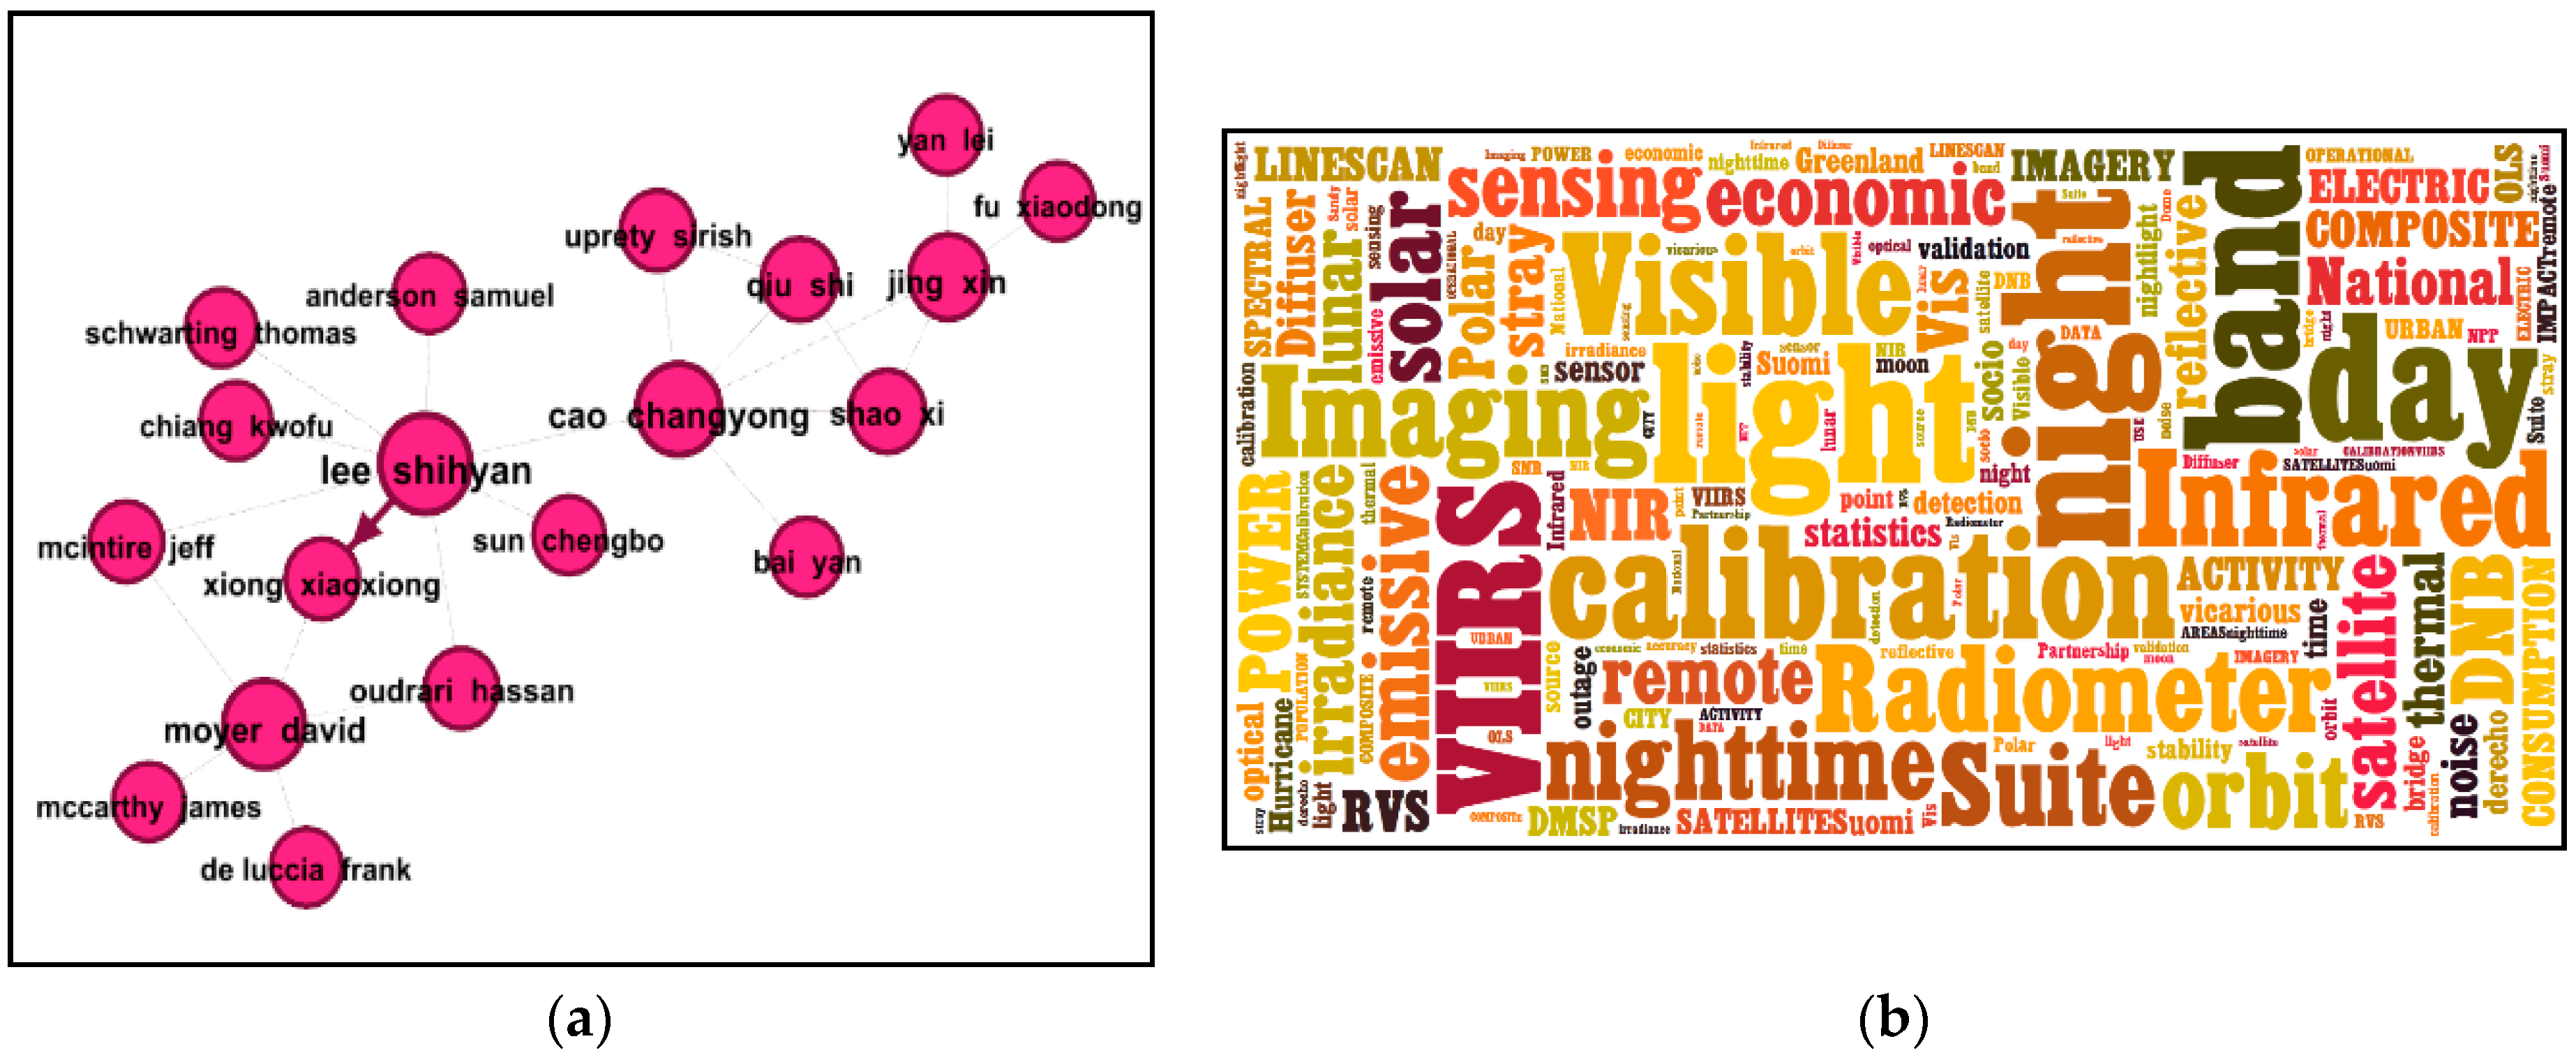
4.2.1. Co-Authorship in Social Network Analysis (SNA)
- Degree, in-degree (IDE), and out-degree (ODE): Degree can be defined as the total count of nodes connected to a target node in a network. In-degree is the number of nodes that are connected to a target node in a directed network. Out-degree is the number of nodes that are connected from a target node in a directed network. In our analysis, degree represents the number of co-authors connected to the target author; in-degree refers to the number of times a target author is a co-author but not the first author and out-degree represents the number of times when target author is a first author.
- Betweenness Centrality (BC) degree: The BC degree of a target node equals to the number of the shortest paths from all nodes to all nodes that pass through the target node. In our analysis, authors with high BC degree connect more sub-graphs of a co-author network. Removing these nodes (individual authors) from the network will result in graph partition.
- Closeness Centrality (CC) degree: CC degree is also based on the shortest paths. Different from BC degree, CC degree means the sum of the length of all shortest path from all nodes to all nodes that pass the target node. In our case, high CC degree refers to the author who is closer to various resources, thus more likely to undertake research in the future.
- Eigenvector Centrality (EC) degree: EC degree is designed to take care of the situation that traditional computation of degree does not consider who is connecting, because connection with important nodes will contribute more to the importance of the target node. EC assigns the relative degree to all nodes in the network instead of the original degree, therefore can reveal the real relative importance in term of the whole network.
- Clustering Coefficient (CCO): Clustering coefficient denotes the possibility of co-authors of an author collaborating with each other. It is also the basic characteristic of the small-world effect. Small world refers to the theory that every person is connected to every other person within six degrees of separation. A high CCO score suggests that collaboration is fixed within a small circle of researchers.
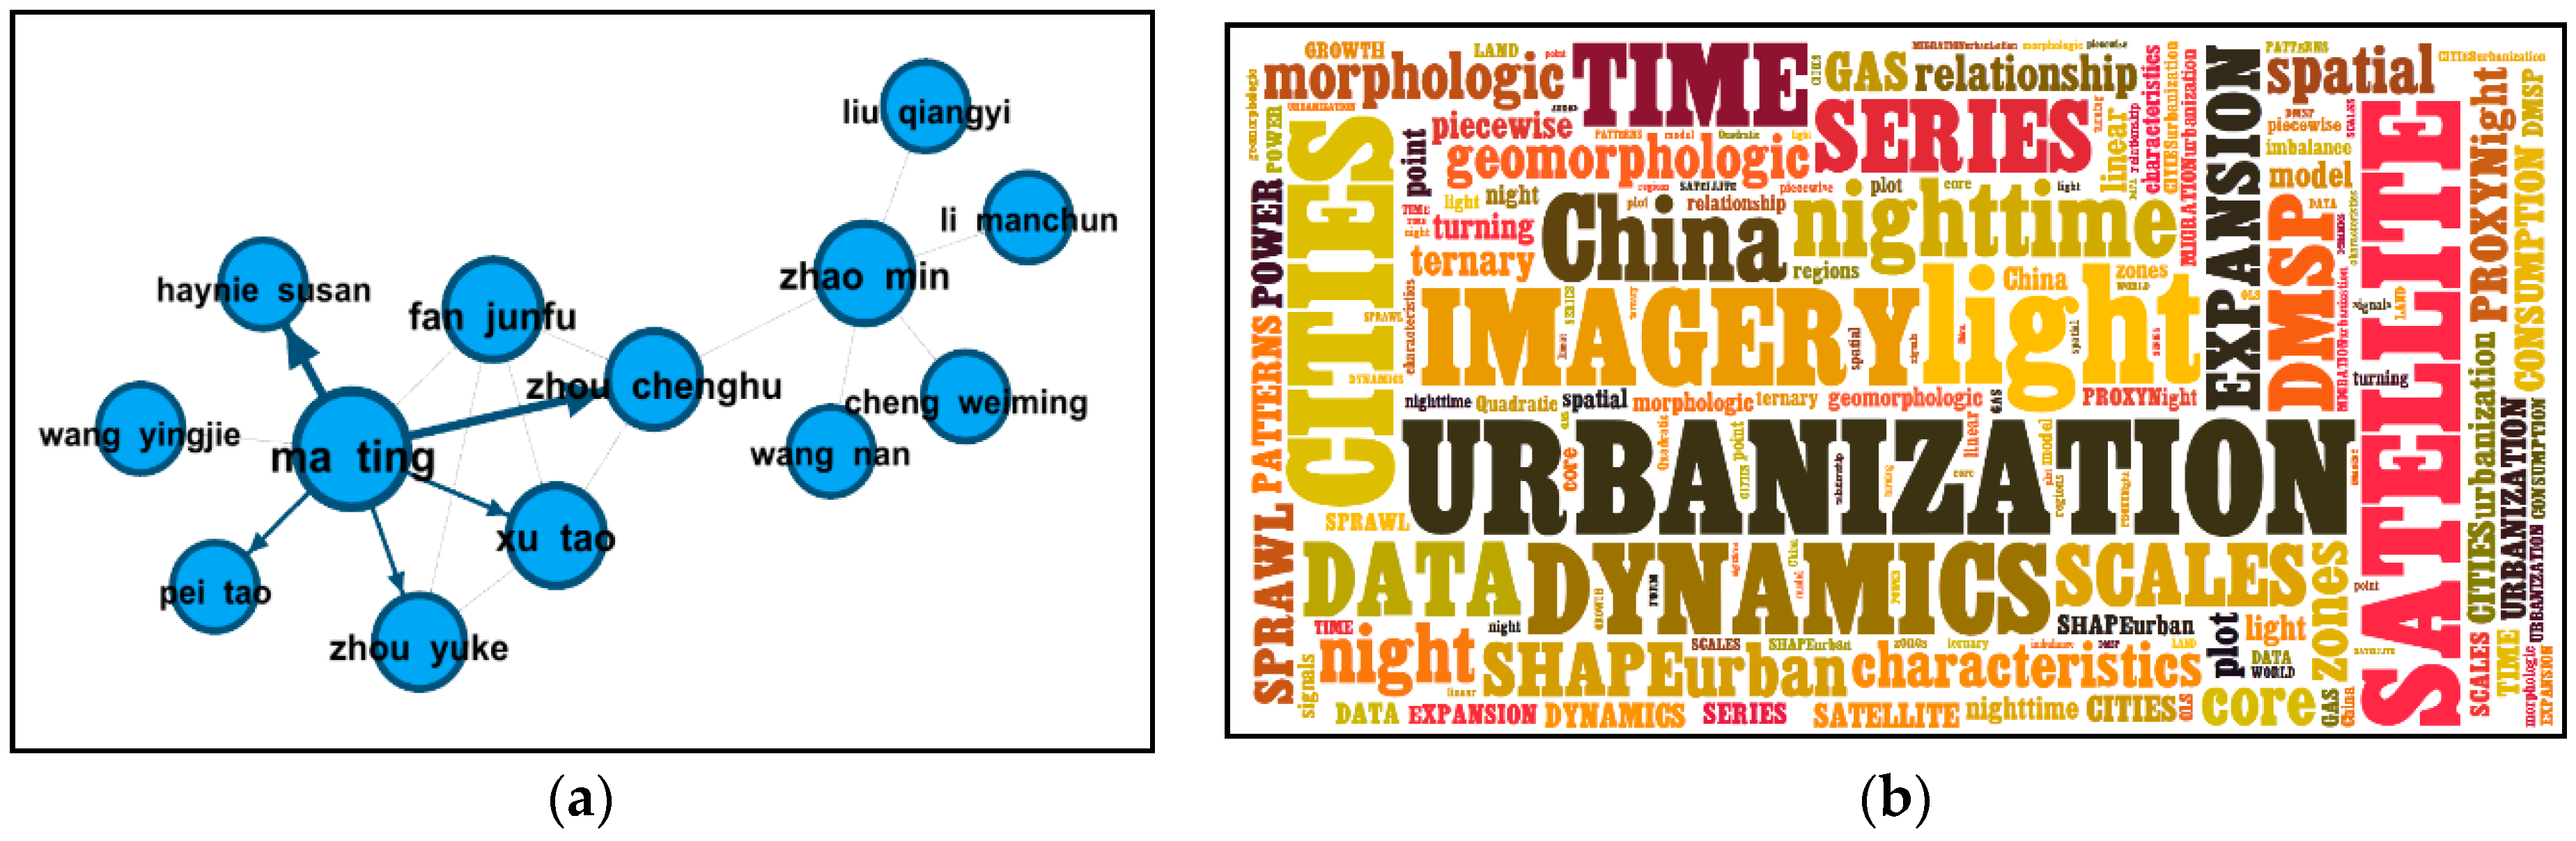
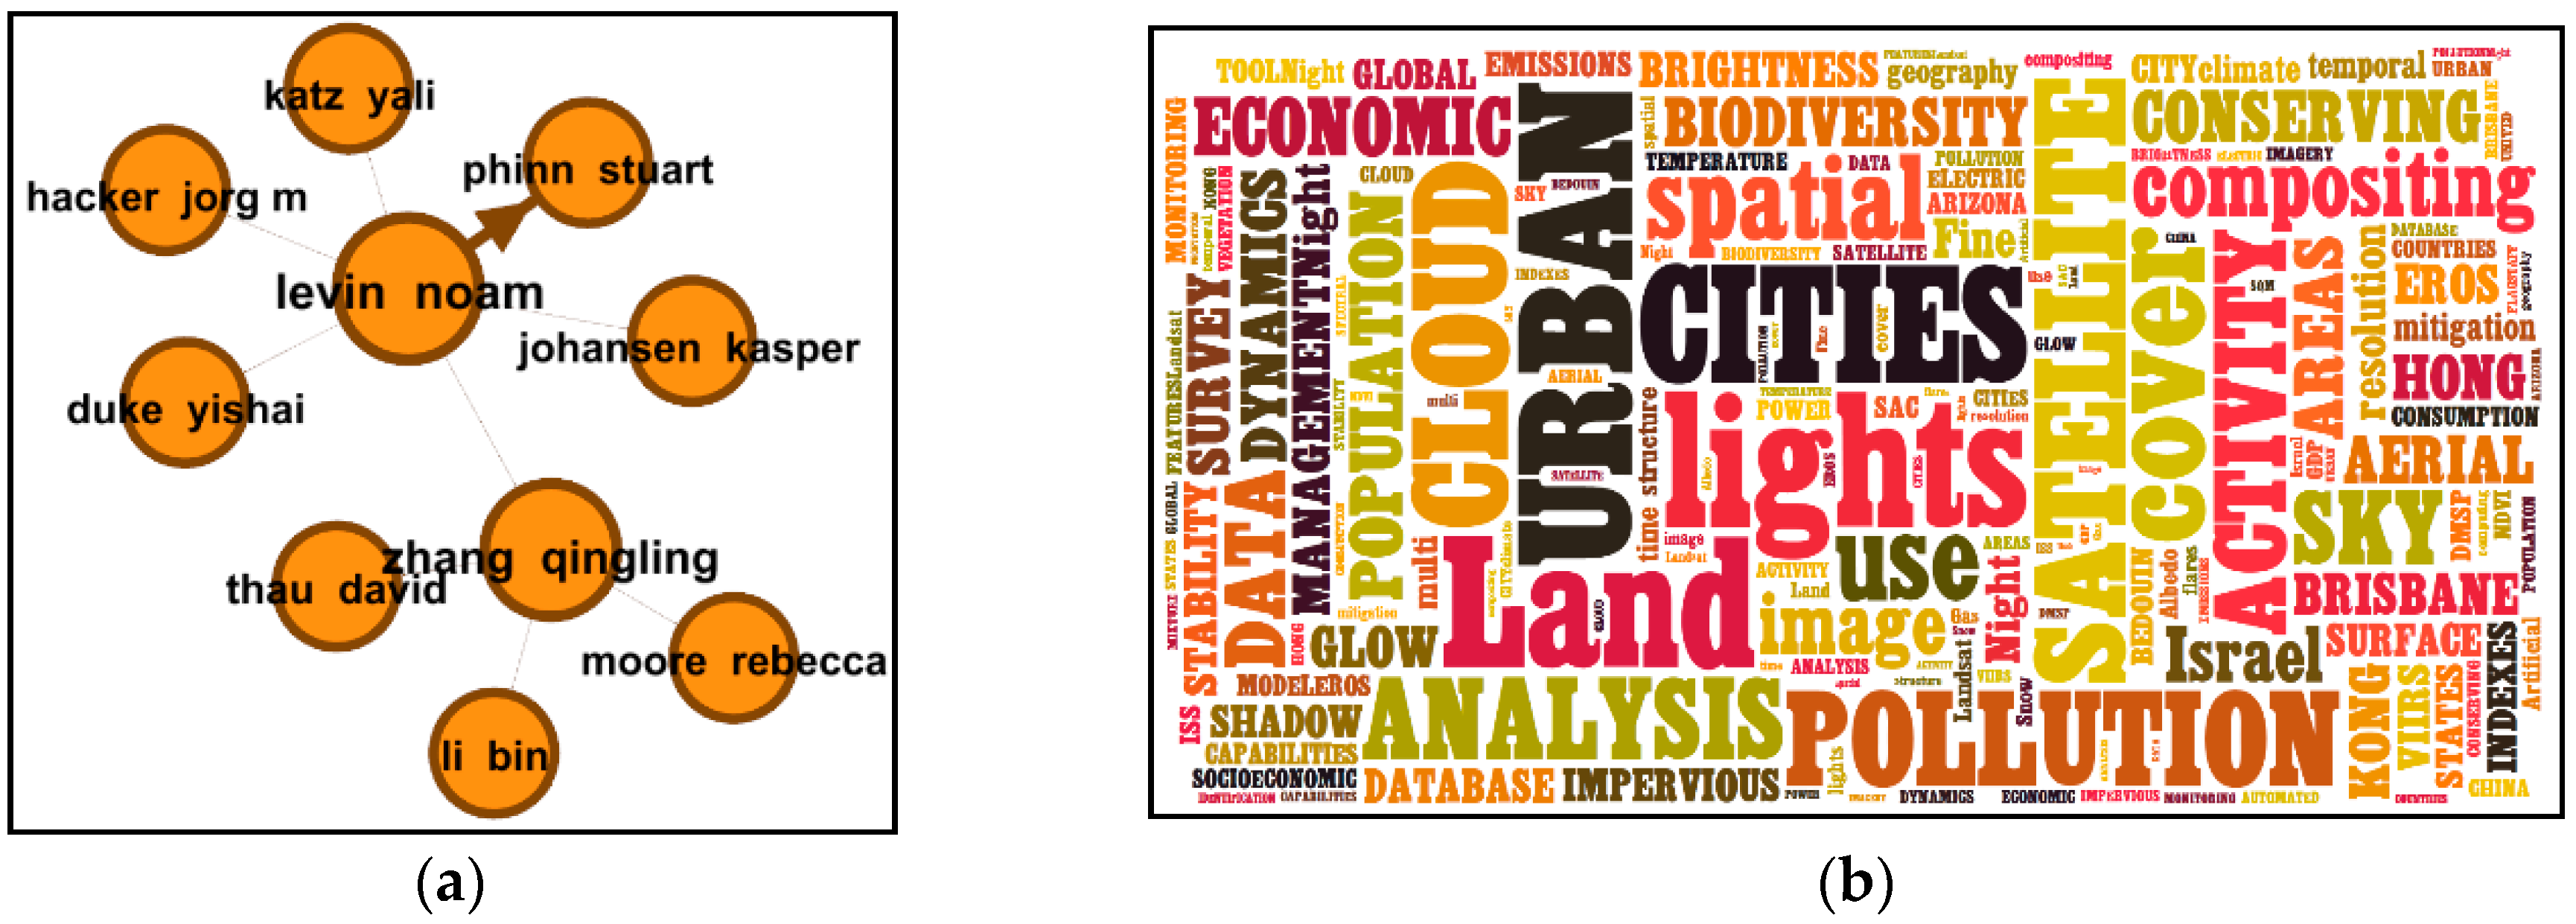
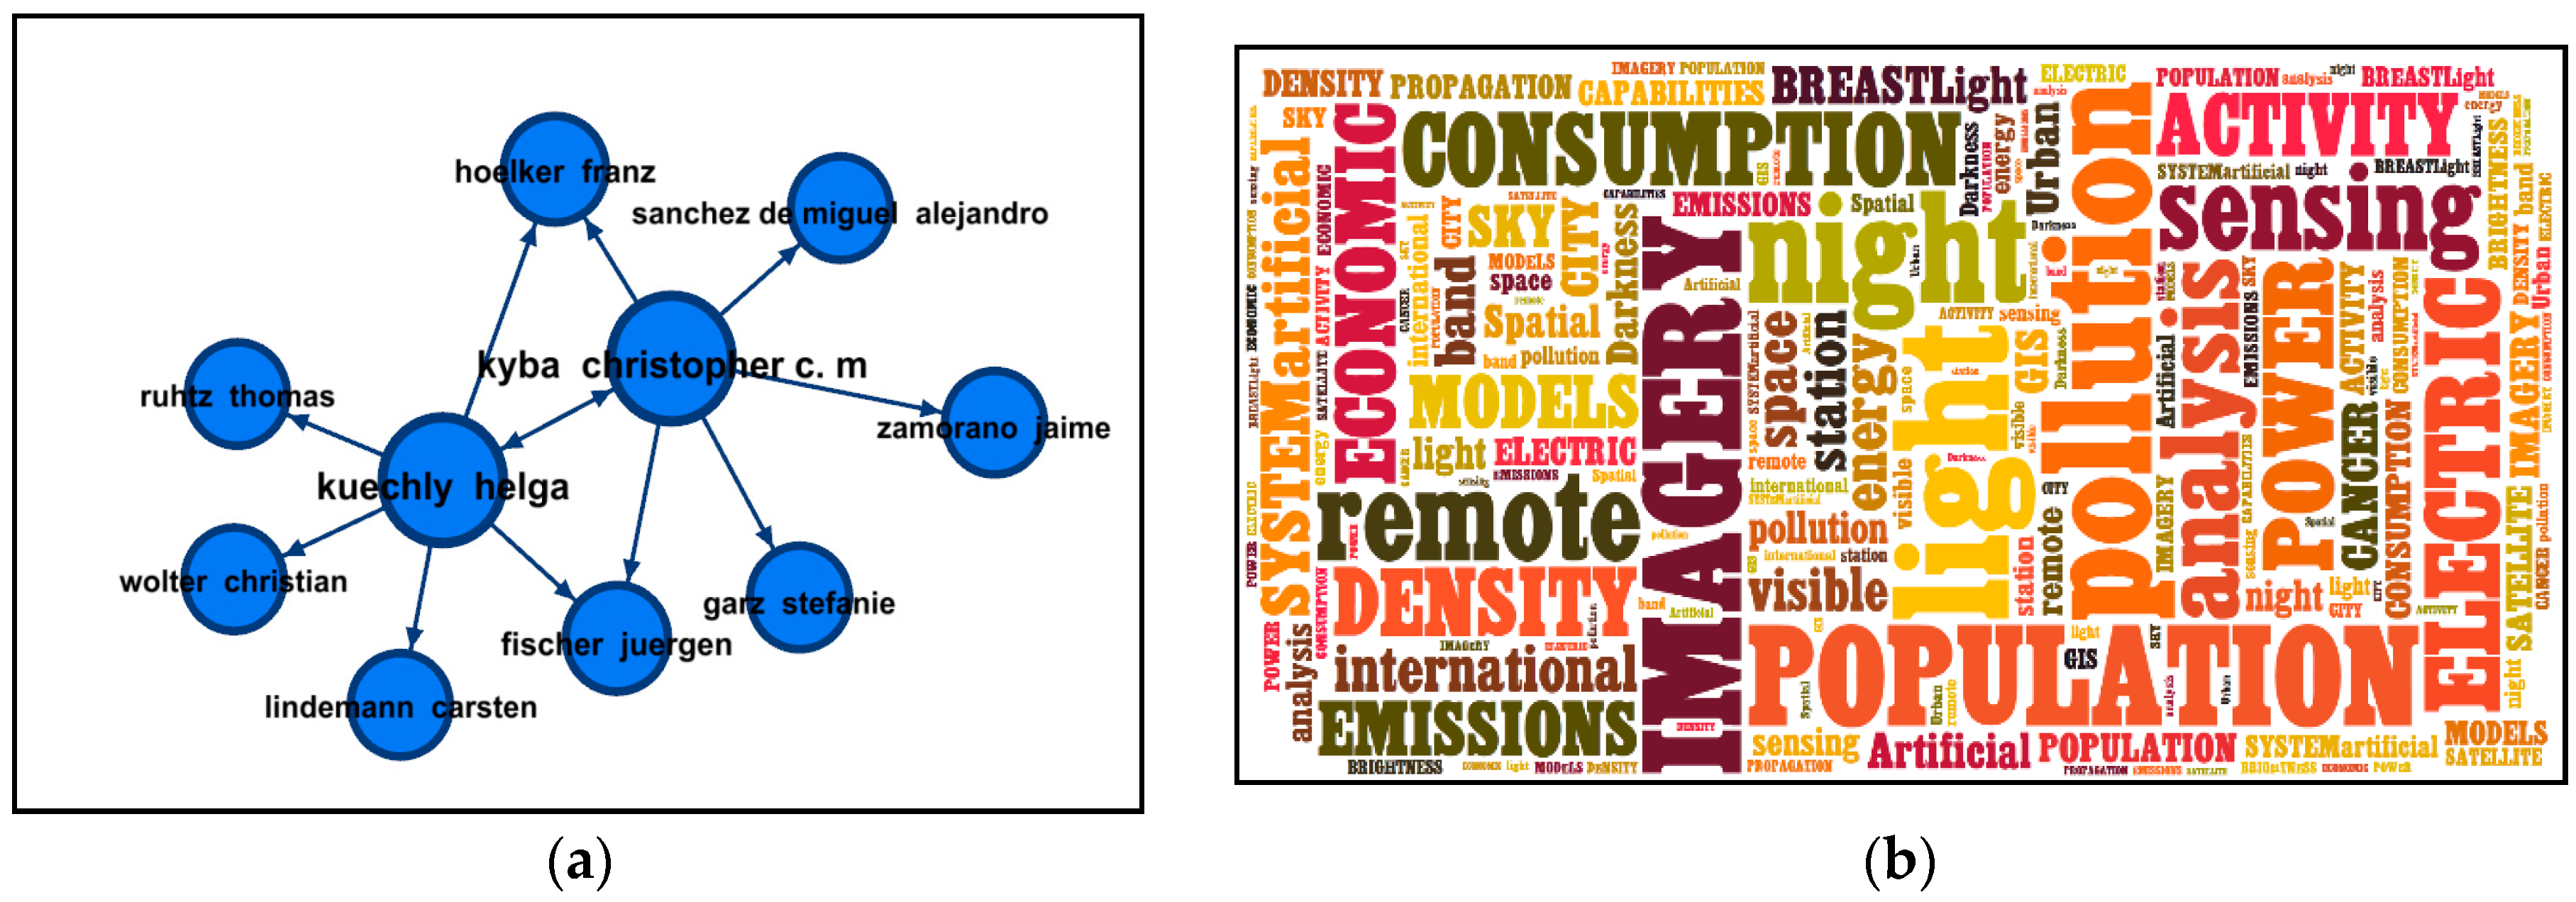
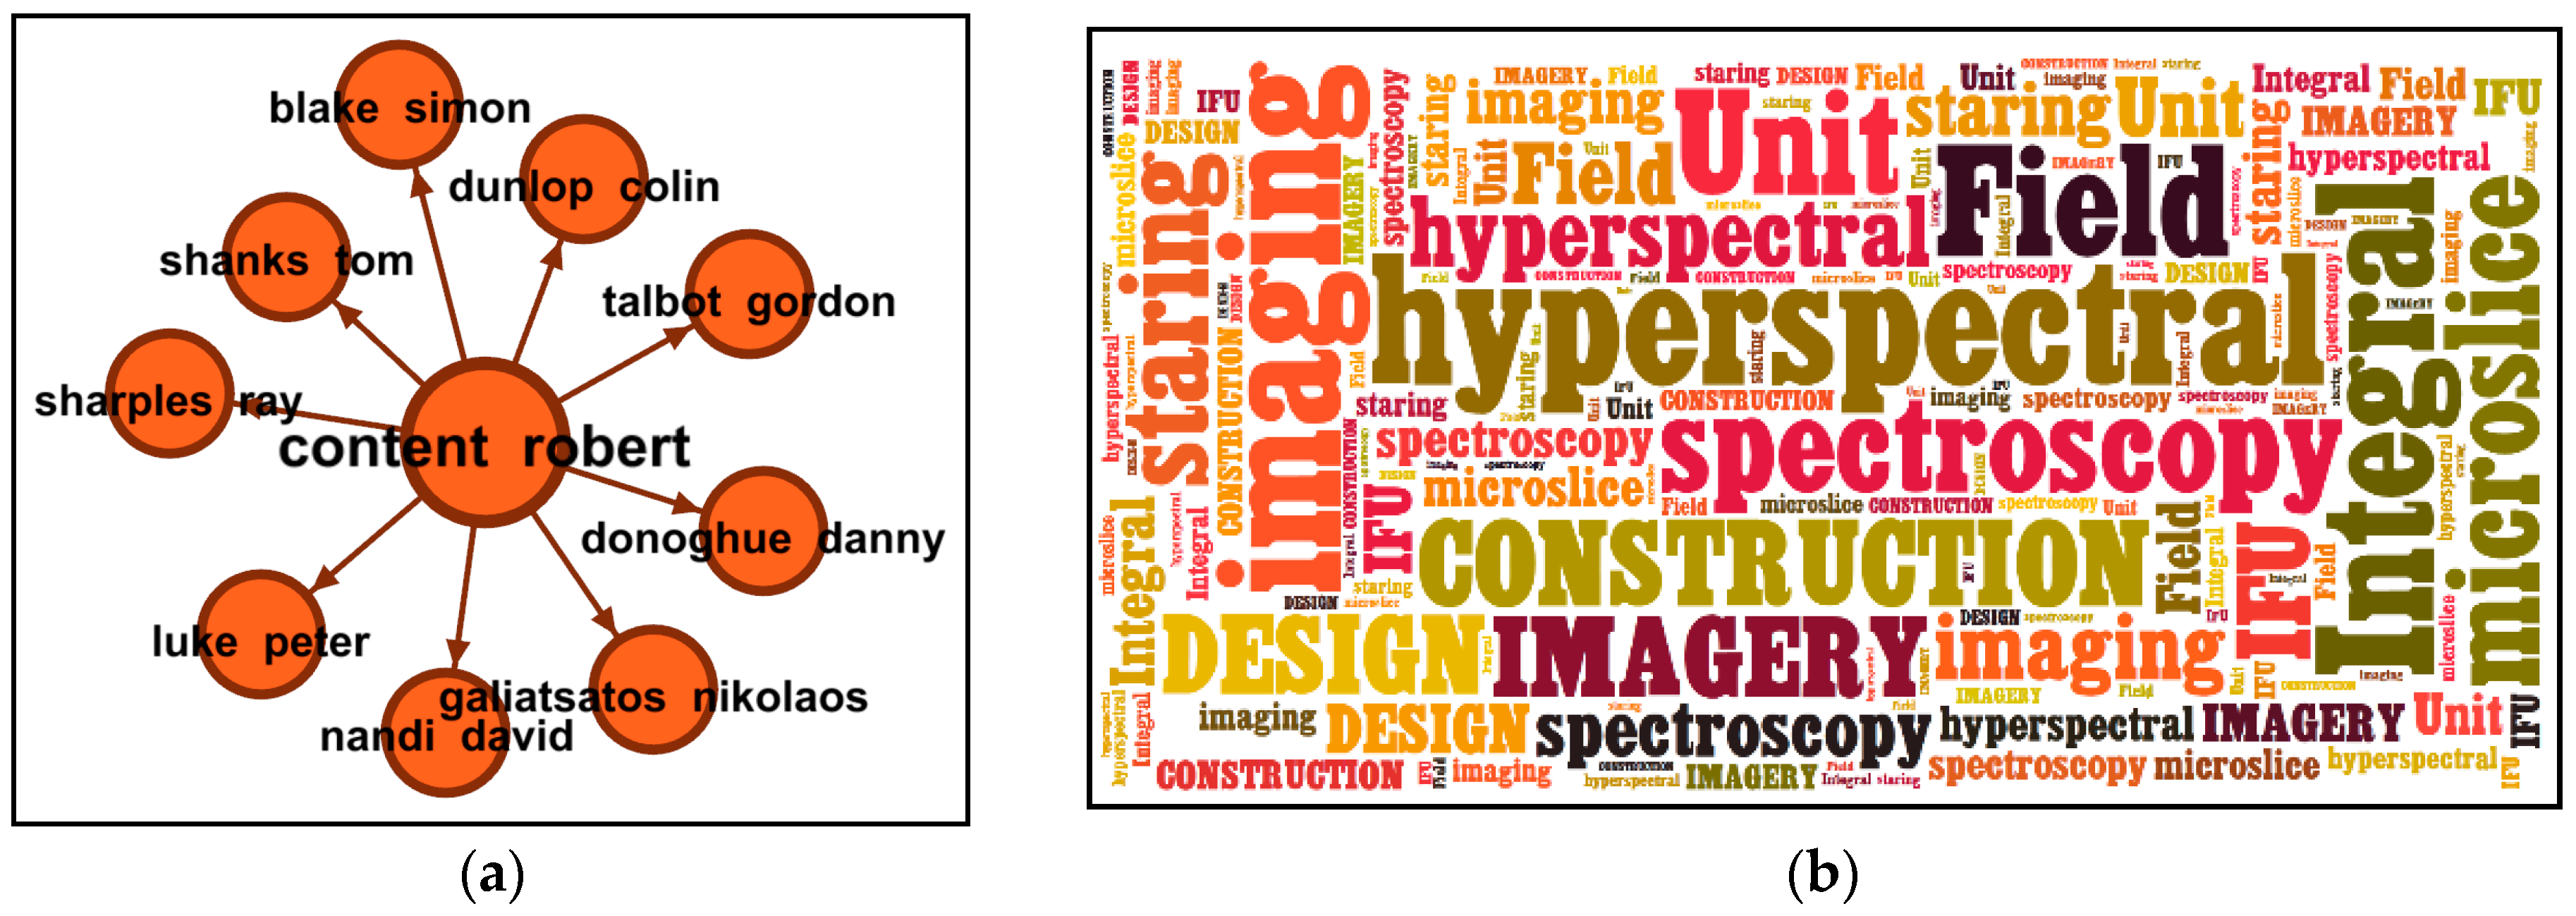
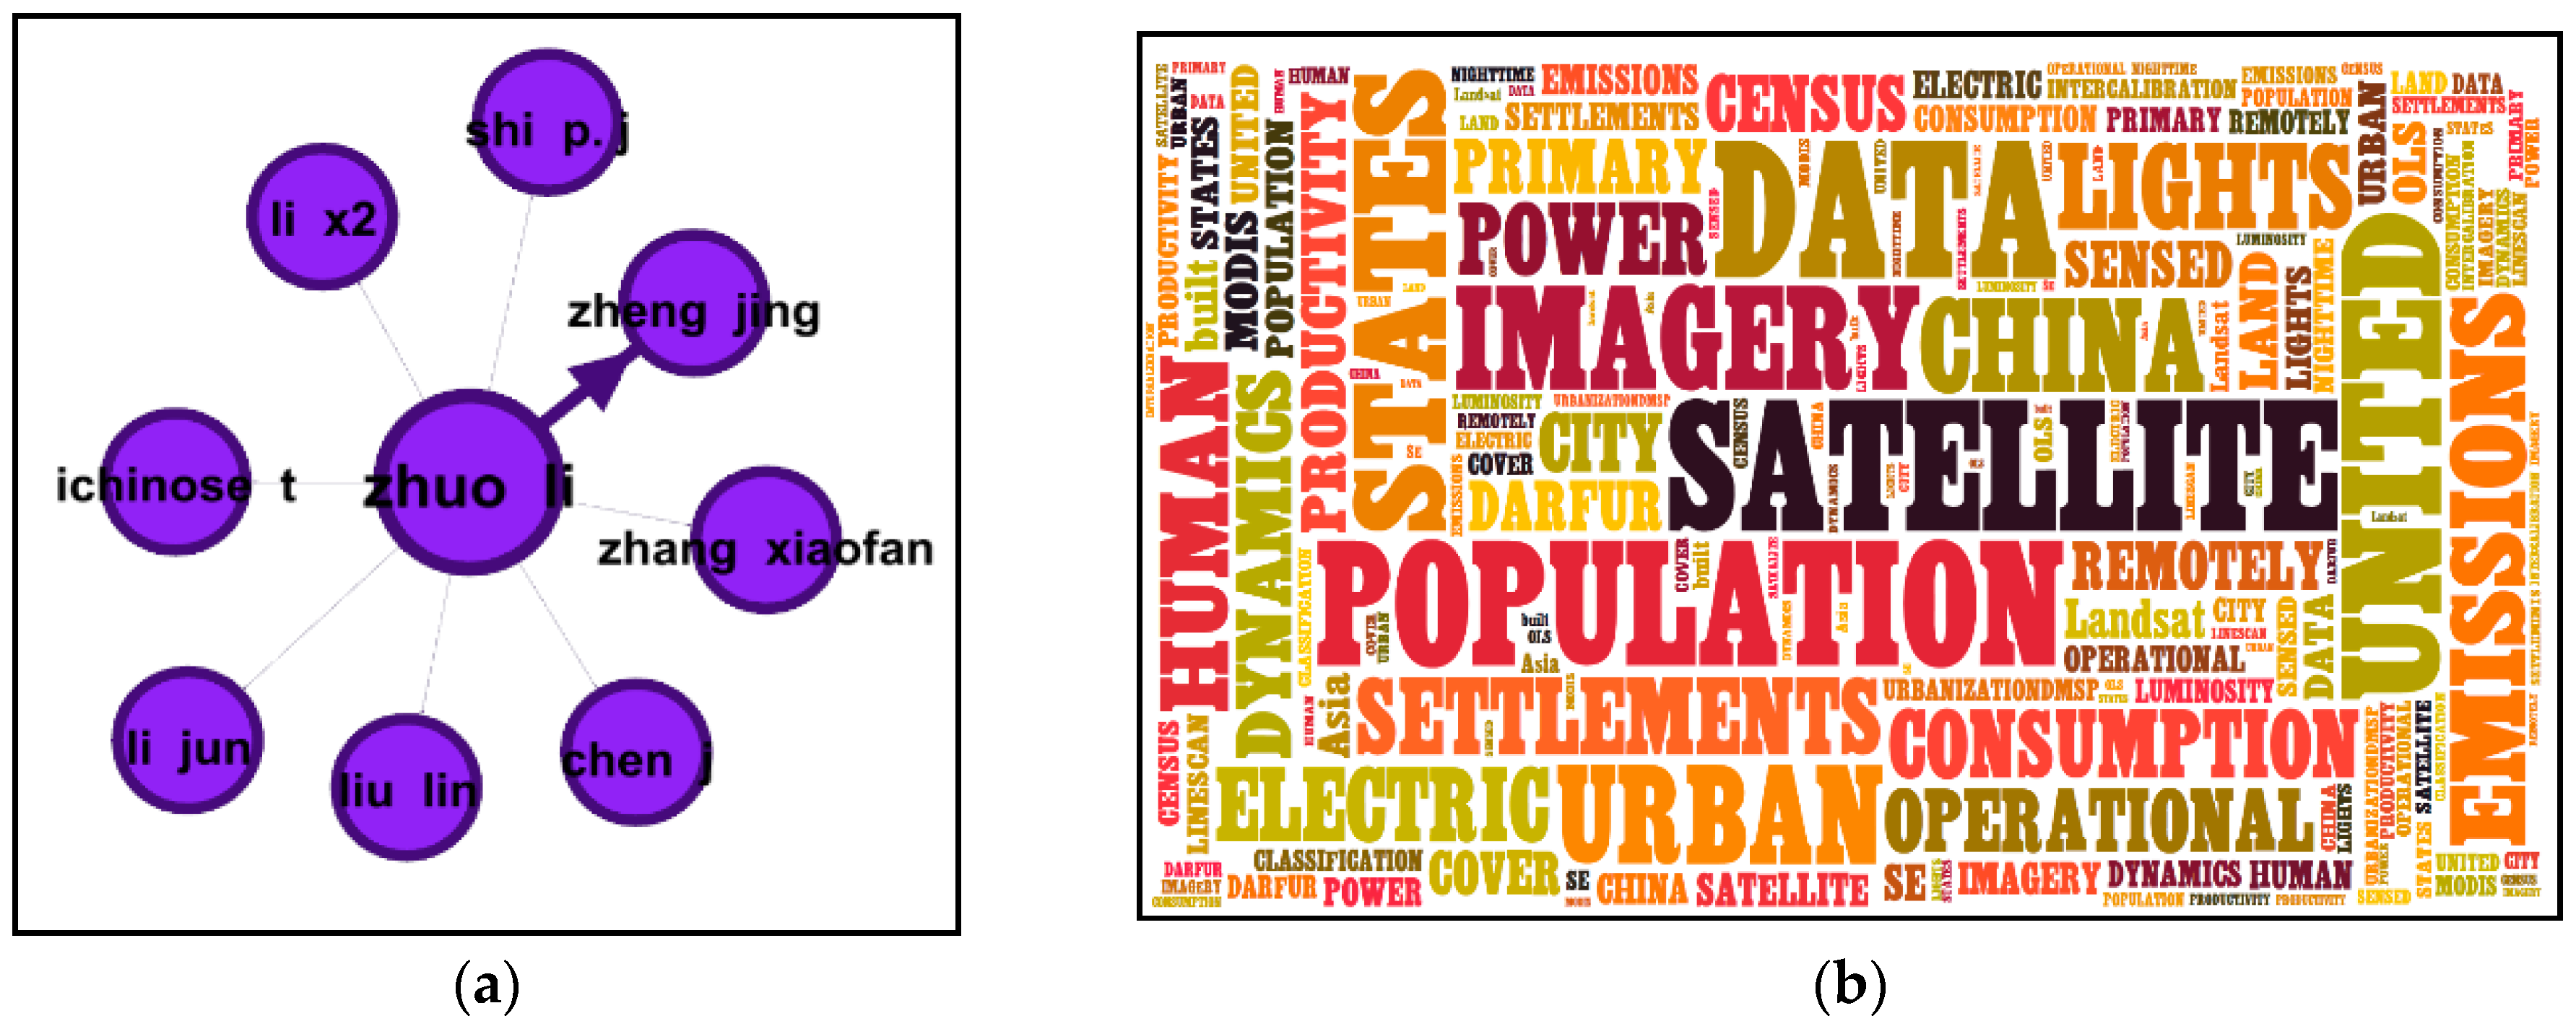
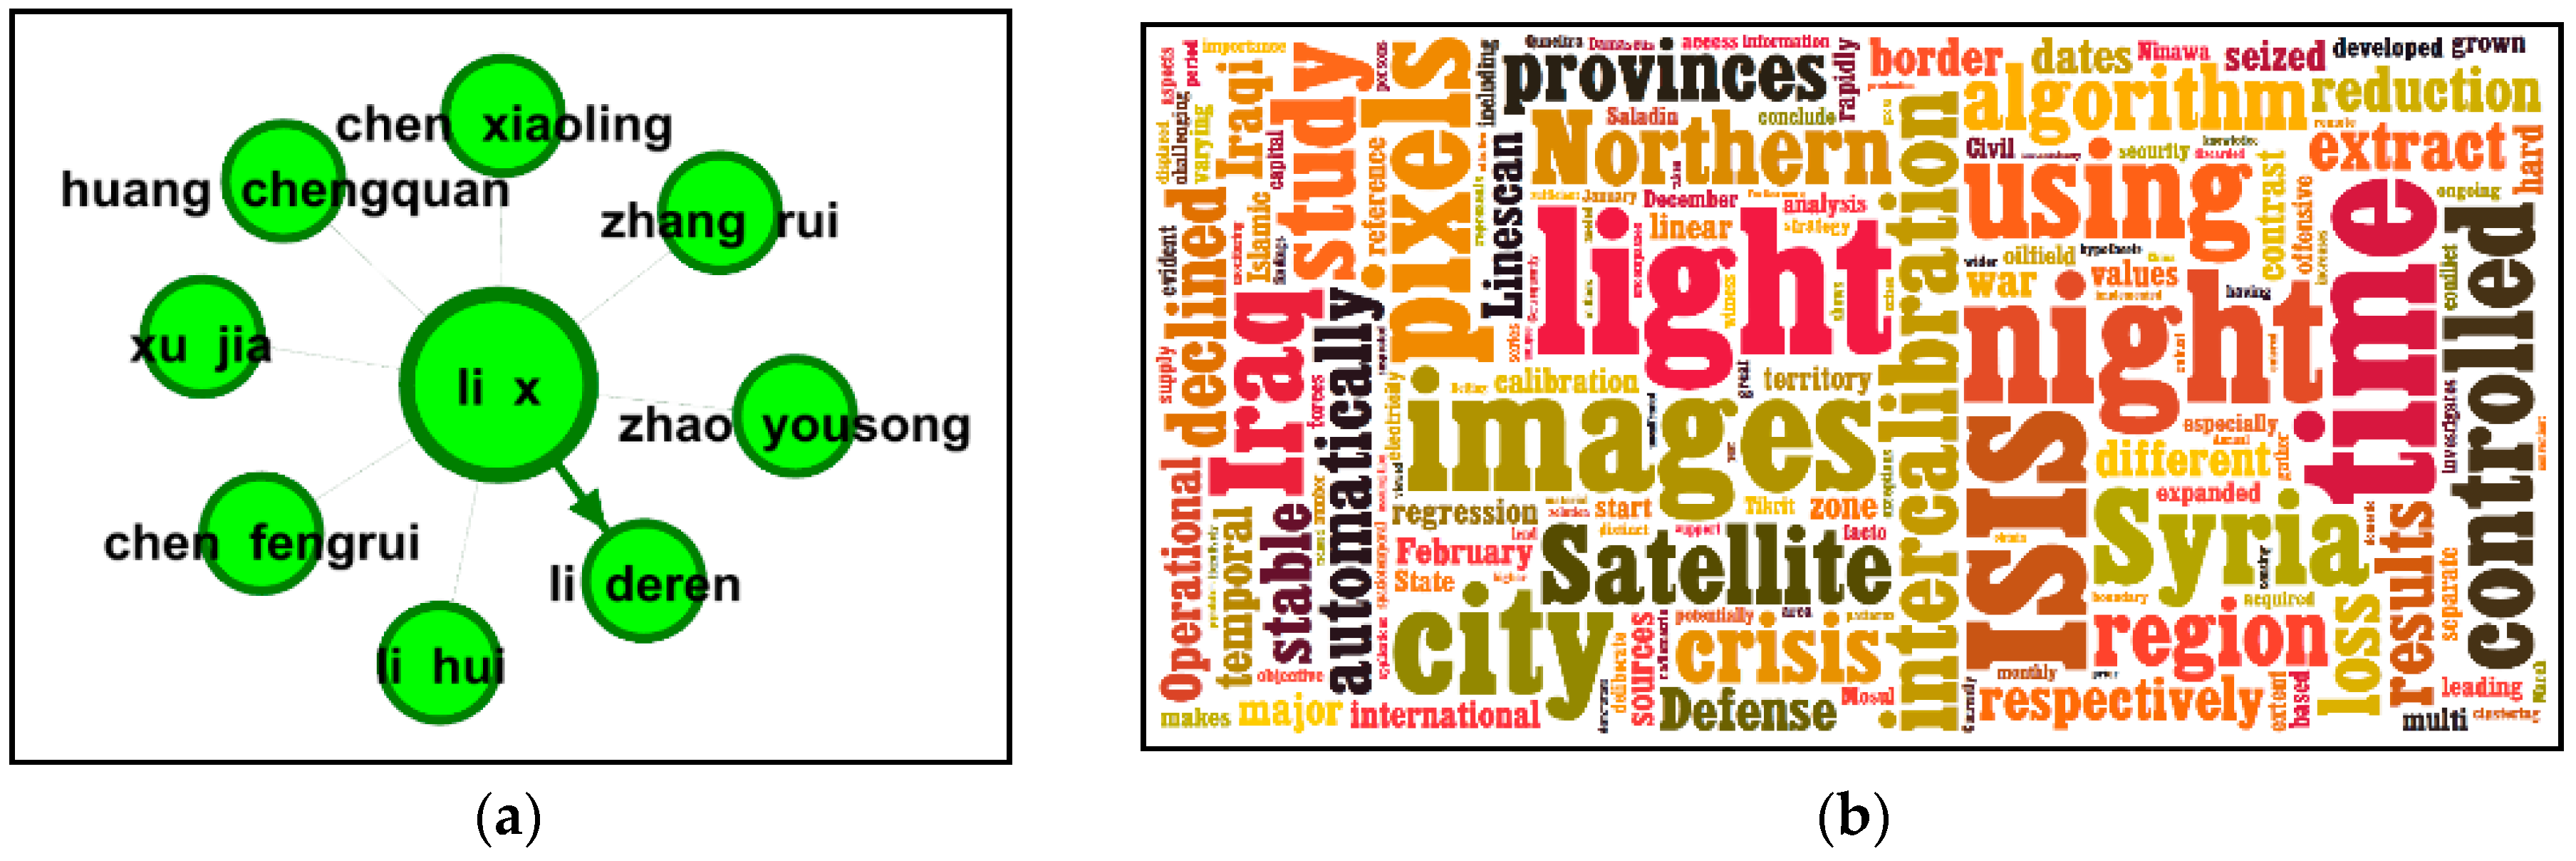
4.2.2. Data-Production Communities
4.2.3. Application-Oriented Communities
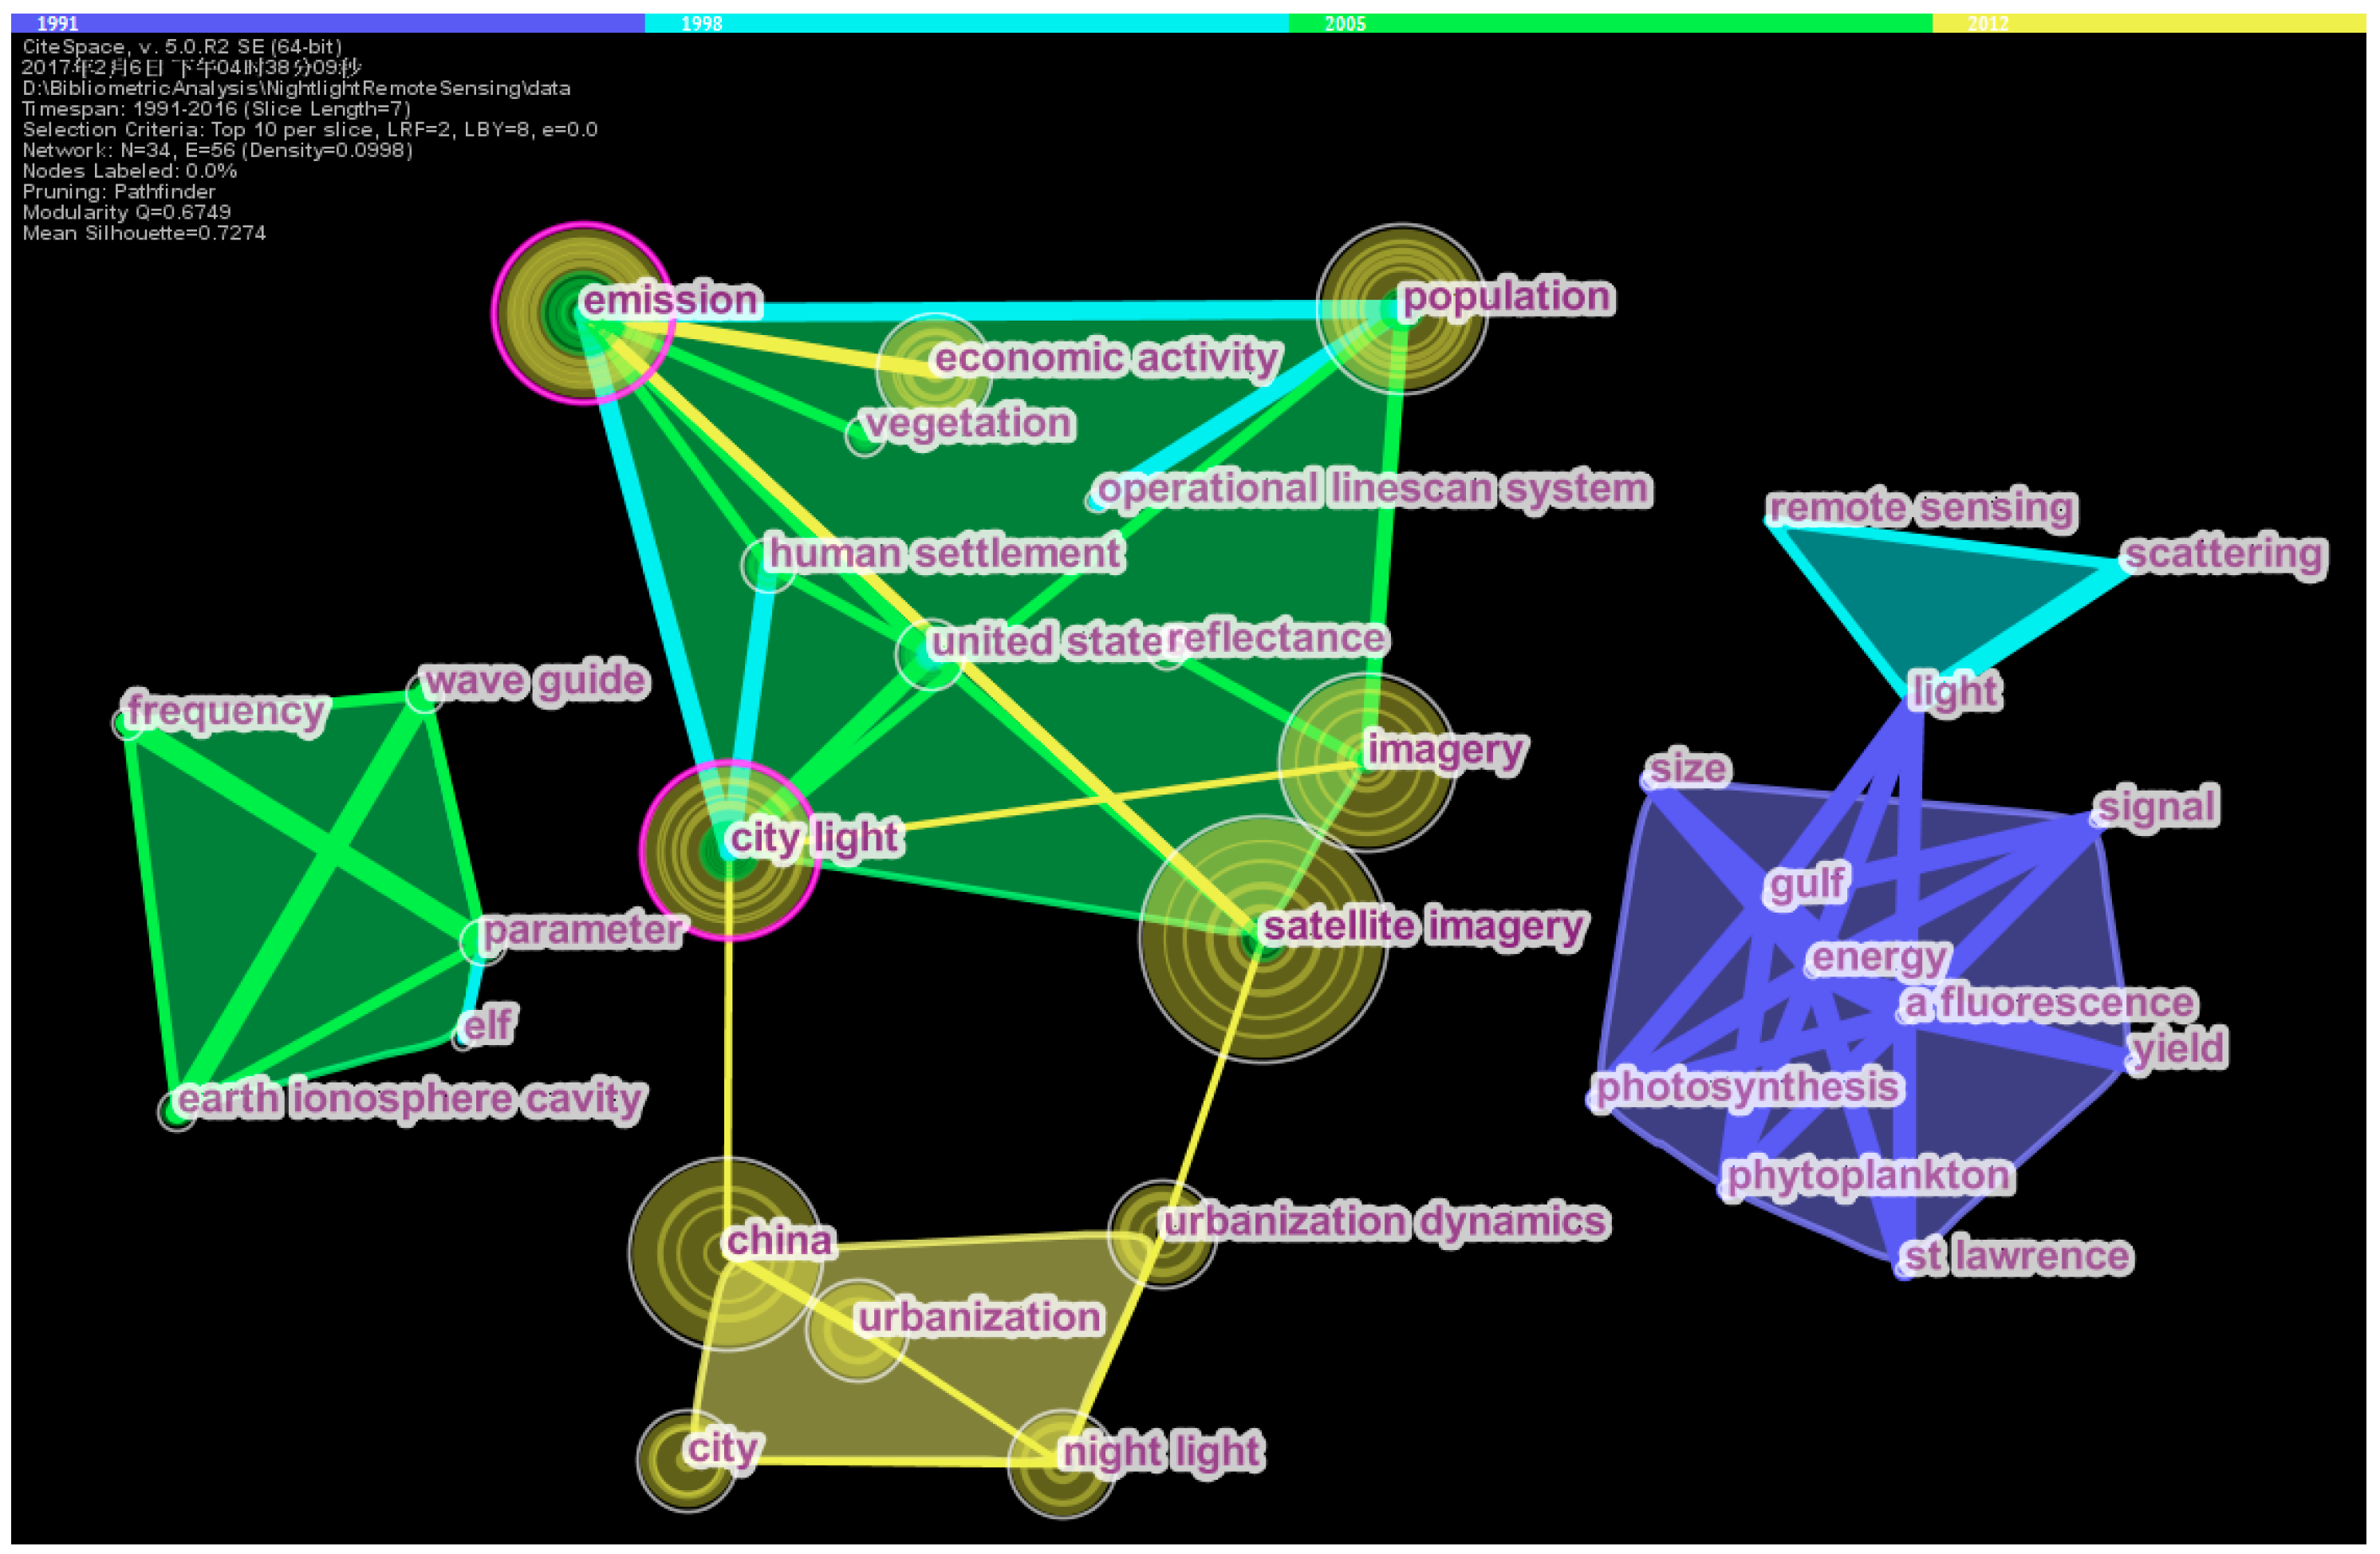
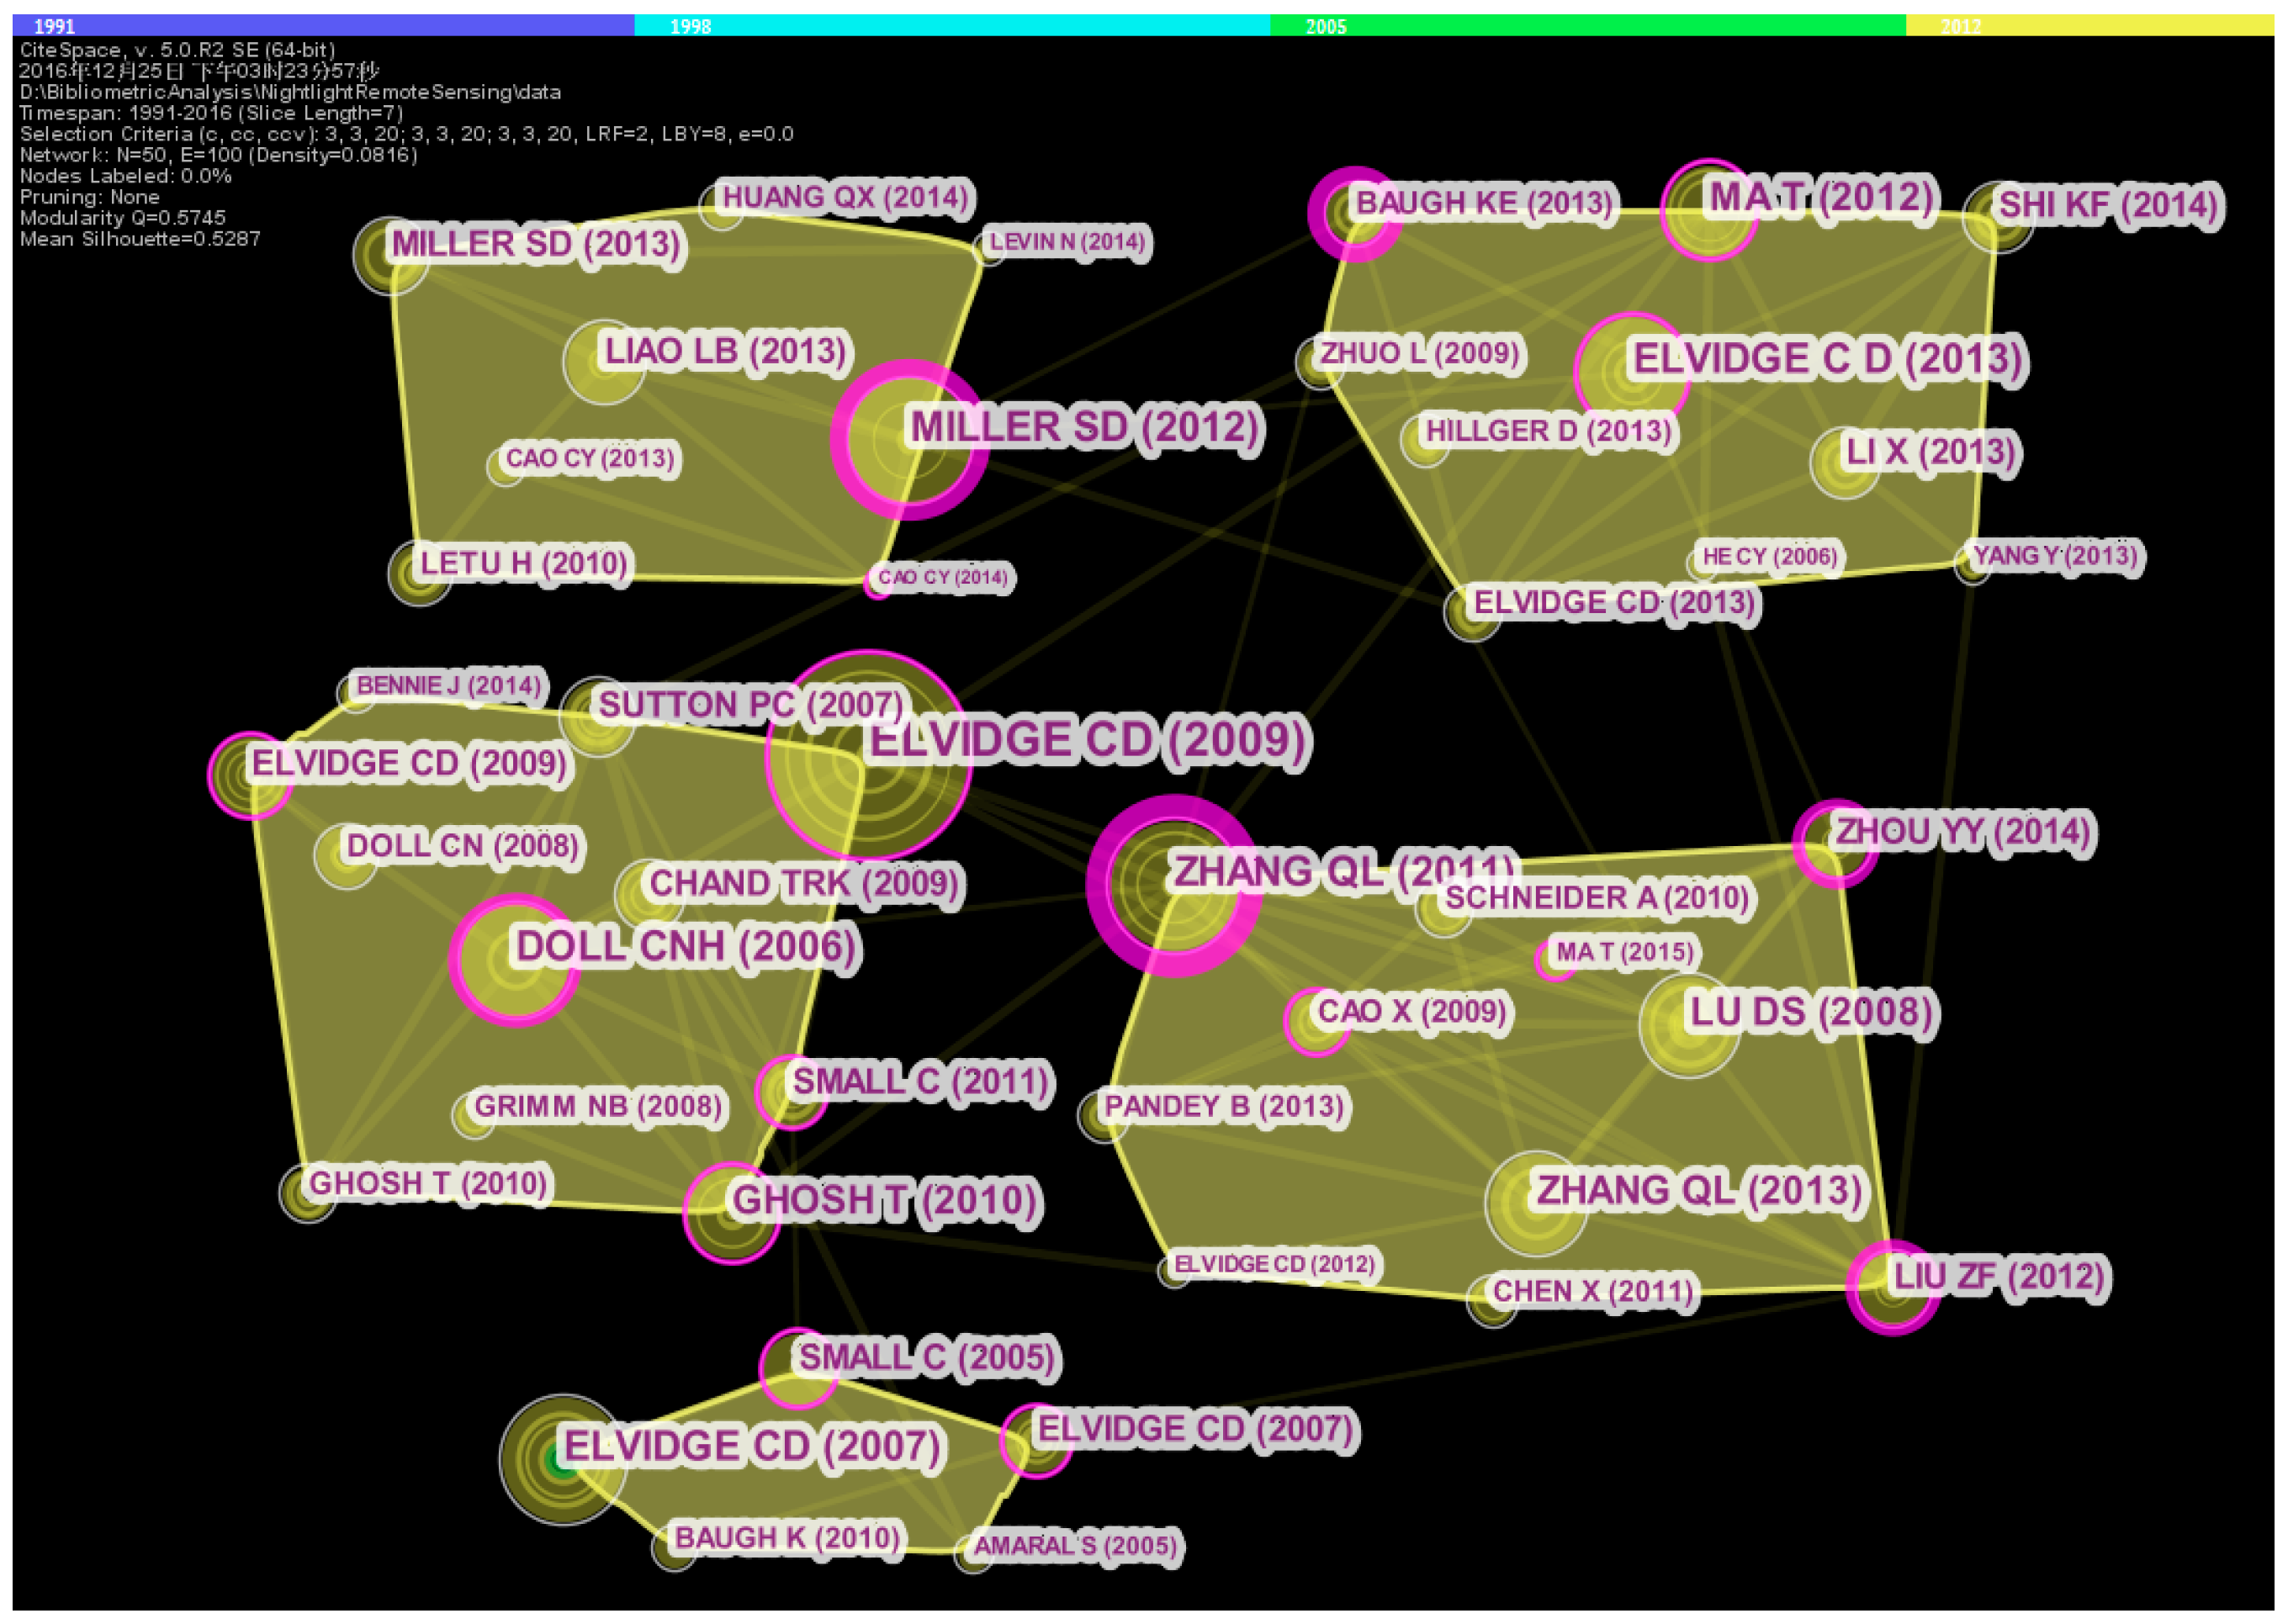
4.3. Important Research Topic and References
- Miller, S.D. (2012) cluster: In 2012, Miller, S.D. published a paper in the journal of PNAS. In this article, Miller, S.D. described a new NTL data source, the Suomi NPP satellite launched in 2011. This paper received high exposure with a wide audience of the journal PNAS. In addition, the new data source is a substantial improvement over the first generation of NTL data. DMSP/OLS is visible, the spatial accuracy, radiometric accuracy, and sensitivity have been enhanced by 45–88 times higher, 256 times finer, and about 10 times higher, respectively. The calibration is also improved from un-calibration to calibration on-board [38]. This cluster represents the latest research directions using the second generation of Suomi NPP VIIRS DNB dataset.
- Elvidge, C.D. (2009) cluster: In 2009, Elvidge, C.D. published two articles using NTL data, arguing that natural gas consumption reflects the economic development level of countries. One concerned map** the global distributed natural gas consumption using the gas flare data extracted from NTL imagery [65]. The second proposed a new poverty index for describing the spatial-explicit development analysis, based on NTL data [66]. These both deployed the DMSP/OLS data to make a connection between nighttime lights and economic activities. The poverty index generated by NTL remote sensing has an advantage over GDP as captures spatial unevenness. Similar work was also conducted in the nodes like Doll’s work [67], who also produced a global economic activity map.
- Elvidge, C.D. (2007) cluster: The reference published in 2007 by Elvidge, C.D. is using the multiple source datasets to build up a global Impervious Surfaces Area (ISA) model, thus producing the global ISA distribution map [68]. Multiple source data include the coarse resolution imagery and the census data. ISA is the most common artifacts constructed by human and can be detected by the NTL remote sensing, such as roads, parking lots, etc. ISA data are ideally suited for analyzing the evolution paths of the country-level development, later studies on urbanization using ISA data are an extension on this work.
- Elvidge, C.D. (2013) cluster: In 2013, Elvidge, C.D. published two papers, one is to introduce the superior property of the NPP VIIRS data over the traditional DSMP/OLS data [69]. The other one is to build a night-fire map using the NPP VIIRS DNB dataset [70] and the quality of map can accurate to the level of sub-pixel. Similar work using the VIIRS DNB also emerge in Baugh’s work [71]. Li’s work is to use the NPP-VIIRS data to model the regional economic study of China [72]. Differently, Ma’s work still uses the DMSP/OLS data because of the long-term analysis demands, his work is also included in the cluster [7]. Therefore, most work of this cluster can be regarded as the VIIRS application related studies.
- Zhang, Q.L. (2011) cluster: In 2011, Zhang, Q.L. studied the global and regional urbanization using the multiple terms of DMSP/OLS dataset [73]. He also introduced an effective index for in the 2013 to depict the internal development level in the core cities, namely vegetation adjusted NTL urban index (VANUI) in reference [59]. Ma’s work of 2015 emerges in the cluster which studied the dynamic urbanization processes using the DMSP/OLS dataset [51]. Work of Elvidge, C.D. in 2012 also had a similar research topic and introduced a new index of Night Light Development Index (NLDI), which can be used to help depict the develo** status of the cities or countries [64]. Zhou, Y. also proposed a clustering method for depicting the urban areas of a city [74]. We can conclude that this cluster is related to the topic of urbanization and city development issues.
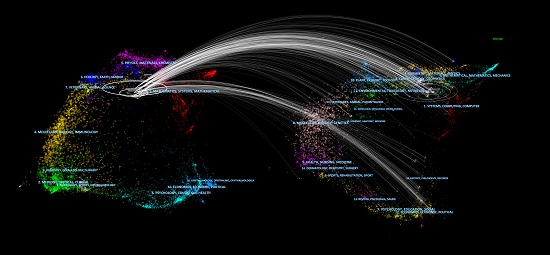
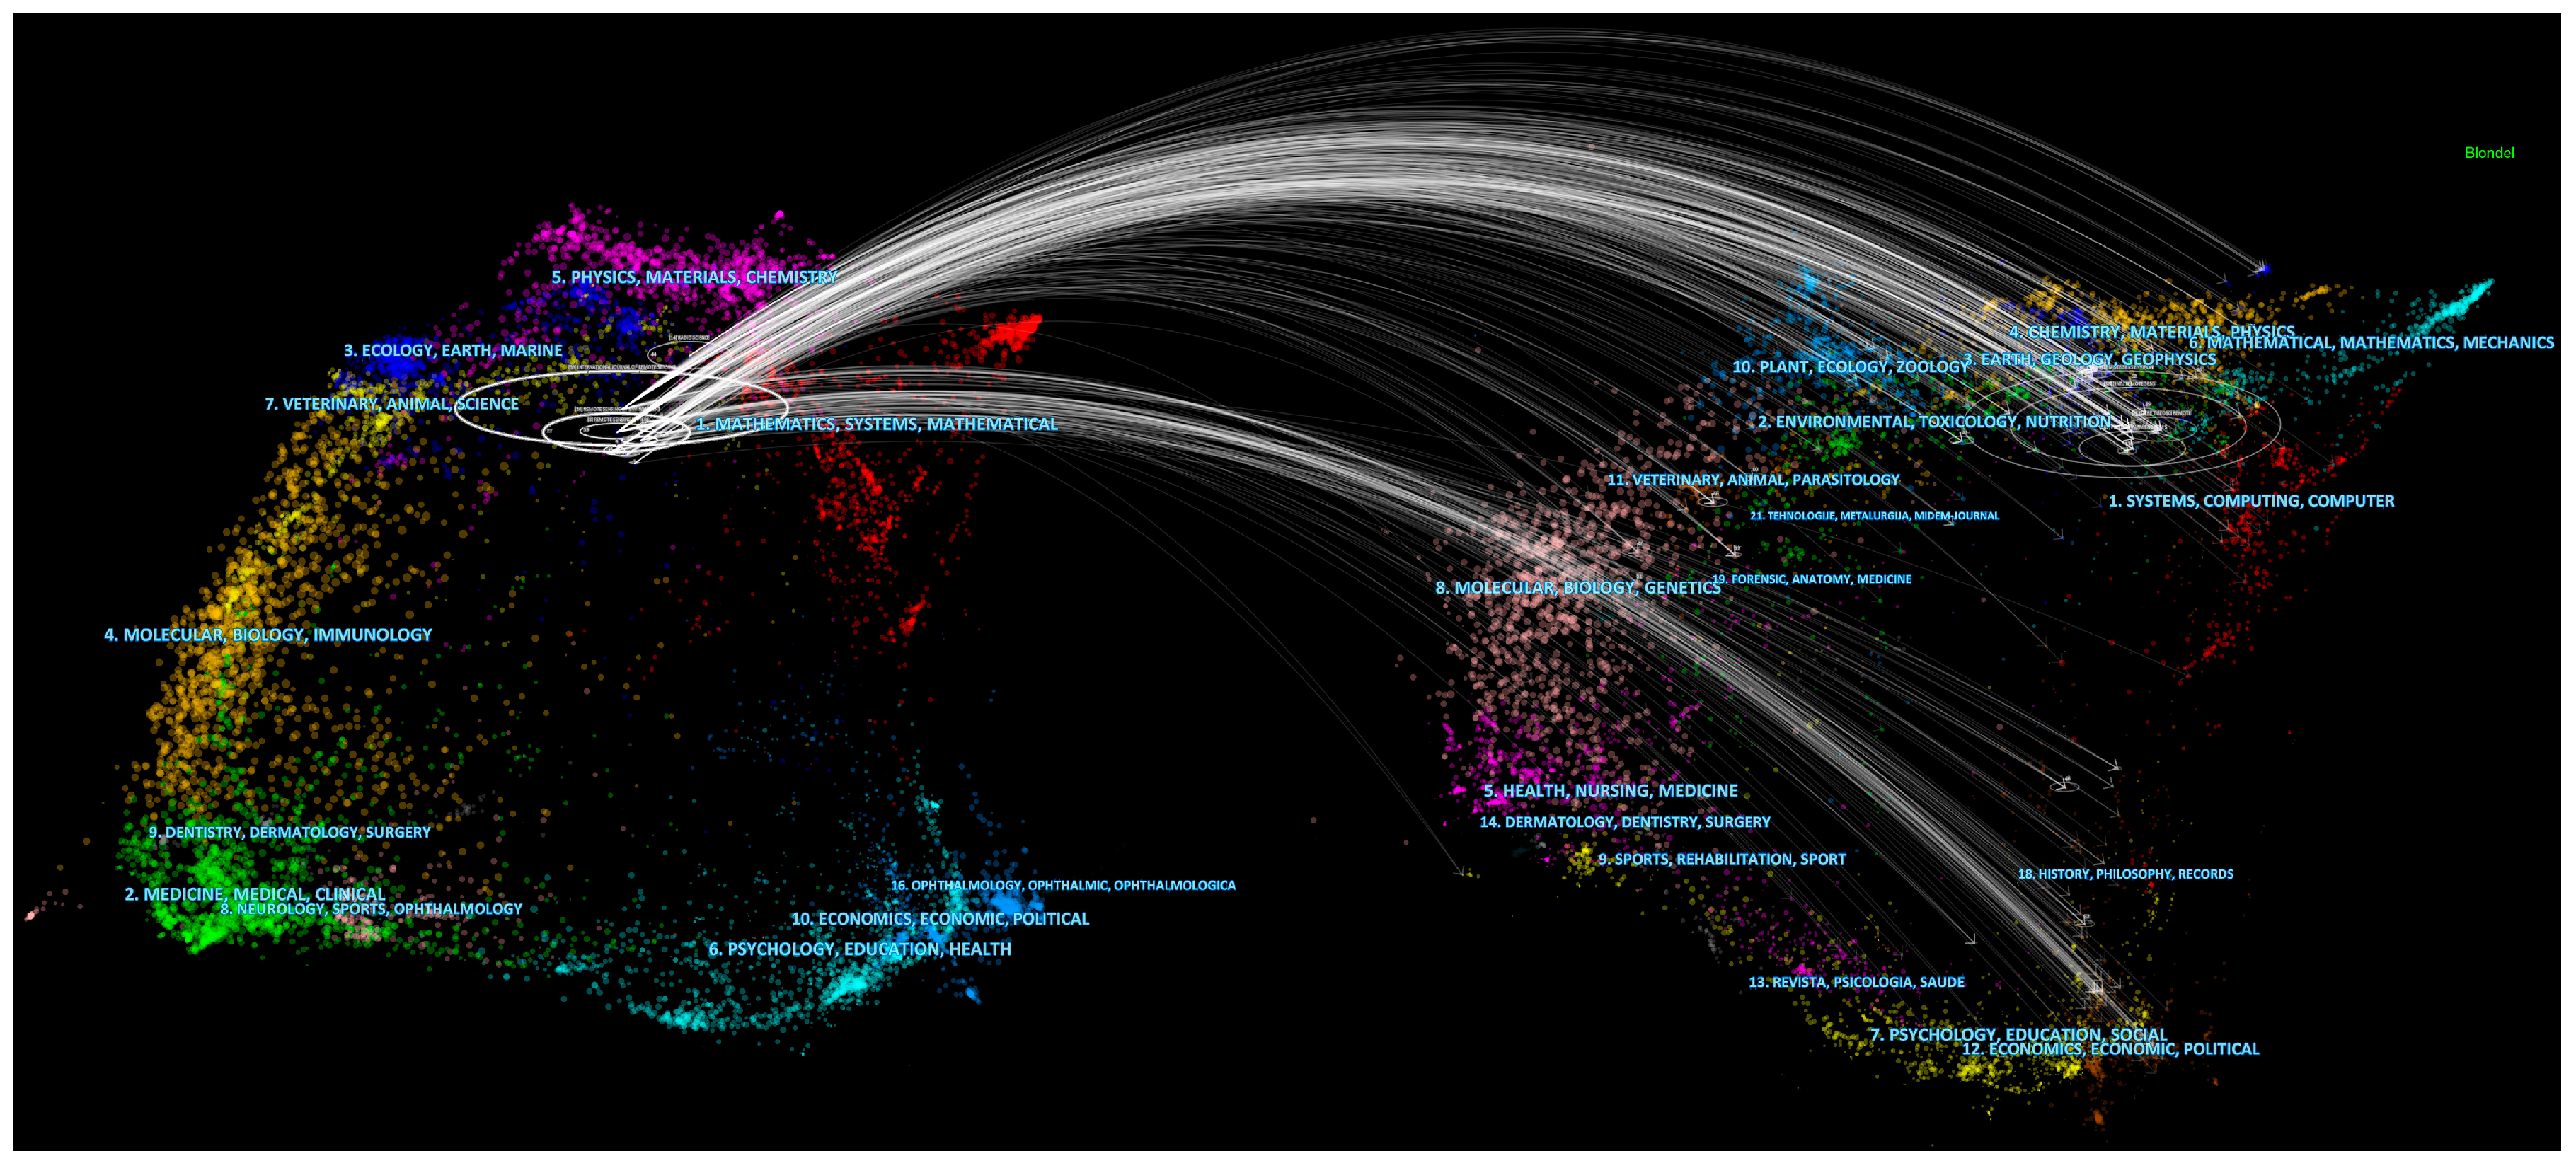
4.4. Discipline-Level Interactions
5. Conclusions
Acknowledgments
Author Contributions
Conflicts of Interest
References
- Elvidge, C.D.; Safran, J.; Tuttle, B.; Sutton, P.; Cinzano, P.; Pettit, D.; Arvesen, J.; Small, C. Potential for global map** of development via a nightsat mission. GeoJournal 2007, 69, 45–53. [Google Scholar] [CrossRef]
- Chen, X.; Nordhaus, W.D. Using luminosity data as a proxy for economic statistics. Proc. Natl. Acad. Sci. USA 2011, 108, 8589–8594. [Google Scholar] [CrossRef] [PubMed]
- Blumenstock, J.; Cadamuro, G.; On, R. Predicting poverty and wealth from mobile phone metadata. Science 2015, 350, 1073–1076. [Google Scholar] [CrossRef] [PubMed]
- Blumenstock, J.E. Fighting poverty with data. Science 2016, 353, 753–754. [Google Scholar] [CrossRef] [PubMed]
- Elvidge, C.D.; Baugh, K.E.; Kihn, E.A.; Kroehl, H.W.; Davis, E.R.; Davis, C.W. Relation between satellite observed visible-near infrared emissions, population, economic activity and electric power consumption. Int. J. Remote Sens. 1997, 18, 1373–1379. [Google Scholar] [CrossRef]
- Imhoff, M.L.; Lawrence, W.T.; Elvidge, C.D.; Paul, T.; Levine, E.; Privalsky, M.V.; Brown, V. Using nighttime DMSP/OLS images of city lights to estimate the impact of urban land use on soil resources in the united states. Remote Sens. Environ. 1997, 59, 105–117. [Google Scholar] [CrossRef]
- Ma, T.; Zhou, C.; Pei, T.; Haynie, S.; Fan, J. Quantitative estimation of urbanization dynamics using time series of DMSP/OLS nighttime light data: A comparative case study from China's cities. Remote Sens. Environ. 2012, 124, 99–107. [Google Scholar] [CrossRef]
- Small, C.; Pozzi, F.; Elvidge, C.D. Spatial analysis of global urban extent from DMSP-OLS night lights. Remote Sens. Environ. 2005, 96, 277–291. [Google Scholar] [CrossRef]
- Hirsch, J.E. An index to quantify an individual’s scientific research output. Proc. Natl. Acad. Sci. USA 2005, 102, 16569–16572. [Google Scholar] [CrossRef] [PubMed] [Green Version]
- Callon, M.; Courtial, J.-P.; Turner, W.A.; Bauin, S. From translations to problematic networks: An introduction to co-word analysis. Soc. Sci. Inf. 1983, 22, 191–235. [Google Scholar] [CrossRef]
- Small, H. Co-citation in the scientific literature: A new measure of the relationship between two documents. J. Am. Soc. Inf. Sci. 1973, 24, 265–269. [Google Scholar] [CrossRef]
- Mali, F.; Kronegger, L.; Doreian, P.; Ferligoj, A. Dynamic scientific co-authorship networks. In Models of Science Dynamics; Springer: Berlin/Heidelberg, 2012; pp. 195–232. [Google Scholar]
- Tian, Y.; Wen, C.; Hong, S. Global scientific production on GIS research by bibliometric analysis from 1997 to 2006. J. Informetr. 2008, 2, 65–74. [Google Scholar] [CrossRef]
- Liu, C.; Gui, Q. Map** intellectual structures and dynamics of transport geography research: A scientometric overview from 1982 to 2014. Scientometrics 2016, 109, 159–184. [Google Scholar] [CrossRef]
- Peng, Y.; Lin, A.; Wang, K.; Liu, F.; Zeng, F.; Yang, L. Global trends in dem-related research from 1994 to 2013: A bibliometric analysis. Scientometrics 2015, 105, 347–366. [Google Scholar] [CrossRef]
- Li, L.; Liu, Y.; Zhu, H.; Ying, S.; Luo, Q.; Luo, H.; Kuai, X.; ** regional economic activity from night-time light satellite imagery. Ecol. Econ. 2006, 57, 75–92. [Google Scholar] [CrossRef]
- Elvidge, C.; Tuttle, B.; Sutton, P.; Baugh, K.; Howard, A.; Milesi, C.; Bhaduri, B.; Nemani, R. Global distribution and density of constructed impervious surfaces. Sensors 2007, 7, 1962–1979. [Google Scholar] [CrossRef]
- Elvidge, C.D.; Baugh, K.E.; Zhizhin, M.; Hsu, F.-C. Why VIIRS data are superior to DMSP for map** nighttime lights. Proc. Asia-Pac. Adv. Netw. 2013, 35, 62–69. [Google Scholar] [CrossRef]
- Elvidge, C.D.; Zhizhin, M.; Hsu, F.-C.; Baugh, K.E. VIIRS nightfire: Satellite pyrometry at night. Remote Sens. 2013, 5, 4423–4449. [Google Scholar] [CrossRef]
- Baugh, K.; Hsu, F.-C.; Elvidge, C.D.; Zhizhin, M. Nighttime lights compositing using the VIIRS day-night band: Preliminary results. Proc. Asia-Pac. Adv. Netw. 2013, 35, 70–86. [Google Scholar] [CrossRef]
- Li, X.; Xu, H.; Chen, X.; Li, C. Potential of NPP-VIIRS nighttime light imagery for modeling the regional economy of China. Remote Sens. 2013, 5, 3057–3081. [Google Scholar] [CrossRef]
- Zhang, Q.; Seto, K.C. Map** urbanization dynamics at regional and global scales using multi-temporal DMSP/OLS nighttime light data. Remote Sens. Environ. 2011, 115, 2320–2329. [Google Scholar] [CrossRef]
- Zhou, Y.; Smith, S.J.; Elvidge, C.D.; Zhao, K.; Thomson, A.M.; Imhoff, M.L. A cluster-based method to map urban area from DMSP/OLS nightlights. Remote Sens. Environ. 2014, 147, 173–185. [Google Scholar] [CrossRef]
- Blondel, V.D.; Guillaume, J.-L.; Lambiotte, R.; Lefebvre, E. Fast unfolding of communities in large networks. J. Stat. Mech. Theory Exp. 2008, 2008. [Google Scholar] [CrossRef]
- Jendryke, M.; Balz, T.; McClure, S.C.; Liao, M. Putting people in the picture: Combining big location-based social media data and remote sensing imagery for enhanced contextual urban information in Shanghai. Comput. Environ. Urban Syst. 2017, 62, 99–112. [Google Scholar] [CrossRef]


| ID | Journal | Recs | TLCS | TGCS | JCR Ranking |
|---|---|---|---|---|---|
| 1 | International Journal of Remote Sensing | 39 | 143 | 803 | 13 |
| 2 | Remote Sensing | 27 | 29 | 121 | 5 |
| 3 | Remote Sensing of Environment | 20 | 86 | 517 | 1 |
| 4 | Radio Science | 14 | 0 | 140 | 19 |
| 5 | Remote Sensing Letters | 8 | 15 | 64 | 15 |
| 6 | IEEE Transactions On Geoscience And Remote Sensing | 6 | 11 | 208 | 4 |
| 7 | IEEE Journal of Selected Topics In Applied Earth Observations And Remote Sensing | 4 | 3 | 10 | 11 |
| 8 | International Journal of Applied Earth Observation And Geoinformation | 4 | 12 | 77 | 3 |
| 9 | Journal of Applied Remote Sensing | 3 | 0 | 1 | 24 |
| 10 | GIScience and Remote Sensing | 2 | 2 | 15 | 9 |
| 11 | IEEE Geoscience And Remote Sensing Letters | 2 | 6 | 12 | 10 |
| 12 | ISPRS Journal of Photogrammetry And Remote Sensing | 2 | 28 | 169 | 2 |
| 13 | Photogrammetric Engineering And Remote Sensing | 2 | 51 | 310 | 18 |
| 14 | Earth Observation And Remote Sensing | 1 | 0 | 0 | #N/A |
| 15 | International Journal of Digital Earth | 1 | 0 | 0 | 7 |
| 16 | ISPRS International Journal of Geo-Information | 1 | 0 | 0 | 26 |
| Id | Country | Recs | TLCS | TGCS | Percentage |
|---|---|---|---|---|---|
| 1 | USA | 76 | 306 | 1835 | 55.88% |
| 2 | China | 38 | 56 | 274 | 27.94% |
| 3 | Japan | 10 | 17 | 141 | 7.35% |
| 4 | Israel | 8 | 12 | 96 | 5.88% |
| 5 | Australia | 7 | 29 | 132 | 5.15% |
| 6 | India | 7 | 9 | 92 | 5.15% |
| 7 | UK | 6 | 6 | 67 | 4.41% |
| 8 | Italy | 4 | 22 | 120 | 2.94% |
| 9 | Brazil | 3 | 11 | 52 | 2.21% |
| 10 | Germany | 3 | 7 | 46 | 2.21% |
| Id | Co-Author Groups/Research Community | Proportion | MCC | MPL |
|---|---|---|---|---|
| 1 | Elvidge, C.D., Miller S.D. | 18.43% | 0.37 | 3.507 |
| 2 | Lee, S.H., Cao, C.Y. | 4.27% | 0.27 | 2.801 |
| 3 | Ma, T., Zhou, C.H. | 2.92% | 0.567 | 2.397 |
| 4 | Levin, N., Zhang, Q.L. | 2.25% | 0 | 2.133 |
| 5 | Kyba, C., Kuechly, H. | 2.25% | 0.567 | 1.956 |
| 6 | Centent, R. | 2.25% | 0 | 1.8 |
| 7 | Zhuo, L. | 2.02% | 0 | 1.778 |
| 8 | Li, X. | 2.02% | 0 | 1.778 |
| Total | Total co-author network | 1 | 0.176 | 3.329 |
| Author | IDE | ODE | Degree | CC | BC | EC | CCO |
|---|---|---|---|---|---|---|---|
| Elvidge, C.D. | 10.00 | 23.00 | 33.00 | 0.52 | 0.86 | 1.00 | 0.02 |
| Miller, S.D. | 5.00 | 11.00 | 16.00 | 0.41 | 0.38 | 0.41 | 0.03 |
| Baugh, K. | 0.00 | 4.00 | 4.00 | 0.39 | 0.24 | 0.23 | 0.17 |
| Henderson, M. | 3.00 | 0.00 | 3.00 | 0.30 | 0.20 | 0.07 | 0.33 |
| Gong, P. | 0.00 | 9.00 | 9.00 | 0.24 | 0.17 | 0.07 | 0.03 |
| Feng, D. | 0.00 | 6.00 | 6.00 | 0.36 | 0.09 | 0.25 | 0.13 |
| Straka, W.C. | 0.00 | 5.00 | 5.00 | 0.36 | 0.07 | 0.24 | 0.10 |
| Nghiem, S.V. | 2.00 | 0.00 | 2.00 | 0.35 | 0.07 | 0.17 | 0.00 |
| Chand, T.R.K. | 2.00 | 4.00 | 6.00 | 0.36 | 0.06 | 0.24 | 0.20 |
| Imhoff, M.L. | 0.00 | 5.00 | 5.00 | 0.32 | 0.05 | 0.15 | 0.10 |
| Author | IDE | ODE | Degree | CC | BC | EC | CCO |
|---|---|---|---|---|---|---|---|
| Lee, S.H. | 0 | 8 | 8 | 0.56 | 0.73 | 1.00 | 0.00 |
| Cao, C.Y. | 3 | 3 | 6 | 0.51 | 0.58 | 0.99 | 0.20 |
| Moyer, D. | 0 | 5 | 5 | 0.35 | 0.23 | 0.48 | 0.00 |
| **g, X. | 0 | 4 | 4 | 0.38 | 0.22 | 0.55 | 0.17 |
| Mcintire, J. | 2 | 0 | 2 | 0.42 | 0.08 | 0.43 | 0.00 |
| Oudrari, H. | 2 | 0 | 2 | 0.42 | 0.08 | 0.43 | 0.00 |
| **ong, X.X. | 2 | 0 | 2 | 0.42 | 0.08 | 0.43 | 0.00 |
| Shao, X. | 3 | 0 | 3 | 0.38 | 0.01 | 0.60 | 0.67 |
| Qiu, S. | 0 | 3 | 3 | 0.36 | 0.00 | 0.58 | 0.67 |
| Author | IDE | ODE | Degree | CC | BC | EC | CCO |
|---|---|---|---|---|---|---|---|
| Zhao, M. | 0.00 | 5.00 | 5.00 | 0.52 | 0.58 | 0.33 | 0.00 |
| Zhou, C.H. | 4.00 | 0.00 | 4.00 | 0.60 | 0.53 | 0.78 | 0.50 |
| Ma, T. | 2.00 | 7.00 | 9.00 | 0.57 | 0.48 | 1.00 | 0.24 |
| Fan, J.F. | 1.00 | 4.00 | 5.00 | 0.50 | 0.03 | 0.84 | 0.83 |
| Xu, T. | 2.00 | 3.00 | 5.00 | 0.50 | 0.03 | 0.84 | 0.83 |
| NTL Data Source | NTL Applications Exhibited by Our Identified Research Communities | Research Teams |
|---|---|---|
| DMSP/OLS | human activities; economic activities; power supply/consumption; war in Syria | Elvidge, C.D., Miller, S.D. (USA); Lee, S.H., Cao, C.Y. (USA), Li, X. (China); |
| urbanization in China; geomorphic and urbanization; balance problem in urbanization; quantitative stages for urbanization | Ma, T., Zhou, C.H. (China); Levin, N., Zhang, Q.L. (China); Zhuo, L. (China) | |
| bioluminescence in the sea; fleet detecting; wildfire | Elvidge, C.D., Miller, S.D. (USA) | |
| VIIRS/DNB | fleet detecting | Elvidge, C.D., Miller, S.D. (USA) |
| global urbanization; urbanization in China | Levin, N., Zhang, Q.L. (USA); Zhuo, L. (China) |
| Application/Topic/Keyword | Collected by the Other Review [17,38] | Discipline Background (WoS Classifications) | |
|---|---|---|---|
| I | human activities, power supply/consumption, war in Syria | Settlement dynamics and impacts on the environment: Urban land dynamics; Impacts of urbanization on soil, net primary productivity, urban surface temperature and surface air temperature | Political science, Environmental science, Geosciences, Multidisciplinary |
| economic activities, long-term urbanization in China, geomorphic and urbanization, quantitative stages for urbanization, gas flares, poverty index, ISA distributions, VANUI, NLDI | Demographic and socioeconomic information: population, urban population, population density, “ambient population”; Socioeconomic parameters: GDP, freight traffic, copper stock, poverty index, per capital income; Energy and electric power consumption | Geology, Demography, Economic statistics, Geography | |
| bioluminescence in the sea, fleet detecting, wildfire | Short-term light monitoring: aerosol properties and forest fire, gas flare, burning area and light flash; Fishing vessel monitoring | Chemistry, Analytical | |
| natural gas consumptions, balance problem in urbanization | Other applications: Anthropogenic gas emission (CO2); Nighttime sky brightness and light pollution; Other topics: human health, water footprint and virtual water, wars and conflicts, scaling law of city size, biolumine phenomena, coral reef stress, bird foraging, earthquake damage, ecosystem services, and climate station classification | Public, Environmental and Occupational Health, Tropical Medicine | |
| II | Global urbanization | The Cryosphere: Mid-Latitude Snow Fields; Sea Ice Edge and Extent | Ecology, Geology |
| fleet detecting | The Hydrosphere: Sea Surface Roughness Properties via Moon Glint; Coastal Waters Turbidity | Water Resources, Transportation | |
| global urbanization, urbanization in China, regional economics, night-fire maps | The Lithosphere: Soil Moisture; Volcanoes—Ash Plumes and Pyroclastic Flows; Wind-Lofted Dust | Electrical and Electronic, Environmental science | |
| The Atmosphere: Cloud Optical Properties; Lightning; Tropical Cyclones | Atmospheric Sciences, Optics | ||
| The Biosphere: City Lights and Power Outages; Ship Lights; Biomass Burning | Environmental Studies | ||
| Atmospheric Light Sources: Aurora; Nightglow | Atmospheric Sciences |
| Topic Search | SCIE | SSCI | SSCI/SCIE |
|---|---|---|---|
| Remote sensing | 53,495 | 2706 | 0.05 |
| NTL remote sensing | 136 | 15 | 0.11 |
© 2017 by the authors. Licensee MDPI, Basel, Switzerland. This article is an open access article distributed under the terms and conditions of the Creative Commons Attribution (CC BY) license (http://creativecommons.org/licenses/by/4.0/).
Share and Cite
Hu, K.; Qi, K.; Guan, Q.; Wu, C.; Yu, J.; Qing, Y.; Zheng, J.; Wu, H.; Li, X. A Scientometric Visualization Analysis for Night-Time Light Remote Sensing Research from 1991 to 2016. Remote Sens. 2017, 9, 802. https://doi.org/10.3390/rs9080802
Hu K, Qi K, Guan Q, Wu C, Yu J, Qing Y, Zheng J, Wu H, Li X. A Scientometric Visualization Analysis for Night-Time Light Remote Sensing Research from 1991 to 2016. Remote Sensing. 2017; 9(8):802. https://doi.org/10.3390/rs9080802
Chicago/Turabian StyleHu, Kai, Kunlun Qi, Qingfeng Guan, Chuanqing Wu, **gmin Yu, Yaxian Qing, Jie Zheng, Huayi Wu, and ** Li. 2017. "A Scientometric Visualization Analysis for Night-Time Light Remote Sensing Research from 1991 to 2016" Remote Sensing 9, no. 8: 802. https://doi.org/10.3390/rs9080802