2.1. Structural and Morphological Characterizations
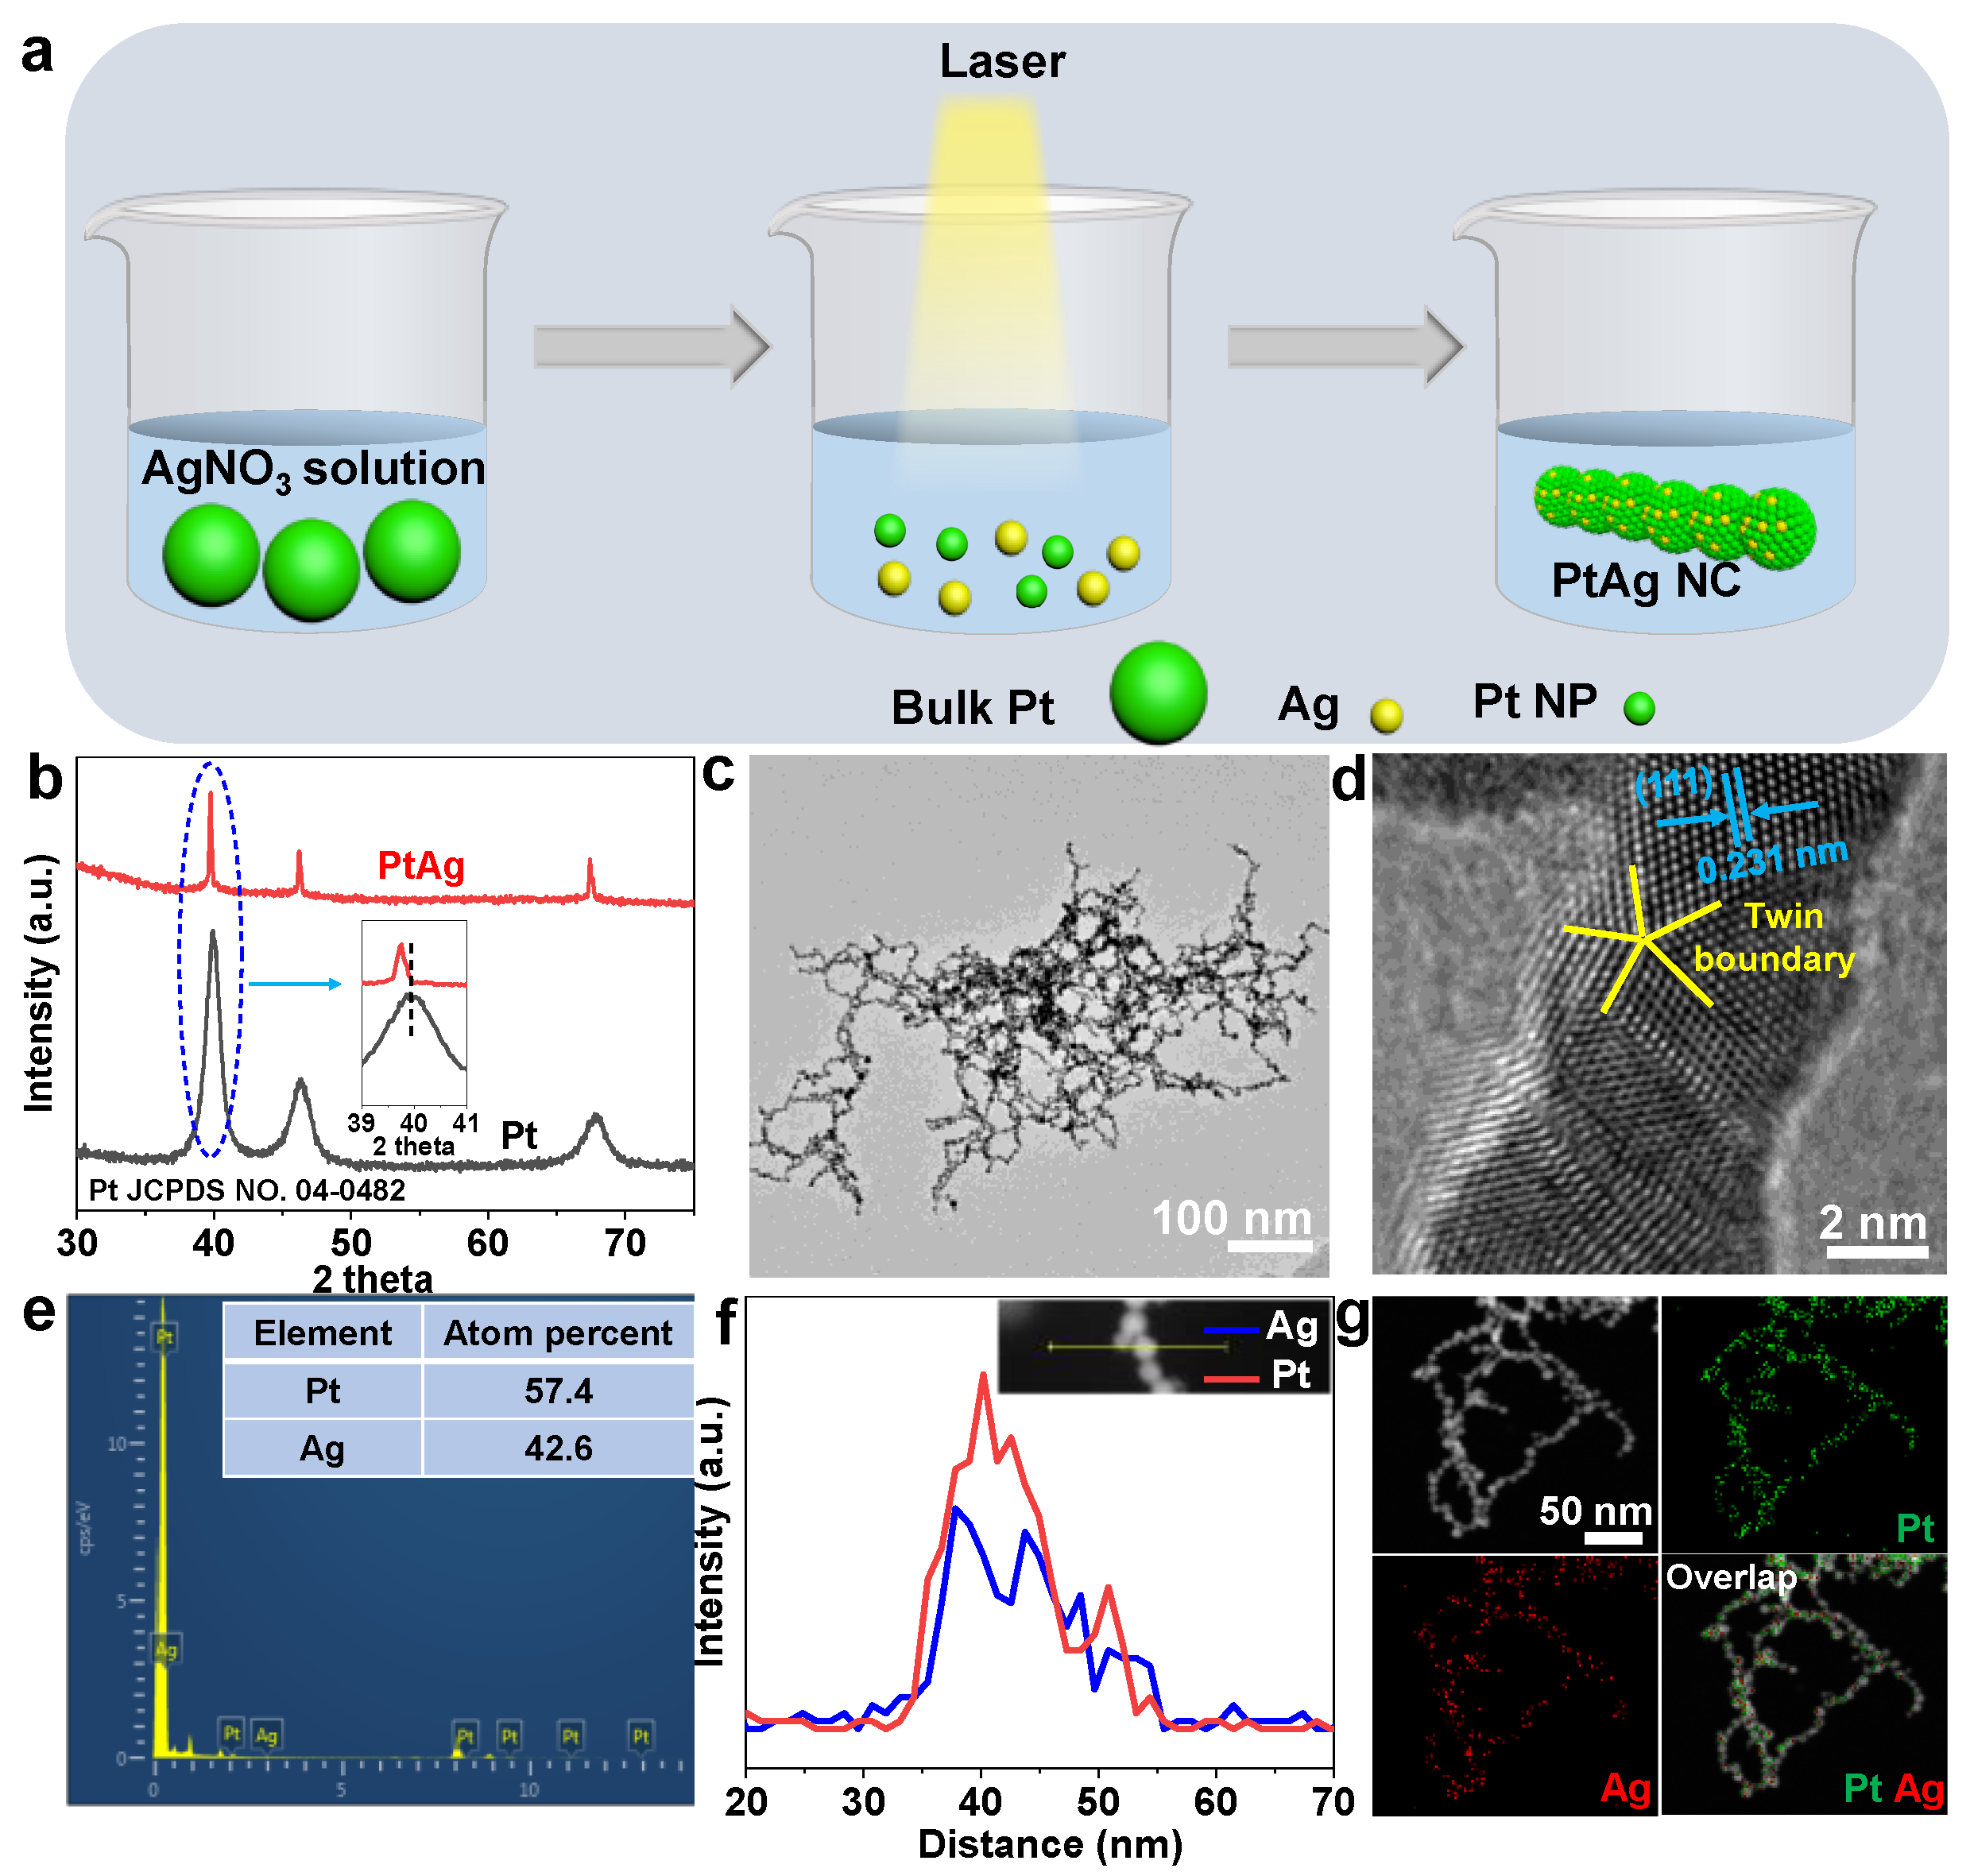
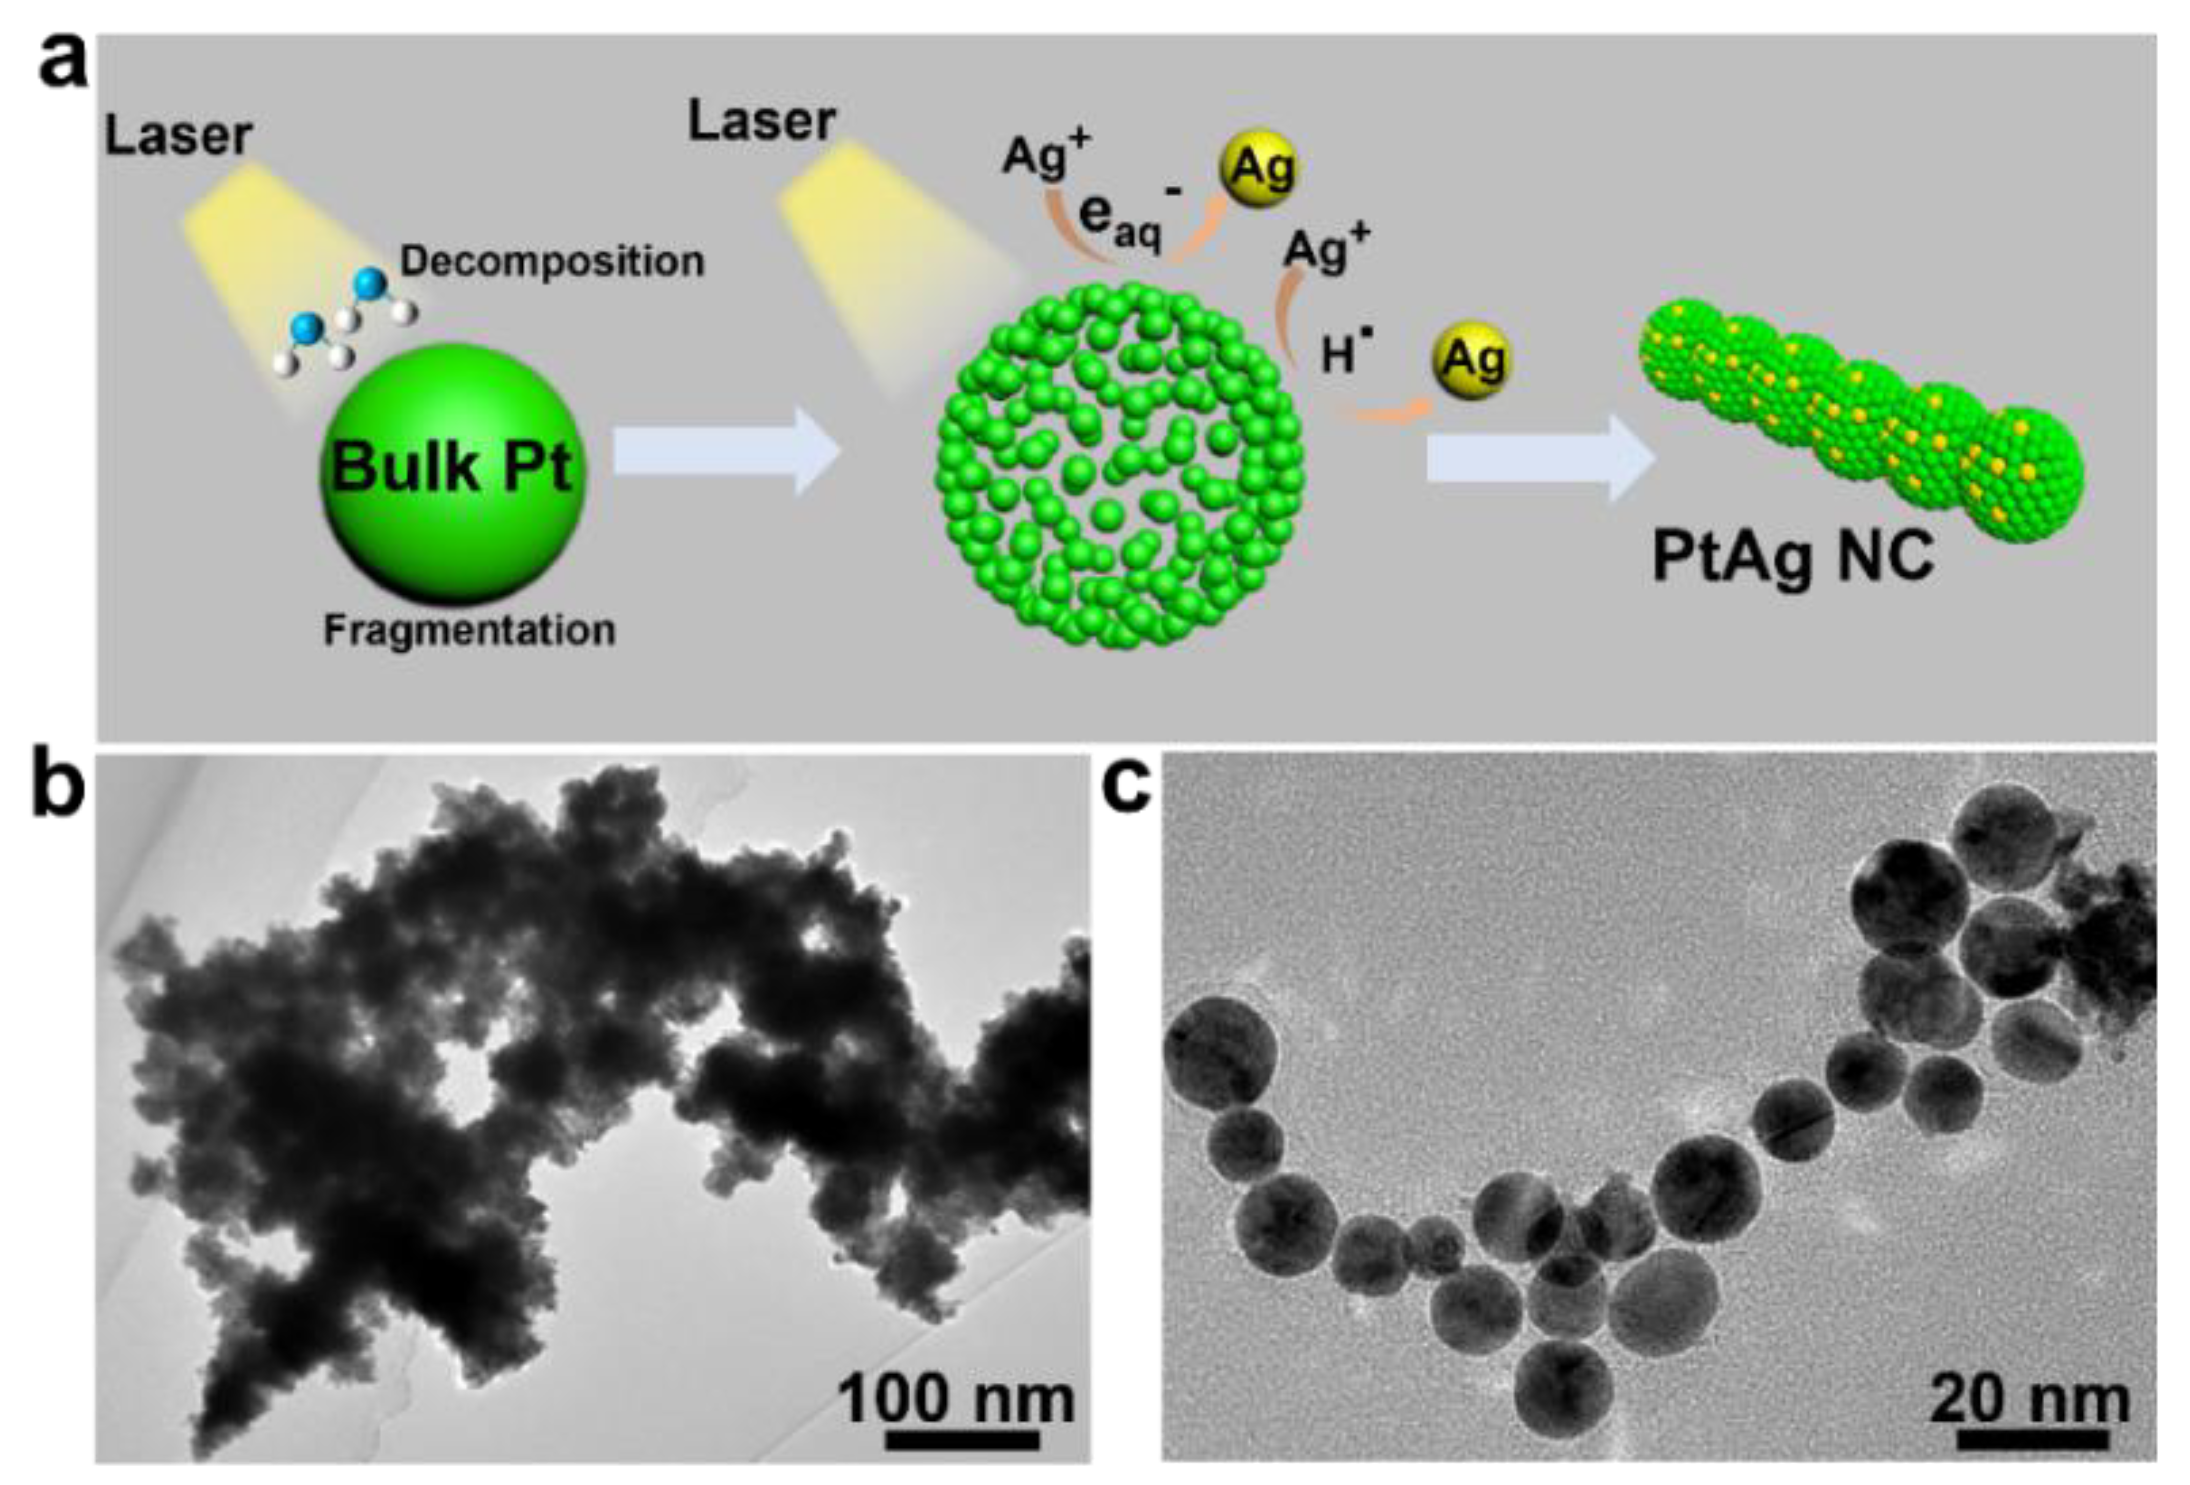
A facile procedure was proposed to prepare the PtAg alloys (the details are shown in the experimental section). As shown in
Figure 1a, the bulk Pt and AgNO
3 were mixed to form a homogenous solution, which was subsequently irradiated by the pulsed laser. To investigate the crystal structure of the formed PtAg alloys, powder X-ray diffraction (XRD) was employed for characterization. The XRD patterns of Pt, as depicted in
Figure 1b, were consistent with the standard diffraction of JCPDS:04-0482. Specifically, the cubic phase of Pt exhibited diffraction peaks at 39.89°, 46.3°, and 67.9°, which corresponded to (111), (200), and (220) crystal planes. Based on Vegard’s law, the diffraction peak shift in the crystalline structure of an alloy either increases or decreases, depending on the concentration ratio of its constituent elements [
33].
Figure 1b indicates that the XRD diffraction peaks of the prepared PtAg alloys negatively shifted to an angle with respect to pure Pt, which revealed the success of alloying. The low-magnification transmission electron microscopy (TEM) image of the PtAg alloys in
Figure 1c showed a chain width of approximately 10 nm. As depicted in
Figure 1d, the lattice fringe of 0.231 nm corresponding to the (111) plane was observed in the high-resolution TEM (HRTEM) image of the PtAg alloys. The HRTEM image in
Figure 1d also revealed the presence of twin boundaries in the PtAg alloys due to the non-equilibrium condition in the liquid environment, which may provide an opportunity for designing other defect-rich alloy materials. The atomic structure exhibited symmetric lattice arrangements on both sides of the coherent twin boundary, which was clearly observed in the HRTEM image. The corresponding EDX energy spectrum, EDX line scans, and EDS map** images suggest that the Pt and Ag atoms had an atomic ratio of 57.4:42.6 and were uniformly distributed throughout the PtAg alloys (
Figure 1e–g). The aforementioned results exhibited the successful formation of PtAg alloys.
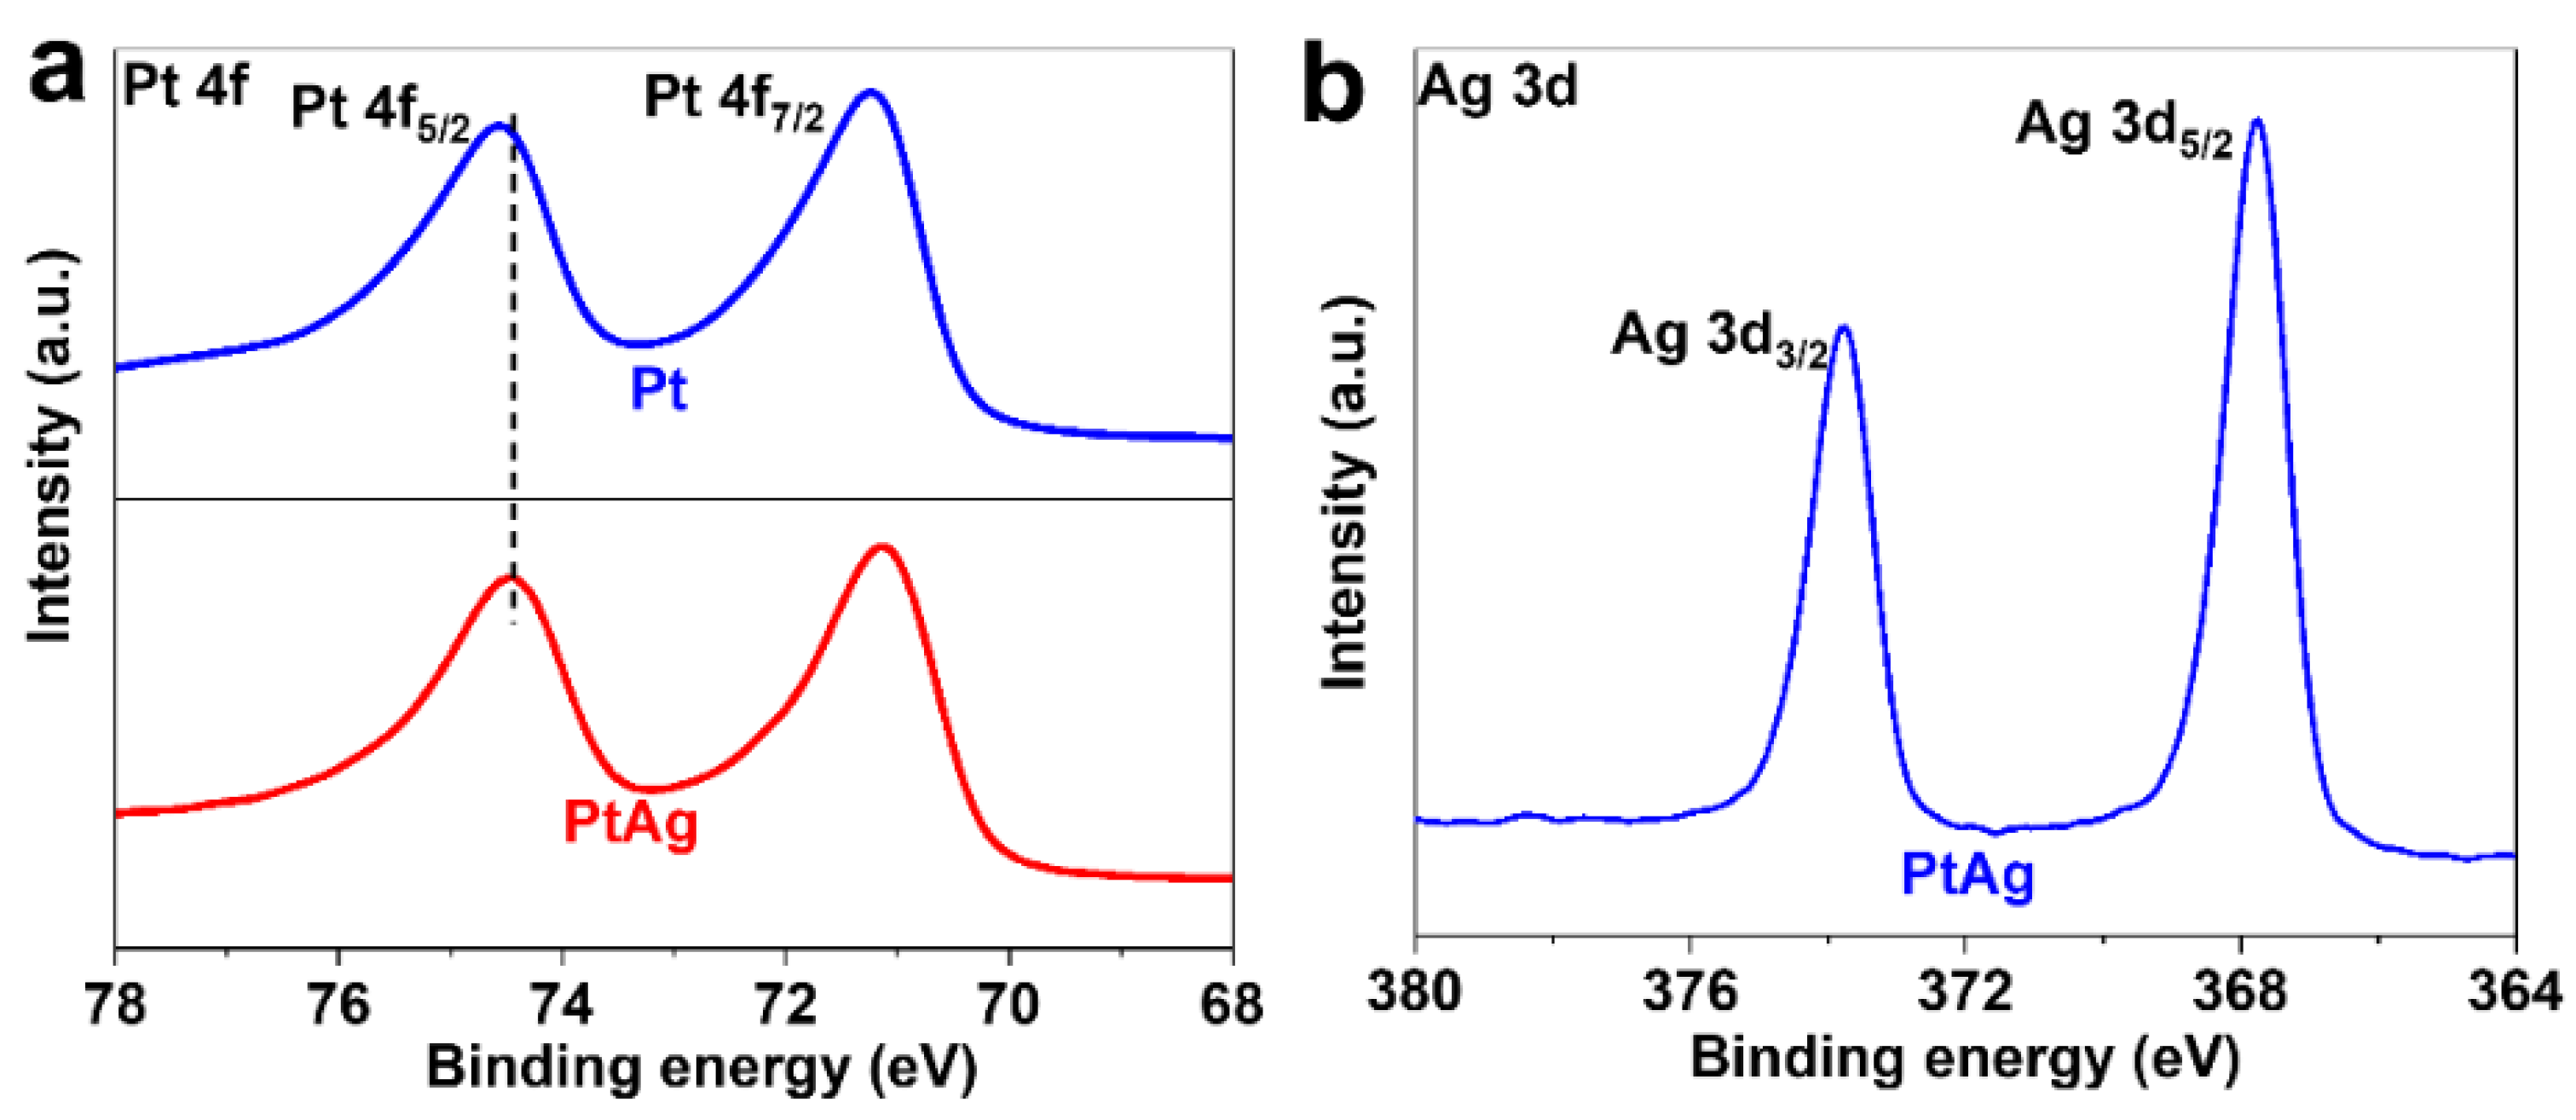
To gain further insights into the oxidation state and surface composition of the synthesized PtAg alloys, an XPS study was conducted on the PtAg samples, and the corresponding spectra are depicted in
Figure 2. The XPS spectra of all samples confirmed the presence of Ag and Pt elements in the PtAg alloys and Pt, respectively (
Figures S1a,b). The C1s spectra of all samples, as depicted in
Figure S1c, exhibited a major peak at 284.8 eV with the same intensity, which confirmed a homogeneous amount of carbon in all the samples [
34]. Through XPS analysis in
Figure 2a, the observed peaks at 71.1 and 74.4 eV corresponded to metallic Pt
0 in the PtAg alloys but showed a negative shift compared to Pt, suggesting a charge transfer between Ag and Pt via electron interactions, which corresponded to their Pauling electronegativity scale [
35]. In
Figure 2b, the peaks at 367.7 and 373.8 eV were ascribed to metallic Ag
0 [
36]. In addition, in
Figure S1d, the auger electron spectrum of Ag for the PtAg alloys further confirmed the existence of metallic Ag in the PtAg alloys [
37]. Based on these results, it can be confirmed that the PtAg alloys consist mostly of metallic Pt and Ag.
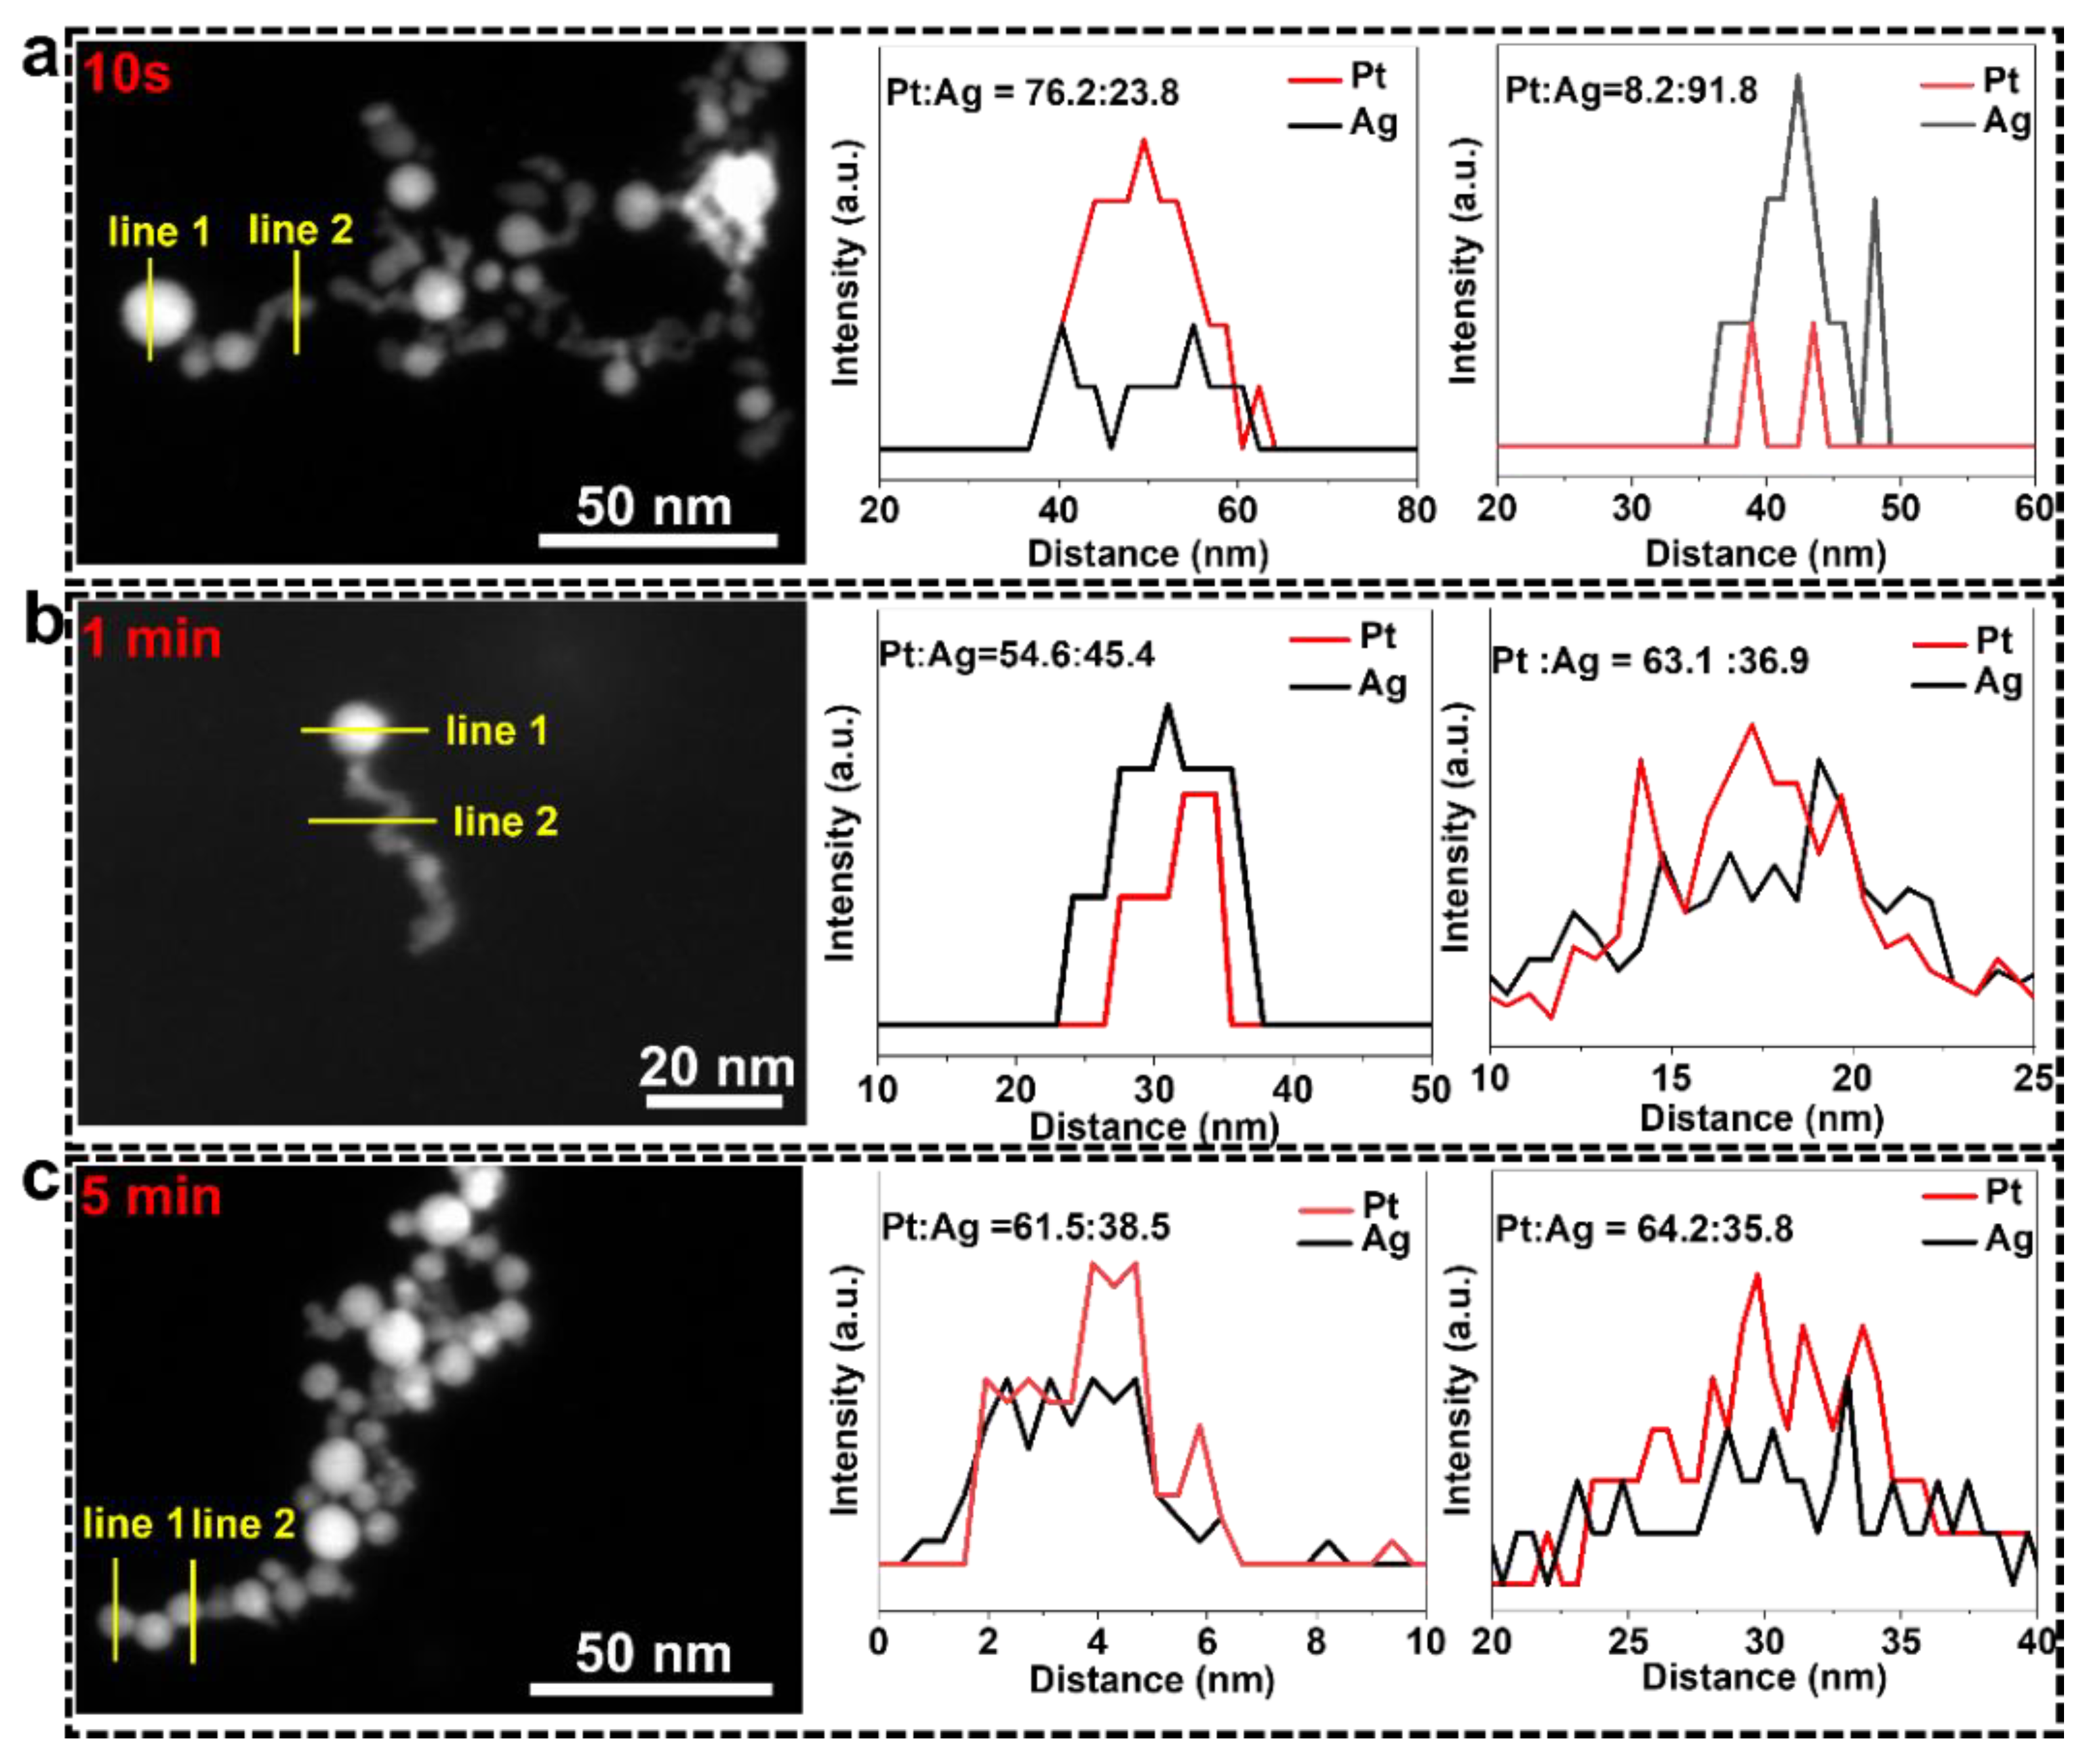
One pressing question that needs attention is the formation process of the PtAg alloys, which was investigated by analyzing the TEM images of the samples at different laser irradiation times (10 s, 1 min, and 5 min).
Figure 3 displayed the representative TEM image and line scan at various locations of the PtAg alloys that were synthesized using the laser irradiation procedure under different irradiation times. After irradiation for 10 s, small-sized PtAg alloys appeared. However, the Pt and Ag elements were not evenly distributed in different positions. It is crucial to note that the morphology of the products underwent a significant change when compared to the unirradiated initial bulk Pt. This suggested that the laser-induced alloying of the bulk Pt and Ag
+ was exceptionally fast, taking less than 10 s. As the irradiation time increased, the morphology of the PtAg alloys remained relatively unchanged as the irradiation time was less than 1 min. However, the distribution of Pt and Ag elements at various locations was nearly identical, indicating that laser irradiation caused the elements to be redistributed. After irradiation for 5 min, the distribution of Pt and Ag elements at various locations was nearly identical and almost the same as that in the sample under irradiation for 1 min (
Figure 3b,c). The aforementioned results indicated that during the process of laser-induced reduction of Ag
+ ions to form the PtAg alloys, the initial stage was accompanied by changes in size and morphology, as well as the reduction of Ag
+ ions. In the subsequent stage, laser irradiation induced the redistribution of elements and reached a steady state.
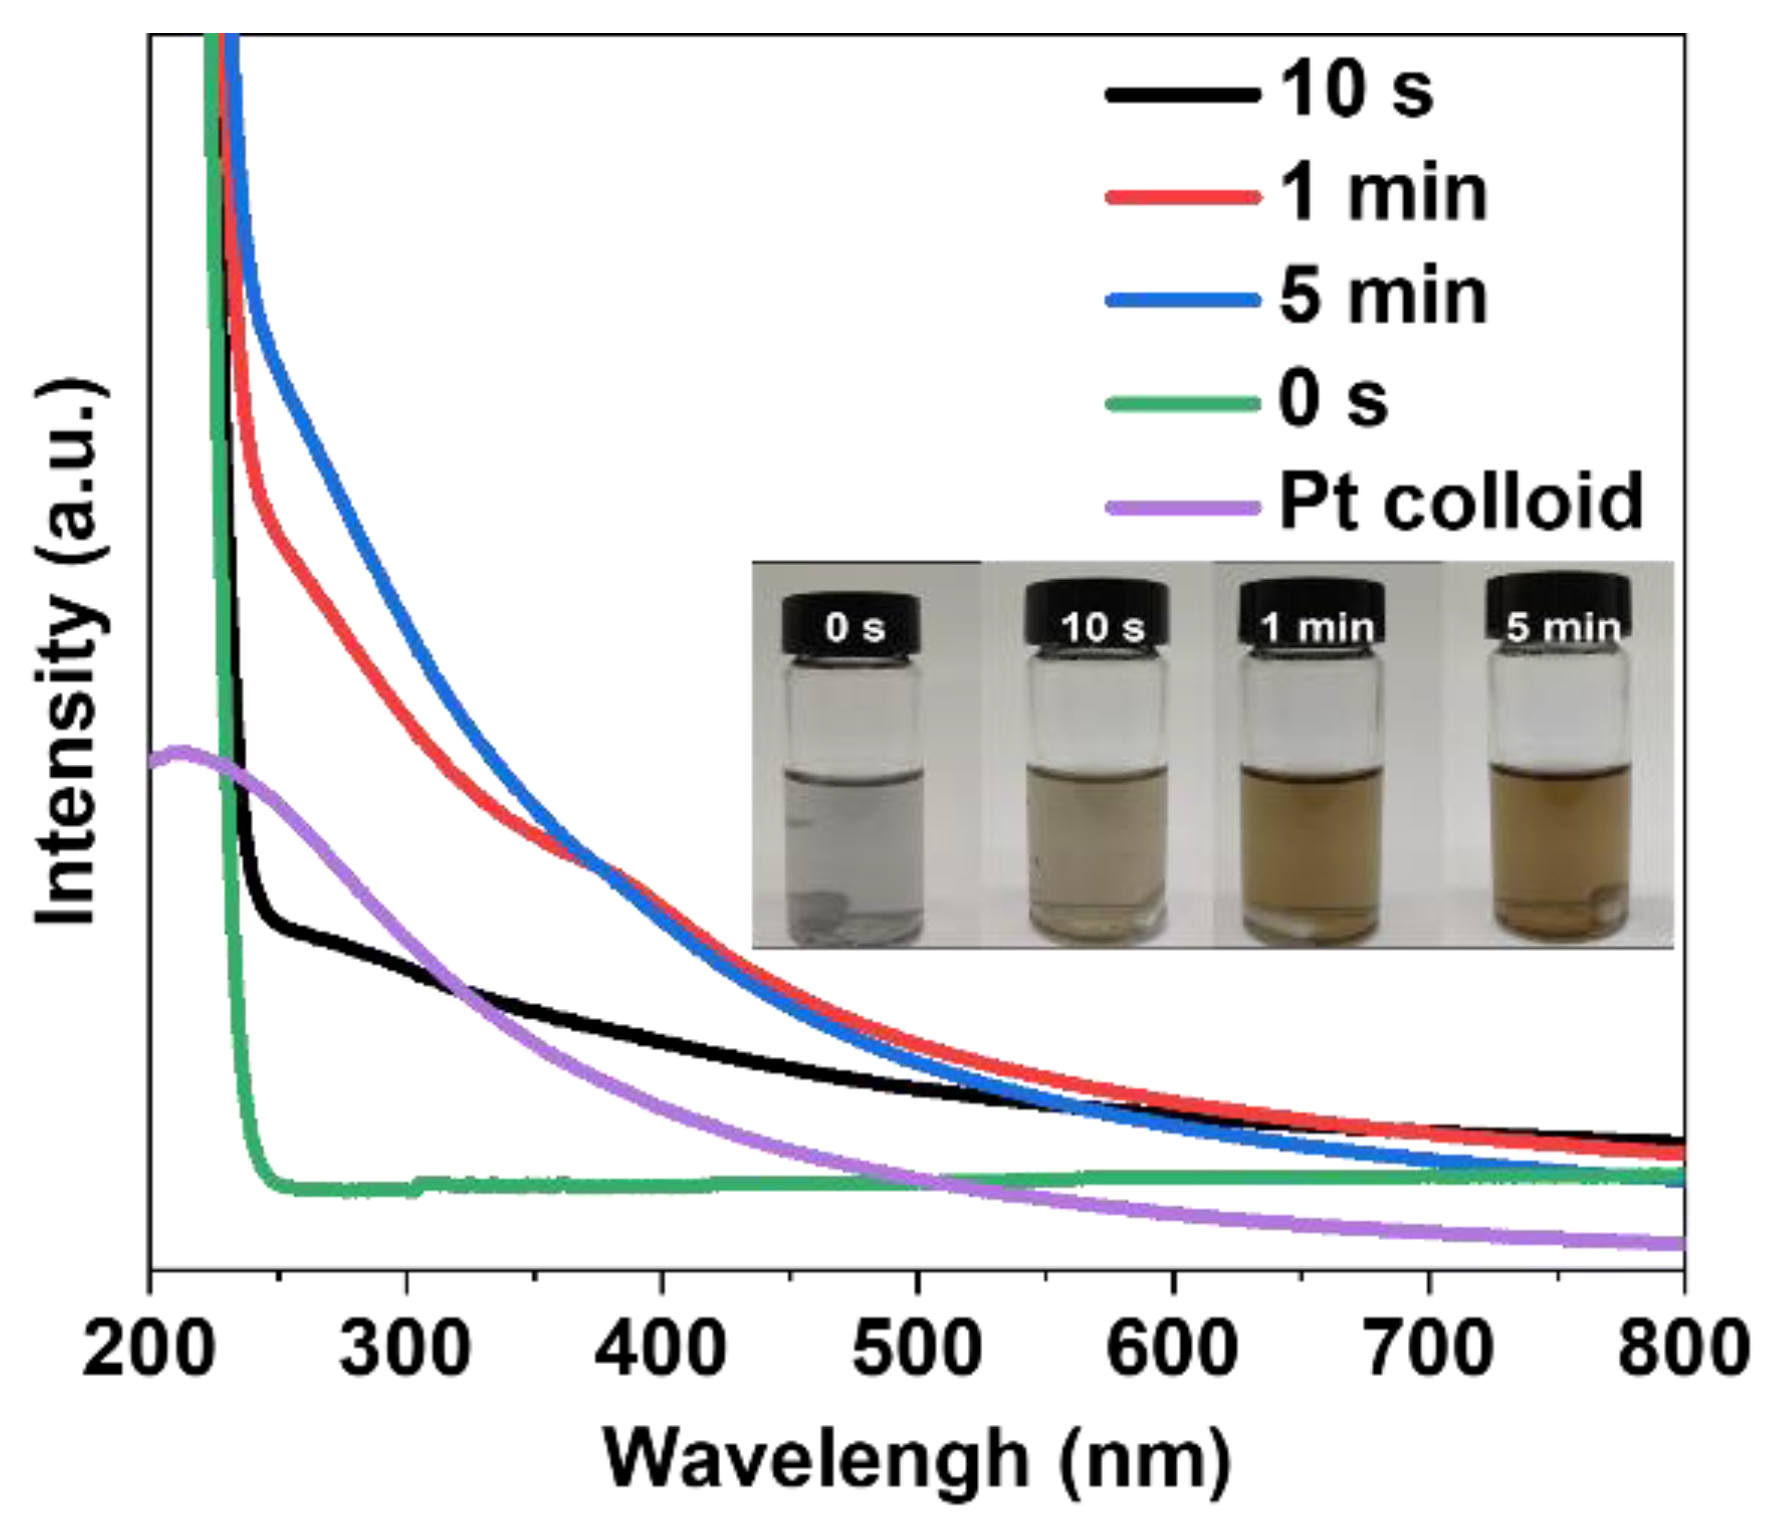
The optical absorption spectra of the mixture of the bulk Pt and AgNO
3 solution before and after laser irradiation at different times were exhibited in
Figure 4. Before the laser irradiation, the adsorption spectrum of the mixed solution almost had no SPR peak because the bulk Pt is the main content. Generally, the plasmon peak profile of noble metals, such as gold and silver, is highly dependent on the size and shape of the metal NPs. This is owing to the plasmon resonance, which is responsible for the unique optical properties of these materials and strongly influenced by the collective oscillation of electrons within the metal particles [
38]. In comparison to the Pt colloids, the mixed solution demonstrated a wider plasmon peak and an increase in absorption density range from 250 to 400 nm after 10 s of irradiation and gradually showed a significant increase in absorption density with increasing the irradiation time. However, it is important to consider the hydrodynamic diameter of colloids in solution, as they tend to aggregate to some extent due to the dominance of surface double-layer structures [
26]. According to
Figure 1c, it was found that the PtAg alloy possessed the nanochains structure, which may account for the observed increase in optical absorption intensity within the 250–400 nm range. As the irradiation time increased, the corresponding optical images showed a gradual darkening of the sample color, which also confirmed the occurrence of the alloying process.
2.2. Formation Mechanism of PtAg Alloys
Finally, the formation mechanism of the PtAg alloys was proposed. As shown in
Figure 5a, firstly, when the bulk Pt absorbed pulsed laser energy in a liquid environment, it underwent a phase transition. At the same time, the temperature of the bulk Pt exceeded the boiling point of the surrounding liquid, thereby leading to the evaporation of the liquid and the formation of a shell around the bulk Pt with high vapor pressure. This asymmetry in vapor pressure may cause the internal molten NPs to break into smaller parts (
Figure 5b,c) [
24,
39,
40]. Additionally, at the same time, the energy density under the laser beam was high enough to induce the decomposition of water molecules, thus yielding solvated electrons (e
−aq) and free radicals (OH
aq and H
aq) [
41,
42,
43]. Hence, the e
−aq, and H
aq radicals acted as potential reducing agents for the reduction of Ag
+ ions with redox potentials of E
0 (H
2O/e
−aq) = −2.8 V vs. SHE and E
0 (H
+/H) = −2.3 V vs. SHE, respectively. Despite a very short lifetime, both species were capable of reducing the Ag
+ ions to zero valences by the following equation:
Thus, the smaller Pt species alloyed with the Ag atoms during the laser irradiation. To further understand the formation mechanism of the PtAg alloys, a series of control experiments were conducted. As shown in
Figure S2, the Ag NPs can also be obtained through laser irradiation of the AgNO
3 solution without the addition of a bulk Pt, which was consistent with the UV-visible spectra shown in
Figure S3. In contrast, when a 300 W Xenon lamp with a wavelength of 520 nm was used to irradiate the AgNO
3 solution, there was no change in the UV-visible spectra (
Figure S4), indicating that the laser played a crucial role in decomposing water to generate reducing species. Furthermore, both the AgNO
3 solution and the mixture of the bulk Pt with the AgNO
3 solution showed a significant drop in pH (
Figure S5), indicating the generation of H
+ ions in the solution. Additionally, to demonstrate the alloying process of the Ag atoms with the Pt atoms, the mixture of the bulk Pt and Ag colloids was irradiated under the same condition. A 15 nm-sized Ag NPs was generated via laser ablation of the Ag plates in deionized water (
Figure S6). Following this, the PtAg alloy NPs were produced by irradiating a mixture of 2 mg bulk Pt and 2 mL of Ag colloid. As shown in
Figure S7, TEM-EDX line scans and EDS map** images indicated that the spherical components consisted of PtAg alloys, suggesting that the laser played a role in the alloying process after the Ag
+ ions were reduced to Ag.
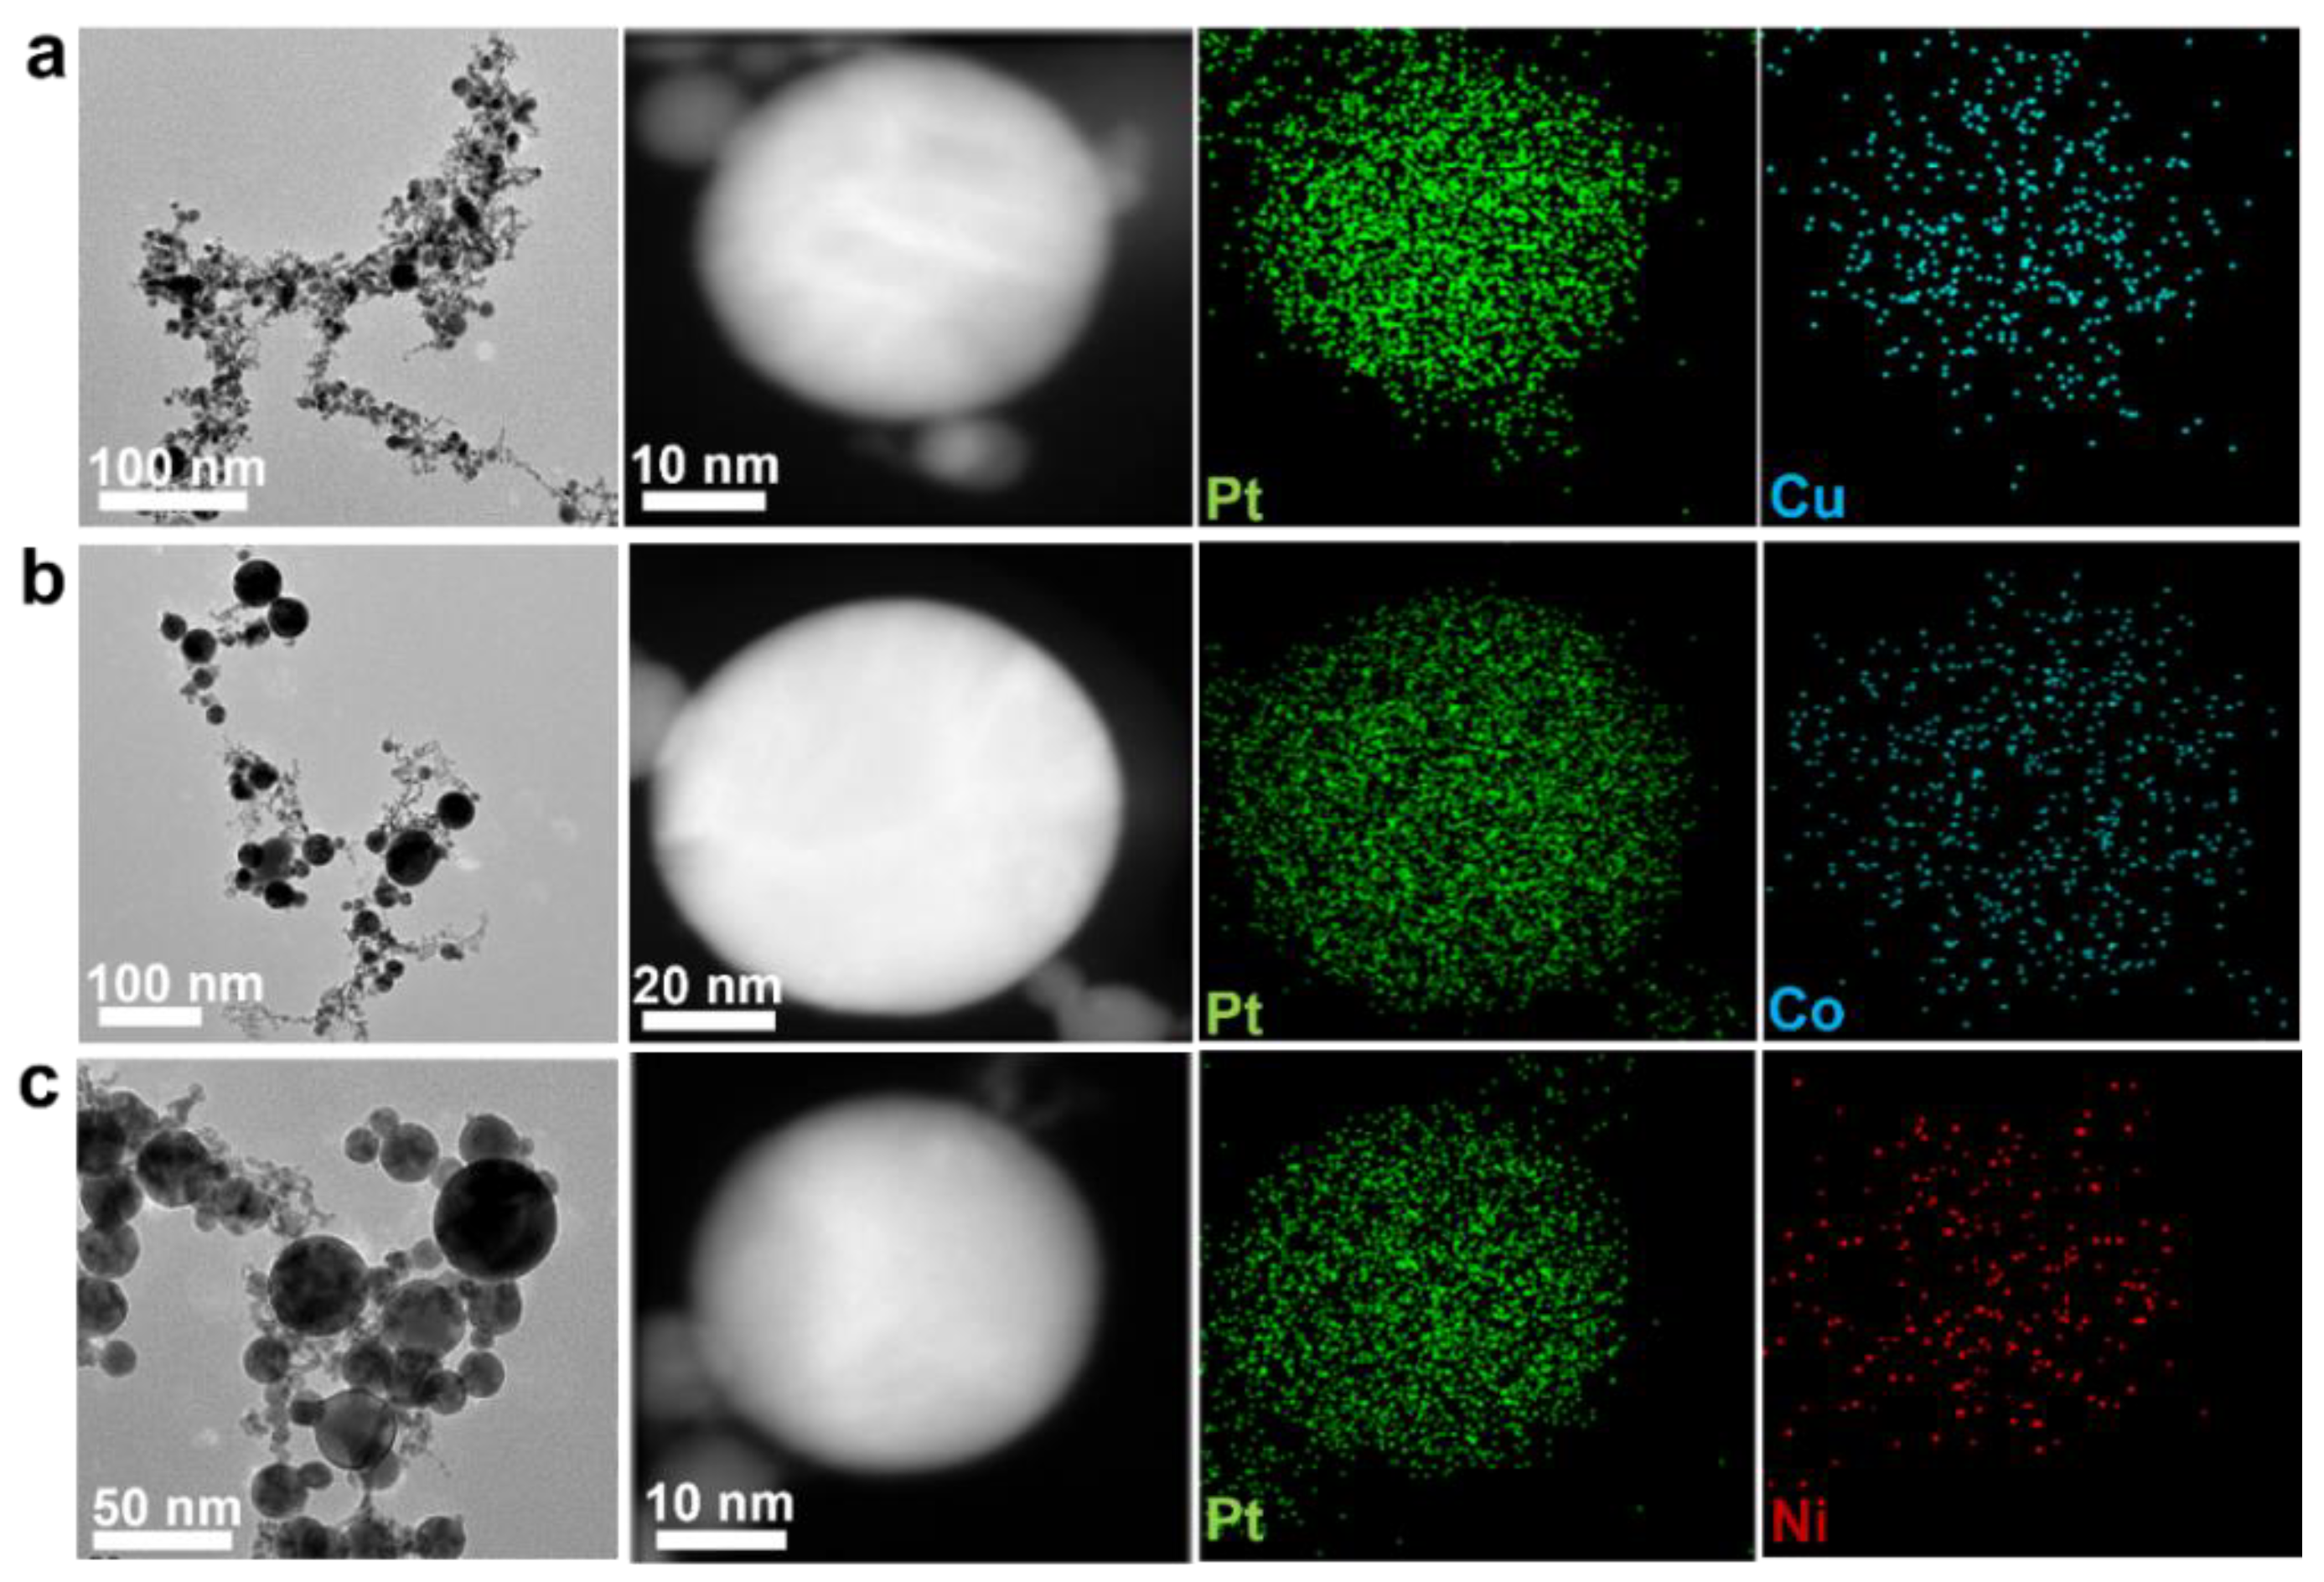
To test the universality of this synthesis method for preparing the Pt-based bimetallic alloys, the PtX (X = Cu, Co, Ni) alloys were successfully fabricated using the same procedure. Details of the morphological and compositional information of these alloys were shown in
Figure 6 and
Figure S8. As shown in
Figure 6a, after the irradiation of a mixed solution containing the bulk Pt and Cu(NO
3)
2, spherical NPs were obtained. The corresponding EDS map** images showed the Pt and Cu elements were evenly distributed throughout the PtCu NPs. In addition, The EDS line scans and EDX spectra produced by the prepared spherical NPs (
Figure S8a,b) indicated the formation of uniform two-component particles, which consisted of Pt and Cu elements with an atomic ratio of 0.94:0.06. The above characterization indicated the successful formation of the PtCu alloy. By changing the Cu(NO
3)
2 to Co(NO
3)
2 or Ni(NO
3)
2, the PtCo or PtNi alloys could also be obtained. Similar to the PtCu alloy, both the PtCo alloys (
Figure 6b and
Figure S8c,d) and PtNi alloys (
Figure 6c and
Figure S8e,f) showed spherical morphology, and two elements were evenly distributed throughout the PtCo or PtNi NPs.
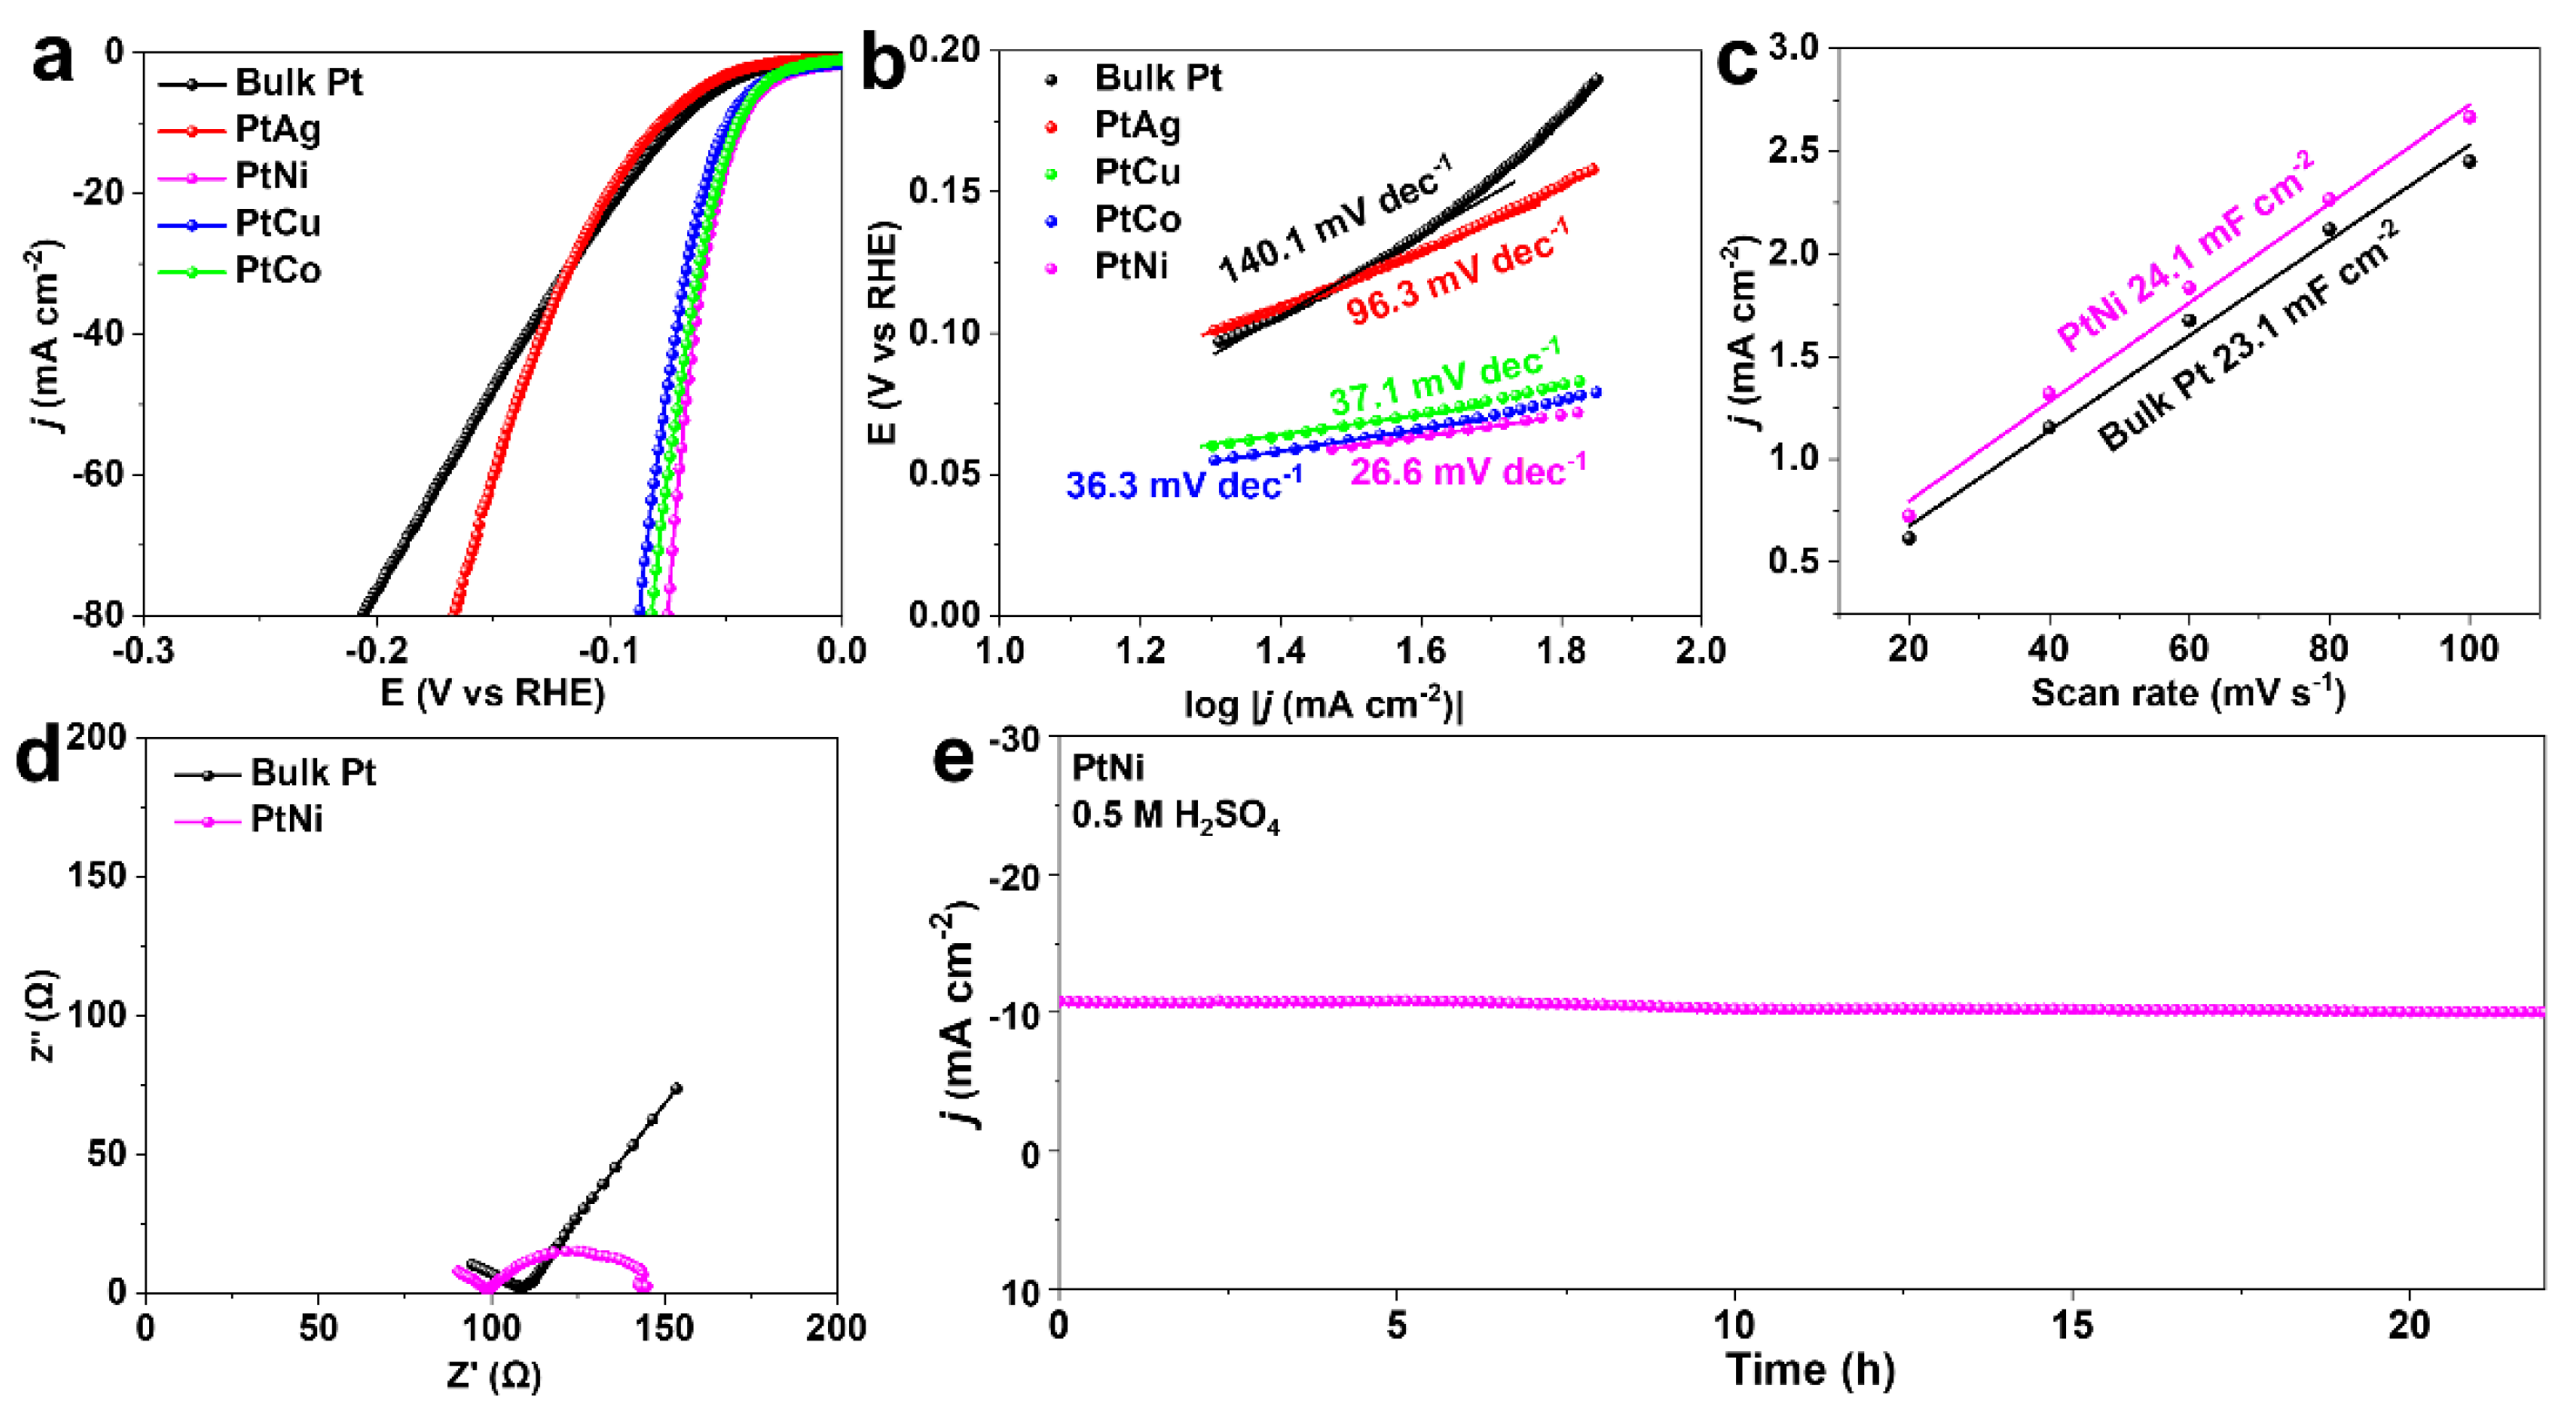
2.3. Electrochemical HER Performance Measurement
The HER performance of the Pt-based bimetallic nanoalloys was measured in an Ar-saturated, 0.5 M H
2SO
4 solution. As shown in
Figure 7a, the bulk Pt exhibited a poor HER performance with an overpotential of 72 mV to obtain the current density of 10 mA cm
−2. After alloying with Cu, Co, and Ni elements, they all exhibited a remarkably enhanced HER performance. Importantly, the PtNi alloys showed a low overpotential of 44 mV to obtain the current density of 10 mA cm
−2. The enhanced catalytic activity was also evidenced by the Tafel slope derived from the LSV curve, which is an important indicator for obtaining the reaction kinetics. In
Figure 7b, the PtNi alloys displayed a low Tafel slope of 26.6 mV dec
−1, which was much lower than that of the bulk Pt (140.1 mV dec
−1), PtCo alloys (36.3 mV dec
−1), PtCu alloys (37.1 mV dec
−1), and PtAg alloys (96.3 mV dec
−1), indicating that the fast reaction was Volmer-Tafel mechanism. The lower Tafel slope means that the current density increases more rapidly as the catalyst potential decreases. In addition, the electrochemical double-layer capacitance (C
dl) was also used to investigate the electrochemically active surface area (ECSA) of the catalysts, since ECSA is proportional to C
dl. As shown in
Figure 7b and
Figure S9a,b, the C
dl of the PtNi alloy was 24.1 mF cm
−2, which was larger than that of the bulk Pt (23.1 mF cm
−2), indicating that it possessed more active sites for the catalytic reaction. Furthermore, electrochemical impedance spectroscopy (EIS) measurement was shown in
Figure 7c, the PtNi alloys exhibited a smaller charge transfer resistance, suggesting the superior electrode kinetics of the PtNi alloys. Finally, long-time durability tests were employed to estimate the stability of the catalyst. As shown in
Figure 7d, the current density of the PtNi alloy barely decrease after 20 h, indicating its good stability.


