2.1. Microscopic Morphology and Structural Description
The copolymerization mechanism of 3D g-C
3N
4 and the constitution of the g-C
3N
4/rGO heterojunctions are elucidated in
Figure S1. The self-assembly structures of melamine and cyanuric acid facilitated the formation of a 3D structure, which was due to the hydrogen bond interaction of MCS during stirring. On the other hand, the thermal instability of cyanuric acid led to the production of a large amount of gas during the calcination process, which is another significant condition for the 3D structure. Additionally, GO combined with g-C
3N
4 to form heterojunctions during the process of annealing and GO was reduced to rGO in the existence of nitrogen, resulting in g-C
3N
4/rGO heterojunctions. In the end, the 3D g-C
3N
4/rGO composite catalysts with hollow porous structures and g-C
3N
4/rGO heterojunctions were synthesized resoundingly.
Field emission scanning electron microscopy (FESEM, S-4800, Hitachi, Tokyo, Japan) and transmission electron microscopy (TEM, JEM-2010, JEOL Co., Ltd., Bei**g, China) were conducted to analyze the microscopic morphology of the catalysts, and the results are shown in
Figure 1. BCN presented a compact and bulky appearance, with anomalous aggregation, as shown in
Figure 1a. As seen from
Figure 1b, the shape of PCN appeared to consist of a 3D porous network structure, which differed from that of BCN. The 3D structure was formed by the crosslinking of 2D nanosheet, which occurred because supramolecular melamine–cyanuric acid was present during the calcination process. Similar to PCN, the GPCN catalysts emerged a hollow polyporous structure that tended to helicoid as depicted in
Figure 1c–e, indicating that the loading of rGO flakes had no influence on the morphology of PCN, which was in favor of the absorption. The TEM image of PCN (
Figure 1f) displayed stacked ultrathin g-C
3N
4 nanosheets, which primarily resulted in the generation of the 3D structure. Meanwhile, the ultrastructure of GPCN-2 showed the stacking of rGO nanosheets and g-C
3N
4, which enhanced the specific surface area of catalysts. However, the rGO nanosheets could not be clearly detected in the TEM diagram since the sample was sprayed with gold during the characterization. In addition, the distribution of the elements in the GPCN-2 catalyst was evaluated by energy dispersive spectroscopy (EDS, S-4800, Hitachi, Tokyo, Japan), as shown in
Figure 1i, which corresponded to the analysis of elements map** (
Figure 1h), manifesting the uniform distribution of the C, N and O element. The consequence of EDS and elements map** suggested the homogeneity in the compound catalysts.
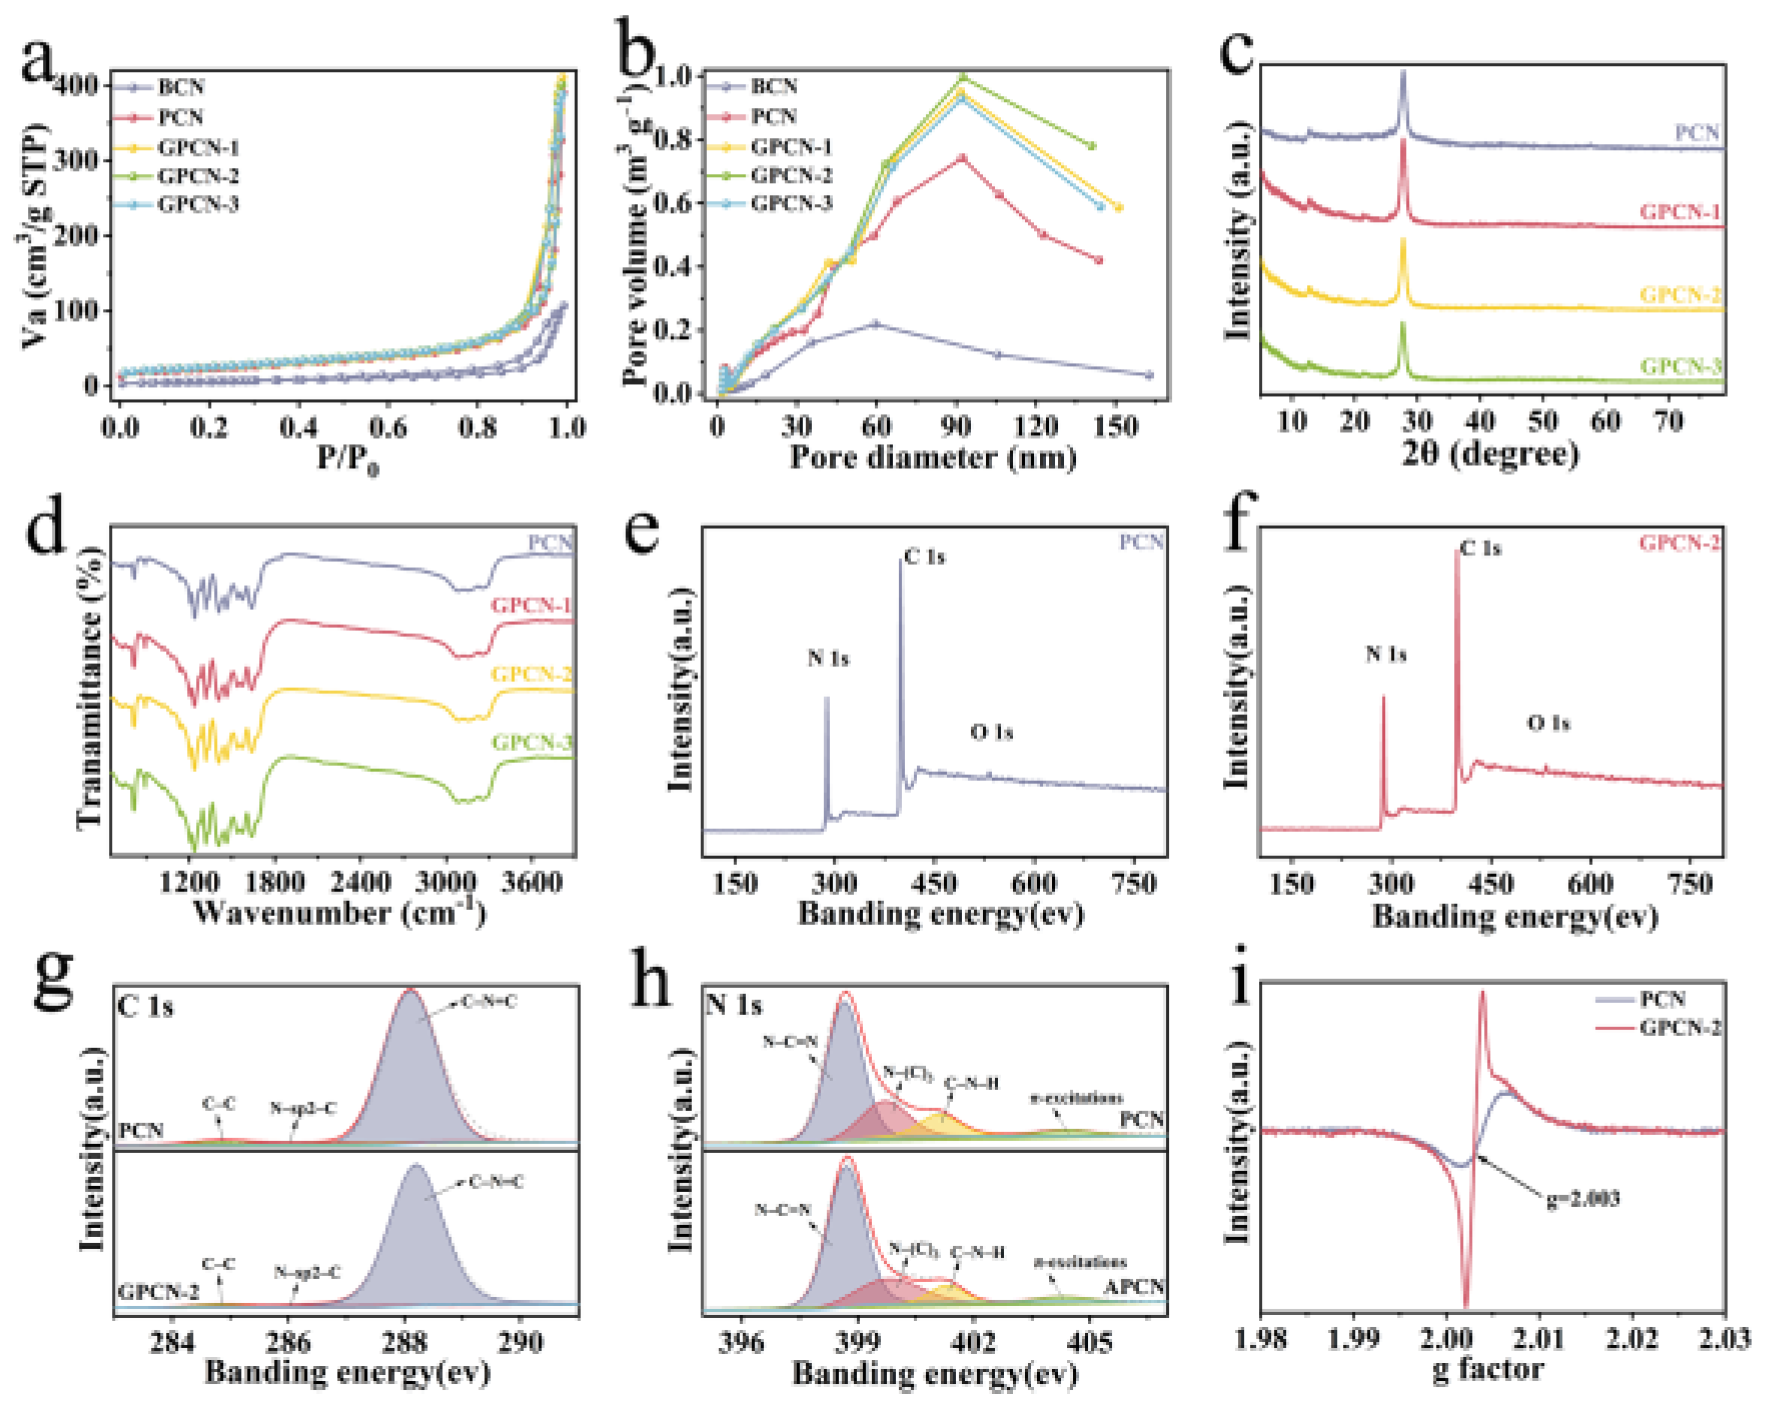
The surface properties and pore diameter distribution of the catalysts were measured by N
2 adsorption–desorption isotherm from
Figure 2a. Evidently, the synthesized samples exhibited isotherms of type Ⅲ and a hysteresis loop corresponding to H
3 type, demonstrating that there were mesopores in the catalysts [
41,
42]. The special surface areas (SSA) and total pore volumes are listed in
Table S2. PCN presented a much higher SSA of 80.604 m
2 g
−1 than BCN (19.738 m
2 g
−1), which resulted from the porous network structure, leading to outstanding adsorption capacity and catalytic activity [
43]. What is interesting is that the SSA of GPCN catalysts was slightly higher than PCN, and that of GPCN-2 reached 90.909 m
2 g
−1, which indicated that the presence of rGO effectively increased the surface area of PCN and promoted the redox reaction [
44]. Additionally, the total pore volumes of the samples showed a parallel trend, elucidating that the g-C
3N
4/rGO heterojunctions were beneficial to the adsorption of the catalysts. Moreover, the pore diameter distribution of catalysts was in agreement with SSA in
Figure 2b. Hence, the integration of g-C
3N
4 and rGO was conducive to enhancing the capacity of adsorption and photocatalysis.
The structural features of the materials were measured by X-ray diffraction (XRD, PANalytical, EA Almelo, The Netherlands), as shown in
Figure 2c. Two distinct diffraction peaks at 12.7° and 27.6° were found in the spectrum of PCN, which were attributed to the (100) and (002) crystal faces, caused by the accumulation of tri-s-triazine units and superposition of graphite layers, respectively [
45]. Based on observation, the GPCN catalysts had XRD patterns similar to that of PCN, and showed no shift of peaks, confirming that rGO nanosheets caused no alteration in the crystalline structure of g-C
3N
4. The amount of graphene added was too small to allow for the observation of the characteristic diffraction peak of rGO [
46]. For further exploration of the internal chemical bonds of the materials, Fourier transform infrared (FTIR, NEXUS 470, Nicolet, WI, USA) spectroscopy was detected just as
Figure 2d illustrates. The spectra of the samples presented the same stretching vibrations, manifesting no remarkable variation in the structure of PCN, which mutually corroborates the results in XRD. Clearly, the peaks at 810 cm
−1 and 1200–1680 cm
−1 were related to the stretching vibration mode of triazine rings and C–N/C=N bonds [
47,
48]. Additionally, the existence of O-H bonds resulted in the apparent peak at 3000–3400 cm
−1 [
47]. As expected, the establishment of g-C
3N
4/rGO heterojunctions did not change the original structure of the PCN, which is in good agreement with electron microscopic results.
In the meantime, the elements in the catalysts were qualitatively and quantitatively assessed via X-ray photoelectron spectroscopy (XPS, Axis Ultra, Kratos Analytical, Manchester, UK), the results of which are shown in
Figure 2e–h.
Figure 2e,f displays the survey XPS spectra of PCN and GPCN-2, correspondingly. The spectra manifested high intension of C and N elements, whereas the intensity of O element was low. This was attributed to the water adsorbed on the surface of the material and oxygen present in the environment [
49]. As seen from the elemental composition in
Table S3, the percentage of C in GPCN-2 increased to 41.98% compared to PCN (40.96%), and the C/N ratio aggrandized from 0.71 to 0.73, demonstrating the successful introduction of rGO nanosheets. The spectra of C 1s were divided into three typical peaks in PCN and GPCN-2 (
Figure 2g). The carbon in the environment and C–C in rGO were assigned to the peak at 284.8 eV [
50]. The peaks at 286.3 and 288.1 eV were assigned to sp2 hybrid carbon in the pyrimidine rings and C–N=C bonds [
51]. A significant enhancement in the characteristic peak for rGO was not observed in GPCN-2 potentially because a very small amount of rGO was added. The N 1s spectra of PCN and GPCN-2 are displayed in
Figure 2h, which were fitted with three characteristic peaks at 398–402 eV. The peak at 398.7 eV was ascribed to the sp2 of N hybridization in N–C=N bonds, the peak at 399.8 eV was due to N–(C)
3 and the peak at 401.3 eV was identified as sp hybridization of NH in the terminal amino groups. In addition, the π-bonds formed by the interaction of the π orbital in a nitrogen atom with the σ orbital of a neighboring atom led to a low-intensity peak at 404.3 eV [
52]. The circumstance of unpaired electrons in the catalysts was evaluated by an electron paramagnetic resonance (EPR, MEX-nano, Bruker, Karlsruhe, Germany) test, and the outcomes are displayed in
Figure 2i. PCN and GPCN-2 presented unambiguous Lorentzian lines with a g value of 2.003, which proved that the prepared catalysts contained single electrons. Noticeably, the EPR intensity of GPCN-2 was higher than that of PCN, which indicated more delocalized electrons and better photocatalytic activity [
53].
2.2. Photology and Electrochemistry Peculiarity
The ability of the catalysts to absorb light at different wavelengths was estimated by UV-Vis diffuse reflection spectroscopy (DRS, U-3900, Hitachi, Tokyo, Japan). As depicted in
Figure 3a, PCN and GPCN catalysts exhibited the same absorption spectrum with an absorption edge at approximately 450 nm. The similar absorption curves indicated that the addition of rGO had no effect on the photoabsorption capacity of the catalysts. The absorption capacity of rGO was the highest among all samples since graphene is black [
54]. Furthermore, the band gap of the material was calculated based on Kubelka–Munk theory (Equation (1)), in which A, hν and α are a constant, photon energy and absorption coefficient, respectively [
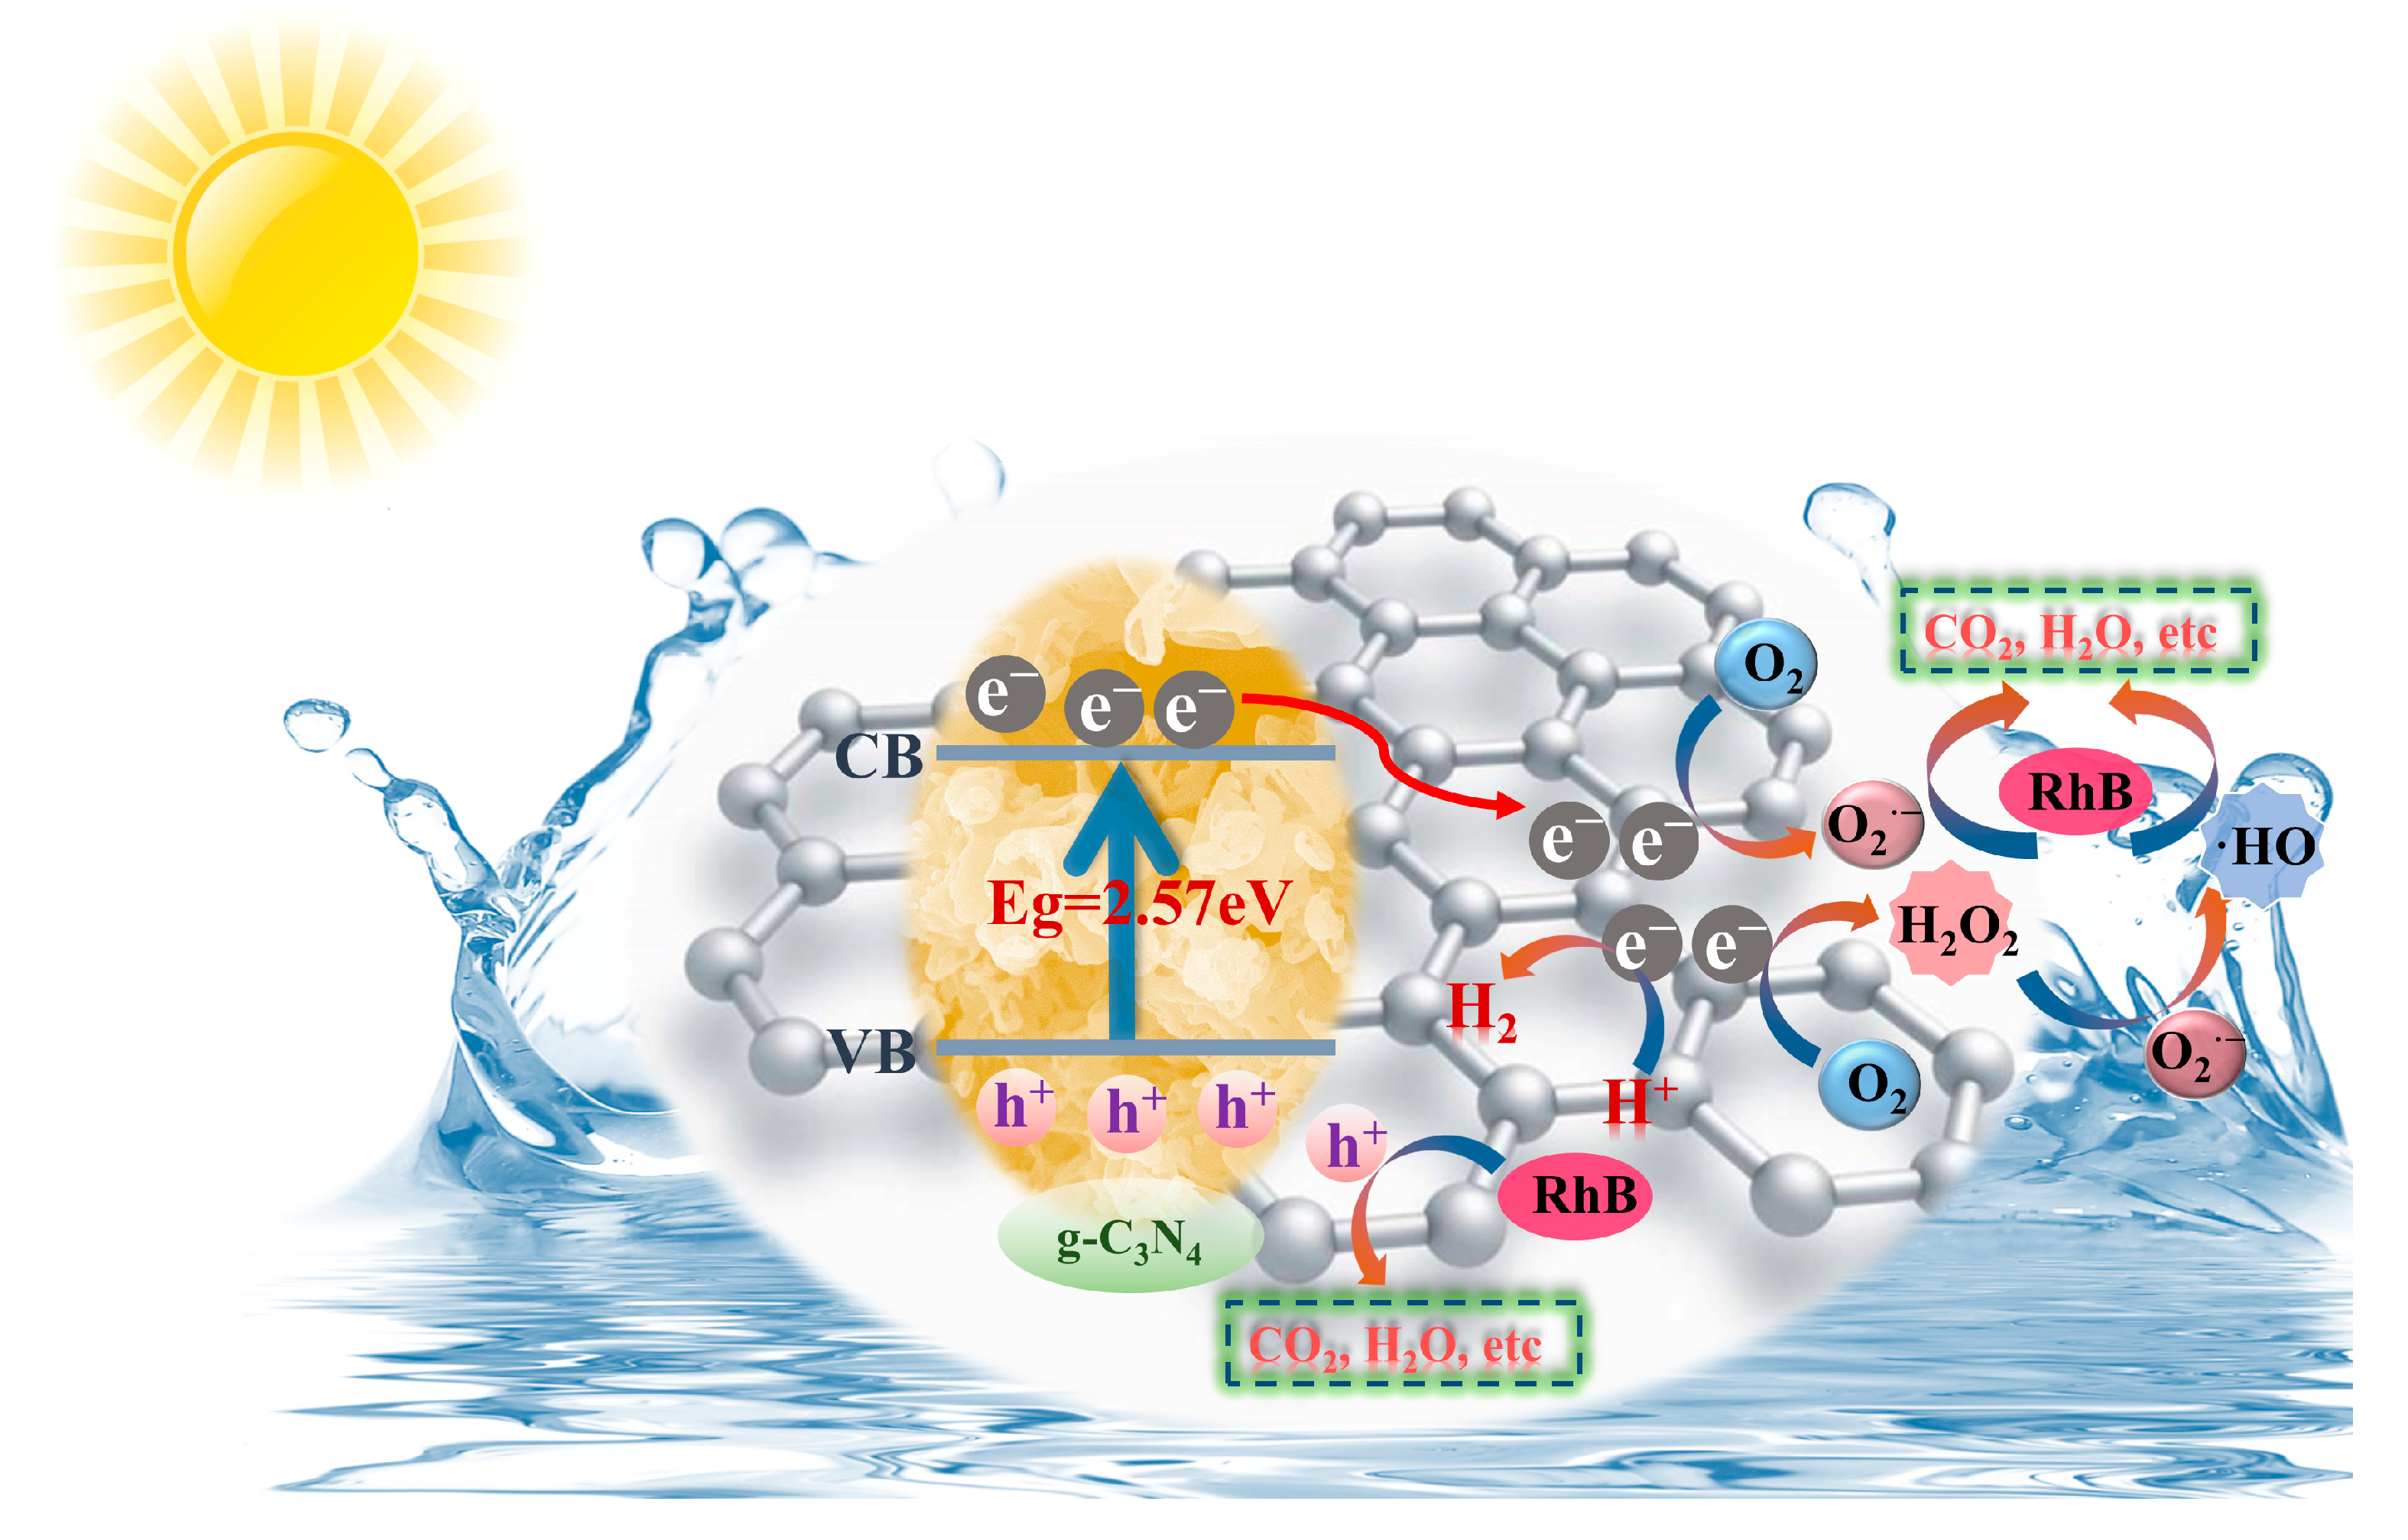
55]. The Eg values of PCN and rGO are displayed in
Figure 3b,c with the values of 2.57 eV and 1.44 eV, respectively. In addition, the Eg value of GPCN-2 is 2.53 eV, which was displayed in
Figure S2. As is known to all, photocatalysis performance is closely related to the transplantation of photon-generated charges and the recombination of electron-hole pairs [
56]. Electrochemical impedance spectroscopy (EIS) was measured to determine the charge separation efficiency of the samples, which is related to the performance of photocatalysis. As exhibited in
Figure 3d, the EIS profiles of the catalysts are typical of the Nyquist plots, in which arcs form by the interaction of the constant phase element (CPE) and charge transfer resistance (Rct) [
57]. The results show that the radius of GPCN-2 in the spectrogram is the smallest, which indicated that GPCN-2 showed the highest charge separation, resulting in superior photocatalytic capability [
46]. Moreover, the photocurrent results of PCN and GPCN-2 are described in
Figure S3, and are consistent with EIS results. The maximum intensity of GPCN-2 (16.8 μA) was 3.05-fold that of PCN (5.5 μA).
Additionally, we conducted photoluminescence (PL, Fluoromax-4, HORIBA Jobin Yvon, Kyoto, Japan) and time-resolution photoluminescence (TRPL, FLSP920, EI, Edinburgh, UK) spectra to analyze the reorganization of photogenerated charge intermediaries. Under normal conditions, a low PL intensity represents low charge recombination [
58]. It can be observed from
Figure 3e that PCN appeared to have the highest intensity, whereas GPCN-2 presented the lowest intensity among all catalysts, which proved that the g-C
3N
4/rGO heterojunction contributed to a reduction in the recombination of electron and hole, improving photocatalytic activity [
59]. The TRPL spectrogram of PCN and GPCN-2 were fitted in
Figure 3f. The decay time (τ
x) and relative amplitude (A
x) are listed in
Table S4, and the mean fluorescence lifetime (τ) was acquired through Equation (2) [
60]. GPCN-2 had a mean fluorescence lifetime with a value of 3.45 ns, which is higher than that of PCN (2.56 ns). The higher mean lifetime elucidated that the excitation lifetime of photogenerated electric charge carriers increased, which was conducive to the combination of dissociative charges and active particles [
61].
2.3. Photocatalytic Performance Evaluation
The hydrogen evolution experiments were conducted to evaluate the photocatalytic activity of the prepared samples, where triethanolamine acted as the sacrificial agent.
Figure 4a exhibits the amount of hydrogen production under different illumination times with different samples. It can be observed that BCN presented the lowest hydrogen evolution of 0.35 mmol g
−1 due to its tight and massive structure. By comparison, the quantity of hydrogen production at 3 h of PCN was much higher, reaching 3.62 mmol g
−1 and was 10.34 times that of BCN. The results confirmed the consistent network interconnection structure, which facilitated the adsorption of water. More surprisingly, hydrogen production of GPCN catalysts all significantly improved compared with PCN, among which GPCN-2 achieved a hydrogen production amount of 13.11 mmol g
−1, 3.62 times that of PCN. As described, the affiliation of rGO nanosheets further increased the adsorption capacity of the catalysts and promoted the separation of photogenerated charges, which was to the benefit of improving the catalytic performance. The production rates of the different catalysts are displayed in
Figure 4b. GPCN-2 (4.37 mmol g
−1 h
−1) exhibited the highest rate of H
2 release, which was 36.42 and 3.61 times that of BCN (0.12 mmol g
−1 h
−1) and PCN (1.21 mmol g
−1 h
−1). The consequence mutually corroborated the results in the amount of hydrogen production. However, the hydrogen production of GPCN-3 (10.87 mmol g
−1) decreased with the increase in rGO, which may be due to the reason that the excess rGO hindered the capture and absorption of light by g-C
3N
4 [
3].
Furthermore, the apparent quantum efficiency (AQE) of the catalysts was calculated via Equation (3), which is one of the important indexes to measure the activity of a photocatalytic reaction [
62]. As depicted in
Figure 4c, the AQE of GPCN-2 at 420 nm, 450 nm and 500 nm was 3.28%, 1.61% and 0.39%, respectively, proving that GPCN-2 could achieve photoelectric conversion more efficiently, which showed the more outstanding photocatalytic performance. The quantity of released hydrogen remained at 13.15 mmol g
−1 after five cycles as shown in
Figure 4d, which indicated that GPCN-2 catalyst possessed favorable stability. Its splendid stability enables it to be reused, which greatly improves the utilization rate of the catalysts for practical applications.
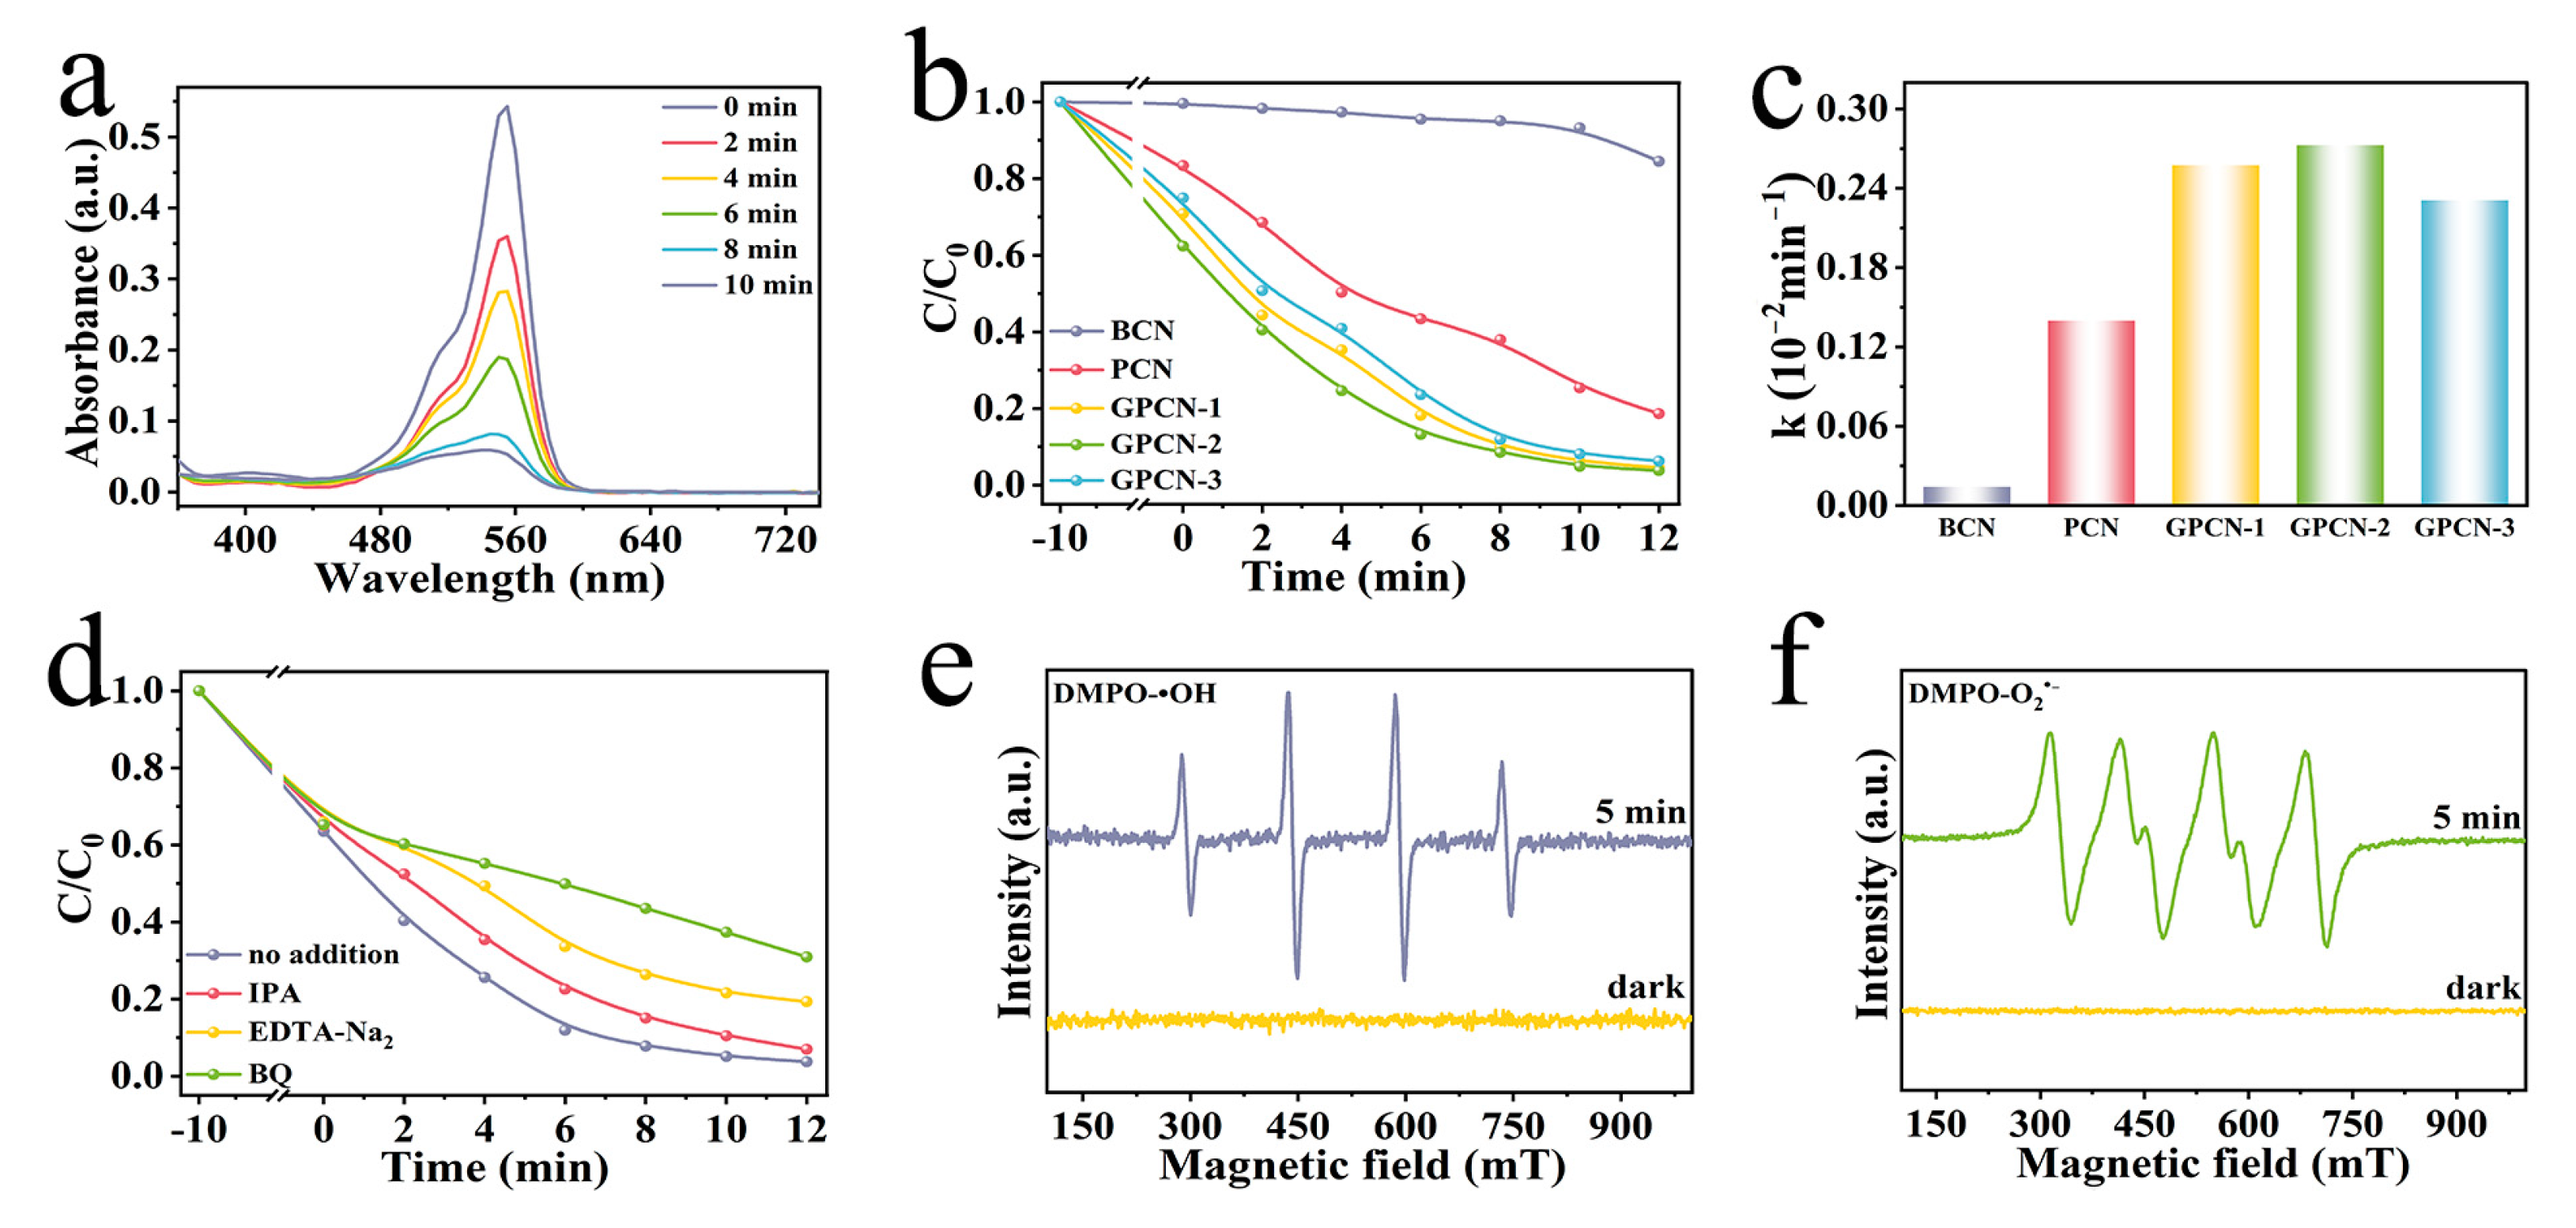
The dye elimination experiments were particularly analyzed as well for further assessment of photocatalytic activity. Rhodamine B solution with an original concentration of 20 mg L
−1 was selected as the simulated target contaminant. The absorption spectrogram of RhB at wavelengths between 350 and 750 nm for different degradation times with the existence of GPCN-2 is displayed in
Figure 5a. It can be observed that the maximum absorption wavelength of RhB is approximately 554 nm, and the content of RhB in the reaction solution gradually decreased as the illumination time increased.
Figure 5b suggests the degradation rates of RhB with different as-prepared catalysts under the same conditions. The results show that BCP presented the minimum adsorption rate (0.38%) and degradation rate (15.47%), which was much lower than those of PCN (16.63% of adsorption and 81.34% of degradation), resulting from the 3D network structure of PCN. Moreover, the adsorption rate of GPCN-2 increased to 37.16%, and the elimination rate of GPCN-2 (96.27%) was 1.18 times that of PCN, which manifested that the g-C
3N
4/rGO heterojunction and 3D porous structure synergistically enhanced the adsorption and photocatalytic elimination performance of the catalysts. In addition, the comparison of the present material with other reported materials in terms of light source, irradiation time and photocatalytic efficiency of RhB degradation are listed in
Table S5. The results indicate that the prepared catalyst in this work was effective in the degradation of RhB. Likewise,
Figure 5c presents the pseudo-first-order rate constant for RhB degradation (k) of different catalysts, which reflects the kinetics of the photocatalytic reaction for RhB degradation, fitted by the Langmuir–Hinshelwood (L-H) equation function model [
63]. The value of k was obtained via the first order kinetic equation, as seen in Equation (4) [
64]. C
0 and C
t represent the residual concentration of RhB at times of zero and t, respectively. GPCN-2 displayed the biggest rate constant of 0.273 min
−1, which was 19.5 times and 1.95 times that of bulk g-C
3N
4 and g-C
3N
4, respectively, proving that the incorporation of rGO and g-C
3N
4 facilitated the removal of RhB by the catalysts. Nevertheless, the values of GPCN-1 and GPCN-3 were slightly lower than that of GPCN-2, which demonstrated that the presence of a large number of nanosheets might affect the reaction of the catalysts with the contaminants. Additionally, we performed five cycles of the RhB degradation with GPCN-2 in
Figure S4, and the degradation rate was 91.79% in the fifth cycle, which was consistent with the hydrogen production test, indicating the stability of GPCN-2 catalyst.
It is well known that free radicals, the unpaired electrons or groups formed by the breakage of covalent bonds in compounds, play important roles in catalytic processes [
65]. To further explore the role of active particles during photocatalytic degradation, an active particle quenching assay and electron spin resonance (ESR) determination were performed.
Figure 5d manifested the rate of degradation of RhB by GPCN-2 in the presence of different quenchers, including IPA, EDTA-Na
2 and BQ, which were the trap** agents of
•OH, h
+ and O
2•−, respectively. The elimination rate of RhB was only 69.06% and 80.7% in the presence of BQ and EDTA-Na
2, which was 27.21% and 15.57% less than that with no quencher addition (96.27%), respectively, revealing that O
2•− and h
+ played crucial role in the oxidative photocatalytic degradation. However, the degradation rate of RhB presented a slight decrease under IPA, indicating a minor involvement of
•OH. Furthermore, the mechanisms of the active particle formation are represented in the following formulas:
The consequences of ESR measurements are suggested in
Figure 5e,f, which mutually corroborates the results of the free radical quenching assay. Both
•OH and O
2•− presented a strong response signal under irradiation but no response in the dark, certifying the significant effectiveness of
•OH and O
2•−.


