1. Introduction
Crustacean production is one of the fastest-growing economic activities to embrace aquaculture as its primary source for commercial produce [
1], with over 9.38 million tons of specimens produced worldwide as of 2018, accounting for 22% of the international aquatic species market. Since the Pacific whiteleg shrimp,
L. vannamei, is the most commonly cultured shrimp species worldwide [
2], several studies have explored its genetics and, more recently, the impact of bacteria in its digestive tract both under wild-type and standardized environmental condition in farms [
3,
4,
5,
6,
7,
8].
Organ or niche-specific bacteria have shown to contribute to the modulation of the shrimp’s immune response, its overall nutrient absorption, vitamin production, and the physiological development and regulation of its metabolic processes, which ultimately have a relevant impact on shrimp production and can be finely tuned in farms [
5,
6,
7,
9,
10].
Thousands of different microorganisms populate the gastrointestinal tract of shrimp. However, the hepatopancreas and the intestine are widely different ecological niches. Each tissue presents specific environment-associated biochemical conditions and nutrient availability, and they are colonized by different sets of bacteria [
4]. The taxonomic variations in the microbiota have been mainly explored using 16S rDNA profiling from environmental and aquaculture samples [
4,
6,
7], frequently selecting up to two consecutive hypervariable regions [
9,
11]. A previous study determined that the hypervariable region V3 is a cost-effective alternative to determine the microbiota diversity in the shrimp hepatopancreas and the intestine [
12]. Although amplicons spanning both the V3 and V4 regions bore a higher taxonomic resolution and diversity, the V3 region showed optimal family-level resolution and better performance than V4 at the genus level using current sequencing technologies [
12].
By far, the most common type of clustering method for shrimp studies has been identity clustering, producing operational taxonomic units (OTUs), which use a fixed sequence identity cutoff, usually 97% for sequences from the same species [
13]. However, different regions vary in their discriminating power in practice, and some phylogenetically-related taxa share a less predictable identity percentage [
14].
In recent years, denoising has been introduced through several different popular algorithms as an alternative clustering method based on predicting and correcting actual sequencing errors (noise) before forming clusters, here referred to as amplicon sequence variants (ASVs) [
15,
16,
17]. Thus, ASV clustering is based on sequence probability rather than sequence identity (as in OTUs). The denoising approaches use well-established statistical models to determine which low-prevalence sequences appear more than would be expected for artifacts and are therefore valid sequence variants. This results in fewer but self-consistent custom clusters that have been thoroughly validated to have a more acceptable precision [
18,
19,
20]. In recent years, the field of microbiota research has been using ASVs increasingly often, in addition to the traditional OTUs methods. The differences of both identity and denoising methods have been explored on mock communities, soil, mouse feces, human milk, and intestinal samples [
19,
20,
21,
22,
23,
24] but remain largely unexplored in shrimp-related ecological niches.
To this date, few studies have used denoising methods to assess the microbiota in culturable aquatic species, and their obtained taxonomy, α, and β-diversity profiles need to be compared to OTUs findings to unify the microbiota discoveries. The first such study in
L. vannamei was carried out for the microbiota of Malaysian and Vietnamese specimens by Zoqratt et al. in 2018 [
25] focused on V3-V4 amplicons for studying differences in the
Vibrio genus using a sequence-specific approach.
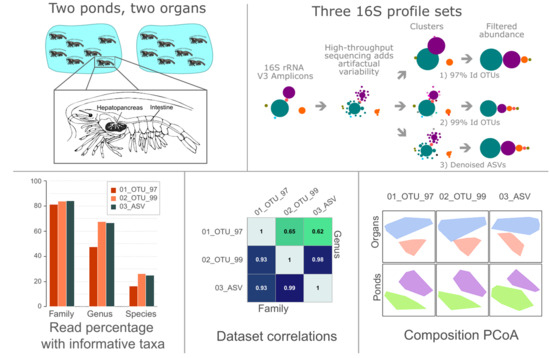
Now, the objectives of our study were: (i) to obtain adequate sequence filters that make the taxonomy comparable between OTUs and ASVs 16S profiling for shrimp microbiota, and (ii) to validate those sequence filters to identify the variations in the microbiota from different biological (organ) and environmental (pond) niches between OTUs and ASVs. To this end, we analyzed the 16S profiles from the shrimp intestine and hepatopancreas from different ponds using the same set of V3 amplicons with 97% and 99% identity OTUs ASVs using standard algorithms for 16S profiling [
15,
26]. Our study determined whether traditional and new clustering approaches are comparable in taxonomy, α, and β-diversity profiles for shrimp microbiota.
4. Discussion
The most significant differences in the overall bacterial composition in our study were those observed between the different organs, the intestine and the hepatopancreas. The homeostasis of aquatic species is heavily influenced by environmental conditions, such as temperature, salinity, pH, and nutrient availability impacting the diversity of microorganisms that share the same habitats [
41]. The relevance of host-associated microbiota has been established by several studies focusing on the essential role that bacteria play in the intestinal tract. These bacteria play a role by modulating the immune response, establishing an ecological barrier by competing against pathogenic bacteria, and have critical roles in nutrient absorption and the regulation of metabolic processes [
9,
10,
42].
Differences between ponds were also significant, which can be explained as the environmental microbial communities are particularly important in the establishment of the gastrointestinal microbiota, as the initial bacterial colonization is thought to have its origins in the surrounding water and sediment [
4,
43]. This has been supported by studies reporting similarities in the bacterial composition of sediment and that from the tract of aquatic species that present a burrowing behavior [
41]. Even though rearing conditions are controlled in aquaculture crustacean production settings, the microbial composition has been found to vary between ponds in shrimp farms, but differences between ecological niches within the specimens are far more patent [
4,
12,
44]. In this regard, studies in different shrimp species have reported a higher diversity in the hepatopancreas than in intestine samples, both of which are part of the gastrointestinal tract [
12,
45]. This may reflect an increased organ-specific selecting pressure, possibly due to its role in the immune response through the production of lectin, hemocyanin, ferritin, antibacterial proteins, proteolytic enzymes, and nitric oxide [
46,
47,
48,
49].
Currently, most studies exploring the 16S-profiles taxonomic composition of the gastrointestinal microbiota of aquatic species use identity-based OTU clusters to cope with the artifactual variability produced by high-throughput sequencing platforms. A practical and streamlined solution that groups 16S sequences is based on amplicon similarity between different taxa and varies in terms of sensitivity depending on the identity cutoff [
14], as shown in
Figure 1C. This was also seen in our study, where the 99% identity OTU set allowed for a more detailed taxonomic characterization than the 97% set of the less abundant amplicon variants, assumingly arising from less prevalent taxa [
24].
The VSEARCH algorithm used in this study used the same type of centroid-based clusters used in older QIIME1’s uclust sets. The 99% threshold was selected since DADA2’s authors claimed their algorithm achieved a single-nucleotide resolution [
15]. Since the V3 region is approximately 127–168 nt long, this would represent roughly a 99% identity variation. However, the higher sensitivity of this approach also introduced a larger number of OTUs that actually pointed to the same extant sequences and taxa (
Figure 2 and
Figure 3). Denoising methods have gained momentum in recent years as an unconstrained alternative (not sequence identity-dependent) that does not pose as much a tradeoff of sensitivity and accuracy since they aim at classifying each amplicon variant separately, considering the errors that may have been introduced during the sequencing [
16,
17,
18,
19,
20,
24]. Due to the growing popularization of denoising methods, we deem it necessary to study how future ASV-based profiles of aquatic species’ microbiota will compare to extant OTU-based studies. The DADA2 algorithm was selected as it has good technical support and receives regular updates from its creators. It is free (unlike UNOISE3) and has no sequence length limitations (as Deblur). As expected [
15,
18,
19], the denoising approach used in the present study produced far fewer ASVs than OTUs but with higher abundances. (
Figure 1C and
Figure 3). Even though ASVs led to a limited number of species, working with less than 500 species is not necessarily detrimental but maybe, in fact, more accurate [
19,
20].
Rare cluster centroid variants in either the OTU or the ASV sets are where the three methods diverge. To study them, we analyzed the actual sequence variation and how their distribution varies between sets. The comparison showed that more than half of all unique centroid (representative) sequences were detected exclusively in the 02_OTU_99 set. Interestingly, these accounted for a mere 2.50% of all reads in the three sets (
Figure 2A). Contrastingly, the much smaller overlap of unique centroid sequences existing between the three sets (6.62% of all centroid sequences) accounted for over 87% of all reads, which show that all three methods work well with the abundant amplicons.
Differences that may be attributed to the varying methodologies could be traced back to punctual changes (detected as indels or mismatches between all pairwise permutations) in the nucleotide sequence of amplicons sharing high sequence similarity (
Figure 2C). Based on the results, set 03_ASV showed the highest proportion of high-resolution centroid sequences, with single-nucleotide level differences in almost twice as much as the percentage observed in set 01_OTU_97, all of which were found only in reference-based clusters. In contrast, set 02_OTU_99 showed the highest sequence-redundancy, as close to 70% of all sequences in that set differed in only two changes between one another, and more than 60% of them could be clustered at 98% sequence identity and 80% at 97% identity (
Figure 2D).
Despite having a smaller number of total reads than the ASV set, reads in both OTU sets were grouped into a larger collection of clusters, each bearing a different unique centroid sequence (
Figure 2B), more noticeable in the 02_OTU_99 set. This was expected, as rising the clustering identity assigned sequences into less populated clusters, resulting in an overestimation of the actual diversity. Even differences of just a couple bases may produce additional separate OTUs, compared with the 97% identity set. On the contrary, the ASV sets had fewer clusters (
Figure 2B, light bars), as was expected due to denoising, which has been suggested to be a more accurate measure of the actual diversity [
18].
In terms of maximum resolution, both the 99 OTUs and the ASVs had over 98% sequence identity in their more similar sequences. Interestingly, it turned out that using reference-based clusters in both OTU sets produced a few clusters bearing a similar resolution to that seen in the 03_ASV set (
Figure 2C,D), while
de novo clusters had the expected identity (97% or 98.8%) in the corresponding 97 and 99 sets. The upper limit of detection achieved in the 03_ASV set and the reference-based clusters appeared to be at 99.2% sequence similarity, representing a variation of approximately 1 nt in a 135 nt sequence. From these analyses, we concluded that set 03_ASV was the most resilient set, meaning that its clusters are well-outlined, show a similar resolution to that observed in the 02_OTU_99 but bearing a much lower cluster redundancy.
It is key to highlight that the main focus of the current study was not to evaluate the technical challenges of producing either identity clusters or denoising, nor how well they capture the known diversity. This is because most contemporary studies on aquatic ambiances still use OTUs, and specialized revisions have already demonstrated the major advantages and limitations of denoising methods [
15,
16,
18,
19,
20]. Instead, we intended to determine how both types of profiles compare to one another if past and future studies may be compatible and may produce comparable shrimp taxonomy and diversity profiles. Most studies comparing the resulting taxonomies between OTUs and ASVs have focused on niches such as soil, mouse feces, human milk, and intestinal samples [
19,
21,
22,
23], but aquatic species had remained largely unexplored.
Regarding taxonomy, as we concluded in a previous study, the Greengenes database has some limitations for 16S profiling [
12], mainly because it is no longer being maintained, but it was selected for this study for comparison to legacy sets as it is still the most commonly used reference in studies focusing on aquatic ambiances. Some of the issues in the database (common in the vanilla version of QIIME1) have been addressed as the cluster references have been recalculated in latter versions of QIIME2 with a newer Bayesian classifier algorithm [
23], and we also fixed known issues with
Pseudoalteromonas and
Vibrio assignations. We found that filtering low-frequency clusters produced highly comparable microbiota sets in terms of taxonomy, α and β diversities (
Supplementary Figure S2.5 and S2.6). This shows that existing OTU sets may be compared under even conditions to upcoming ASV sets by providing adequate sequence filters because variation in OTU sets is mainly comprised by large collections of small clusters whose centroid sequences vary in just a few nucleotides from those in larger clusters, which are successfully by all three approaches.
The frequency filters affected the 99% identity set more prominently, as a larger proportion of sequences were in low abundance OTUs (
Figure 3B). This phenomenon derives from two main components that have been discussed in previous studies: first, the high sequence identity cutoff makes biological and artifactual variants indistinguishable, resulting in an overestimation of the total clusters [
50,
51,
52]. Second, each 16S hypervariable region has a distinct taxonomic resolution [
14], and the identity cutoff for higher levels (genus/species) is not evenly defined for all clades [
12,
53]. In our study, we have no means of determining the actual biological composition. However, our ASV set showed an increased resolution slightly higher than that of the 99% identity OTUs but with far fewer variants that differ in 1 or 2 bases as the ASV cluster centroids were more distant from one another(
Figure 2C,D), as a result of the denoising process [
15]. Even though we cannot assume that this is in fact due to overestimation in our case, it is clear that most of the additional sequences in the 02_OTU sets group into low-frequency clusters that are peripheric to the most abundant ones as would be expected for artifactual variants (
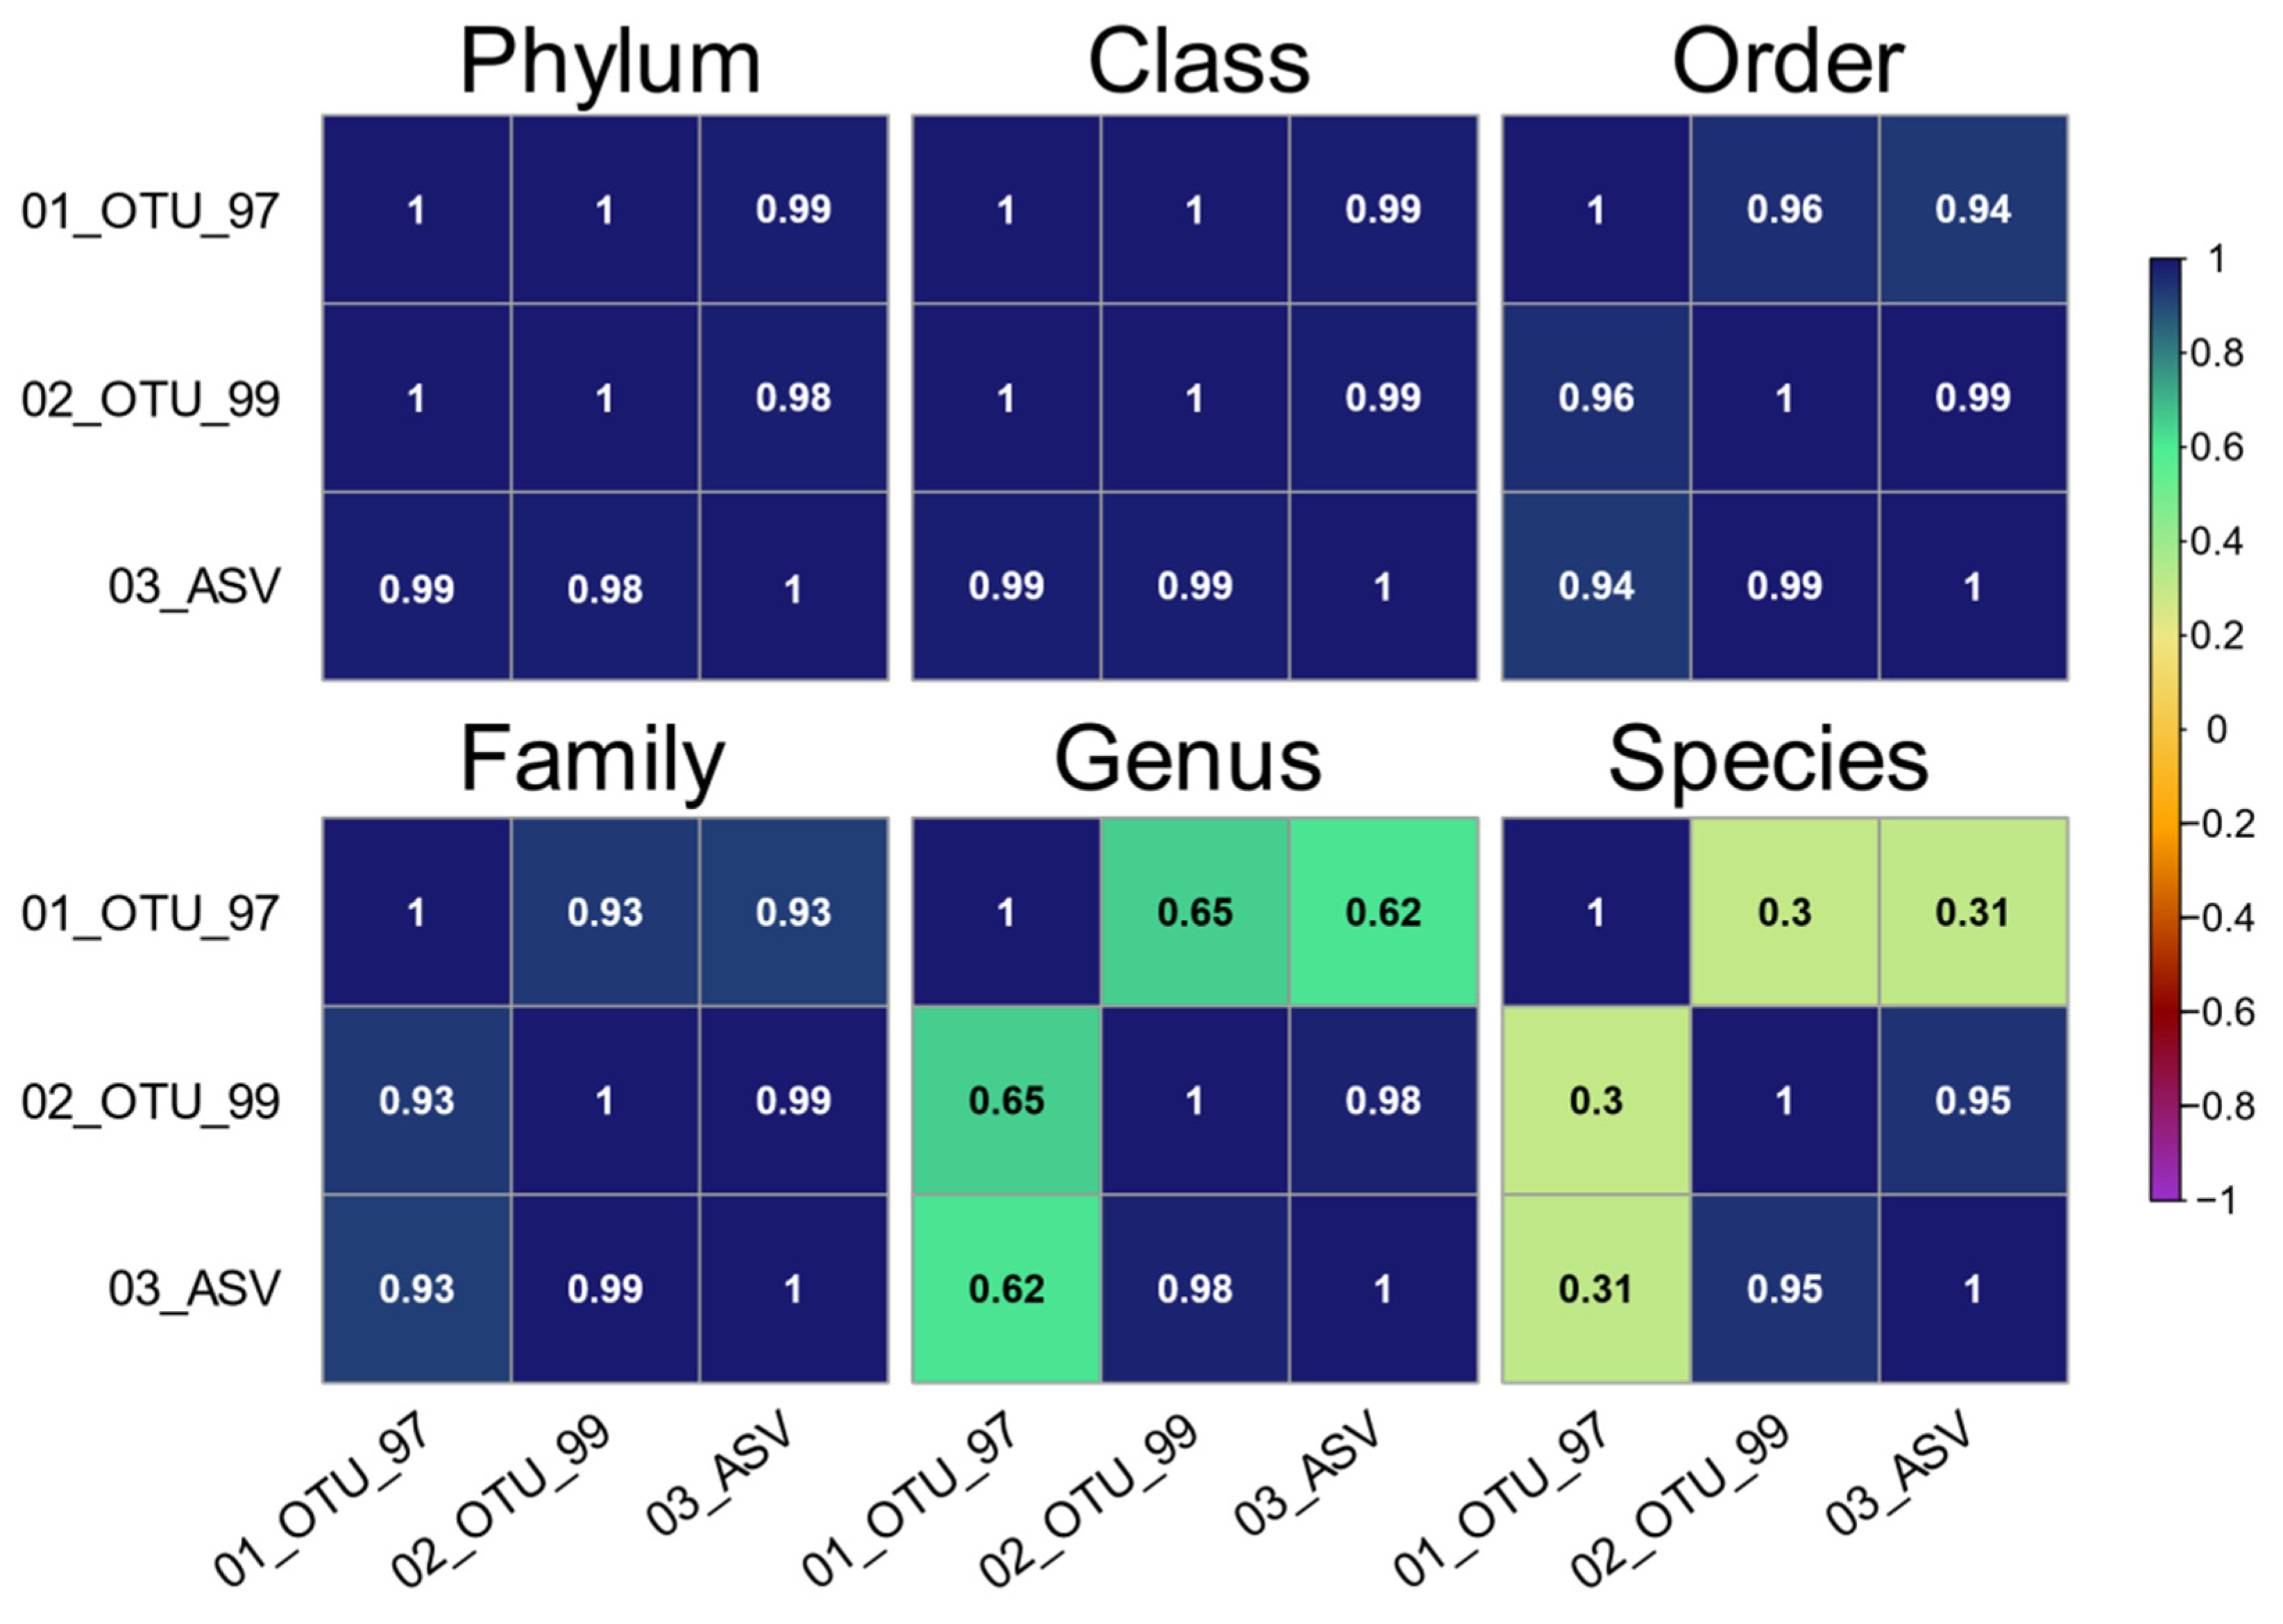
Figure 1) and these would normally be discarded due to their low frequency. The taxonomic composition between the sets at all levels showed a high correlation between the 97% identity clusters and the other sets from phylum to family (ρ ≥ 0.93), which dropped at the genus and species levels (ρ ≤ 0.65, and ρ ≤ 0.31, respectively). Therefore, the comparison of taxonomic composition between the OTU and ASV sets is very feasible at most taxonomic levels (
Figure 6), provided adequate frequency filters are included in the analyses. Notably, the taxa shared among the three datasets accounted for a high percentage of the total reads in all sets (99.76% in families, 97.40% in genera, and 94.95% in species).
The actual differences were seen in the abundance of ambiguous taxa, mainly found in the 97% identity OTU set. As we previously reported comparing hypervariable regions [
12], most reads in the 97% OTU set from the V3 region can be unambiguously assigned to a specific family and nearly half of them to the genus level. However, higher-level clades often include several different species yielding non-informative assignations (
Figure 4). Although the family-level resolution was similar for all sets (>80% reads), a significantly larger percentage of all reads had a genus-level resolution in the 99% identity and all ASV sets, along with a discrete increase in the species level, compared to the 97% OTU set. Thus, in the current study, in terms of taxonomic resolution, the ASV sets outperformed the 97% identity OTUs and matched the 99% set, albeit with cleaner cluster limits and more reads kept, as expected for denoising methods [
15,
16,
17,
19,
20]. Regarding the reasons why clusters cannot be assigned at the species level, our exploration of the taxonomy associated with the centroid sequences revealed that ASVs had a lower proportion of non-assigned species that were due to the lack of consensus LCA than both OTU sets. In this set, barely half of the missing species could be explained by labels missing from the reference database.
Not all clusters that were derived from the different methodologies (OTUs/ASVs) produced the same sequences, as paired-end processing and sequence grou** are carried out differently between the methods, but the resulting taxonomic composition buffered these differences. In this regard, we observed similar numbers of taxa shared in all raw sets (
Supplementary Figure S2.2,
Supplementary Table S3.3) and similar abundance distributions between the 02_OTU_99 and the ASV set (
Figure 6). Interestingly, the main difference between 01_OTU_97 and the 02_OTU_99 and ASV sets arises from taxonomic resolution (
Figure 4 and
Supplementary Figure S2.4), showing a larger proportion of phylogenetically distant clades in higher taxonomic levels in the former. For instance, whereas family Vibronaceae comprised >16% of the total reads in the 97% OTU set, these were instead assigned to genus
Vibrio and species
V. tapetis in the 99% OTU, similarly to what was reported for ASVs.
Vibrio is a genus of Gram-negative bacteria from marine environments, which is pathogenic in culturable animals, such as
Vibrio alginolyticus in fish [
54],
V. tapetis [
55] in mollusks and
Vibrio parahaemolyticus, and
Vibrio harveyi in crustaceans such as prawn and shrimp [
25,
56,
57,
58]. In fact, the first study of shrimp microbiota using ASVs (carried out with UNOISE instead of DADA2) focused on specific
Vibrio species and reported that the species’ diversity might be underestimated when using OTUs using direct sequence comparisons [
25]. Similar observations were made with undetermined species from order Burkholderiales in set 01_OTU_97. The additional taxonomic resolution of 99 OTU clusters and ASVs allowed for the identification of
M. niastensis and
Pseudoburkholderia malthae instead. Gram-negative Burkholderiales were prevalent in the river and cultured shrimps [
44,
59], whereas genus
Massilia comprise aerobic, motile bacteria that have been found in water, soil, and air and have been associated with nitrate reduction and chitin degradation [
60,
61]. Although its family, Oxalobacteraceae, has been reported to be prevalent in shrimp samples [
44], there are few mentions of genus
Massilia in related habitats [
62] and none specifically of
M. niastensis in these samples in the literature. A similar case occurs with
P. malthae, a homotypic synonym of
Noviherbaspirillum malthae, characterized as anaerobic, rod-shaped bacterium present in oil-contaminated sites [
63] but has not been reported as part of shrimp microbiota. Together, these genera and species comprise 1–3% of the relative abundance in 99% OTUs and ASVs (
Supplementary Figure S2.4) and show the difference in taxonomic resolution of ASVs, which will eventually require databases to include closer homologous references as the exact species found in shrimp may be missing.
All sets produced similar trends for richness and entropy for organs and ponds regardless of the ASVs or OTUs protocols. In general, richness was higher in hepatopancreas than in intestine samples, contrary to the Shannon entropy diversity (
Figure 7). Taxa diversity comparison also showed similar tendencies (
Supplementary Figure S2.5). This was quite positive since it suggests that previously published OTU surveys of shrimp microbiota may be compatible with future ASV assays in taxa and α-diversity analyses. The main difference with ASVs was that all the groups’ estimated values were lower, congruent to the smaller number of clusters and more homogeneous taxa grou** in the sets. Still, differences and proportions between organ and pond groups were a perfect reflection of those detected in the OTUs sets (
Supplementary Figure S2.5).
Regarding β-diversity, ordination methods produced a full separation of samples, both by organ and pond, in all three sets using composition-based (unweighted) UniFrac distances (
Figure 7). This further supports compatibility between the ASV and OTU methods, validating that both approaches can separate the microbiota from different organs and different ponds. Nevertheless, these grou**s accounted for only a part of the explained variation. We also found that taxonomy can also effectively identify group differences at higher levels in both ASV and OTU sets (
Supplementary Figure S2.6).
It is also clear that the host exerts robust filtering on establishing external microbes [
64], and as stated before, both approaches show significant differences in the microbial communities between the shrimp gut and hepatopancreas [
4]. Here, we observed a more substantial impact of the biological (organ) on microbiota structure than the environmental (pond) factor. Consistent with this pattern, it has been shown that sediment microbes are major sources for shrimp gut commensals in cultural pond ecosystems [
65]. Also importantly, the microorganisms in shrimp aquaculture ponds could be associated with shrimp disease occurrence [
66,
67].
Regarding the limitations of the current study, we did not experimentally evaluate how representative our profiles were of the microbiome analyzed [
68]. As microbial datasets are known to be compositional, experimental biases may be carried to downstream analyses [
69]. This may have been addressed by the addition of a suitable mock community as a control to adjust for experimental biases. Yet, commercially available solutions are mainly focused on human-derived sites, and a separate design would be required in order to standardize a custom aquatic collection that included bacteria such as members from
Vibrio species and from phyla Cyanobacteria and Verrucomicrobia, which are central to this niche, to take full advantage [
4,
44]. However, as the same set of sequences was used for creating all three profile sets, and since all samples were processed using the same protocol and sequenced together in a single run, the same amount of technical bias is expected to be homogenous in the whole set of sequences and hence in downstream analyses including clustering methods. Thus, we would not expect this to pose a critical limitation that may invalidate our results regarding comparability between methods.
Since the taxonomic composition and abundance in studies using OTUs and ASVs can be compared for shrimp samples under confined conditions used in this study, future prospect studies may include environmental samples from the rearing water and sediment.


 ,
, 


