
A Cost-Effective Model for Predicting Recurrent Gastric Cancer Using Clinical Features

 , , ,
, , ,  and
and 
Abstract
:1. Introduction
2. Materials and Methods
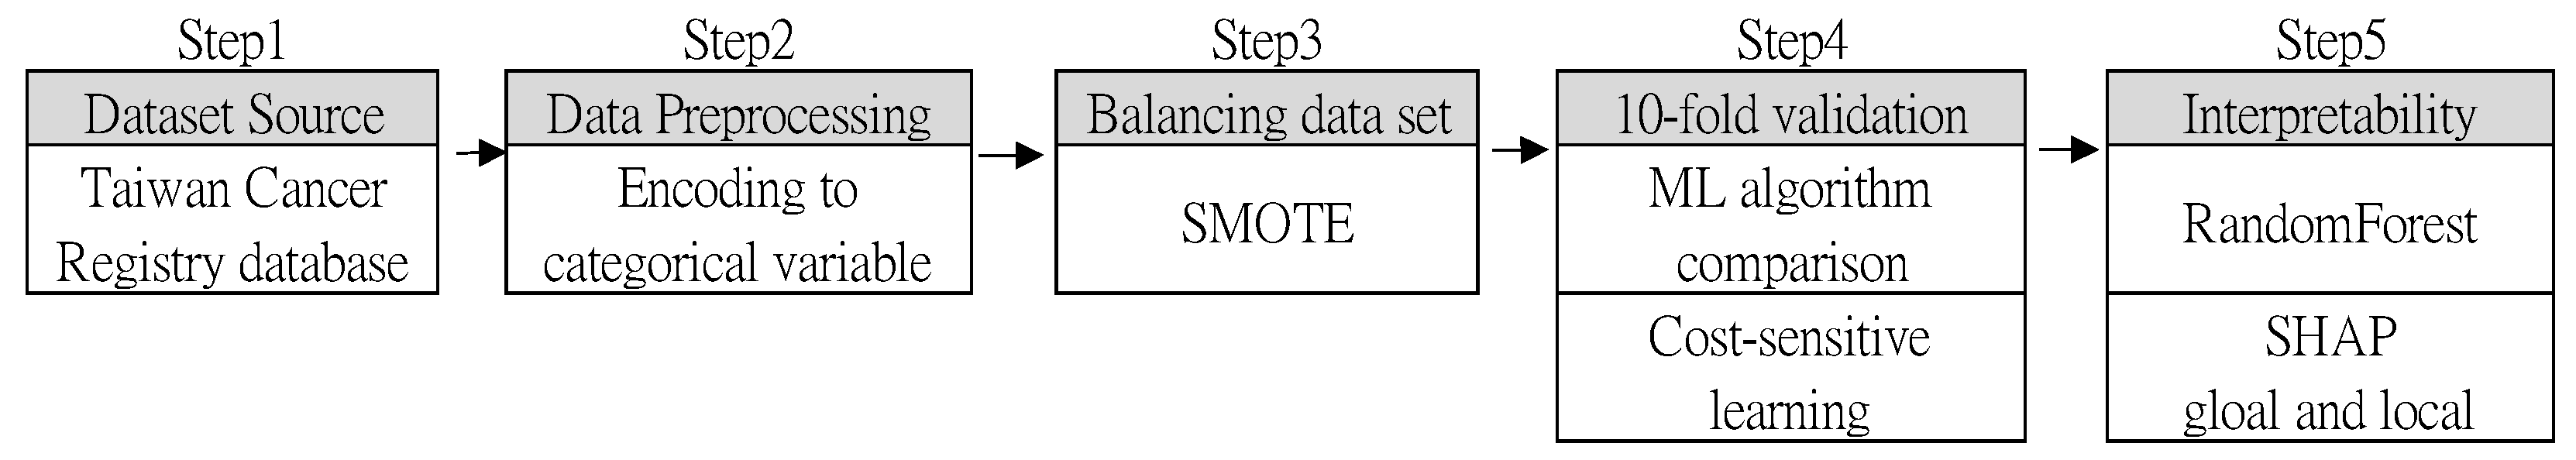
2.1. Data Preparation and Machine Learning Models
2.2. Dataset Sources
2.3. Data Preprocessing
2.4. Dataset Balancing
2.5. 10-Fold Cross-Validation
- MLP: A classifier that uses backpropagation to learn a Multilayer Perceptron to classify instances.
- C4.5: This algorithm develops a decision tree by splitting the value of the feature at each node, including categorical and numeric features. We calculated the information gain and used the feature with the highest gain as the splitting rule.
- AdaBoost with C4.5: It is a part of the group of ensemble methods called boosting and adds newly trained models in a series where subsequent models focus on fixing the prediction errors made by previous models. In this study, we selected C4.5 as the base classifier.
- Bagging (Bootstrap Aggregation) with C4.5: This is an ensemble skill that uses the bootstrap sampling technique to form different sets of samples with replacement. We used C4.5 as a base classifier to derive the forest.
2.6. Interpretability in Machine Learning Models
3. Results
3.1. Traditional Predictor Algorithms
3.2. Prediction Performance
3.3. Interpretability
4. Discussion
5. Conclusions
Author Contributions
Funding
Institutional Review Board Statement
Informed Consent Statement
Data Availability Statement
Conflicts of Interest
References
- Zhang, W.; Fang, M.; Dong, D.; Wang, X.; Ke, X.; Zhang, L.; Hu, C.; Guo, L.; Guan, X.; Zhou, J.; et al. Development and validation of a CT-based radiomic nomogram for preoperative prediction of early recurrence in advanced gastric cancer. Radiother. Oncol. 2019, 145, 13–20. [Google Scholar] [CrossRef] [PubMed]
- Liu, B.; Tan, J.; Wang, X.; Liu, X. Identification of recurrent risk-related genes and establishment of support vector machine prediction model for gastric cancer. Neoplasma 2018, 65, 360–366. [Google Scholar] [CrossRef] [PubMed]
- Zhou, C.; Hu, J.; Wang, Y.; Ji, M.-H.; Tong, J.; Yang, J.-J.; ** a Stacked Ensemble-Based Classification Scheme to Predict Second Primary Cancers in Head and Neck Cancer Survivors. Int. J. Environ. Res. Public Health 2021, 18, 12499. [Google Scholar] [CrossRef] [PubMed]


| TP Rate | FP Rate | Precision | Recall | F1 Score | Accuracy | Class |
|---|---|---|---|---|---|---|
| Average (Values of Random Forest) | ||||||
| 0.852 | 0.095 | 0.899 | 0.852 | 0.875 | 0.879 | Non-Recurrence |
| 0.905 | 0.148 | 0.860 | 0.905 | 0.882 | Recurrence | |
| Fold 1 | ||||||
| 0.859 | 0.093 | 0.903 | 0.859 | 0.880 | 0.883 | Non-Recurrence |
| 0.907 | 0.141 | 0.864 | 0.907 | 0.885 | Recurrence | |
| Fold 2 | ||||||
| 0.820 | 0.078 | 0.913 | 0.820 | 0.864 | 0.870 | Non-Recurrence |
| 0.922 | 0.180 | 0.836 | 0.922 | 0.876 | Recurrence | |
| Fold 3 | ||||||
| 0.849 | 0.078 | 0.916 | 0.849 | 0.881 | 0.885 | Non-Recurrence |
| 0.922 | 0.151 | 0.858 | 0.922 | 0.889 | Recurrence | |
| Fold 4 | ||||||
| 0.863 | 0.132 | 0.868 | 0.863 | 0.866 | 0.866 | Non-Recurrence |
| 0.868 | 0.137 | 0.863 | 0.868 | 0.866 | Recurrence | |
| Fold 5 | ||||||
| 0.868 | 0.073 | 0.922 | 0.868 | 0.894 | 0.897 | Non-Recurrence |
| 0.927 | 0.132 | 0.876 | 0.927 | 0.900 | Recurrence | |
| Fold 6 | ||||||
| 0.853 | 0.122 | 0.874 | 0.853 | 0.864 | 0.866 | Non-Recurrence |
| 0.878 | 0.147 | 0.857 | 0.878 | 0.867 | Recurrence | |
| Fold 7 | ||||||
| 0.843 | 0.093 | 0.901 | 0.843 | 0.871 | 0.875 | Non-Recurrence |
| 0.907 | 0.157 | 0.853 | 0.907 | 0.879 | Recurrence | |
| Fold 8 | ||||||
| 0.858 | 0.102 | 0.893 | 0.858 | 0.875 | 0.878 | Non-Recurrence |
| 0.898 | 0.142 | 0.864 | 0.898 | 0.880 | Recurrence | |
| Fold 9 | ||||||
| 0.858 | 0.103 | 0.893 | 0.858 | 0.875 | 0.877 | Non-Recurrence |
| 0.897 | 0.142 | 0.863 | 0.897 | 0.880 | Recurrence | |
| Fold 10 | ||||||
| 0.858 | 0.078 | 0.916 | 0.858 | 0.886 | 0.890 | Non-Recurrence |
| 0.922 | 0.142 | 0.866 | 0.922 | 0.893 | Recurrence | |
| No Recurrence | Recurrence | Chi-Square Test | Hazard Ratio | ||
|---|---|---|---|---|---|
| 2044 (82.55%) | 432 (17.44%) | ||||
| F1. Gender | Male | 1273 (62.3%) | 295 (68.3%) | 5.541 | 1.00 |
| Female | 771 (37.7%) | 137 (31.7%) | (p = 0.019) * | 1.30 [1.05–1.62] | |
| F2. Age at Diagnosis | <20 | 1 (0.02%) | 0 (0.0%) | 6.389 | 1.00 |
| 21~30 | 11 (0.53%) | 2 (0.46%) | (p = 0.604) | 0.00 [0.00- ] | |
| 31~40 | 56 (2.73%) | 14 (3.24%) | 3.09 [0.24–38.31] | ||
| 41~50 | 186 (9.09%) | 51 (11.81%) | 4.25 [0.52–34.71] | ||
| 51~60 | 488 (23.9%) | 95 (21.99%) | 4.66 [0.60–35.86] | ||
| 61~70 | 558 (27.3%) | 111 (25.69%) | 3.30 [0.43–25.16] | ||
| 71~80 | 505 (24.7%) | 106 (24.54%) | 3.38 [0.44–25.67] | ||
| 81~90 | 222 (10.9%) | 52 (12.04%) | 3.56 [0.47–27.10] | ||
| >90 | 17 (0.83%) | 1 (0.23%) | 3.98 [0.51–30.60] | ||
| F3. Grade/Differentiation | Well differentiated | 178 (8.71%) | 11 (2.55%) | 40.698 | 1.00 |
| Moderately differentiated | 557 (27.25%) | 117 (27.08%) | (p ≤ 0.001) ** | 0.38 [0.19–0.78] | |
| Poorly differentiated | 951 (46.53%) | 256 (59.26%) | 1.32 [0.88–1.96] | ||
| Undifferentiated/anaplastic | 119 (5.82%) | 10 (2.31%) | 1.69 [1.17–2.44] | ||
| NA | 239 (11.69%) | 38 (8.80%) | 0.52 [0.25–1.09] | ||
| F4. Tumor Size | 1~49 mm | 1357 (66.39%) | 180 (41.67%) | 103.840 | 1.00 |
| 50~99 mm | 492 (24.07%) | 198 (45.83%) | (p ≤ 0.001) ** | 0.66 [0.37–1.18] | |
| 100~149 mm | 92 (4.50%) | 34 (7.87%) | 2.01 [1.12–3.58] | ||
| >= 150 | 28 (1.37%) | 5 (1.16%) | 1.84 [0.93–3.64] | ||
| NA | 75 (3.67%) | 15 (3.47%) | 0.89 [0.29–2.68] | ||
| F5. Number of regional lymph node involvement | 0 | 889 (43.49%) | 45 (10.42%) | 358.366 | 1.00 |
| 1~2 | 235 (11.50%) | 57 (13.19%) | (p ≤ 0.001) ** | 0.75 [0.44–1.26] | |
| 3~6 | 254 (12.43%) | 84 (19.44%) | 3.59 [2.13–6.04] | ||
| 7~15 | 209 (10.23%) | 107 (24.77%) | 4.90 [2.98–8.05] | ||
| >16 | 131 (6.41%) | 117 (27.08%) | 7.58 [4.64–12.39] | ||
| NA | 326 (15.95%) | 22 (5.09%) | 13.23 [8.03–21.78] | ||
| F6. Cancer Stage | 0 | 43 (2.10%) | 0 (0.0%) | 298.851 | 1.00 |
| 1A, 1B (Stage I) | 821 (40.17%) | 24 (5.56%) | (p ≤ 0.001) ** | 0.00 [0.00- ] | |
| 2A, 2B (Stage II) | 480 (23.48%) | 76 (17.60%) | 0.19 [0.41–0.88] | ||
| 3A, 3B, 3C (Stage III) | 640 (31.31%) | 307 (71.06%) | 1.02 [0.22–4.65] | ||
| (Stage IV) | 47 (2.30%) | 23 (5.32%) | 3.11 [0.69–13.90] | ||
| NA | 13 (0.64%) | 2 (0.46%) | 3.18 [0.66–15.29] | ||
| F7. Residual tumor on edge of primary site | No residual tumor | 1916 (93.73%) | 392 (90.74%) | 22.657 | 1.00 |
| residual tumor | 74 (3.62%) | 36 (8.33%) | (p ≤ 0.001) ** | 2.76 [0.99–7.67] | |
| NA | 54 (2.64%) | 4 (0.93%) | 6.56 [2.20–19.55] | ||
| F8. Radiation therapy | No/NA | 1946 (95.21%) | 392 (90.74%) | 13.508 | 1.00 |
| Yes | 98 (4.79%) | 40 (9.26%) | (p ≤ 0.001) ** | 0.49 [0.33–0.72] | |
| F9. Chemotherapy | No/NA | 1173 (57.39%) | 133 (30.79%) | 101.243 | 1.00 |
| Yes | 871 (42.61%) | 299 (69.21%) | (p ≤ 0.001) ** | 0.33 [0.26–0.41] | |
| F10. BMI | <18.5 | 107 (5.23%) | 32 (7.41%) | 11.498 | 1.00 |
| 18.5~24 | 869 (42.51%) | 206 (47.69%) | (p = 0.009) * | 1.23 [0.71–2.11] | |
| >24 | 924 (45.21) | 159 (36.80%) | 0.97 [0.65–1.45] | ||
| NA | 144 (7.05) | 35 (8.10%) | 0.70 [0.47–1.06] | ||
| F11. Smoking | No | 1378 (67.42%) | 261 (60.42%) | 9.588 | 1.00 |
| Yes | 647 (31.65%) | 169 (39.12%) | (p = 0.008) * | 1.79 [0.41–7.77] | |
| NA | 19 (0.93%) | 2 (0.46%) | 2.48 [0.57–10.75] | ||
| F12. Betelnut Chewing | No | 1803 (88.21%) | 391 (90.51%) | 2.467 | 1.00 |
| Yes | 173 (8.46%) | 32 (7.41%) | (p = 0.291) | 1.63 [0.81–3.31] | |
| NA | 68 (3.33%) | 9 (2.08%) | 1.39 [0.63–3.08] | ||
| F13. Alcohol drinking | No | 1510 (73.87%) | 301 (69.68%) | 6.855 | 1.00 |
| Yes | 500 (24.46%) | 128 (29.63%) | (p = 0.032) * | 2.25 [0.68–7.40] | |
| NA | 34 (1.66%) | 3 (0.69%) | 2.90 [0.87–9.59] | ||
| F14. SSF1 Carcinoembryonic antigen CEA test Value | 001 | 1 (52.9%) | 0 (0.0%) | 51.726 | 1.00 |
| 002~200 | 1511 (73.92%) | 345 (79.86%) | (p ≤ 0.001) ** | 0.00 [0.00- ] | |
| 201~400 | 21 (1.03%) | 10 (2.31%) | 1.98 [1.42–2.56] | ||
| 401~600 | 5 (0.24%) | 6 (1.39%) | 3.97 [1.78–8.85] | ||
| 601~800 | 2 (0.15%) | 2 (0.46%) | 10.02 [2.96–33.86] | ||
| 801~986 | 1 (0.05%) | 2 (0.46%) | 8.35 [1.15–60.42] | ||
| 987 | 10 (0.49%) | 8 (1.85%) | 16.71 [1.49–187.1] | ||
| 000,988,999 | 493 (24.12%) | 59 (13.66%) | 6.68 [2.53–17.60] | ||
| F15. SSF2 Carcinoembryonic antigen CEA difference Value | CEA > criteria | 198 (0.96%) | 92 (21.30%) | 59.362 | 1.00 |
| CEA < criteria | 1349 (67.00%) | 281 (65.05%) | (p ≤ 0.001) ** | 3.89 [2.69–5.61] | |
| CEA~ = criteria | 3 (0.15%) | 0 (0.0%) | 1.74 [1.29–2.35] | ||
| NA | 494 (24.17%) | 59 (13.66%) | 0.00 [0.00- ] | ||
| F16. SSF3 Helicobacter pylori | 000_negtive | 852 (41.68%) | 227 (52.55%) | 30.285 | 1.00 |
| 001–010_positive | 658 (32.19%) | 143 (33.10%) | (p ≤ 0.001) ** | 2.29 [1.69–3.10] | |
| 988,998,999 | 534 (26.13%) | 62 (14.35%) | 1.87 [1.36–2.57] | ||
| F17. SSF5 Lymphatic or vascular | No | 171 (8.36%) | 4 (0.92%) | 30.087 | 1.00 |
| Yes | 198 (9.69%) | 44 (10.19%) | (p ≤ 0.001) ** | 0.10 [0.03–0.270] | |
| NA | 1675 (81.95%) | 384 (88.89%) | 0.96 [0.68–1.36] |
| Algorithm | TP Rate | FP Rate | Precision | Recall | F1 Score | ROC Area | PRC Area | Accuracy | Category |
|---|---|---|---|---|---|---|---|---|---|
| MLP | 0.835 | 0.112 | 0.882 | 0.835 | 0.858 | 0.909 | 0.91 | 0.862 | Non-Recurrence |
| 0.888 | 0.165 | 0.843 | 0.888 | 0.865 | 0.909 | 0.883 | Recurrence | ||
| C4.5 | 0.812 | 0.123 | 0.869 | 0.812 | 0.839 | 0.874 | 0.849 | 0.844 | Non-Recurrence |
| 0.877 | 0.188 | 0.823 | 0.877 | 0.849 | 0.874 | 0.826 | Recurrence | ||
| AdaBoost C4.5 | 0.859 | 0.115 | 0.882 | 0.859 | 0.87 | 0.933 | 0.924 | 0.872 | Non-Recurrence |
| 0.885 | 0.141 | 0.863 | 0.885 | 0.873 | 0.933 | 0.937 | Recurrence | ||
| Bagging C4.5 | 0.829 | 0.111 | 0.882 | 0.829 | 0.855 | 0.941 | 0.932 | 0.859 | Non-Recurrence |
| 0.889 | 0.171 | 0.839 | 0.889 | 0.863 | 0.941 | 0.945 | Recurrence | ||
| Random Forest | 0.853 | 0.095 | 0.899 | 0.853 | 0.875 | 0.952 | 0.945 | 0.879 | Non-Recurrence |
| 0.905 | 0.147 | 0.860 | 0.905 | 0.882 | 0.952 | 0.954 | Recurrence |
| Cost of FN | TP Rate | FP Rate | Precision | Recall | F1 Score | ROC Area | PRC Area | MSE | Accuracy | Category |
|---|---|---|---|---|---|---|---|---|---|---|
| 1 | 0.853 | 0.095 | 0.899 | 0.853 | 0.875 | 0.952 | 0.945 | 0.176 | 0.879 | Non-Recurrence |
| 0.905 | 0.147 | 0.860 | 0.905 | 0.882 | 0.952 | 0.954 | Recurrence | |||
| 2 | 0.799 | 0.066 | 0.924 | 0.799 | 0.857 | 0.954 | 0.948 | 0.186 | 0.866 | Non-Recurrence |
| 0.934 | 0.201 | 0.823 | 0.934 | 0.875 | 0.954 | 0.955 | Recurrence | |||
| 3 | 0.743 | 0.058 | 0.928 | 0.743 | 0.825 | 0.953 | 0.947 | 0.199 | 0.842 | Non-Recurrence |
| 0.942 | 0.257 | 0.785 | 0.942 | 0.857 | 0.953 | 0.953 | Recurrence | |||
| 5 | 0.666 | 0.039 | 0.945 | 0.666 | 0.782 | 0.953 | 0.947 | 0.221 | 0.814 | Non-Recurrence |
| 0.961 | 0.334 | 0.742 | 0.961 | 0.838 | 0.953 | 0.954 | Recurrence |
Disclaimer/Publisher’s Note: The statements, opinions and data contained in all publications are solely those of the individual author(s) and contributor(s) and not of MDPI and/or the editor(s). MDPI and/or the editor(s) disclaim responsibility for any injury to people or property resulting from any ideas, methods, instructions or products referred to in the content. |
© 2024 by the authors. Licensee MDPI, Basel, Switzerland. This article is an open access article distributed under the terms and conditions of the Creative Commons Attribution (CC BY) license (https://creativecommons.org/licenses/by/4.0/).
Share and Cite
Chen, C.-C.; Ting, W.-C.; Lee, H.-C.; Chang, C.-C.; Lin, T.-C.; Yang, S.-F. A Cost-Effective Model for Predicting Recurrent Gastric Cancer Using Clinical Features. Diagnostics 2024, 14, 842. https://doi.org/10.3390/diagnostics14080842
Chen C-C, Ting W-C, Lee H-C, Chang C-C, Lin T-C, Yang S-F. A Cost-Effective Model for Predicting Recurrent Gastric Cancer Using Clinical Features. Diagnostics. 2024; 14(8):842. https://doi.org/10.3390/diagnostics14080842
Chicago/Turabian StyleChen, Chun-Chia, Wen-Chien Ting, Hsi-Chieh Lee, Chi-Chang Chang, Tsung-Chieh Lin, and Shun-Fa Yang. 2024. "A Cost-Effective Model for Predicting Recurrent Gastric Cancer Using Clinical Features" Diagnostics 14, no. 8: 842. https://doi.org/10.3390/diagnostics14080842