Article

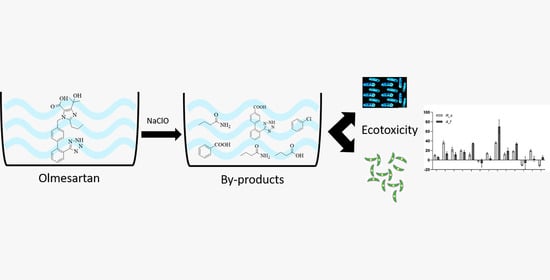
Complete Characterization of Degradation Byproducts of Olmesartan Acid, Degradation Pathway, and Ecotoxicity Assessment

1
Department of Chemical Sciences, University of Naples Federico II, 80126 Naples, Italy
2
Department of Biology, University of Naples Federico II, 80126 Naples, Italy
3
Associazione Italiana per la Promozione delle Ricerche su Ambiente e Salute umana, 82030 Dugenta, Italy
*
Author to whom correspondence should be addressed.
Appl. Sci. 2021, 11(12), 5393; https://doi.org/10.3390/app11125393
Submission received: 10 May 2021 / Revised: 7 June 2021 / Accepted: 8 June 2021 / Published: 10 June 2021

Abstract

:
Antihypertensive drugs are among the most prescribed drugs. Olmesartan acid, of the sartan class, belongs to a relatively new generation of antihypertensive drugs called angiotensin II receptor blockers. There are very few studies on the presence and fate of sartans in the environment, despite them being marketed in huge quantities, metabolized in low percentages, and detected in wastewater and water bodies. This paper presents a study on the less abundant and more polar fractions that have been neglected in previous studies, which led to the isolation by chromatographic methods of thirteen degradation byproducts (DPs), six of which are new, identified by nuclear magnetic resonance and mass spectrometry. A mechanism of degradation from the parent drug was proposed. The ecotoxicity of olmesartan acid and identified compounds was evaluated in Aliivibrio fischeri bacteria and Raphidocelis subcapitata algae to assess acute and chronic toxicity. For 75% of the DPs, acute and chronic exposure to the compounds, at concentrations of 5 mg/L, inhibited population growth in the algae and decreased bioluminescence in the bacteria.

Graphical Abstract

1. Introduction

Various analyses of wastewater show how the growth of the world’s population goes hand in hand with an increase in the concentration of organic micropollutants, such as perfluoroalkyl substances [1], cyanobacteria [2], mycotoxins [3], hormones [4], psychoactive substances [5], pesticides [6], cosmetics, and industrial additives and drugs [7,8,9], and demonstrate how this type of pollution reflects the increase in population growth [10,11]. Hence, there is a need to remove these pollutants present, especially in the most industrialized areas, from China to South Africa and from North and South America to Europe, wherever human activity presents significant developments [12,13]. The concentration of these pollutants, compared to traditional ones (conventional and unconventional), is much lower (on the order of ppm or ppb), and this characteristic has led to their classification as emerging contaminants (ECs) or persistent organic pollutants (POPs). There are no administrative regulations for environmental protection from this type of pollutant because its danger to the environment is not yet well understood. Despite the low concentrations, these are persistent and potentially toxic to microorganisms due to their complicated molecular structures, creating problems for the environment and humans. They can also be present in the water that is used to irrigate cultivation fields, even bringing the problem to the land and aquifers. Some have been identified in drinking water, consequently increasing the risk of these pollutants coming into contact with the human population [14]. Most of the pharmaceutical pollutants are introduced into the environment through people’s use of them who, failing to metabolize them completely, expel them into wastewater treatment processes that are not yet able to manage their removal. Other sources from which pharmaceutical pollutants come are hospitals, intensive livestock farming, and industrial waste [15]. The existing treatments used for the purification of wastewater do not currently guarantee the removal of ECs, which are degraded into less harmful compounds and only partially mineralized into inorganic substances. One of the ECs is olmesartan acid (OLM) [16], a hypertensive that is estimated to have an average daily consumption of almost 12 DDD per 1000 inhabitants (it was 3.7 in 2007), with a defined daily dose (DDD) value of 20 mg. In Italy alone, an expenditure of about EUR 150 million per year is estimated, almost five times more than the EUR 31 million in 2011 (it is among the top thirty active ingredients agreed upon for expenditure agreed by the national health system). It is marketed as olmesartan medoximil, the prodrug from which the active pharmaceutical is derived [17]. An excretion of 90% and a percentage of removal in wastewater treatment plants (WWTPs) not exceeding 20% are estimated for this drug. The simulation of the chlorination process in WWTP, which ensures the reduction of emerging pollutants, has allowed to study the degradation of OLM [18,19,20,21,22,23], leading to the isolation of nine degradation byproducts (DPs), eight of these are new (Figure 1) [24].
The aim of this work was to analyze the less abundant and more polar fractions that had been overlooked in previous studies, arriving at the determination of another 13 DPs, six of them isolated for the first time. All the DPs were identified by combining nuclear magnetic resonance (NMR) and mass spectrometry (MS), using matrix-assisted-laser desorption/ionization as a source and a time-of-flight analyzer (MALDI-TOF) for mass analysis. For all 22 isolated products, a formation mechanism has been proposed that integrates the one previously reported, having isolated and identified some products whose existence had only been hypothesized as possible intermediates. Finally, we evaluated the acute and chronic toxicities of OLM and its twelve DPs on organisms from two levels of the aquatic food chain, Aliivibrio fischeri bacteria and Raphidocelis subcapitata algae. Thus, it is now possible to have an almost complete picture of the environmental fate of a EC found in water bodies such as olmesartan, as a function of its intrinsic stability under the working conditions of a WWTP, of the by-products obtained and their environmental impact.

2. Materials and Methods

2.1. Drug and Reagents

The chemicals for toxicity assessment and olmesartan acid (99.5%) were of analytical grade and purchased from Sigma Aldrich (Milan, Italy). All the other chemicals and solvents were supplied by Fluka (Saint-Quentin Fallavier, France) and were of HPLC grade and used as received. Double-distilled water (Microtech, Naples, Italy) was used to prepare the dilution water and treatments.

2.2. Chlorination Reaction

2.2.1. Apparatus and Equipment

Column chromatography (CC) was accomplished on Kieselgel 60 (40–63 μm, Merck, Darmstadt, Germany). HPLC was performed on Shimadzu LC-8A system (Shimadzu, Milan, Italy). GC was achieved on a Shimadzu 2010 series GC FID (Shimadzu, Milano, Italy). The 1H- and 13C-NMR spectra were recorded with a 400 MHz NMR spectrometer (Bruker DRX, Bruker Avance) referenced in ppm to the residual solvent signals (CDCl3, at δH 7.27 and δC 77.0). Analysis of heteronuclear single-quantum coherence (HSQC), optimized for 1JHC = 155 Hz, and heteronuclear multiple bond coherence (HMBC), optimized for nJHC = 8 Hz, were used to measure the proton-detected heteronuclear correlations. The MALDI TOF mass spectrometric analyses were performed on a Voyager-De Pro MALDI mass-spectrometer (PerSeptive Biosystems, Framingham, MA, USA). The UV-Vis spectra were run on a Perkin Elmer Lambda 7 spectrophotometer. The IR spectra were run on a Jasco FT/IR-430 instrument equipped with a single reflection ATR accessory. pH was recorded on a WTW pH 7110 pH-meter (Xylem Analytics, Weilheim, Germany) equipped with a WTW SenTix41 electrode with temperature sensor.

2.2.2. Chlorination Experiments

The conditions used in a typical WWTP were simulated by treating a 10−5 M OLM solution with 10% hypochlorite (1:1 molar ratio of OLM/HClO by concentration, spectroscopically determined at λmax 292 nm, ε 350 dm3/mol cm) and 10−3 M OLM solutions with 10% hypochlorite (1:5 and 1:6 molar ratio of OLM/HClO by concentration, spectroscopically determined at λmax 292 nm, ε 350 dm3/mol cm) for 1 h at room temperature [25]. The presence of OLM was quantified using the UV-Vis spectrophotometer. The absorbance peaks were evaluated at 230 nm. Using standard solutions with known OLM concentrations it is possible to construct a calibration curve; then OLM concentrations were calculated from absorbance peaks by interpolating the points on the corresponding calibration curve. The pH of the solution is measured with the pH-meter; it passes from the initial value of 8.0 to the final value of 10.5. A small amount of the chlorinated solution was quenched by an excess of sodium thiosulphate, filtered, dried by lyophilization; then the residue was solubilized in a saturated sodium bicarbonate solution and extracted with ethyl acetate (EA). HPLC was used to monitor the course of the reaction. The main degradation byproducts (DP10–DP17 for the EA fraction and DP18–DP22 for the aqueous fraction (W); Scheme 1 and Figure 2) were identified by comparing them with commercial reference compounds, or isolated through preparative experiments with an OLM solution at concentration above 10−3 M, using 6% hypochlorite at room temperature for 2 h. The proposed mechanism of their formation and all other DPs previously isolated from the OLM is shown in Figure 3.

2.2.3. Chlorination Procedure and Product Isolation

Olmesartan acid (1 g, 2.24 mmol) was solubilized in 1.0 L of phosphate buffer (KH2PO4/K2HPO4 0.1 M) [26]. A sodium hypochlorite solution (about 6% active chlorine, molar ratio OLM/HClO 1:20; concentration spectroscopically determined at λmax of 292 nm, ε = 350 dm3/mol cm) was added drop by drop to this solution under magnetic stirring at room temperature. The phosphate buffer pH was adjusted to 6.50 by adding a 10% H3PO4 solution, checking with a pH-meter. Reaction was stopped after 2 h with an excess of sodium thiosulphate and concentrated by lyophilization. The residue was dissolved in water, pH is adjusted to 7.00, and this solution was extracted with ethyl acetate. The aqueous solution was subsequently extracted with n-butanol (B).
The crude EA fraction (579 mg) was chromatographed on silica gel CC, eluting with a gradient of methylene chloride:methanol:acetic acid (100:0:0.5 to 70:30:0.5, v/v/v) to yield sixteen fractions.
The fraction EA1 (26 mg), eluted with methylene chloride:methanol:acetic acid (100:0:0.5, v/v/v), was separated by semipreparative HPLC using a reversed phase column Kromasil 10 µm 100 Å C18 (250 × 10 mm) and eluting with a gradient of CH3COONH4 (A, pH 4.0; 10 mM) and methanol (B), starting with 85% B for 1 min and using a gradient up to 100% B in 25 min, at a solvent flow rate of 2 mL/min, to yield DP10 and DP11 (3.1 and 1.3 mg, respectively).
The fraction EA6 (76 mg), eluted with methylene chloride:methanol:acetic acid (95:5:0.5, v/v/v), was analyzed via preparative HPLC using a reversed-phase Gemini column of 10 μm C18 110 Å (250 × 21 mm), eluting with a gradient of CH3COONH4 (A, pH 4.0; 10 mM) and methanol (B), starting with 60% B for 1 min and using a gradient up to 100% B in 30 min at a solvent flow rate of 7.5 mL/min to get five subfractions. The subfraction EA6.1 (33 mg) was re-chromatographed by HPLC using a reversed-phase Kinetex column of 2.6 µm 100 Å C18 (100 × 4.6 mm), eluting with a gradient of CH3COONH4 (A, pH 4.0; 10 mM) and acetonitrile (B), starting with 40% B for 1 min and using a gradient up to 100% B in 30 min, at a solvent flow rate of 0.8 mL/min, to yield DP12, DP14, and DP17 (1.4, 1.1, and 13.4 mg, respectively). The subfraction EA6.2 (5 mg) was re-chromatographed by HPLC using a reversed-phase Kinetex column of 2.6 µm 100 Å C18 (100 × 4.6 mm), eluting with a gradient of CH3COONH4 (A, pH 4.0; 10 mM) and acetonitrile (B), starting with 50% B for 1 min and using a gradient up to 100% B in 30 min, at a solvent flow rate of 0.8 mL/min, to get DP15 (2.1 mg).
The fraction EA10 (51 mg), eluted with methylene chloride:methanol:acetic acid (85:15:0.5, v/v/v), was analyzed by semipreparative HPLC using a reversed-phase Kromasil column of 10 µm 100 Å C18 (250 × 10 mm) and eluting with a gradient of CH3COONH4 (A, pH 4.0; 10 mM) and methanol (B), starting with 35% B for 1 min and using a gradient up to 100% B in 20 min, at a solvent flow rate of 4 mL/min, to yield four subfractions. The subfractions EA10.1 (7 mg) was re-chromatographed by HPLC using a reversed-phase Kinetex column of 2.6 µm 100 Å C18 (100 × 4.6 mm) and eluting with a gradient of acetic acid:acetonitrile (A, 1:99, v/v) and acetic acid:water (B, 1:99, v/v), starting with 75% B for 3 min and installing a gradient to obtain 100% A over 35 min and returning to 75% B for 10 min, at a solvent flow rate of 0.8 mL/min. It contained DP13 (3.2 mg). The subfractions EA10.4 (16 mg) was re-chromatographed by HPLC using a reversed-phase Kinetex column of 2.6 µm 100 Å C18 (100 × 4.6 mm) and eluting with a gradient of acetic acid:acetonitrile (A, 1:99, v/v) and acetic acid:water (B, 1:99, v/v), starting with 60% B for 5 min and using a gradient up to 100% A in 20 min and returning to 60% B for 10 min, at a solvent flow rate of 1.0 mL/min. It contained DP16 (12.2 mg).
The fraction obtained by extraction with n-butanol (B, 635 mg) was again fractioned by silica gel CC, using a gradient of ethyl acetate:methanol, to give six fractions. The B5 fraction (12 mg), eluted with ethyl acetate:methanol (50:50, v/v), was dried, solubilized in water:ethanol (50:50, v/v), and analyzed using a Shimadzu 2010 series GC FID (Shimadzu, Milano, Italy). The gas chromatograph was equipped with Zebron ZB-5 column (30 m × 0.32 mm I. D., 1.00 µm; Phenomenex, Bologna, Italy). The following parameters were set during the experiments: helium as a carrier gas with constant flow of 1.2 mL/min, 1.0 μL injected into samples with a 20:1 split, and introduced into the injector at 250 °C using an AOC-20i auto sampler (Shimadzu, Milano, Italy). The initial temperature was 60 °C, then rose with a 4 °C/min ramp to 200 °C with a 5 min hold. The identification of DP18 and DP19 was fulfilled by comparison with available standard compound.
The aqueous fraction (W, 711 mg) was dried by lyophilization, re-dissolved in methanol and separated with CC silica gel by running an ethyl acetate:methanol gradient (100:0 to 0:100, v/v) to get eight fractions.
The fraction W2 (155 mg), eluted with ethyl acetate:methanol (60:40, v/v), was filtered on reversed phase silica gel CC with water, methanol, and acetonitrile. The fraction eluted with acetonitrile (6 mg) was analyzed by NMR and contained DP20.
The fraction W7 (187 mg), eluted with ethyl acetate:methanol (50:50, v/v), was chromatographed on a reversed phase Sep-Pak RP-18 with a gradient of acetic acid 1%:acetonitrile (100:0 to 0:100 v/v). The fraction eluted with acetic acid 1% was concentrated by lyophilization (31 mg), analyzed by HPLC using a reversed-phase Luna column of 5 µm C8(2) 100 Å (150 × 4.6 mm), and eluted with an isocratic solution of KH2PO4 (pH 2.6, 20 mM):acetonitrile (75:25 v/v) at a solvent flow rate of 1 mL/min. It contained DP21, as evidenced by the RT comparison with a standard compound and NMR spectra. The fraction eluted with acetonitrile was analyzed by HPLC using a reversed-phase Luna column of 5 µm Phenyl-Hexyl 100 Å (150 × 4.6 mm) and eluting with water (A) and acetonitrile (B), starting with 40% B for 10 min and later obtaining 55% B over 10 min, at a solvent flow rate of 1.2 mL/min. It contained DP22, as evidenced by the RT comparison with a standard compound and NMR spectra.

2.3. Spectral Data

DP10: 2-(1-((2′-(2H-Tetrazol-5-yl)-[1,1′-biphenyl]-4-yl)methyl)-5-chloro-2-propyl-1H-imi dazol-4-yl) propan-2-ol. White powder. 1H- and 13C-NMR: see Table S1. MS-TOF (positive ions): m/z calculated for C23H25ClN6O2 m/z 436.18 [M] +; found 439.22 [M + 2 + H]+ (30%), 438.19 [M + 1 + H]+ (23%), 437.19 [M + H]+ (90%).
DP11: N-((2′-(2H-Tetrazol-5-yl)-[1,1′-biphenyl]-4-yl)methyl)butyramide. 1H- and 13C-NMR: see Table S2. MS-TOF (positive ions): m/z calculated for C18H19N5O m/z 321.16 [M] +; found 322.18 [M + H]+ (58%), 252.17 [M–COCH2CH2CH3 + H]+ (30%).
DP12: N-((2′-(2H-Tetrazol-5-yl)-[1,1′-biphenyl]-4-yl)methyl)-2-hydroxybutanamide. 1H- and 13C- NMR: see Table S3. MS-TOF (positive ions): m/z calculated for C18H19N5O2 m/z 337.15 [M] +; found 338.17 [M + H]+ (51%), 319.16 [M–H2O]+ (15%).
DP13: ((2′-(2H-Tetrazol-5-yl)-[1,1′-biphenyl]-4-yl)methyl)(acetyl)carbamic acid. 1H- and 13C-NMR: see Table S4. MS-TOF (positive ions): m/z calculated for C17H15N5O3 m/z 337.15 [M] +; found 338.16 [M + H]+ (29%), 294.17 [M–CO2 + H]+ (11%).
DP14: N-((2′-(2H-Tetrazol-5-yl)-[1,1′-biphenyl]-4-yl)methyl)acetamide. 1H- and 13C-NMR: see Table S5. MS-TOF (positive ions): m/z calculated for C16H15N5O m/z 293.13 [M] +; found m/z 294.14 [M + H]+ (55%); 250 [M–CO2 + H]+ (22%).
DP15: N-((2′-(2H-Tetrazol-5-yl)-[1,1′-biphenyl]-4-yl)methyl)hydroxylamine. 1H- and 13C-NMR: see Table S6. MS-TOF (positive ions): m/z calculated for C14H13N5O m/z 267.11 [M] +; found m/z 268.12 [M + H]+ (29%).
DP16: 2′-(2H-Tetrazol-5-yl)-[1,1′-biphenyl]-4-carboxylic acid. NMR spectra were in agreement with data reported in the literature [27].
DP17: (2′-(2H-Tetrazol-5-yl)-[1,1′-biphenyl]-4-yl)methanamine. NMR spectra were in agreement with data reported in the literature [28].
DP18: Butyric acid. White powder. NMR spectra conform to data recorded for the available standard.
DP19: Butyramide. White liquid. Chemical-physical properties conforming to data recorded for the available standard.
DP20: Butyronitrile. White liquid. Chemical-physical properties conforming to data recorded for the available standard.
DP21: Chlorobenzene. White liquid. Chemical-physical properties conforming to data recorded for the available standard.
DP22: Benzoic acid. White solid. Chemical-physical properties conforming to data recorded for the available standard.

2.4. Toxicity Tests

Toxicity tests were performed on OLM and its DPs were isolated from chlorination experiments at initial concentrations of 5 mg/L. Acute toxicity was carried out on A. fischeri (NRRLB-11177) bacterium supplied by MicroBioTest, Belgium, according to ISO 11348-3:2007. The biolumiscence inhibition test was performed as previously described [24]. OLM and its DPs were tested in three replicates, and the inhibitory effect was measured after 30 min of exposure. Chronic toxicity tests were carried out on R. subcapitata and were performed in 24-well microplates according to Gallo et al. [29]. The algal inoculum was taken from an exponentially growing culture according to ISO 8692 [30], and it was added to OLM and its DPs to reach a final algal concentration of 104 cells/mL. Compounds were tested in three replicates. The algal growth was measured after 72 h at 670 nm (HachLange DR 5000). The acute and chronic results were processed using Prism 8 (GraphPad Inc., Version 8.4.2, San Diego, CA, USA) and analyzed statistically using ANOVA and the Tukey post hoc test, with p < 0.05 considered to be significantly different.

3. Results and Discussion

3.1. Chlorination Experiments

The OLM chlorination experiments were performed by mimicking the conditions of a typical WWTP. A 10−5 M solution of the drug was treated for 1 h with 10% hypochlorite (OLM:hypochlorite molar ratio of 1:1; concn.) at room temperature [31,32]. Then, the OLM chlorination experiments were repeated by treating 10−3 M with a much lower ratio of OLM:oxidizing agent (1:5 or 1:6) so as to ensure the degradation of the studied contaminant and the possibility of isolating sufficient quantities of degradation byproducts for their subsequent structural identification. The course of the reaction was monitored by HPLC, and the DPs obtained were isolated by column chromatography, HPLC, and GC (Scheme 1) and completely characterized using NMR (see Supplementary Materials) and MS analyses. DP10‒DP17 were isolated in relative percentages of 0.31, 0.13, 0.14, 0.32, 0.11, 0.21, 1.22, and 1.34, respectively. The proposed mechanism of their formation from OLM is displayed in Figure 3. DP10–DP15 were isolated for the first time. The quantity of OLM recovered after chromatography of the initial extract of the chlorinated solution and its identification by comparison with an authentic commercial sample allowed to evaluate a percentage of mineralization around 59% under the specified conditions, while the formation of DPs is around 20%.

3.2. Structure Elucidation of Degradation Byproducts DP1–DP22

In the OLM treatment at the buffered pH, the concentration of DP10–DP17 was at a maximum after 1 h, in the range of 1.34 to 0.11%, while that of DP18–DP22 was at a maximum after 2.5 h. The possible mechanisms underlying the formation of OLM by products is shown in Figure 3. OLM can undergo the imidazole ring opening reaction with the cleavage of the N19-C23 and C20-N21 bonds, obtaining the DP11 product. This could undergo an oxidation to the carbon of the side chain (which, in the starting product, was indicated as carbon C-24), producing the DP12 product. Luongo et al. [24] hypothesized that DP11 and DP12 could be two intermediates, which, through a third intermediate I15, would lead to the degradation of DP8 byproducts. From this, then, by reductive decarboxylation, the obtaining of the DP15 product is justified, which would then provide DP16 by deamination of the side chain and oxidation of the C-18 carbon to a carboxyl group. From DP12, it is easy to justify the formation of DP17 by hydrolysis of the N19-C20 bond. The degradation of the DP17 byproduct by oxidation would give DP15 by acetylation of DP14 and by subsequent oxidation of this, the DP13 product. Finally, the DP18–DP22 products are degradation products that can be justified in different ways and that constitute the step preceding the complete mineralization of the starting product.

3.3. Ecotoxicity Data

The inhibition effects on the bioluminescence of A. fischeri and on the growth of R. subcapitata were measured in this section for characterizing the acute and chronic toxicity of DPs at concentrations of 5 mg/L. Figure 4 shows the comparison of the effects of DPs.
Only in three DPs (DP14, DP20, and DP22) in R. subcapitata and two DPs in A. fischeri (DP14 and DP20) the stimulation was observed, showing no toxic effects. However, in 75% of the DPs investigated, the negative effects increased compared to the parent compound (OLM). In particular, the bioluminescence inhibition of the A. fischeri in DP16 exceeded 70%. The acute toxicity in each DPs followed the order of DP14 > DP20 > DP21 > DP15 > DP22 > DP11 > DP10 > DP12 > DP18 > DP19 > DP13 > DP16, while the chronic toxicity in each DPs followed the order of DP22 > DP20 > DP14 > DP13 > DP18 > DP15 > DP19 > DP12 > DP21 > DP11 > DP10 > DP16. Considering the overall toxicity, these results demonstrate that higher inhibitory values, especially for A. fischeri, were achieved for DP16, while lower inhibitory values were achieved for DP20. Thus, as a strong oxidant, sodium hypochlorite could decompose non-toxic OLM into small molecules, increasing the toxicity of the compound. Although the concentrations investigated and capable of exerting toxic effects may be higher than the environmental concentrations, the possible problems due to continued exposure, which can occur through contact with water and through the food chain, should not be underestimated.

4. Conclusions

This paper investigated the less abundant and more polar fractions of OLM following degradation treatment by chlorination that had been neglected in a previous study and were purified by column chromatography, HPLC, and GC. This made it possible to identify thirteen products, of which six were new, in addition to the nine already reported in the literature. OLM underwent complete mineralization in about 59% of cases, and in 21% of cases was recovered as is. OLM transformed into the corresponding byproducts in 20% of cases, and about 14% of these were identified. A possible pathway for OLM degradation and byproducts formation has been hypothesized. A total of 75% of the investigated DPs possessed anywhere from weak to high toxicity; the remaining DPs presented no such effects. Furthermore, the order of chronic and acute toxicity showed that the products disinfected with sodium hypochlorite showed the highest inhibition rates for algae.

Supplementary Materials

1H and 13CNMR data of DP10–DP15 are available online at https://mdpi.longhoe.net/article/10.3390/app11125393/s1 in Tables S1–S6.

Author Contributions

G.L. (Giovanni Luongo) performed the chlorination experiments; M.G., A.S., G.L. (Giovanni Libralato) and L.S. performed the acute and chronic toxicity tests; L.P. and G.D.F. were responsible for supervision, writing, review, and editing; A.Z. designed the research study and was responsible for supervision, original draft preparation, and writing the final version of manuscript. All authors have read and agreed to the published version of the manuscript.

Funding

This research received no external funding.

Institutional Review Board Statement

Not applicable.

Informed Consent Statement

Not applicable.

Data Availability Statement

Not applicable.

Acknowledgments

We acknowledge AIPRAS Onlus (Associazione Italiana per la Promozione delle Ricerche sull’Ambiente e la Saluta umana) for grants in support of this investigation.

Conflicts of Interest

The authors declare no conflict of interest.

References

  1. Ahrens, L.; Bundschuh, M. Fate and effects of poly- and perfluoroalkyl substances in the aquatic environment: A review. Environ. Toxicol. Chem. 2014, 33, 1921–1929. [Google Scholar] [CrossRef]
  2. Bláha, L.; Babica, P.; Maršálek, B. Toxins produced in cyanobacterial water blooms—Toxicity and risks. Interdiscip. Toxicol. 2009, 2, 36–41. [Google Scholar] [CrossRef] [Green Version]
  3. Mata, A.T.; Ferreira, J.P.; Oliveira, B.R.; Batoréu, M.C.; Crespo, M.T.B.; Pereira, V.J.; Bronze, M.R. Bottled water: Analysis of mycotoxins by LC–MS/MS. Food Chem. 2015, 176, 455–464. [Google Scholar] [CrossRef]
  4. Gonsioroski, A.; Mourikes, V.E.; Flaws, J.A. Endocrine Disruptors in Water and Their Effects on the Reproductive System. Int. J. Mol. Sci. 2020, 21, 1929. [Google Scholar] [CrossRef] [Green Version]
  5. Ebele, A.J.; Abdallah, M.A.-E.; Harrad, S. Pharmaceuticals and personal care products (PPCPs) in the freshwater aquatic environment. Emerg. Contam. 2017, 3, 1–16. [Google Scholar] [CrossRef]
  6. Calderón-Preciado, D.; Matamoros, V.; Bayona, J.M. Occurrence and potential crop uptake of emerging contaminants and related compounds in an agricultural irrigation network. Sci. Total. Environ. 2011, 412, 14–19. [Google Scholar] [CrossRef] [PubMed]
  7. Abidemi, B.L.; James, O.A.; Oluwatosin, A.T.; Akinropo, O.J.; Oraeloka, U.D.; Racheal, A.E. Treatment technologies for wastewater from cosmetic industry—A review. Int. J. Chem. Biomol. 2018, 4, 69–80. [Google Scholar]
  8. Fonseca, V.F.; Duarte, I.A.; Duarte, B.; Freitas, A.; Pouca, A.S.V.; Barbosa, J.; Gillanders, B.M.; Reis-Santos, P. Environmental risk assessment and bioaccumulation of pharmaceuticals in a large urbanized estuary. Sci. Total. Environ. 2021, 783, 147021. [Google Scholar] [CrossRef] [PubMed]
  9. Mijangos, L.; Ziarrusta, H.; Ros, O.; Kortazar, L.; Fernández, L.A.; Olivares, M.; Zuloaga, O.; Prieto, A.; Etxebarria, N. Occurrence of emerging pollutants in estuaries of the Basque Country: Analysis of sources and distribution, and assessment of the environmental risk. Water Res. 2018, 147, 152–163. [Google Scholar] [CrossRef]
  10. Burns, E.E.; Carter, L.J.; Kolpin, D.W.; Thomas-Oates, J.; Boxall, A.B. Temporal and spatial variation in pharmaceutical concentrations in an urban river system. Water Res. 2018, 137, 72–85. [Google Scholar] [CrossRef]
  11. Lesser, L.E.; Mora, A.; Moreau, C.; Mahlknecht, J.; Hernández-Antonio, A.; Ramírez, A.I.; Barrios-Piña, H. Survey of 218 organic contaminants in groundwater derived from the world’s largest untreated wastewater irrigation system: Mezquital Valley, Mexico. Chemosphere 2018, 198, 510–521. [Google Scholar] [CrossRef]
  12. Ma, R.; Wang, B.; Yin, L.; Zhang, Y.; Deng, S.; Huang, J.; Wang, Y.; Yu, G. Characterization of pharmaceutically active compounds in Bei**g, China: Occurrence pattern, spatiotemporal distribution and its environmental implication. J. Hazard. Mater. 2017, 323, 147–155. [Google Scholar] [CrossRef]
  13. Verhaert, V.; Newmark, N.; D’Hollander, W.; Covaci, A.; Vlok, W.; Wepener, V.; Addo-Bediako, A.; Jooste, A.; Teuchies, J.; Blust, R.; et al. Persistent organic pollutants in the Olifants River Basin, South Africa: Bioaccumulation and trophic transfer through a subtropical aquatic food web. Sci. Total. Environ. 2017, 586, 792–806. [Google Scholar] [CrossRef]
  14. Luo, Y.; Guo, W.; Ngo, H.H.; Nghiem, L.D.; Hai, F.I.; Zhang, J.; Liang, S.; Wang, X.C. A review on the occurrence of micropollutants in the aquatic environment and their fate and removal during wastewater treatment. Sci. Total. Environ. 2014, 473, 619–641. [Google Scholar] [CrossRef]
  15. De la Cruz, N.; Esquius, L.; Grandjean, D.; Magnet, A.; Tungler, A.; de Alencastro, L.F.; Pulgarín, C. Degradation of emergent contaminants by UV, UV/H2O2 and neutral photo-Fenton at pilot scale in a domestic wastewater treatment plant. Water Res. 2013, 47, 5836–5845. [Google Scholar] [CrossRef] [PubMed]
  16. Bayer, A.; Asner, R.; Schüssler, W.; Kopf, W.; Weiß, K.; Sengl, M.; Letzel, M. Behavior of sartans (antihypertensive drugs) in wastewater treatment plants, their occurrence and risk for the aquatic environment. Environ. Sci. Pollut. Res. 2014, 21, 10830–10839. [Google Scholar] [CrossRef] [PubMed]
  17. Schwabe, U.; Paffrath, D. Report on Pharmaceutical Prescriptions; Springer: Berlin, Germany, 2013. (In German) [Google Scholar]
  18. Zarrelli, A.; della Greca, M.; Iesce, M.R.; Lavorgna, M.; Temussi, F.; Schiavone, L.; Criscuolo, E.; Parrella, A.; Previtera, L.; Isidori, M. Ecotoxicological evaluation of caffeine and its derivatives from a simulated chlorination step. Sci. Total. Environ. 2014, 470, 453–458. [Google Scholar] [CrossRef] [PubMed] [Green Version]
  19. Chusaksri, S.; Sutthivaiyakit, S.; Sedlak, D.L.; Sutthivaiyakit, P. Reactions of phenylurea compounds with aqueous chlorine: Implications for herbicide transformation during drinking water degradation. J. Hazard. Mater. 2012, 209, 484–491. [Google Scholar] [CrossRef]
  20. Romanucci, V.; Siciliano, A.; Guida, M.; Libralato, G.; Saviano, L.; Luongo, G.; Previtera, L.; di Fabio, G.; Zarrelli, A. Disinfection by-products and ecotoxic risk associated with hypochlorite treatment of irbesartan. Sci. Total. Environ. 2020, 712, 135625. [Google Scholar] [CrossRef] [PubMed]
  21. Sandin-España, P.; Magrans, J.O.; García-Baudín, J.M. Study of Clethodim Degradation and By-Product Formation in Chlorinated Water by HPLC. Chromatography 2005, 62, 133–137. [Google Scholar] [CrossRef]
  22. Luongo, G.; Previtera, L.; Ladhari, A.; di Fabio, G.; Zarrelli, A. Peracetic Acid vs. Sodium Hypochlorite: Degradation and Transformation of Drugs in Wastewater. Molecules 2020, 25, 2294. [Google Scholar] [CrossRef] [PubMed]
  23. Luongo, G.; Guida, M.; Siciliano, A.; Libralato, G.; Saviano, L.; Amoresano, A.; Previtera, L.; di Fabio, G.; Zarrelli, A. Oxidation of diclofenac in water by sodium hypochlorite: Identification of new degradation by-products and their ecotoxicological evaluation. J. Pharm. Biomed. Anal. 2021, 194, 113762. [Google Scholar] [CrossRef] [PubMed]
  24. Luongo, G.; Siciliano, A.; Libralato, G.; Serafini, S.; Saviano, L.; Previtera, L.; di Fabio, G.; Zarrelli, A. LC and NMR Studies for Identification and Characterization of Degradation Byproducts of Olmesartan Acid, Elucidation of Their Degradation Pathway and Ecotoxicity Assessment. Molecules 2021, 26, 1769. [Google Scholar] [CrossRef] [PubMed]
  25. Bedner, M.; MacCrehan, W.A. Transformation of Acetaminophen by Chlorination Produces the Toxicants 1,4-Benzoquinone and N-Acetyl-p-benzoquinone Imine. Environ. Sci. Technol. 2006, 40, 516–522. [Google Scholar] [CrossRef]
  26. Carpinteiro, I.; Castro, G.; Rodríguez, I.; Cela, R. Free chlorine reactions of angiotensin II receptor antagonists: Kinetics study, transformation products elucidation and in-silico ecotoxicity assessment. Sci. Total. Environ. 2019, 647, 1000–1010. [Google Scholar] [CrossRef]
  27. Nödler, K.; Hillebrand, O.; Idzik, K.; Strathmann, M.; Schiperski, F.; Zirlewagen, J.; Licha, T. Occurrence and fate of the angiotensin II receptor antagonist transformation product valsartan acid in the water cycle—A comparative study with selected β-blockers and the persistent anthropogenic wastewater indicators carbamazepine and acesulfame. Water Res. 2013, 47, 6650–6659. [Google Scholar] [CrossRef]
  28. Mutha, V.A.K.; Guduru, S.; Kaliyaperumal, M.; Rumalla, C.S.; Maddi, S.R.; Korupolu, R.B.; Gajbhiye, S.B. Disinfection study of irbesartan: Isolation and structural elucidation of novel degradants. J. Pharm. Biomed. Anal. 2018, 157, 180–188. [Google Scholar] [CrossRef]
  29. Gallo, A.; Guida, M.; Armiento, G.; Siciliano, A.; Mormile, N.; Carraturo, F.; Pellegrini, D.; Morroni, L.; Tosti, E.; Ferrante, M.; et al. Species-specific sensitivity of three microalgae to sediment elutriates. Mar. Environ. Res. 2020, 156, 104901. [Google Scholar] [CrossRef]
  30. ISO. Water Quality—Fresh Water Algal Growth Inhibition Test with Unicellular Green Algae; ISO: Geneva, Switzerland, 2012; ISO 8692. [Google Scholar]
  31. Romanucci, V.; Siciliano, A.; Galdiero, E.; Guida, M.; Luongo, G.; Liguori, R.; di Fabio, G.; Previtera, L.; Zarrelli, A. Degradation by-Products and Ecotoxic Risk Associated with Hypochlorite Treatment of Tramadol. Molecules 2019, 24, 693. [Google Scholar] [CrossRef] [Green Version]
  32. Zarrelli, A.; della Greca, M.; Parolisi, A.; Iesce, M.R.; Cermola, F.; Temussi, F.; Isidori, M.; Lavorgna, M.; Passananti, M.; Previtera, L. Chemical fate and genotoxic risk associated with hypochlorite treatment of nicotine. Sci. Total. Environ. 2012, 426, 132–138. [Google Scholar] [CrossRef] [Green Version]
Figure 1. Olmesartan acid and the already known breakdown products.
Applsci 11 05393 g001
Figure 2. Chemical structures of olmesartan acid and its degradation byproducts DP10–DP22.
Applsci 11 05393 g002
Figure 3. The plausible mechanism for the formation of DP1–DP17.
Applsci 11 05393 g003
Scheme 1. The isolation of all identified compounds (DP1–DP22).
Applsci 11 05393 sch001
Figure 4. The comparison of the effects of DPs on the bioluminescence of A. fischeri (A_f) and on the inhibition of growth rates of R. subcapitata (R_s). Groups with the same letter were not significantly different (Tukey post hoc, p < 0.05).
Applsci 11 05393 g004
Publisher’s Note: MDPI stays neutral with regard to jurisdictional claims in published maps and institutional affiliations.

